Article

Use of Biomass as Alternative Fuel in Magnesia Sector

by
Nikolaos Margaritis
1,
Christos Evaggelou
1,
Panagiotis Grammelis
1,*,
Haris Yiannoulakis
2,
Polykarpos Papageorgiou
3,
Stefan Puschnigg
4 and
Johannes Lindorfer
4
1
Center for Research and Technology Hellas/Chemical Process and Energy Resources Institute (CERTH/CPERI), 4 km N.R Ptolemaidas-Mpodosakeiou Hospital Area, 50200 Ptolemaida, Greece
2
Research and Development Center, Grecian Magnesite S.A., Vassilika, 57006 Thessaloniki, Greece
3
Yerakini Mines and Works, Grecian Magnesite S.A. (GM), 63100 Polygyros, Greece
4
Energieinstitut an der Johannes Kepler Universität Linz, Altenberger Strasse 69, 4040 Linz, Austria
*
Author to whom correspondence should be addressed.
Fuels 2022, 3(4), 642-666; https://doi.org/10.3390/fuels3040039
Submission received: 23 July 2022 / Revised: 19 August 2022 / Accepted: 2 November 2022 / Published: 9 November 2022
(This article belongs to the Special Issue Emerging Sustainable Technologies in Biofuel Production)

Abstract

:
The European Union has started a progressive decarbonization pathway with the aim to become carbon neutral by 2050. Energy-intensive industries (EEIs) are expected to play an important role in this transition as they represent 24% of the final energy consumption. To stay competitive as EEI, a clear and consistent long-term strategy is required. In the magnesia sector, an essential portion of CO2 emissions result from solid fossil fuels (MgCO3, pet coke) during the production process. This study concerns the partial substitution of fossil fuels with biomass to reduce carbon emissions. An experimental campaign is conducted by implementing a new low-NOx burner at the magnesia plant of Grecian Magnesite (GM). Life cycle assessment (LCA) is performed to quantify the carbon reduction potential of various biomass mixtures. The experimental analysis revealed that even with a 100% pet coke feed of the new NOx burner, NOx emissions are decreased by 41%, while the emissions of CO and SOx increase slightly. By applying a biomass/pet coke mixture as fuel input, where 50% of the required energy input results from biomass, a further 21% of NOx emission reduction is achieved. In this case, SOx and CO emissions are additionally reduced by 50% and 13%, respectively. LCA results confirmed the sustainable impact of applying biomass. Carbon emissions could be significantly decreased by 32.5% for CCM products to 1.51 ton of CO2eq and by 38.2% for DBM products to 1.64 ton of CO2eq per ton of MgO in a best case scenario. Since the calcination of MgCO3 releases an essential and unavoidable amount of CO2 naturally bound in the mineral, biomass usage as a fuel is a promising way to become sustainable and resilient against future increased CO2 prices.

Graphical Abstract

1. Introduction

In the last decades, there has been an alarming increase in energy consumption worldwide. Within only the 20 years from 1995 to 2015 the increase exceeded 50%, from 8588.9 million tons oil equivalent (Mtoe) in 1995 to 13,147.3 Mtoe [1] in 2015. Energy-intensive industries (EIIs) are one of the top energy consumers with a global share of 24%. Of this, up to 80% is met with fossil fuels and their associated energy systems. Current energy systems rely in general on burning fossil fuels, which are not renewable; they are distributed worldwide and are critically unsustainable to deliver [2]. Most of the CO2 emissions that cause global warming derive from solid fuel combustion [3]. In 2016, 32.3 Gtn of CO2 emissions resulted from solid fuel combustion. The industrial sector is responsible for 19% of these emissions [4,5]. A study from the International Energy Agency (IEA) [6] showed that fossil fuels that can cause environmental issues when combusted, such as air pollution and climate change, still play a major role in energy sources globally. CO2 emissions increased from 20.9 Gtn in 1990 to 28.8 Gtn in 2007 and are expected to rise to 40.2 Gtn in 2030, with an average yearly increase rate of 1.5% over the projection period [5].
It is believed that replacing fossil fuels with biomass fractions in the fuel feed for combustion will lower the overall unwanted major emissions from power facilities as biomass fuels present lower amounts of some elements, such as sulfur. The European Union (EU) has started a progressive decarbonization with the aim to become carbon neutral by 2050. EIIs are expected to play an important role in this transition. Biomass will continue to have an important role in the EU energy mix as it is important among renewable sources, covering approximately 5% of the primary energy supply of the EU-27 [4]. Emissions of complete combustion in biomass applications include CO2, NOx, N2O, SOx, HCl, and heavy metals, while emissions of incomplete combustion include CO and unwanted organic compounds, among others; particle emissions can be the result of both complete and incomplete combustion [7]. Combustion of most biomass materials is known to result in lower emissions of SOx, and NOx, as biomass sulfur and nitrogen contents are low compared to fossil fuels; alkali-based compounds also have a retention effect on sulfur, resulting in an additional incremental reduction [8]. On the other hand, co-firing of different biomass fuels and fossil fuel usually does not lead to reduced sulfur emissions because inherently existing potassium chloride has a higher reactivity with aluminum silicates than sulfur compounds [9]. In most biomass materials, a significant amount of submicron fumes and vapor material can be formed in the flame that can pose a challenge to particulate emissions abatement equipment. This may lead to lower collection efficiencies and increased particulate emissions from the stack, which is likely a highly site-specific occurrence of interest in retrofit projects.
A very interesting study by Monika Zajemska et al. [10] presents the emissions of gaseous pollutants from the co-firing of sunflower husk pellets according to metrological processes but also through a simulation program. The calculated concentration of sulfur dioxide in the flue gas was higher by about 200 ppm from measured concentration (355 ppm) and reached a value of 588 ppm. Higher levels were also observed for nitric oxide although not as large as in the case of SO2; namely, the calculated concentration reached a value of 192 ppm, and the measured concentration was equal to 162 ppm.
It is noted that there is renewed interest in many industrial countries in biomass combustion as a result of environmental and climate change concerns and because of energy security supplies in a world where fossil fuels are concentrated in a few countries and resources are finite. In addition, biomass combustion leads to reduction of net carbon dioxide (CO2) and to better waste management, mainly due to the CO2 neutrality and large availability of biomass [11]. Biomass combustion or co-combustion with fossil fuels can significantly reduce CO2 emissions from energy production. It is asserted that although biomass has the advantage of CO2 neutrality, or nearly so, there are potential problems concerning the environment, such as NOx and CO emissions, noted as the most considerable gaseous pollutants during biomass combustion [12,13].
The several economic and environmental advantages of biomass combustion are offset by its major disadvantage, which is its low energy potential, especially compared to fossil fuels [14]. It is therefore quite difficult to meet the large amounts of energy required, mainly in industry, by biomass combustion. This is the main reason why biomass/fossil fuel co-firing technology has been developed and largely implemented worldwide. The co-firing of biomass with fossil fuels is a flexible and easily applicable treatment. No specialized burners are required as the biomass can be burned in all types of kilns without creating technical problems, while, depending on the energy requirements, the percentage of fossil fuels that the biomass replaces may vary. The technology of co-firing has been tested in various sectors for several years, but a great growth has been presented in the field of electricity generation, where it is now an extremely efficient process. At the beginning of the second decade of the 21st century, more than 220 power plants were put into operation with biomass co-firing technology. The majority of these power plants are located in Europe and mainly in the Nordic countries, where in Finland alone there are more than 70 units and in Sweden 15 units [15].
In the United Kingdom, co-firing was not commercially productive until 2002. Producing 286 GWh in 2002, co-firing only accounted for 2.57% of the renewable electricity generation. However, co-firing rates nearly doubled every year until 2005. Producing 2533 GW h in 2005, co-firing accounted for 14.95% of the renewable electricity generation in the UK. Co-firing production remained level in 2006, but in the following years (2007–2009) co-firing production decreased steadily to 1625 GWh. However, in 2010 and 2011, co-firing production increased to a high of 2964 GWh. [16] Another example is the city of Aarhus in Denmark, where there are two stations with a production of 150 and 350 MWe [17]. The main fuel used is pulverized coal, and straw replaces 20%. At the same time, in the Netherlands, a wider effort has been made to develop the technology as several units operate in different cities with a capacity of 400 to 600 MWe [13,14]. The substitution rate varies; however, it moves at low levels between 4% and 8%. An important element is the type of biomass used; in addition to solid biomass, pellets, husk, and wood biomass are used. Finally, Poland is a country where biomass co-firing has been greatly developed [13,14]. There are three large plants, of which two have a capacity of 1800 MWe and a third has a capacity of 590 MWe. The replacement rate is 10%, and they mainly use sawdust, chips, and coffee shells.
Outside of Europe, there is a great growth in North America as well, with the most characteristic example being the city of Ontario in Canada, where there are seven power plants with a capacity of 150 to 500 MWe, where different types of biomass are used, mainly wood pellets, agricultural residues, and grain screening [18].
As already mentioned, various types of biomass have been tested in co-firing applications. Forest and agricultural residues, wood biomass, solid and waste biomass, and wood pellets are the most common types of biomass used in co-firing applications. In addition, husk, grains, plant biomass, wood chips, and olive kernels are combustible biomass materials that are tested and can be more efficient if they first undergo upgrade processes such as torrefaction [19]. It should be noted that there are other biomass materials such as hazelnut shells [20], fruit pellets [21], lignocellulosic plants, and algae biomass that are most effective when used in gasification processes [22,23].The main criteria for selecting a type of biomass is its price and its availability. For example, the Nordic countries use forest biomass as large areas of forest cover their spatial boundaries, while in many industrial areas, waste biomass is used as there are large amounts of industrial waste. Low availability and high costs are the main reasons that sunflower husk pellets are not widely used. However, they have been tested in the laboratory mainly to test their effectiveness and possible problems that their use as a fuel can create [24,25,26].
It is well known that cement industries are using waste-based biomass (RDF, used tires, sludge, etc.) as alternative fuels in rotary kilns, mostly for clinker production. In Heidelberg cement, the waste-based biomass used, which accounted for around 42% of the alternative fuel mix in 2021, makes a special contribution as it is considered climate-neutral under European legislation [27]. Additionally, LafargeHolcim [28], through a circular approach, wants to reduce the carbon intensity of its cement by substituting fossil fuels with pre-treated non-recyclable and biomass waste fuels to operate its cement kilns. Currently they aim to increase thermal substitution of biomass from 20.9% to 37% by 2030.
Of course, co-firing conditions found in the cement or lime industry cannot be compared to the conditions realized in GM and in magnesia sector in general due to the type of fuels (usually in the cement industry are preferred low cost fuels such as RDF, sludge, and others) and level of temperatures (lower temperatures are anticipated in comparison with GMs in cases where a range from 1100 to 1900 °C or higher is expected).
The emissions from life cycle assessment (LCA) for the production of MgO vary depending on the production route and fuel. Depending on the characteristics of the production process, total emissions can vary up to +/−1.17 tons of CO2 per ton of MgO. The company RHI-AG in Austria produces MgO based on MgCO3 with a rotary kiln and natural gas with emission of 1.34 CO2 per ton of MgO. In comparison, the production using a shaft kiln and hard coal as fuel leads to emissions up to 2.51 tons of CO2 per ton of MgO [29]. A comparison focusing only on the applied process fuel (e.g., pet coke, natural gas, and others) shows that fuel emissions can vary between 0.4 and 1.3 tons of CO2 per ton of MgO [30]. This means that the greatest prospects, as well as requirements in terms of reducing emissions, are in the types of fuels used to produce the required energy.
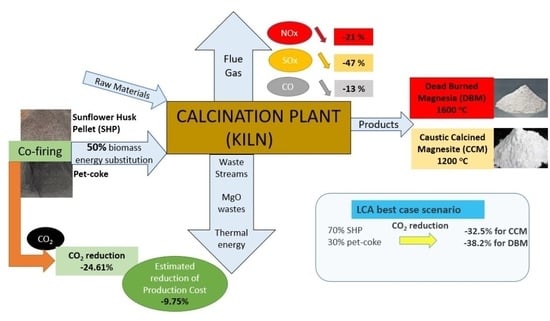
In this paper, an experimental campaign is presented with the main characteristic being the co-firing of a sunflower husk pellets/pet coke mixture in the new low-NOx burner of the Yerakini Mine site calcination plant of Grecian Magnesite (GM) [31]. An LCA is performed to assess the GHG reduction potential of various biomass feedstocks and mixtures with pet coke. Co-firing of fossil and biomass fuel is expected to lower greenhouse gas (GHG) emissions in the magnesia sector, hence playing a major role in sustainable MgO production. This research, both experimentally and theoretically, builds the foundation of future co-firing developments and improvements in the magnesia sector. The novelty of the paper lies in the fact that for the first time, the application of a fossil fuel/biomass co-firing process (with 50% energy substitution), in combination with the operation of an LNB burner, is being tested on a practical level in magnesia sector in order to reduce emissions and associated costs in a production process that has special requirements, such as large quantities of energy, extremely high temperatures (up to 1900 °C or higher), and specific strict properties for its final products (CCM, DBM).

2. Materials and Methods

2.1. Description of GMs Facilities and Use of Biomass

GM is a private company established in 1959 as a mining and industrial company that produces and trades CCM (caustic calcined magnesia), DBM (dead-burned magnesia), carbonate magnesium (MgCO3 –raw magnesite), and basic monolithic refractories. GM is listed as one of the top magnesia producers and exporters worldwide. Especially for CCM, the company is a leading producer in terms of volume and applications. The produced MgO (magnesia) is well known for its bright white color (whiteness) resulting from the low percentage in iron and its low levels of heavy metals and trace elements. In addition, the magnesia product is low in lime and has a microcrystalline structure. The ore is mined via open pit method. It is then transformed into the final product through the following four stages:
i.
Pre-beneficiation, where different types of impurities are sorted out from the ore;
ii.
Main-beneficiation, where the material enters the main beneficiation stage, in which it either passes through camera sorting or a combination of dense media and magnetic separation stages depending on the desired chemistry of the kiln-feed magnesite;
iii.
Calcination and sintering in which the magnesite is fired in the kiln to produce CCM or DBM. During calcination, MgCO3 is decomposes to MgO. In sintering, the decomposed material is fired up to 2000 °C;
iv.
Final processing, where the product is crushed and classified in different sizes.
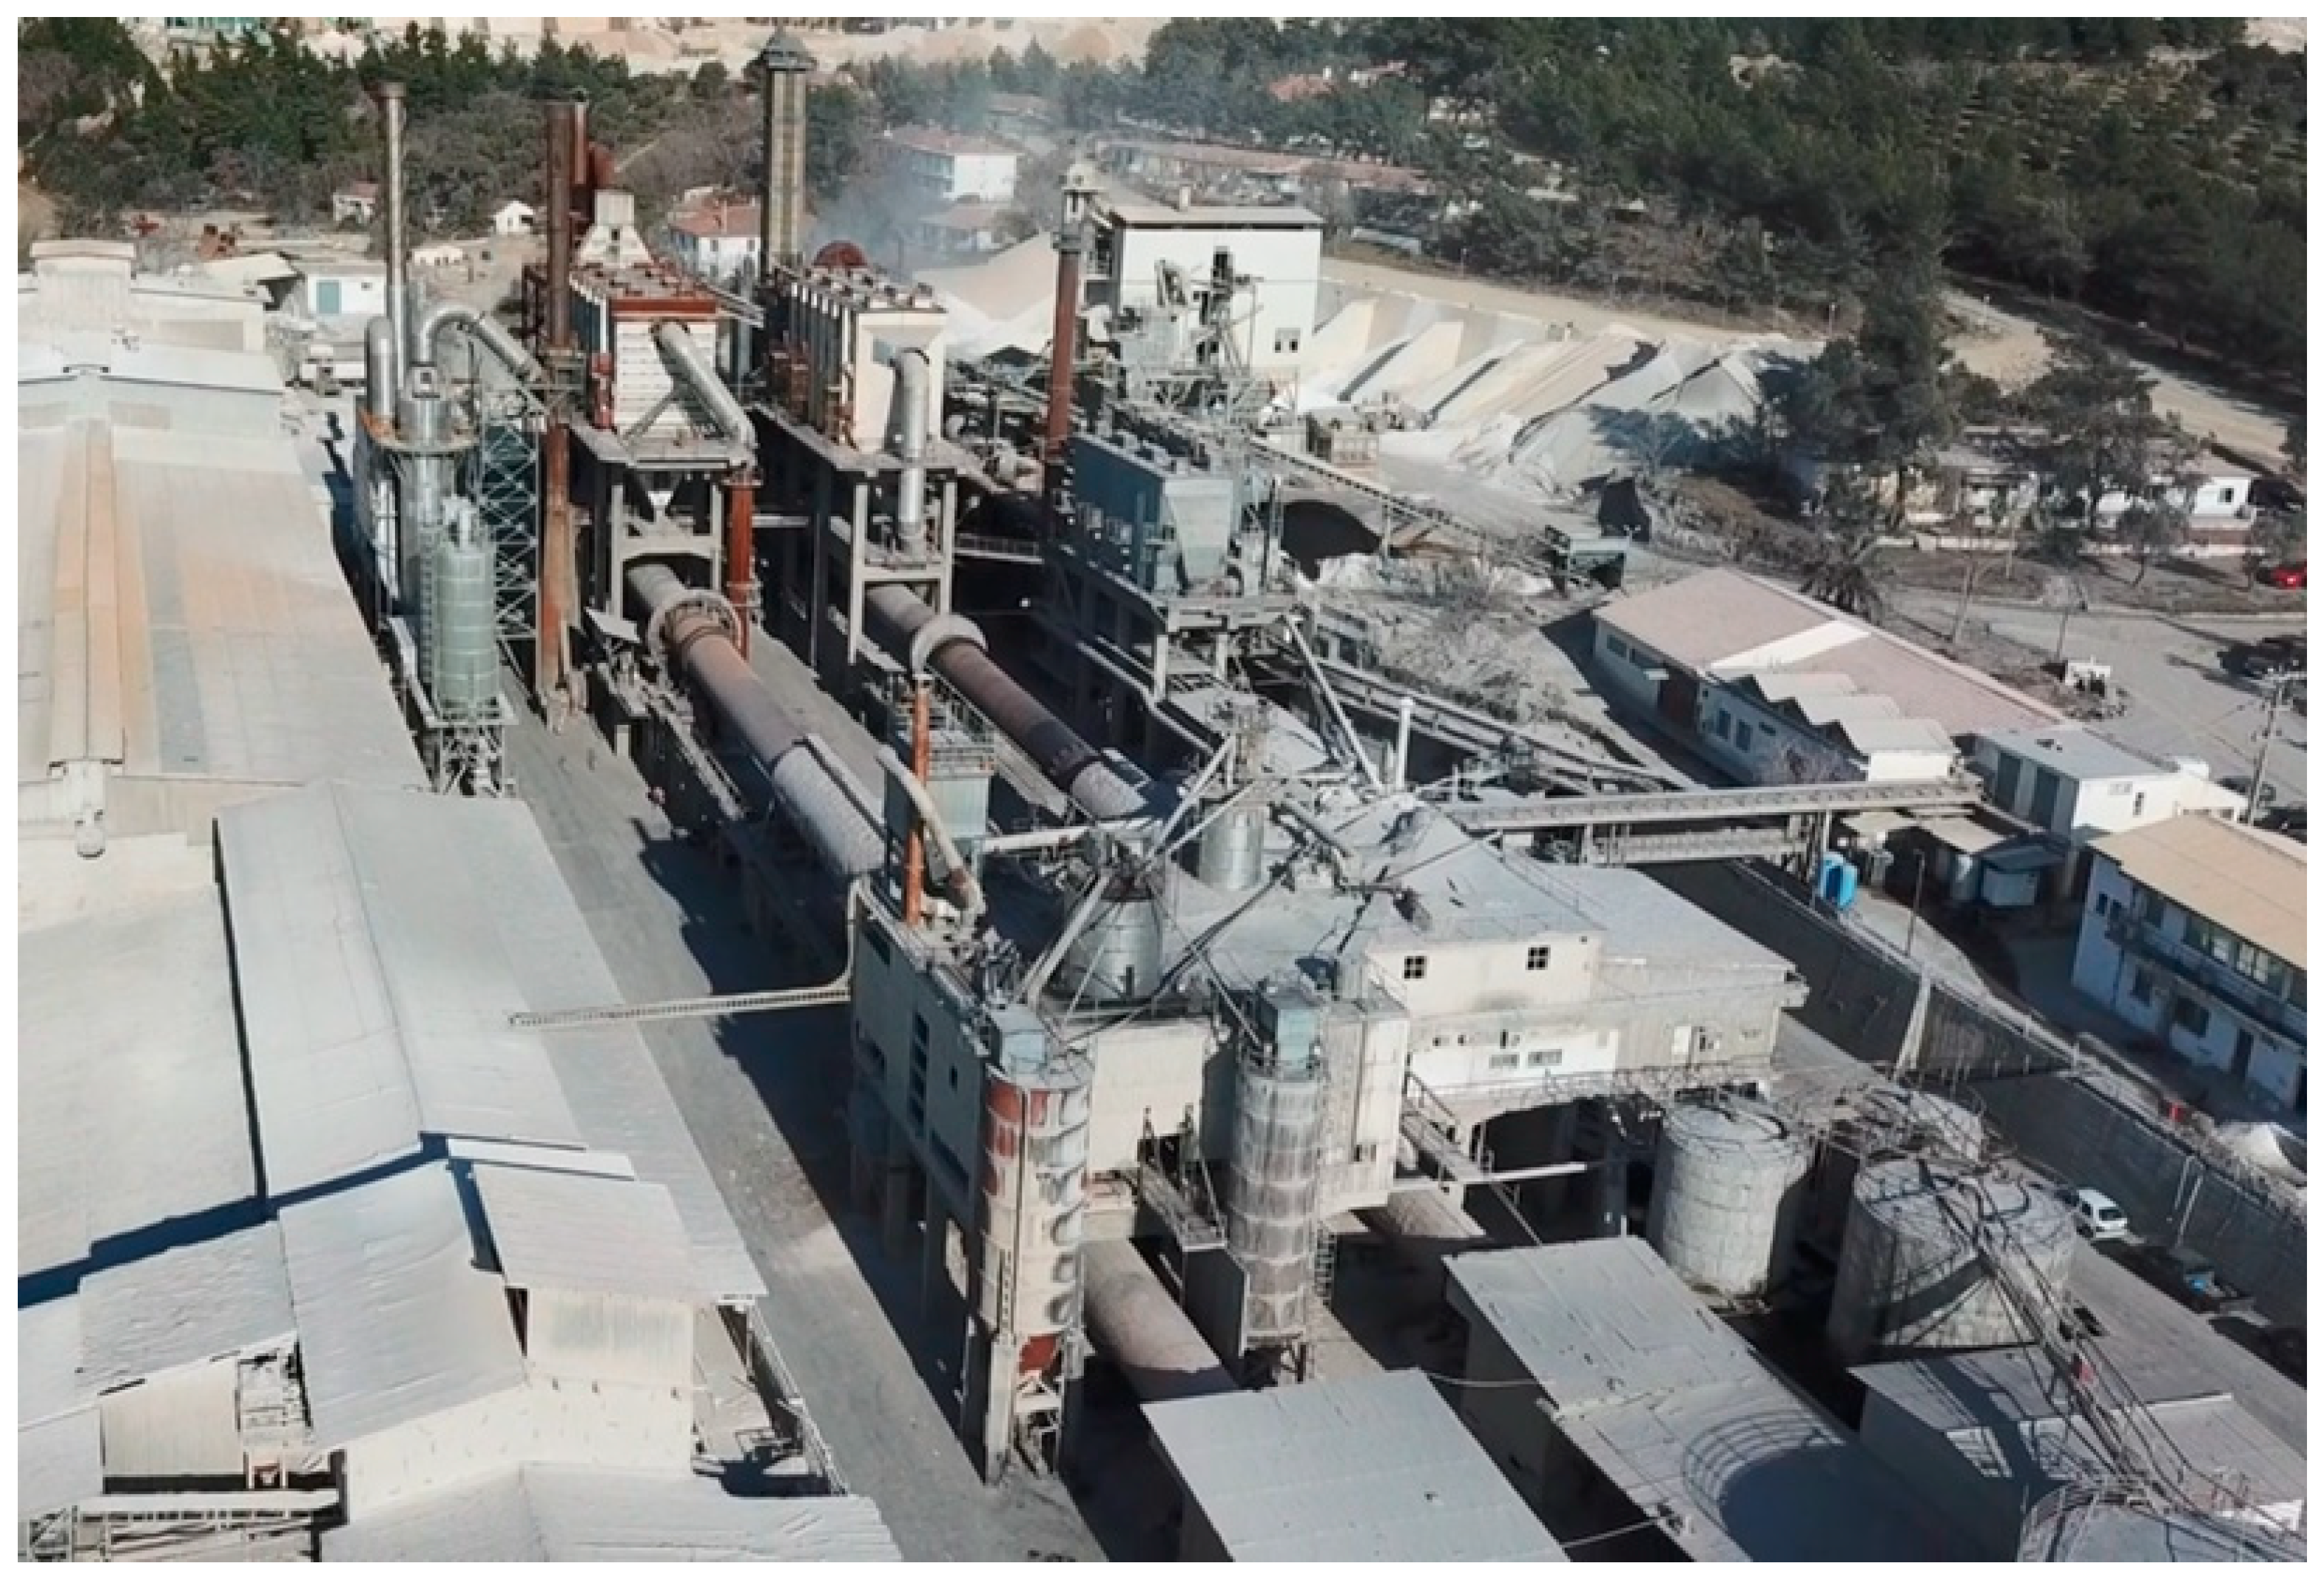
Figure 1 gives an overview of the calcination plant in Yerakini, while in Figure 2, GM’s production flowsheet is presented.
There are three (3) rotary kilns (RK) with a calcination capacity of 550 tpd and one shaft kiln (Figure 1). Kiln-feed magnesite is fired in the kilns to produce either caustic calcined magnesia (CCM, at about 900 °C) or dead-burned magnesia (DBM, at about 1900 °C), using mostly pet coke as fuel. During calcination, magnesite (MgCO3) is decomposed to magnesia by release of carbon dioxide according to the following reaction.
MgCO 3 HEAT MgO + CO 2
In the GM production process, petroleum coke (pet coke), heavy oil, and biomass are used as fuel. The firing process of magnesite into CCM/DBM produces large amounts of CO2 and nitrogen oxides (NOx) deriving from fuel combustion. There are two types of CO2 emissions that are produced during this process: CO2 produced from MgCO3 decomposition, which is inevitable, and CO2 emissions produced from fuel combustion. NOx emissions produced during DBM production, where a 2000 °C temperature is needed, are also inevitable. In order to reduce the CO
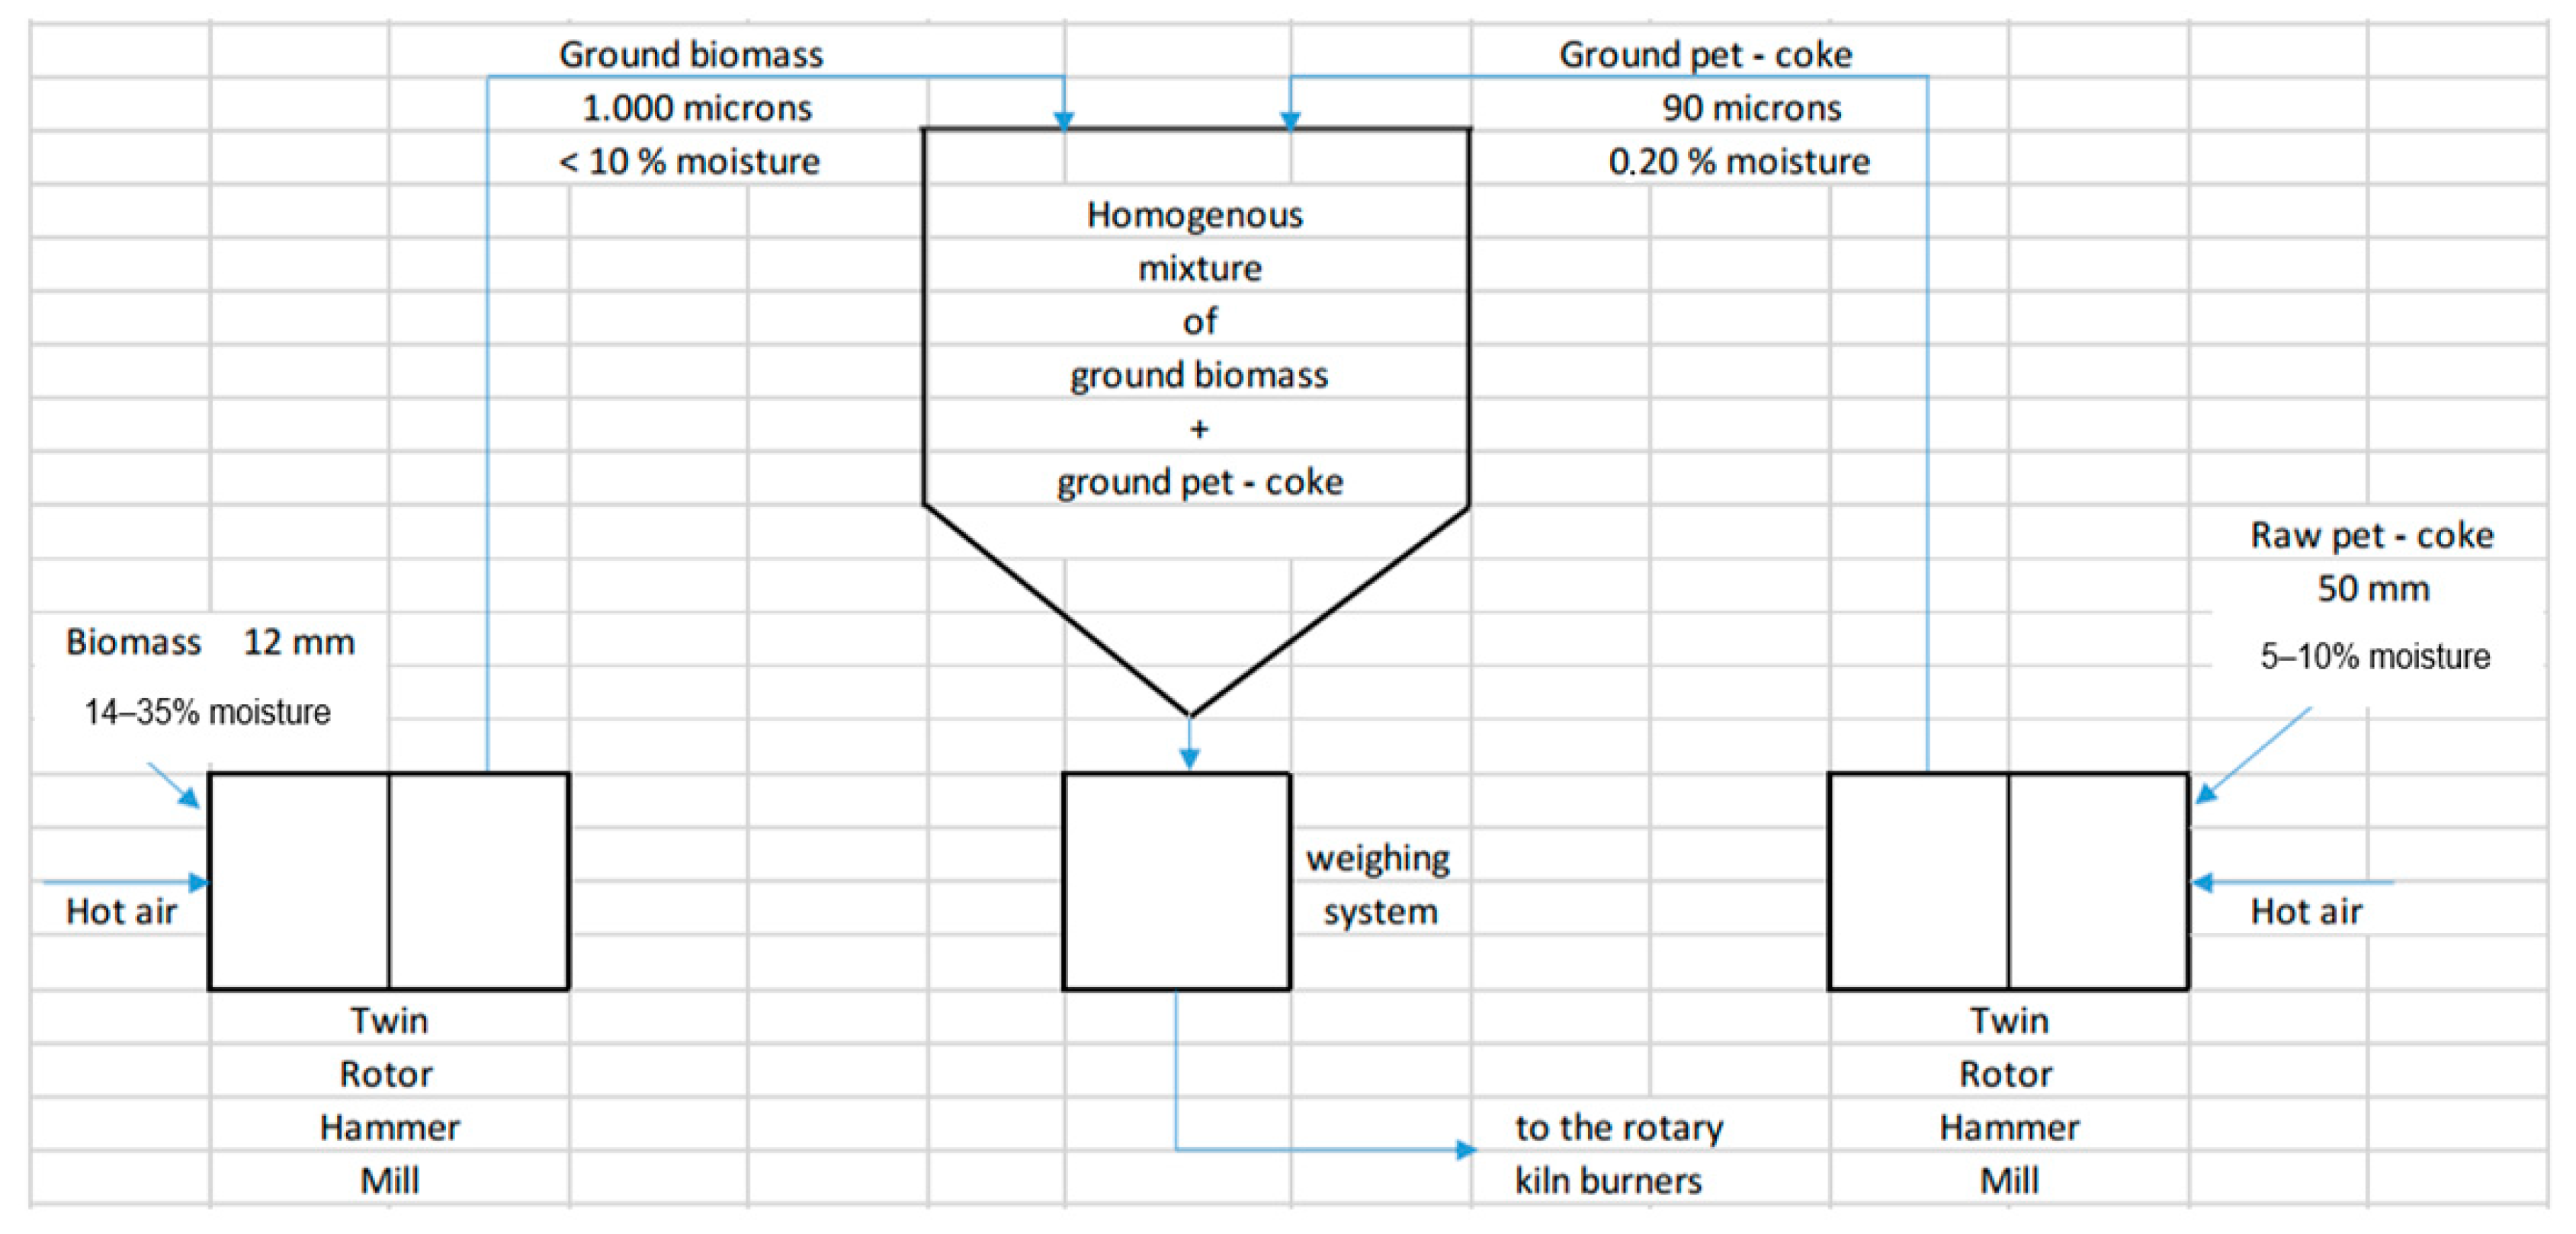
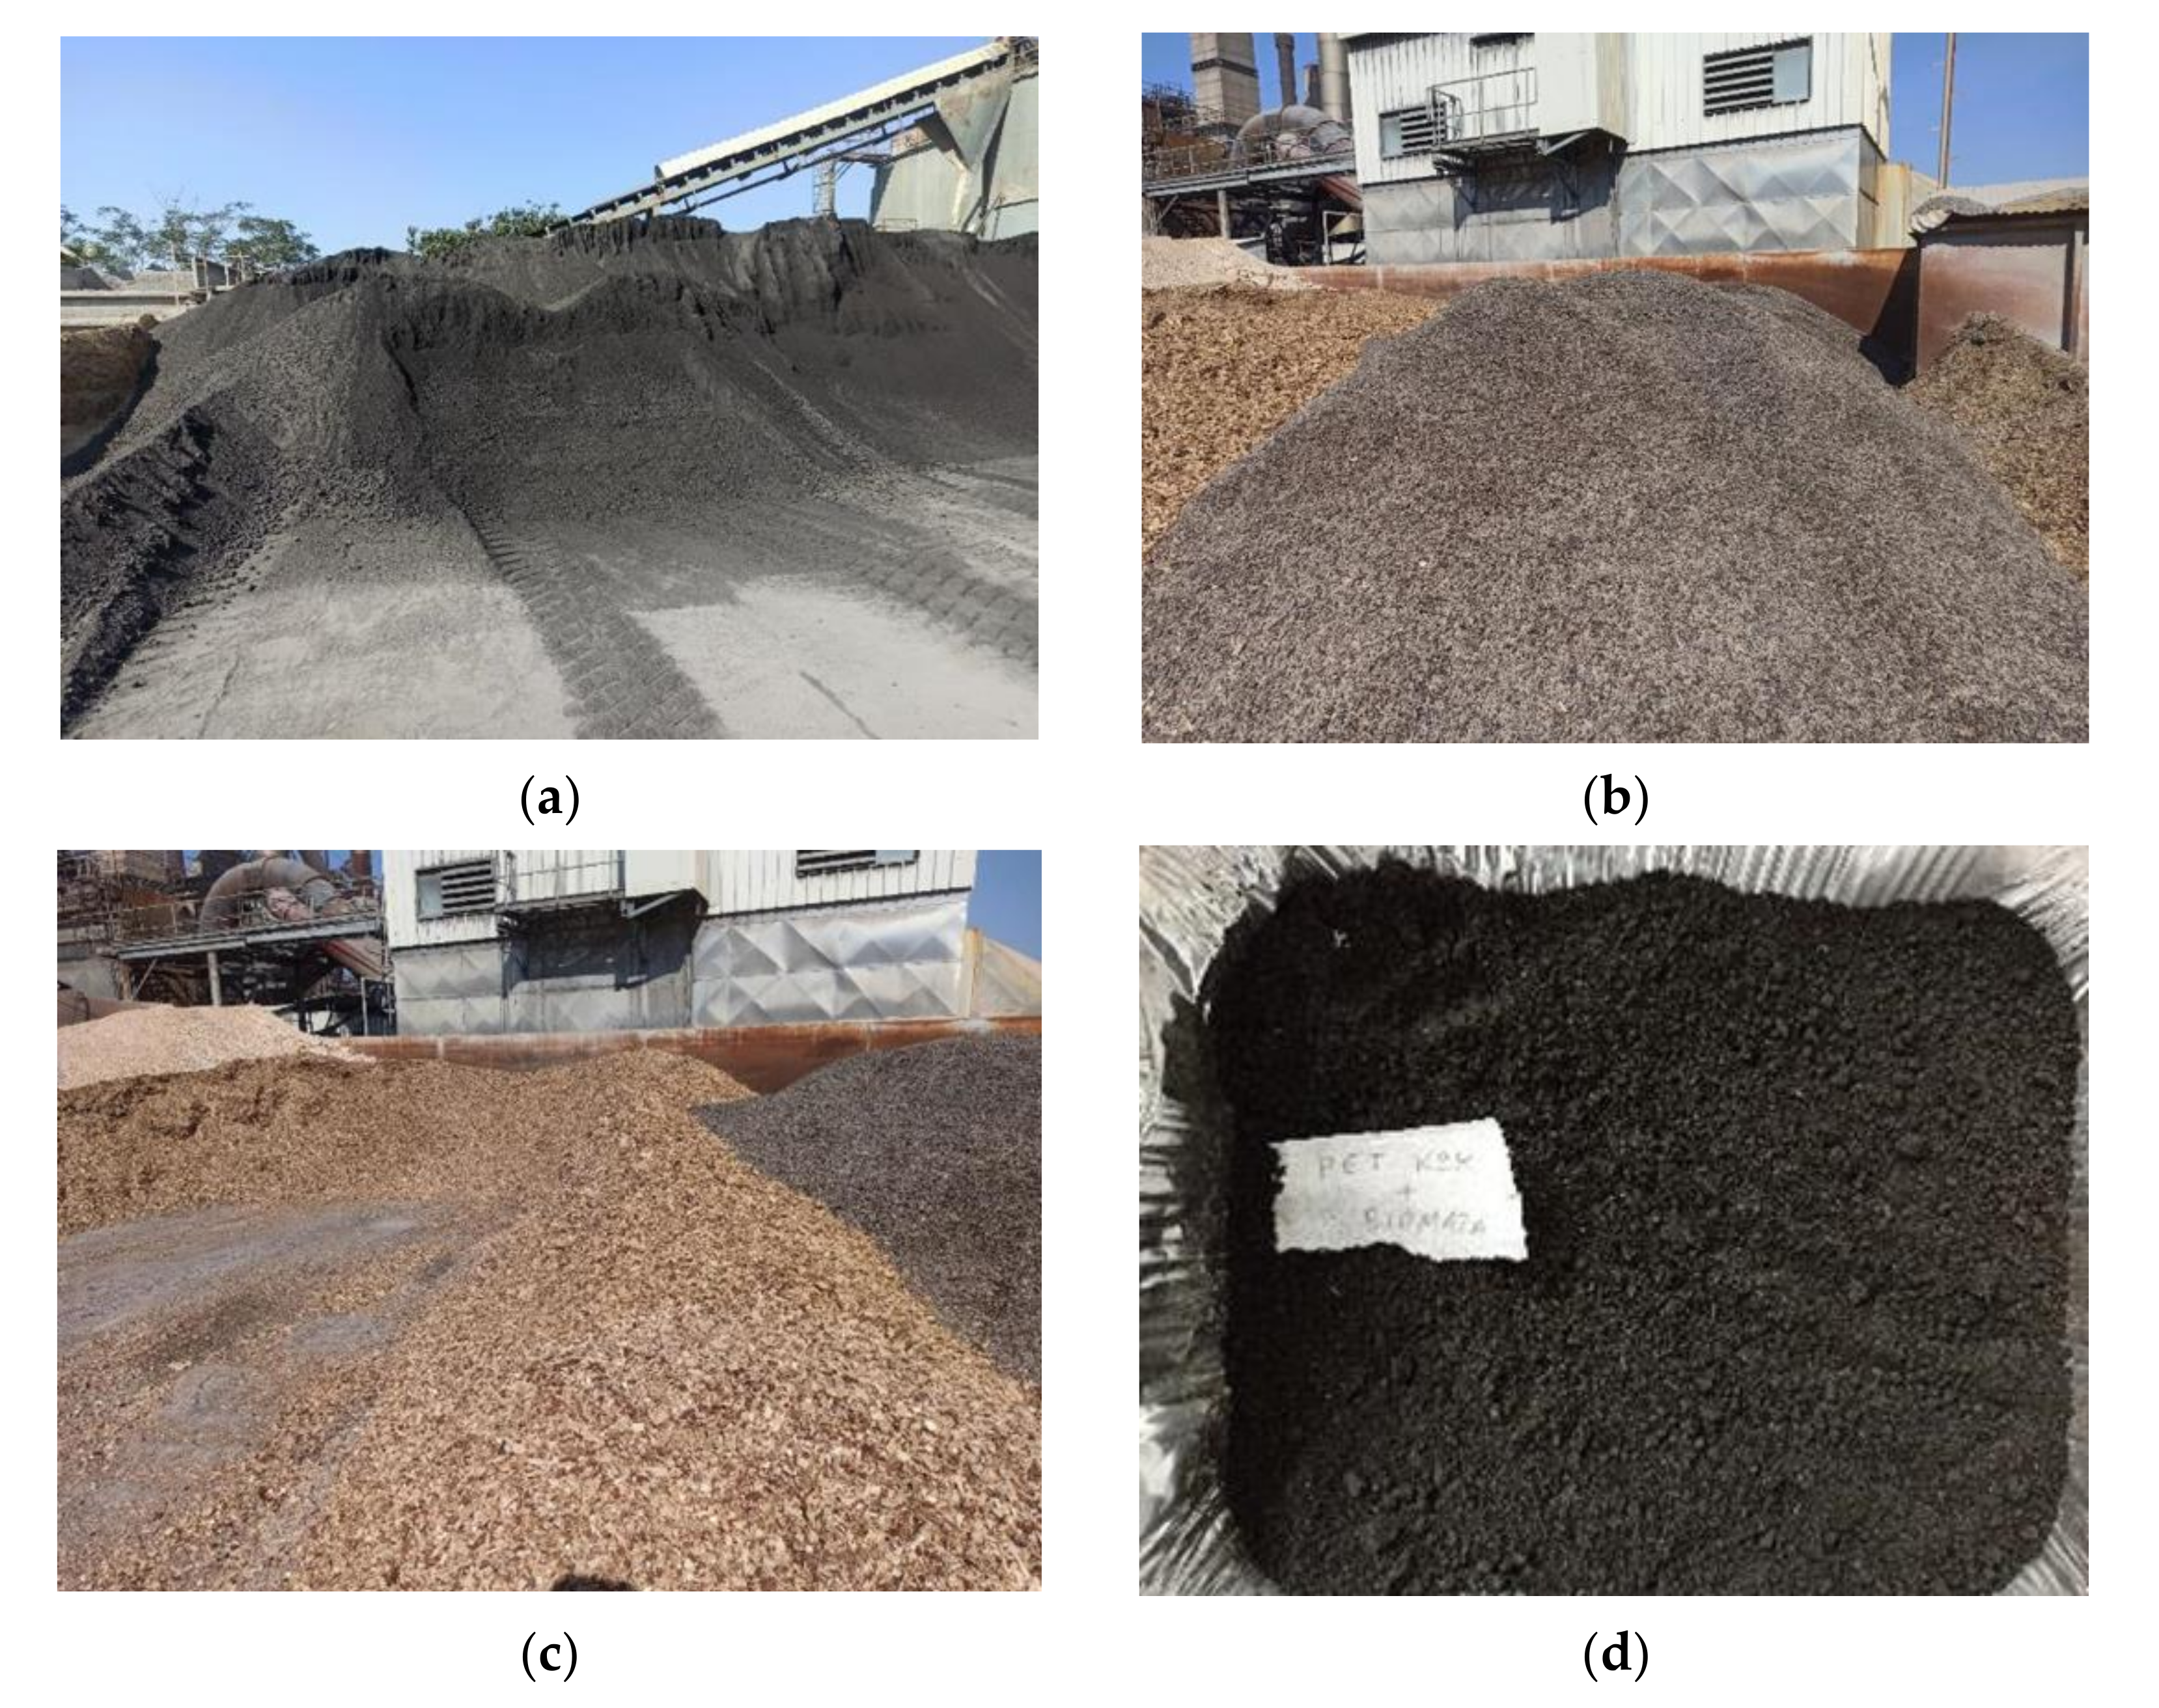
2 emissions produced from fuel combustion, GM is substituted for a percentage of pet-coke energy with pulverized biomass (Figure 3) in the form of sunflower husk pellets, olive cake, or sawdust, according to their seasonal availability and prices. In the BAMBOO project [32], a novel and versatile low NO
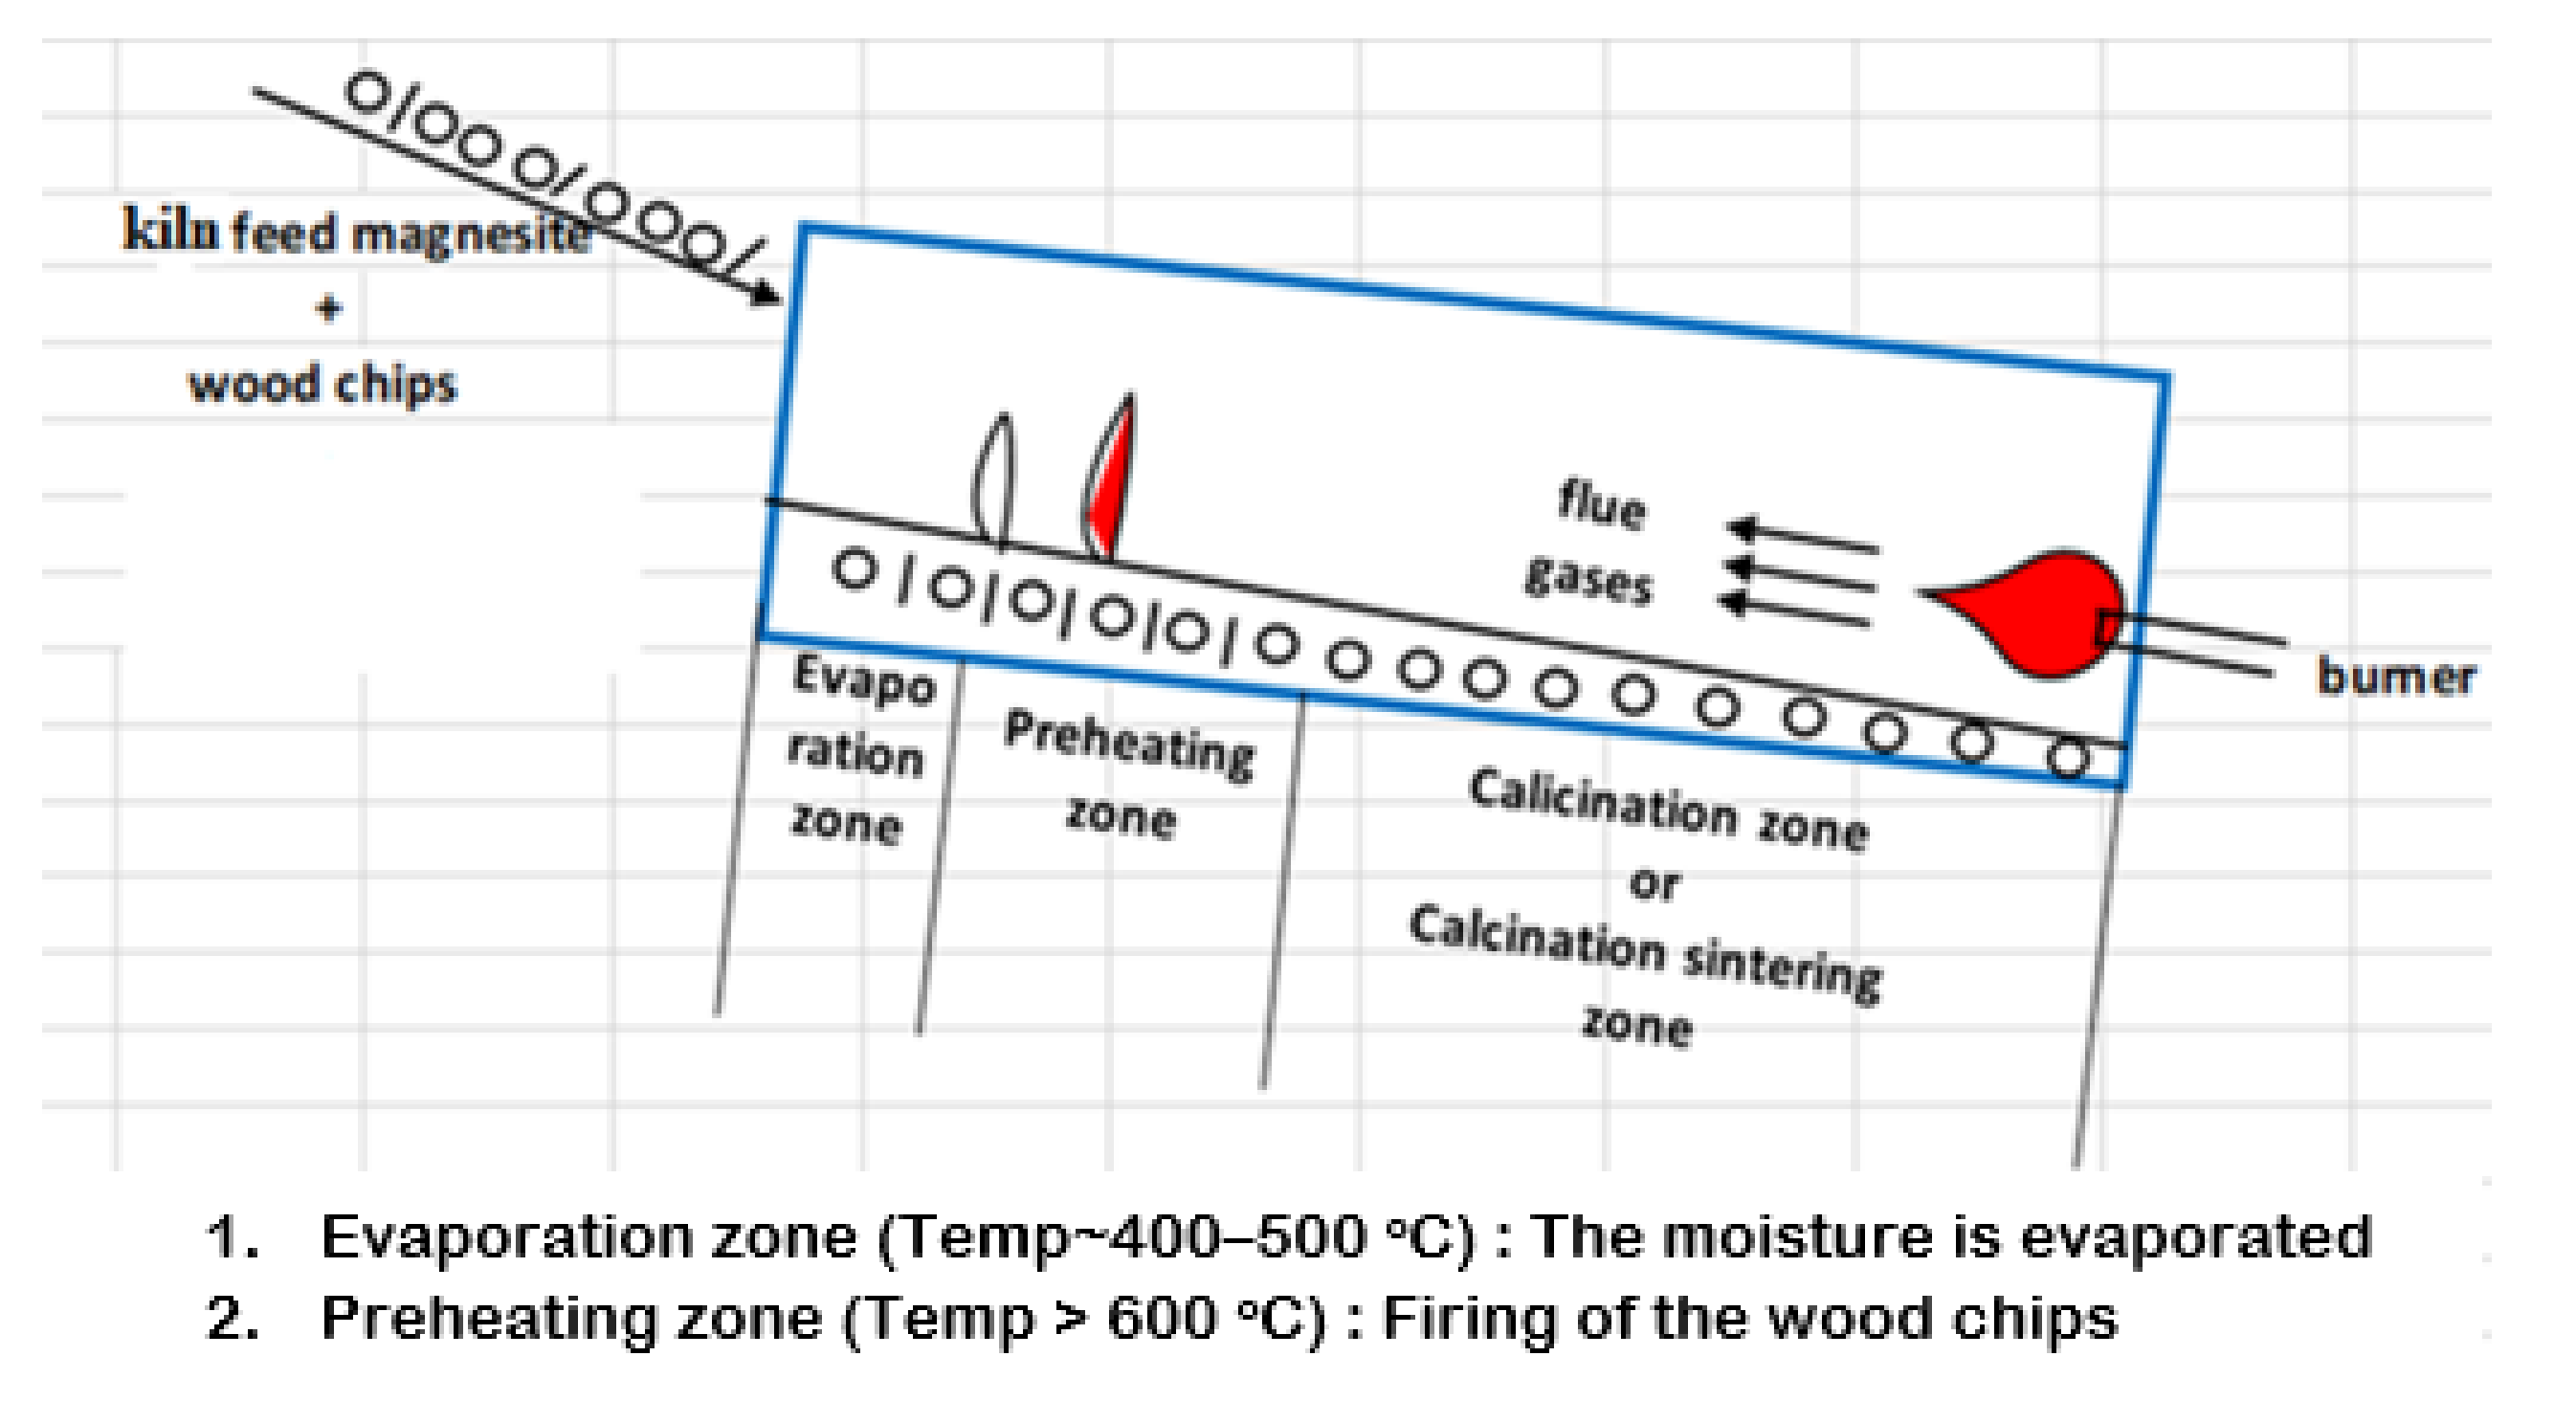
x burner (LNB) was implemented by GM in order to reduce the respective emissions for temperatures up to 1600 °C but also to be able to reproduce high enough temperatures for the production of DBM. The required versatility is related to the fact that the new burner (~20 MWth) must have the ability to combust mixtures of pulverized biomass and pet coke and that it must have adjustable swirl to operate as an LNB for temperatures up to 1600 °C and in normal operation mode for DBM production (above 1600 °C). To optimize the combustion conditions of the raw material (raw magnesite), a small amount of wood chips (about 2–4% of pet coke) is also fired along with raw magnesite.
The potential of use wood chips as a feedstock in parallel with the magnesite gives the advantage of in situ and simultaneously De-NOx and De-SOx procedure. Feeding of wood chips along with raw magnesite (Figure 4) can reduce NOx emissions due to NO2 reaction with the carbon (C) from wood chips and production of CO2 and N2 (2C+2NO2  2CO2+N2 ). The overall benefits of the wood chip feedstock are expected to be: (a) NOx (mainly NO2) reduction, (b) SOx reduction, and (c) preparation of the material.

2.2. Experimental Campaign in GM

After the installation of the new LNB in Rotary Kiln No.3 and the successful initial operation trials with 100% pet coke as fuel, GM conducted preliminary biomass/pet coke co-feeding trials with its initial preparation and feeding system (April–June 2021). Results were promising, but due to feeding system limitations, the trials faced problems caused by feeding instabilities. GM went on to design and construct a new system able to handle the new fuel mixture and conducted a successful experimental campaign in February of 2022.
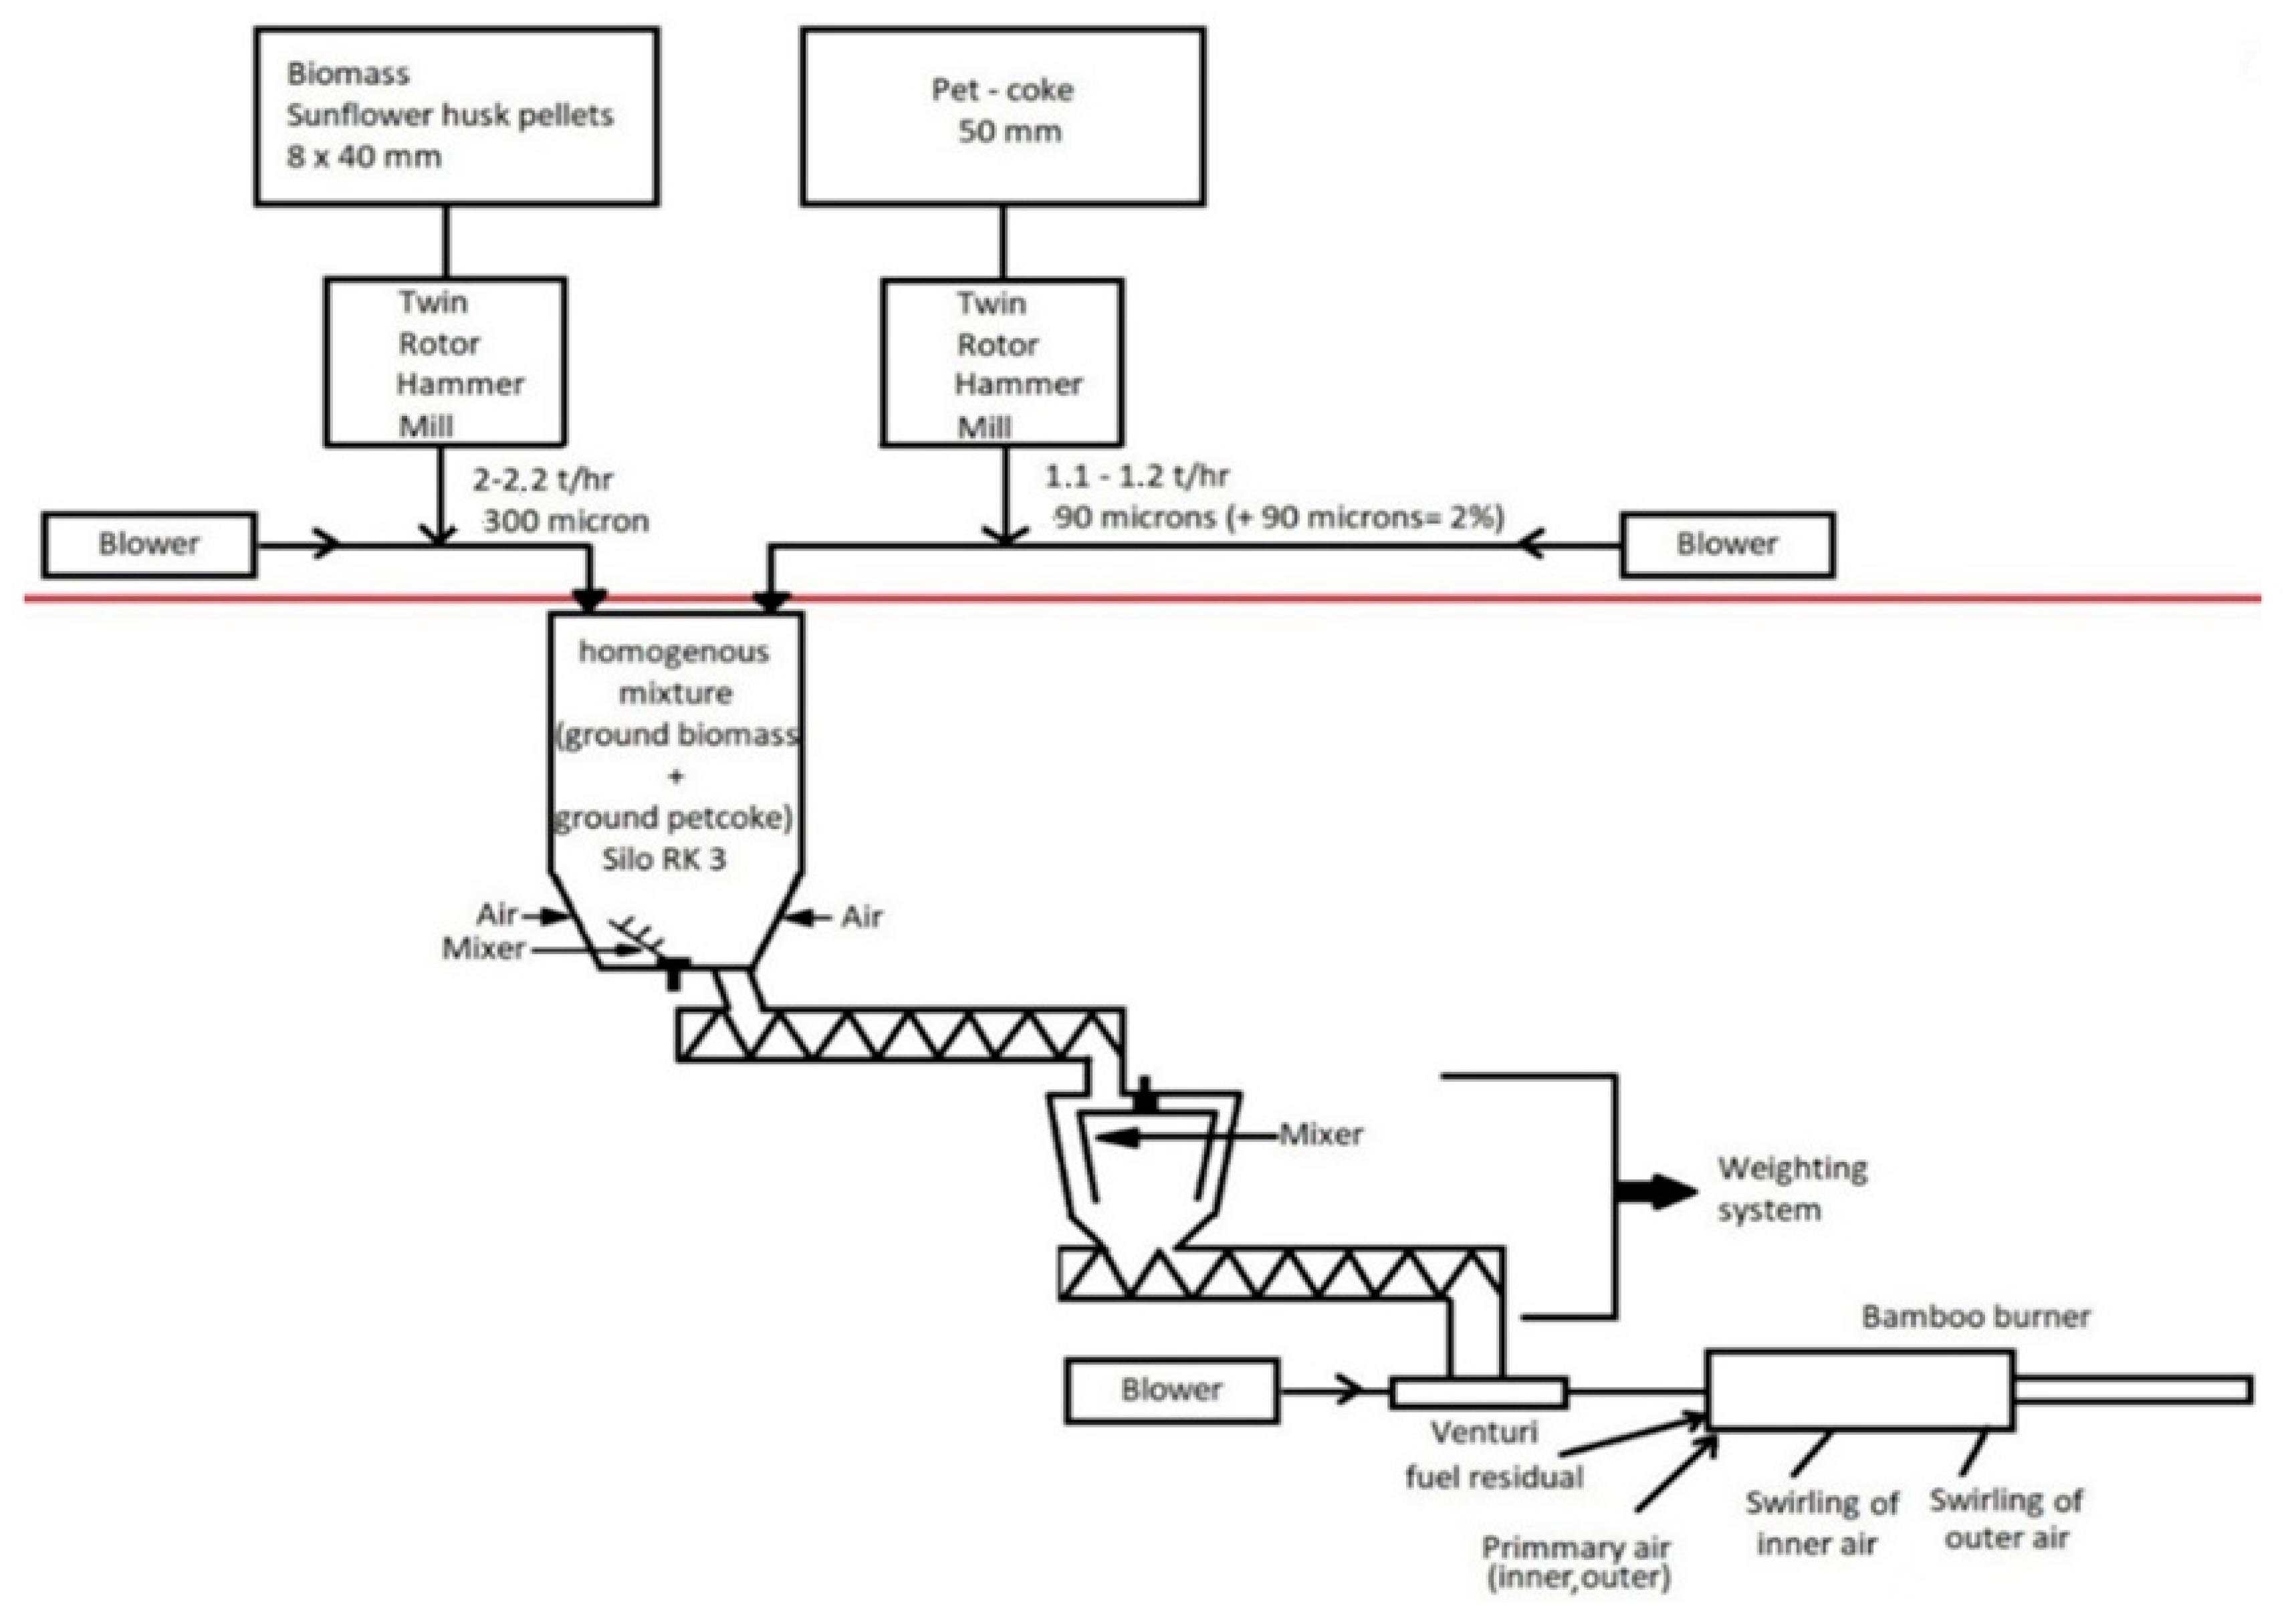
Figure 5 describes the new fuel mix preparation and feed process designed and constructed by GM for the purposes of this trial. Biomass and pet coke are fed from the fuel temporary storage square adjacent to the calcination department facilities to two separate twin rotor hammer mills, and after size comminution, they are transported pneumatically to the solid fuel silo. From there they are conveyed by a screw feeder to a smaller buffer silo which assures further homogenization of the mixture and enables control of the mass feed rate of the mix to the new burner.
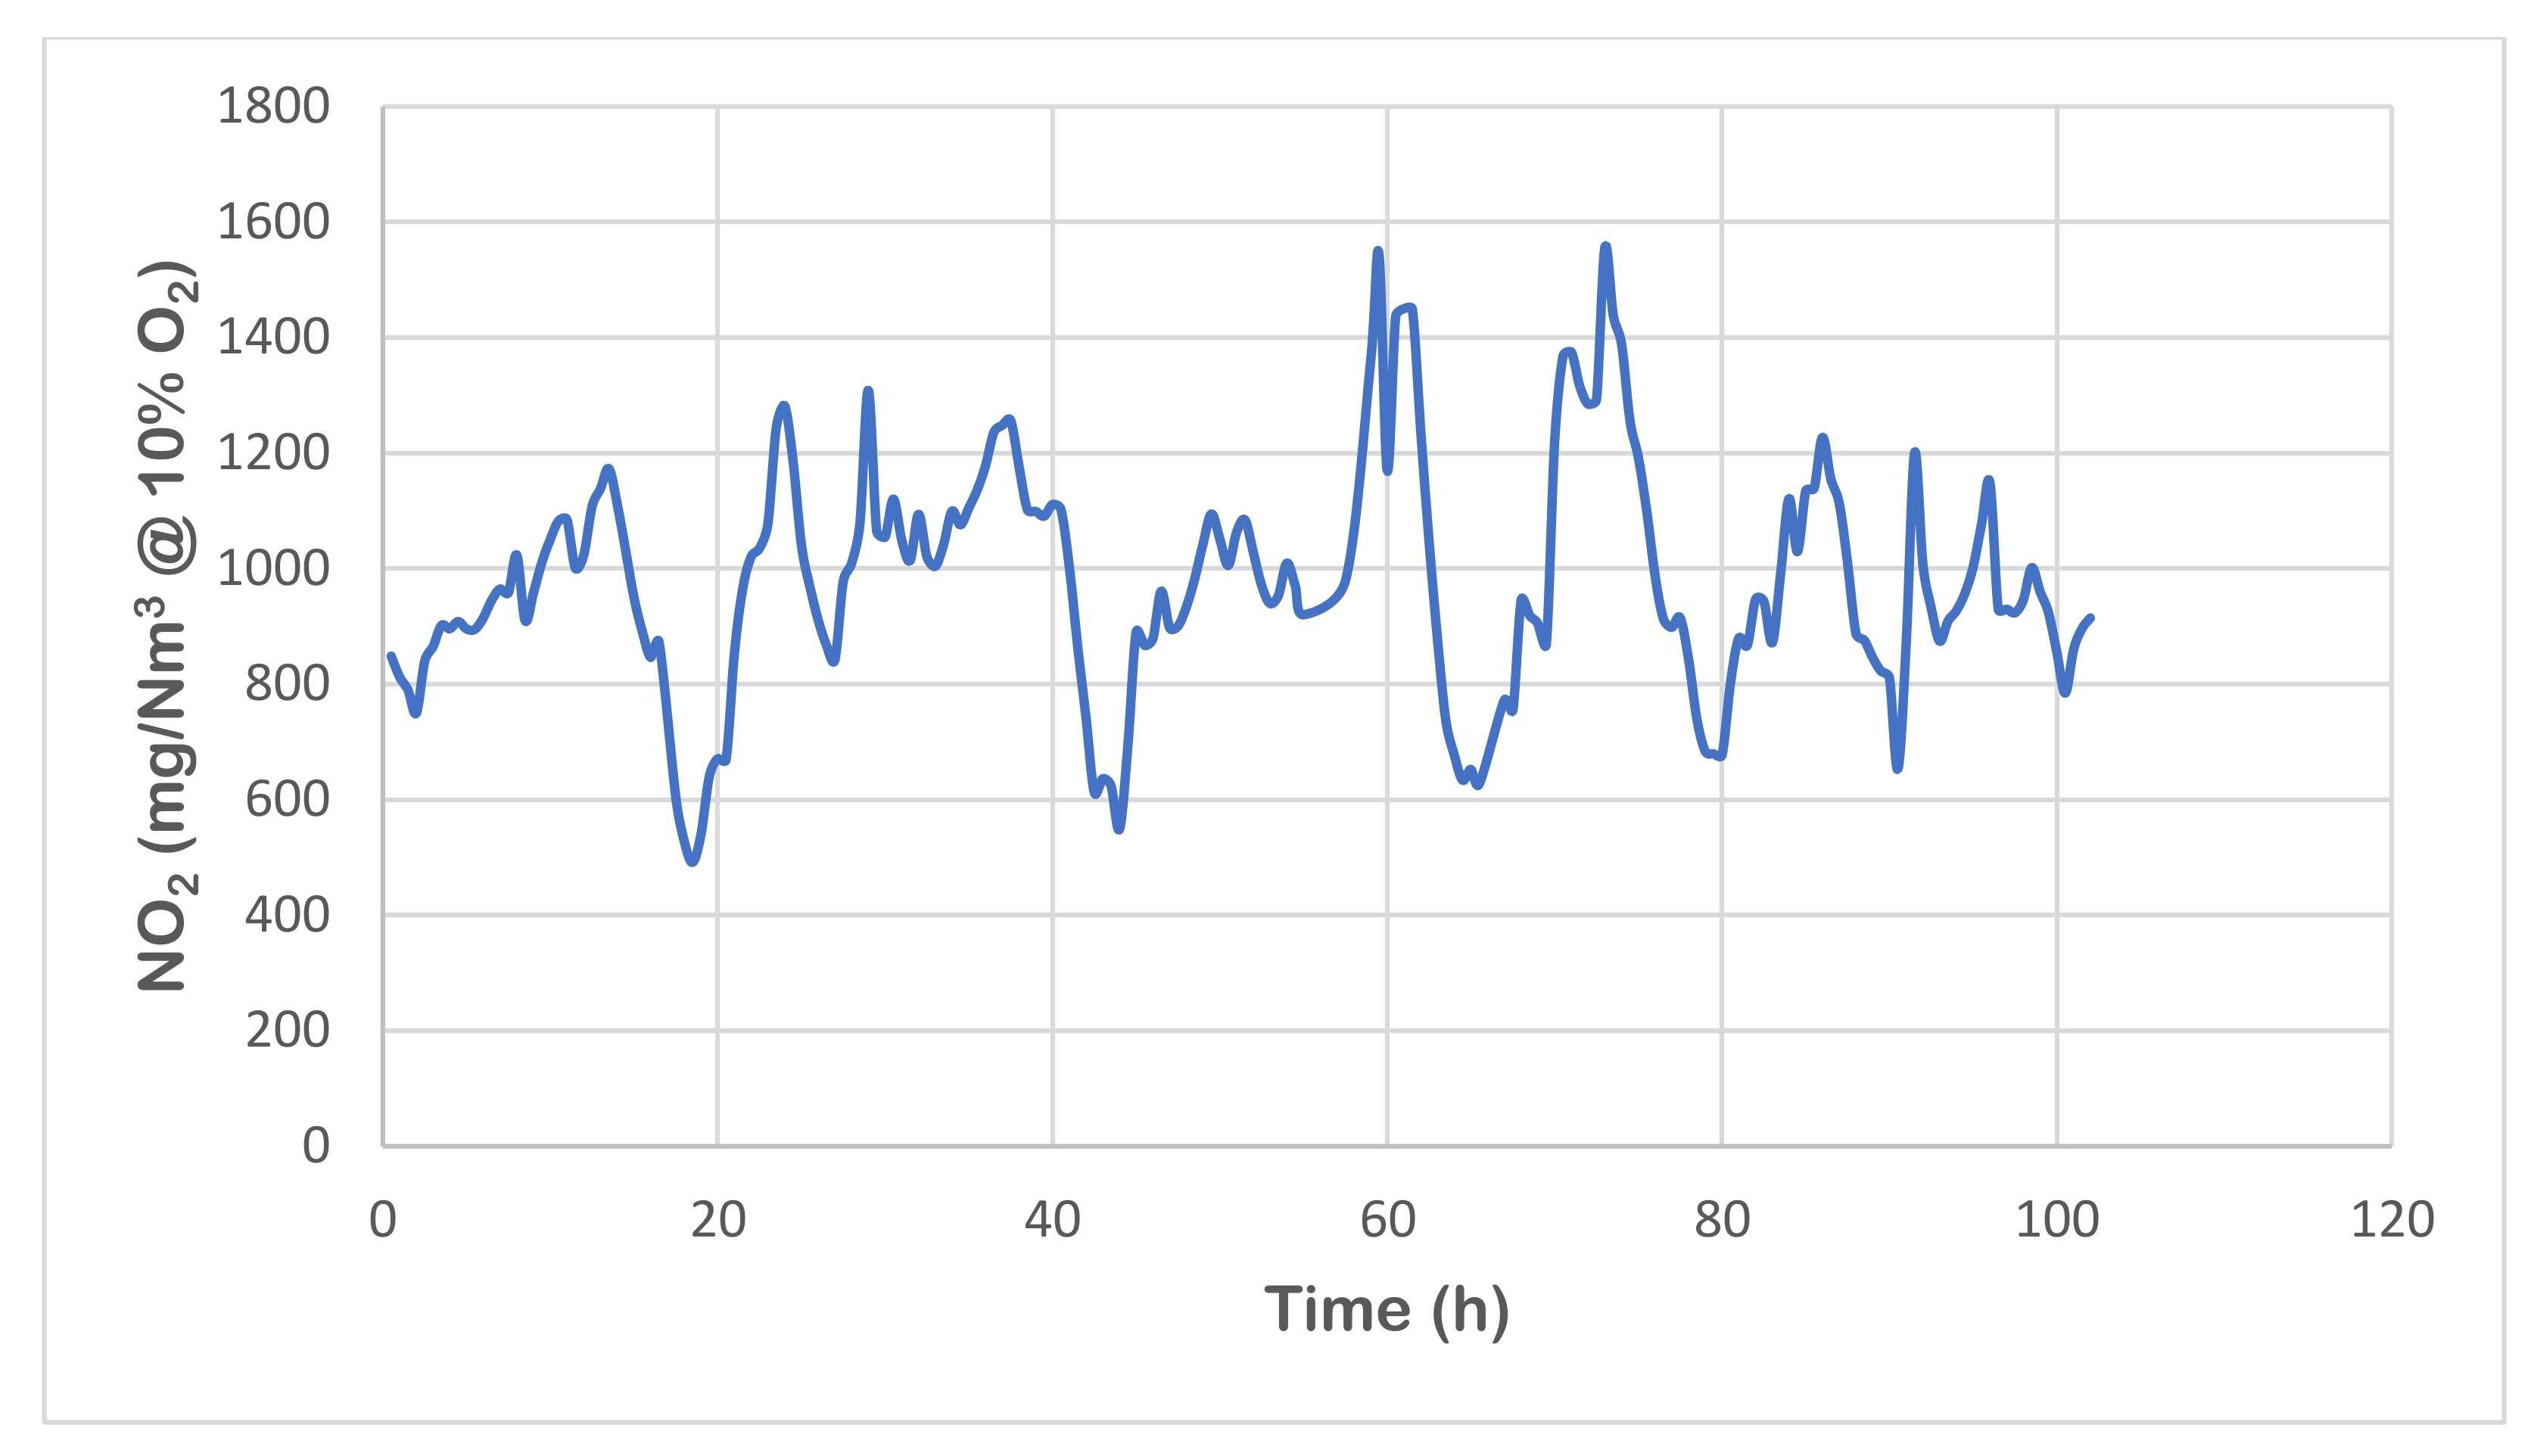
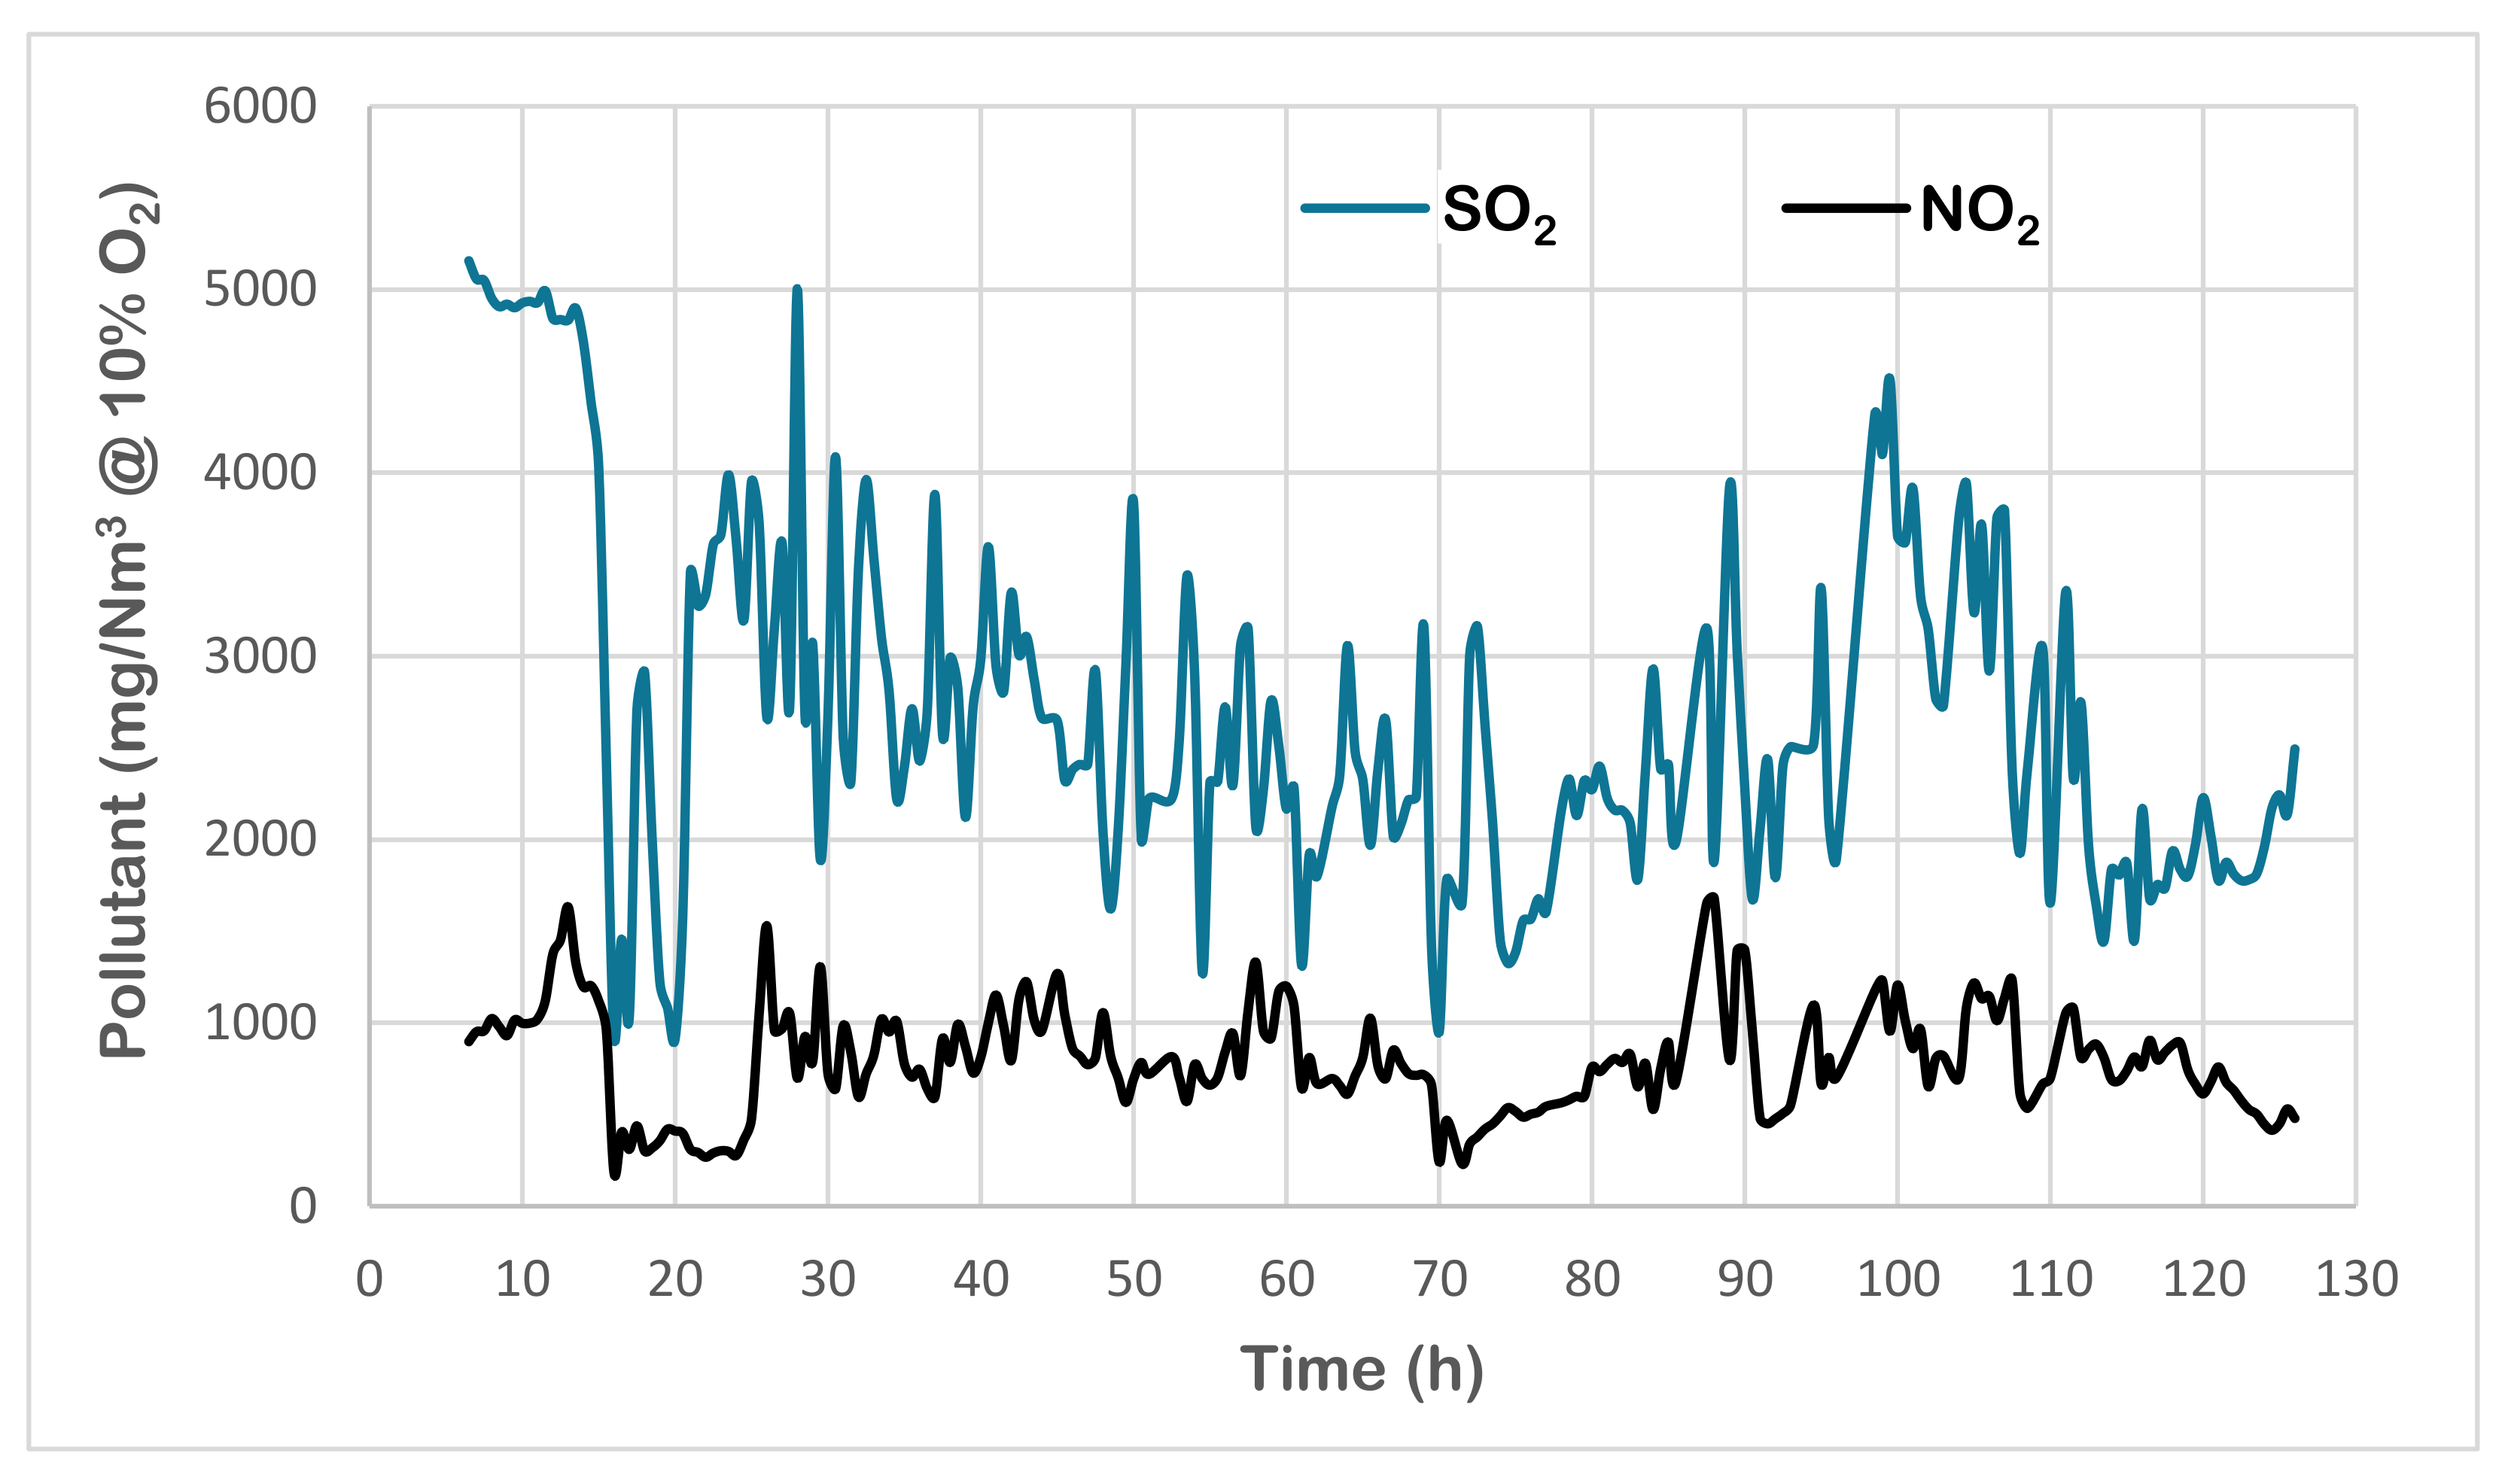
GM conducted initially a 4-day trial (100% pet coke) to validate the NOx reduction accomplished with the installation of the new burner that earlier shorter trials had indicated. Pet coke feed rate was 2000 kg/h with production of the base-case DBM product. Burner swirl was adjusted to the maximum levels for both inlet and outlet air.
After the 100% pet coke trial, without changing the kiln’s product and productivity, GM conducted a 5-day trial (co-firing with biomass) using a biomass/pet coke fuel mixture. The biomass used was sunflower husk pellet comprising 2/3 of the mixture by weight, or around 50% of the energy requirement. Burner swirls were kept at the maximum levels as before.

2.3. Description of Metering Equipment Used in Campaign

A dedicated control set-up, with the use of SCADA system, controls the operation of the feeding unit. Set point is a given mass flow rate (kg/h), which is achieved by adjusting screw speed. What is actually measured is the buffer silo weight with respect to time. A series of kiln parameters are controlled and monitored, the most important of which are the raw magnesite feed rate, rotation speed (as % of maximum), and temperature profile.
Flue gas composition is monitored by a SICK’s MCS100FT FTIR analyzer system (located in the stack of desulfurization unit) coupled with a flame ionization detector, a zirconium dioxide sensor, and backward light scattering systems able to monitor SO2, NO2, CO, HCl, HF, H2O and TOC, O2, and dust.
Spot measurements at various points for SO2, NO2, CO, and O2 are made with a portable, heavy-duty Varioplus Industrial by MRU, suitable for industrial applications by means of infrared technology (combination of NDIR technology with electrochemical sensors).

2.4. Description of Laboratory Equipment Used for Fuel Analysis

Several tests were conducted on pet coke and sunflower husk fuels and wood chips, including proximate analysis, ultimate analysis, determination of major and minor elements, bulk density and determination of ash melting temperature and calorific value.
Total moisture was measured using a furnace type Heraeus Thermo Scientific T-12 (temperature temporal deviation of ±5 °C). The measurement of moisture, ash, and volatiles was carried out in a Thermo Gravimetric Analysis (TGA ELTRA Thermostep, temperature control precision of 2% or ±2 °C).
The calorific values of the fuels were determined using a Parr 6400CL Calorimeter (relative standard deviation below or equal to 0.10%). The elemental analysis (CHN) was conducted using a Perkin Elmer Series II instrument (accuracy below 0.3%).
The concentration of major elements and selected heavy metals was determined by means of Flame and Graphite Furnace Atomic Absorption Spectrometry (AAS, Shimatzu AA-6300, relative standard deviation below 0.5%) after the complete digestion of samples with an acid mixture of HNO3/H2O/HF in a microwave oven (Berghof SW-2).
Ash fusion temperatures were measured in an oxidizing environment in a SYLAB IF2000G analyzer (precision better than ±20 °C on specific points). Fusion of ash is characterized by the physical state of the ash, which occurs during the heating process under well-defined conditions in the furnace. During ash fusion, the following temperatures were monitored:
  • Shrinkage temperature (ST): the temperature at which shrinking of the test piece occurs. This temperature is defined as when the area of the test piece falls below 95% of the original test piece area.
  • Deformation temperature (DT): the temperature at which the first signs of rounding of the edge of the test piece occurs due to melting.
  • Hemisphere temperature (HT): the temperature at which the test piece forms approximately a hemisphere, i.e., when the height becomes equal to half of the base diameter.
  • Flow temperature (FT): the temperature at which the ash is spread out over the supporting tile in a layer, the height of which is held of the height of the test piece at the hemisphere temperature.
During the laboratory analyses, the measurement processes and standards were strictly followed. Table 1 records the processes as well as the standards that were followed in the laboratory facilities both during the analysis of the fuel (pet coke) and during the analysis of the different types of biomass. More information on the measuring instruments is presented in Appendix A.

2.5. Description of LCA Methodology and Developed LCA Model

The environmental impacts are examined using the LCA software GaBi 10.6 ts by Sphera, following the ISO 14040 standards for LCA. This framework consists of four steps: definition of goal and scope, life cycle inventory (LCI), life cycle impact assessment (LCIA), and, finally, improvement and interpretation [33]. As the LCA methodology is already extensively described in the literature [34,35,36], only the relevant definitions to conduct the LCA are described.

2.5.1. Definition of Goal and Scope

The goal is to analyze the environmental impacts resulting from the use of biomass as alternative fuel compared to a business-as-usual (BAU) case. As elaborated previously [37], the definition of a functional unit is crucial to guarantee comparability of alternatives. In this study, the functional unit is the production of 1 ton of MgO, either CCM or DBM. A cradle-to-gate system boundary for the MgO production plant is chosen according to the LCA framework. This means that the transport of the resources (pet coke, MgCO3, biomass resources, etc.) and the production of MgO is considered within the analysis, but the utilization and transport of MgO is not part of the analysis.
The reference system is defined as the BAU system. The BAU case uses fossil pet coke for the kiln and calcination stage as fuel for thermal process energy provision and an electricity consumption mix for Greece as electricity supply. As the thermal energy demand is different for CCM and DBM, the LCA is conducted for CCM and DBM separately concerning the representative input data but is analogously related to applied methods.

2.5.2. Life Cycle Inventory and data collection

The life cycle inventory (LCI) phase focuses on data collection and quantifies the inputs and outputs of the production system. The mass and energy balance data for MgO production are collected based on [33] (Table 2 and Table 3), and data gaps are filled using valid literature data. For the evaluation of the environmental impacts of the MgCO3 mining process, representative literature values for open mining are applied [38]. As the transportation of the MgCO3 to the MgO production plant is not considered in the literature, this is included separately.
In contrast, the background processes, such as electricity generation or material production, were taken from acknowledged LCA databases, such as GaBi ts 10.6 Professional Database and ecoinvent v.3.8 database.
The electricity used for the production process of MgO is consumed from the public grid of Greece. In addition, a future renewable energy (RES) mix for Greece is composed using Greek data from GaBi LCA software. The production of 1 MJ electricity consists equally of hydro power, wind, and photovoltaic power in this RES mix.
The applied biomass resources can be mostly considered as agricultural residues and thus no ecological footprint is allocated. This is in line with the renewable energy directive (RED) of the European Parliament and Council [39]. However, energy and emissions resulting from the collection, clustering, chipping, and pelletizing of biomass have to be considered. The respective data reported by the Joint Research Center (JRC) of the European Commission is applied [40].
The calcination of MgCO3 releases an essential amount of CO2 naturally bound in the mineral complexes. The production of 1 ton of MgO from pure MgCO3 generates 1.09 tons of CO2 (assuming a stoichiometric reaction), which is considered within the LCA. In addition, the combustion of 1 ton of carbon (C) generates 3.66 tons of CO2 (assuming again a stoichiometric reaction). Within the LCA model, 1 ton of pet coke is considered with a carbon content of 88% and is taken into account for emissions from fuel combustion.

2.5.3. Life Cycle Impact Assessment

LCI compilation follows by setting up the MgO production process as an LCA model in GaBits 10.6 software and conducting the LCIA, applying CML 2001 methodology. In general, the LCA analyzes the environmental impacts of the MgO production in several categories. The most discussed and crucial one in this study is the global warming potential (GWP). The GWP indicator is calculated in kg CO2-equivalents for the impact category climate change.

2.5.4. Scenario Development for CCM and DBM MgO LCA Analysis

Scenarios support identifying the impacts of various parameters. Table 4 gives an overview of the defined scenarios for the LCA analysis valid for CCM and DBM. The scenarios differ into following issues:
  • The electricity supply is changed for a best case scenario from the Greek electricity consumption mix to a renewable energy sources (RES) mix for Greece.
  • At the kiln process stage, biomass resources substitute pet coke as fuel based on their LHV for thermal process energy supply. Applied biomass resources are wood chips (WC) and pruning (PRU).
  • At the calcination process stage, biomass resources substitute pet coke as fuel. Applied biomass resources are sunflower husk pellets (SHP), wood saw dust (WSD), and olive kernels (OK).
Table 4. Scenario description for CCM and DBM MgO LCA analysis.
AbbreviationScenarioDescription
BAUbusiness as usualfossil fuel supplied process, thermal energy from pet coke and electricity from GR electricity mix
ELEonly electricity100% use of renewable electricity sources, thermal energy from pet coke
KILNonly kiln10% WC biomass share at kiln, GR electricity mix
CAL SHPonly calcination SHP70% SHP biomass share at calcination, GR electricity mix
CAL WSDonly calcination WSD70% WSD biomass share at calcination, GR electricity mix
CAL OKonly calcination OK70% OK biomass share at calcination, GR electricity mix
MB SHPmoderate biomass SHPbiomass share: at kiln WC 5%, at calcination SHP 30%; GR electricity mix
MB WSDmoderate biomass WSDbiomass share: at kiln WC 5%, at calcination WSD 30%; GR electricity mix
MB OKmoderate biomass OKbiomass share: at kiln WC 5%, at calcination OK 30%; GR electricity mix
BCB SHPbest case biomass SHPbiomass share: at kiln WC 10%, at calcination SHP 70%; RES electricity mix
BCB WSDbest case biomass WSDbiomass share: at kiln WC 10%, at calcination WSD 70%; RES electricity mix
BCB OKbest case biomass OKbiomass share: at kiln WC 10%, at calcination OK 70%; RES electricity mix
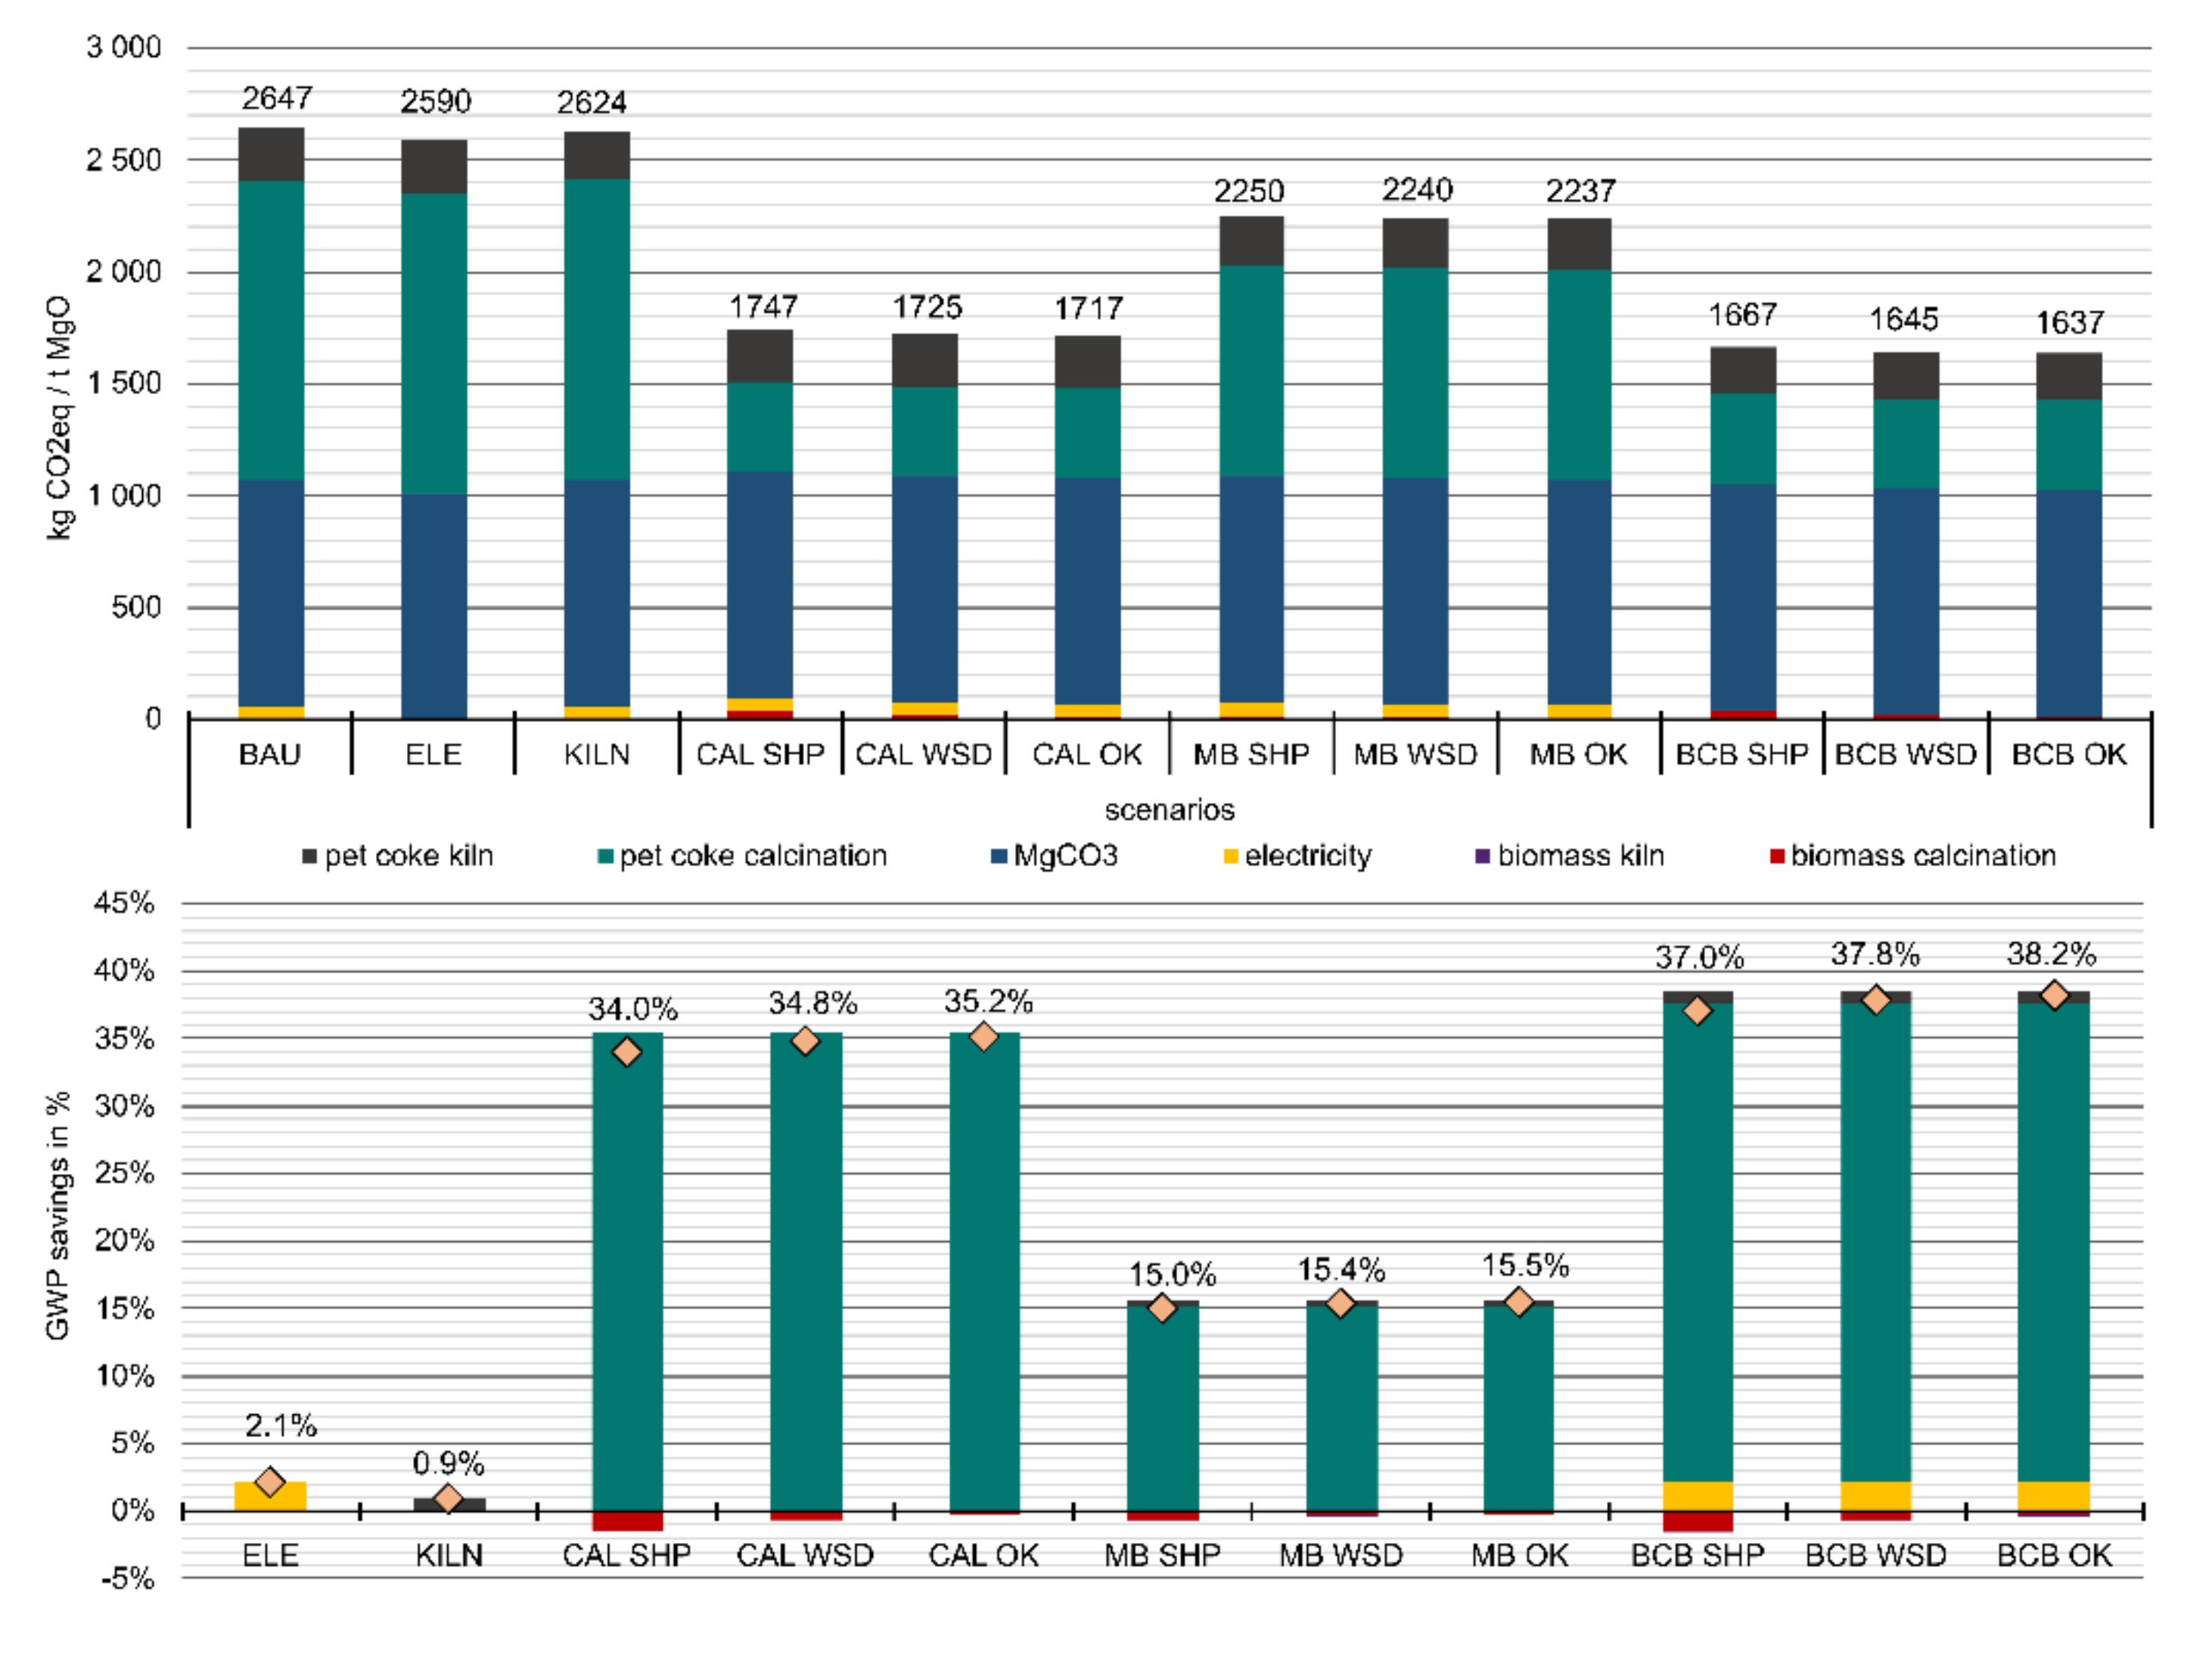
3. Results and Discussion

3.1. 100% Pet Coke

The installation and operation of a new LNB had as its main purpose the reduction of NOx emissions. During the experimental process where the fuel composition consists of 100% pet coke, NOx emissions were measured over a period of 120 h and values ranged between 500 and 1600 mg/Nm3. Figure 6 presents the fluctuation of NO2 values throughout a 102 h period.
Table 5 summarizes the key pollutant levels and provides comparison with the old-conventional burner. It is observed that NOx emissions are reduced by more than 40%, as has already been suggested. CO emissions increased during these trials, but such values are not associated with the new burner but with the operational conditions. It should be noted that the CO average values were high during the trials due to CO trips associated with inadequate fuel/air ratio control.

3.2. Biomass and Pet-Coke Fuel Mixture

Table 6 summarizes the average key pollutant levels and provides comparison with the 100% pet coke case and the April–June 2021 initial trial that was conducted before replacing the fuel feeding system.
Figure 7 gives the SO2 and NO2 variation during the biomass/pet coke fuel mixture trial. Comparison of the biomass utilization with the 100% pet coke utilization demonstrates significant merits: reduction of SO2 concentration by 47% and a further NO2 reduction of 21%.
This reduction comes on top of the reduction achieved by the LNB (in total 61%). Note that the significant SO2 reduction reduces the load of the desulfurization unit and the associated processing costs, while the further NO2 reduction enables operation without deNOx requirements (max allowable NOx emissions <1500 mg/Nm3, Table 7). The CO emissions are reduced but are still high, as reported for 100% pet coke. The issue can be remedied with typical CO trip prevention measures and poses no risk to the application of the proposed solution.

3.3. Fuel Analysis Results

As already mentioned, GM uses pet coke as fuel while adding small amounts of wood chips to some processes. The type of biomass chosen to substitute part of the fossil fuel is the sunflower husk pellets. The following figure shows the fuel storage silos (8a for petcoke, 8b for sunflower husk pellets and 8c for mixed fuel) and a sample of the mixture of pet coke and biomass (Figure 8d) that is used as the final fuel in the current co-firing trials.

3.3.1. Pet Coke Analysis

Thorough analysis of pet coke proved that it is a fuel with high-energy content and low percentages of moisture, ash, and volatile matter. Its composition contains a large percentage of carbon (C), while the percentages of nitrogen (N) and sulfur (S) content are relatively high. Table 8 summarizes the results of the laboratory pet coke analysis. Methods and standards that were followed for the correct and effective laboratory analysis have been previously presented in Table 1.
Regarding pet coke used in the experimental process, its humidity was measured at 0.37%, ash at 0.5%, and volatiles at 13.77%. Carbon (C) was measured at 83.57%, and hydrogen (H) at 5.05%. The Higher Heating Value (HHV) was 8479.5 cal/g (35.48 MJ/kg) as received. Pet coke is a type of fuel with properties that can vary depending on the raw materials and the production process.
However, in order to estimate the values’ fluctuation for important properties, some recently published studies, where thermogravimetric analysis was conducted, were accessed. The analyzed studies refer to different scientific fields and have different backgrounds so that the results could be considered more objective. The following Table 9 lists the studies used and presents the respective properties of the fuels used in each case.
According to the above references, the moisture content of pet coke ranges between 0.67% and 1.58%, while that of ash ranges between 0.26% and 6.24%, and the volatile matter ranges between 7.99% and 13%. Regarding the chemical composition of the fuel, the literature states that carbon (C) has values between 81.57% and 91.63%, and hydrogen (H) has values between 3% and 6.02%. Finally, the Higher Heating Value (HHV) ranges between 33.2 and 35.72 MJ/kg.

3.3.2. Sunflower Husk Pellets Analysis

For sunflower husk pellets, a very detailed analysis was performed where energy content was evaluated, the percentages of moisture, ash, and volatile matter were identified, and the content of carbon, nitrogen, sulfur, and other minor and major elements were determined. Finally, the ash melting behavior was examined. Table 10 represents the results of the laboratory analysis.
Sunflower husk pellets, used to substitute a part of the fuel, had a moisture content of 5.5%, an ash content of 3.5%, and volatile matter of 75.4%. According to the international literature [50], the humidity of sunflower husk pellets corresponds to about 8.5%, the ash content is close to 2.8%, and the volatile matter is estimated at about 80%. Regarding the chemical composition of sunflower husk pellets, it was measured that carbon (C) rises to 50.58% and hydrogen (H) to 6.74%. Similar values are found in the literature [31], where carbon (C) is estimated at 50.90% and hydrogen (H) at 5.60%. The Higher Heating Value (HHV) was measured in the laboratory at 4421.8 cal/gr (18.50 MJ/kg) as received and 4770.8 cal/gr (19.96 MJ/kg) on a dry basis. The corresponding values, according to the literature [31], are 18.14 MJ/kg and 19.85 MJ/kg.

3.3.3. Wood Chip Analysis

A corresponding thorough analysis with the one that was performed for sunflower husk pellets was also carried out for the wood chips. Table 11 represents the results of the laboratory analysis.
The woodchips, used to contribute to the process of decomposition, had a moisture content of 3.7%, an ash content of 1.5%, and volatile matter equal to 79.3%. According to the international literature [51], the humidity of woodchips corresponds to about 3%, the ash content is close to 0.9%, and the volatile matter is estimated at about 83%. Regarding the chemical composition of woodchips, it was measured that carbon (C) rises to 51.13% and hydrogen (H) to 5.86%. Similar values are found in the literature [32], where carbon (C) is estimated at 49.60% and hydrogen (H) at 6%. The Higher Heating Value (HHV) was measured in the laboratory at 4690.1 cal/gr (19.62 MJ/kg) as received and 2733.4 cal/gr (11.44 MJ/kg) on a dry basis. The corresponding value, according to the literature [32], is 19.04 MJ/kg a.r.

3.3.4. Mixed Fuel Analysis

The homogenized fuel mixture (pet coke and SHP) used at the second period of the experimental process in the co-firing process, quantitatively, consists of 32.26% pet coke and 67.74% biomass per weight. Biomass, as has been clarified before, consists exclusively of sunflower husk pellets. It should also be noted that despite the fact that the ratio of masses of pet coke and biomass is 1 to 2, in terms of energy contribution the ratio is 1 to 1. The following Table 12 presents the results of the laboratory analysis for mixed fuel.
The mixed fuel (sunflower husk pellets and pet coke) was analyzed for its main properties. Humidity was measured at 4.2%, ash at 5.1%, and volatiles at 38.6%. Carbon (C) was estimated at 70.66% and hydrogen (H) at 4.61%. The Higher Heating Value (HHV) reached 6419.1 cal/g as received.
The substitution of part of the fuel with sunflower husk pellets, although it did not affect the regular and efficient operation of the production process, greatly affected the characteristics of the final fuel fed into the LNB. Obviously, its calorific value decreased because of the reduction of the percentage of carbon content (C) from 83.57% to 70.66%. In addition, humidity, ash percentage, and volatile matter increased without creating any problems. Finally, the percentage of sulfur (S) and chlorine (Cl) content is significantly reduced, while to the lowest extent, the percentage of nitrogen (N) is also reduced, which is also reflected in the reduction of the corresponding NOx and SOx emissions.

3.3.5. Ash Index Calculation

The behavior of ash and its tendency to form deposits during combustion is estimated using empirical indicators. Empirical indicators, despite the limitations in their application due to the complex process of combustion chamber simulation, are very widespread and are the most common way, along with testing in pilot units, in taking decisions regarding the potential of fuel utilization. The slagging index Rs takes into account the ash melting temperatures (measured according to CEN/TS 15370-1 or ASTM D 1857-03) and indicates the ash behavior within the boilers during combustion. This index is calculated as a weighted average of hemisphere (HT) and deformation temperature (DT) through the following formula proposed by Gray and Moore [52]:
R s = 4 × D T + H T 5
The above index directly correlates the slagging tendency of (mostly lignitic type) ash with experimental measurements, for example, the characteristic temperatures measured during the ash fusibility analysis. The above ash fusibility index was proposed in order to take the temperature range into account. This index is considered as one of the most promising indices for biomass, with a close correspondence to the real ash melting behavior of fuels [53,54,55,56]. The higher the Rs index, the less the tendency to form deposits that are difficult to remove. Typically, the limit values for this index are as follows:
  • Rs > 1340 °C, → low trend for deposit formulation
  • 1250 °C < Rs <1340 °C → medium trend for deposit formulation
  • 1150 °C < Rs <1250 °C → high trend for deposit formulation
  • Rs < 1150 °C → very high trend for deposit formulation
The results of the ash index calculation for sunflower husk pellets, wood chips, and the mixture of sunflower husk pellets and pet coke are presented in Table 13.
According to the measured ash melting temperatures and calculation of the Rs index, the mixture of sunflower husk pellets with pet coke, used during the experimental campaign of GM, presents a medium trend for deposit formulation, a fact that needs to be considered carefully by the company in combination with the assessment of actual deposit formulation after a long time of kiln operation.

3.4. Life Cycle Assessment Results

This section provides the ecological results and life cycle impacts quantified for the production of 1 ton of MgO for CCM as well as for DBM. First, the BAU case is evaluated. Second, the developed scenarios by implementing diverse biomass resources and integrating renewable power sources are calculated and presented. Finally, the relative savings compared to the BAU case are outlined.

3.4.1. Environmental Assessment for CCM Production

The GWP for the BAU CCM case amounts to 2.24 tons of CO2eq per ton MgO (Figure 9). The most influencing factors are the decomposition of MgCO3 and the carbon released by the combustion of pet coke. The GWP induced by the electricity consumption plays only a minor role. In comparison, the GWP of the best case scenario (BCB OK scenario) amounts only to 1.51 tons of CO2eq. It becomes obvious that the GWP resulting from the MgCO3 decompositions stays the same and cannot be avoided based on technical measures except carbon capture, whereas the GWP of the kiln, and especially of the calcination zone, decreases enormously by using carbon-neutral biomass instead of carbon-rich pet coke. The low GWP resulting from the use of biomass results from the clustering, collection, chipping, pelletizing, and transportation steps. The higher the substitution rate in the kiln and calcination zone, the more it becomes relevant, but, overall, it still plays a minor role compared to the other more essential factors. For the kiln zone, the GWP from biomass is hardly noticeable in the figure based on its low contribution.
The GWP savings in the different scenarios, compared to the BAU case, are a result of using biomass in the kiln and calcination zone or/and integrating renewable electricity sources to cover electricity demand. The integration of RES electricity only leads to GWP savings of 2.5%. However, the integration of biomass resources, in a best case scenario (BCB OK), can lead to savings up to 32.5%. The negative values, thus meaning that there is an increase in emissions, results from the fact that in the BAU case no biomass is considered.
Due to the fact that the MgCO3 decomposition and pet coke combustion release a high share on CO2 emissions in all scenarios, the implementation of carbon capture storage (CCS) and carbon capture utilization (CCU) technologies can be a further solution to reduce the ecological footprint of MgO production [57]. Whereas the emissions from pet coke combustion can be reduced by substituting it with biomass, the decomposition of MgCO3 is still and will remain responsible for around 1 ton of CO2 per ton of MgO production. However, the implementation of CCS or CCU technologies is not considered within the LCA of CCM.

3.4.2. Environmental Assessment for DBM Production

The GWP for the BAU DBM case amounts to 2.65 tons of CO2eq per ton MgO (Figure 10). The most influencing factors are again the decomposition of MgCO3 and the carbon released by the combustion of pet coke. The GWP induced by the electricity consumption plays again only a minor role. In comparison, the GWP of the best scenario (BCB OK scenario) amounts only to 1.64 tons of CO2eq. It becomes again obvious that the GWP resulting from the MgCO3 decompositions stays the same, whereas the GWP of the kiln, and especially of the calcination zone, decreases enormously by using carbon-neutral biomass instead of carbon-rich pet coke.
The comparison with the BAU case shows again that the electricity mix leads only to 2.1% savings in GWP emissions. An additional substitution of pet coke with biomass in the kiln and calcination can lead in a best case scenario (BCB OK) up to 38.2%. This is substantial considering the fact that a high proportion of non-reducible emissions results from the mineral-bound CO2. Analogously for CCM, the integration of CCS and CCU is not considered within the LCA of DBM.

3.4.3. Cost Analysis

Estimating production cost is a difficult process as it involves many variables, such as the prices of raw materials, CO2 tariffs, and other factors. Considering all this and choosing to use the current prices (Pet-coke = EUR 294/ton, CO2 tariff = EUR 82.37/ton and SHP = EUR 190/ton), a brief economic analysis was made regarding the practical application of the pet coke and biomass co-firing technology at the GM demo site. The production cost for the operation of the unit with the exclusive use of fossil fuels amounts up to EUR 12 million. The substitution of 50% with SHP reduces this cost down to EUR 11 million. In conclusion, the substitution of 50% of pet coke with SHP reduces the production cost by 9.75%.
In addition, based on evaluated local biomass sources such as wood chips (approximately EUR 86/t; 9.7 GJ/t), sunflower husk pellets (approximately EUR 190/t; 16.6 GJ/t), olive kernels (approximately EUR 57/t; 17.6 GJ/t), and wood saw dust (approximately EUR 86/t; 11.3 GJ/t), production cost could be lowered with biomass substitution of pet coke fuel (approximately EUR 294/t; 34.4 GJ/t) already at current CO2 price. The higher the substitution at low fuel costs, the higher the profit for both emissions and cost reduction. A scenario based evaluation provided evidence for encouraged biomass fuel use in the production process to become sustainable and resilient against future increased CO2 prices.

4. Conclusions

The implementation of new, innovative processes that contribute to the reduction of emitted pollutants is a requirement for every industry. GM, with the implementation of the LNB system, drastically reduced (over 40%) NOx emissions. At the same time, by substituting part of the fuel (pet coke) with biomass (SHP), NOx emissions were further reduced by 21%, while SOx and CO were reduced by 20% and 13%, respectively. The ratio of substitution was 2 to 1 by weight, which corresponds to a contribution of biomass to the energy potential of the final fuel that reaches 50%. Mixing the fuel with biomass varied its characteristics, reducing its calorific value and increasing the percentage of moisture and ash, which, however, did not create any problems in the operation and efficiency of the burner. However, the calculation of an empirical ash fusibility index (Rs) showed that mixture of pet coke with sunflower husk pellets presents a medium trend for deposit formulation, a fact that needs to be considered carefully by the company in combination with the assessment of actual deposit formulation after a long time of kiln operation.
The conducted comparison via life cycle assessment for 1 ton of MgO revealed that for both CCM (2.24 ton of CO2eq) and DBM (2.65 ton of CO2eq), the most influencing GWP factors are the decomposition of MgCO3 and the carbon released by the combustion of pet coke. It turned out that the substitution of the fuel by biomass and the use of renewable electricity can significantly reduce both the emissions of gaseous pollutants and the general environmental footprint of the MgO production. In a best case scenario, emissions can be decreased by 32.5% for CCM to 1.51 ton of CO2 and by 38.2% for DBM to 1.64 ton of CO2 per ton of MgO. The MgCO3 decomposition process releases an essential and unavoidable amount of CO2 naturally bound in the mineral complexes. In addition, the combustion of pet coke still releases a high share on total CO2 emissions. However, the scenario-based evaluation of different biomass mixtures and resources provided evidence for encouraging biomass fuel use in the production process to become sustainable and resilient against future increased CO2 prices. The implementation of CCS and CCU technologies can be an additional option to lower the ecological footprint of produced MgO to reduce the actual significant environmental impact of global magnesium production [58].
The effective application of co-firing technologies, especially in such operating conditions, is a big step towards reducing the emissions of industry sector while at the same time proving that the use of fossil fuels can be reduced without altering the functionality and efficiency of processes that require large amounts of energy, extremely high temperatures, and high quality of final products. The further substitution of pet coke with biomass (perhaps the complete substitution) as well as the development of more environmentally friendly burners are a subject of further study but also an attractive target for GM and corresponding industries in the magnesia sector.

Author Contributions

Conceptualization, N.M., C.E.; methodology, C.E., H.Y., S.P.; validation, H.Y., P.P., P.G., J.L.; formal analysis, N.M., H.Y., P.G.; investigation, N.M., H.Y., P.P., S.P., J.L.; resources, P.P., H.Y.; writing—original draft preparation, C.E., N.M., S.P.; writing—review and editing, N.M., H.Y., J.L.; visualization, C.E., S.P.; supervision, N.M., P.G.; project administration, P.G.; funding acquisition, P.G. All authors have read and agreed to the published version of the manuscript.

Funding

This work was funded by Project entitled “Boosting new Approaches for flexibility Management by Optimizing process Off-gas and waste use” (BAMBOO). This project has received funding from the European Union’s Horizon 2020 research and innovation program under grant agreement No 820771.

Institutional Review Board Statement

Not applicable.

Informed Consent Statement

Not applicable.

Data Availability Statement

Not applicable.

Acknowledgments

The authors acknowledge Yerakini Mines and Works, Grecian Magnesite S.A. (GM) for providing the samples and giving permission to publish this article.

Conflicts of Interest

The authors declare no conflict of interest. The funders had no role in the design of the study; in the collection, analyses, or interpretation of data; in the writing of the manuscript; or in the decision to publish the results.

Appendix A

Table A1. Information about lab instrumentation.
EquipmentModel/TypeApplicationsManual/Information
110 litre furnace, with natural air circulation Τmax = 250 °CHeraeus Thermo Scientific
T-12 drying oven with natural convection
Drying of solids, evaporation of liquids (Proximate Analysis of solid fuels: % moisture)https://www.pi.infn.it/wp-content/uploads/2021/07/productPDF_31123.pdf (accessed on 22 February 2022).
Shell CalorimeterPARR 6400CL isoperibol calorimeterIsoperibol calorimeter for finding higher calorific value of fuelshttps://www.parrinst.com/products/oxygen-bomb-calorimeters/6400-automatic-isoperibol-calorimeter/ (accessed on 22 February 2022).
Elementary Analyser (C, H, N, S)Perkin Elmer Series II CHNS/O AnalyzerElementary analysis (% C, H, N, S) in solid and liquid fuelshttps://resources.perkinelmer.com/corporate/cmsresources/images/44-74656prd_2400seriesiichnsoanalyzer.pdf (accessed on 22 February 2022).
Atomic AbsorptionShimadzu AA-6300 Atomic Absorption Spectrophotometer with GFA-EX7i Graphite Furnace Atomizer.Measurement of major and trace elements (heavy toxic metals: Sb, As, Cd, Cr, Co, Cu, Pb, Mn, Hg, Ni, Tl, V) in liquid and solid sampleshttps://uotechnology.edu.iq/NTRC/root/PDF/equipments/AA-6300.pdf (accessed on 22 February 2022).
Microwave digesterBerghof SW-2Digestion of samples before measurement of metals in atomic absorptionhttps://www.somatco.com/MWS-2_Digestion.pdf (accessed on 22 February 2022).
Ash FusingAsh fusing analyser SYLAB IF2000 Automatic instrument for determination of ash fusion points by image analysishttp://www.jjexotranoz.com/sylab/if2000.php (accessed on 22 February 2022).
Flue gas analyzerSICK’s MCS100FT FTIR analyzer systemMonitoring of SO2, NO2, CO, HCl, HF, H2O and TOC, O2, and dust.https://cdn.sick.com/media/docs/4/74/674/Product_information_MCS100FT_FTIR_Analysis_System_en_IM0018674.PDF (accessed on 22 February 2022).
Flue gas analyzerVarioplus Industrial by MRUSimultaneous measurement
of up to
9 gas components
https://www.instrumart.com/assets/VARIO-Plus-Datasheet.pdf (accessed on 22 February 2022).

References

  1. Dong, K.; Dong, X.; Jiang, Q. How renewable energy consumption lower global CO2 emissions? Evidence from countries with different income levels. World Econ. 2020, 43, 1665–1698. [Google Scholar] [CrossRef]
  2. Bruyn, S.; Jongsma, C.; Kampman, B.; Gorlach, B.; Thie, J.E. Energy-intensive industries: Challenges and opportunities in energy transition, Policy Department for Economic. Sci. Qual. Life Policies 2020, PE 652.717. [Google Scholar] [CrossRef]
  3. Salunkhe, P.B.; Krishna, D.J. Investigations on latent heat storage materials for solar water and space heating applications. J. Energy Storage 2017, 12, 243–260. [Google Scholar] [CrossRef]
  4. IEA–International Energy Agency. Key World Energy Statistics; IEA: Paris, France, 2021. [Google Scholar]
  5. IEA–International Energy Agency. CO2 Emissions from Fuel Combustion Report; IEA: Paris, France, 2018. [Google Scholar]
  6. IEA–International Energy Agency. World Energy Outlook; IEA: Paris, France, 2021. [Google Scholar]
  7. Houshfar, E.; Løvås, T.; Skreiberg, Ø. Experimental Investigation on NOx Reduction by Primary Measures in Biomass Combustion: Straw, Peat, Sewage Sludge, Forest Residues and Wood Pellets. Energies 2012, 5, 270–290. [Google Scholar] [CrossRef] [Green Version]
  8. Chen, J.; Li, C.; Ristovski, Z.; Milic, A.; Gu, Y.; Islam, M.S.; Wang, S.; Hao, J.; Zhang, H.; He, C.; et al. A review of biomass burning: Emissions and impacts on air quality, health and climate change in China. Sci. Total Environ. 2017, 579, 1000–1034. [Google Scholar] [CrossRef] [PubMed] [Green Version]
  9. Shao, Y.; Wang, J.; Preto, F.; Xu, J.Z.C. Ash Deposition in Biomass Combustion or Co-Firing for Power/Heat Generation. Energies 2012, 5, 5171–5187. [Google Scholar] [CrossRef]
  10. Zajemska, M.; Urbańczyk, P.; Poskart, A.; Urbaniak, D.; Radomiak, H.; Musiał, D.; Golański, G.; Wyleciał, T. The impact of co-firing sunflower husk pellets with coal in a boiler on the chemical composition of flue gas. Energy Fuels 2016, 14, 02021. [Google Scholar] [CrossRef] [Green Version]
  11. Cătuţi, M.; Elkerbout, M.; Alessi, M.; Egenhofer, C. Biomass and Climate Neutrality. CEPS Policy Insights. 2020. Available online: https://www.sipotra.it/wp-content/uploads/2020/09/BIOMASS-AND-CLIMATE-NEUTRALITY.pdf (accessed on 14 February 2022).
  12. Frolov, S.M. Organic Waste Gasification: A Selective Review. Fuels 2021, 2, 556–650. [Google Scholar] [CrossRef]
  13. Castro, C.; Fraga, L.; Ferreira, E.; Martins, J.; Ribeiro, P.; Teixeira, J.C. Experimental Studies on Wood Pellets Combustion in a Fixed Bed Combustor Using Taguchi Method. Fuels 2021, 2, 376–392. [Google Scholar] [CrossRef]
  14. Sahoo, K.; Alanya-Rosenbaum, S.; Bergman, R.; Abbas, D.; Bilek, E.M. Environmental and Economic Assessment of Portable Systems: Production of Wood-Briquettes and Torrefied-Briquettes to Generate Heat and Electricity. Fuels 2021, 2, 345–366. [Google Scholar] [CrossRef]
  15. Mansour, F.A.; Zuwala, J. An evaluation of biomass co-firing in Europe. Biomass Bioenergy 2010, 34, 620–629. [Google Scholar] [CrossRef]
  16. Ronia, M.S.; Chowdhuryb, S.; Mamunc, S.; Marufuzzamanb, M.; Leind, W.; Johnson, S. Biomass co-firing technology with policies, challenges, and opportunities: A global review. Renew. Sustain. Energy Rev. 2017, 78, 1089–1101. [Google Scholar] [CrossRef]
  17. Kotasinska, S.B. The Scandinavian Third Way as a Proposal for Sustainable Smart City Development—A Case Study of Aarhus City. Sustainability 2022, 14, 3495. [Google Scholar] [CrossRef]
  18. Agbor, E.; Zhang, X.; Kumar, A. A review of biomass co-firing in North America. Renew. Sustain. Energy Rev. 2014, 40, 930–943. [Google Scholar] [CrossRef]
  19. Alizadeh, P.; Tabil, L.G.; Adapa, P.K.; Cree, D.; Mupondwa, E.; Emadi, B. Torrefaction and Densification of Wood Sawdust for Bioenergy Applications. Fuels 2022, 3, 152–175. [Google Scholar] [CrossRef]
  20. Marcantonio, V.; Bocci, E.; Ouweltjes, J.P.; Del Zotto, L.; Monarca, D. Evaluation of sorbents for high temperature removal of tars, hydrogen sulphide. hydrogen chloride and ammonia from biomass-derived syngas by using Aspen Plus. Int. J. Hydrogen Energy 2019, 45, 6651–6662. [Google Scholar] [CrossRef]
  21. Moon, J.; Jo, W.; Jeong, S.; Bang, B.; Choi, Y.; Hwang, J.; Lee, U. Gas cleaning with molten tin for hydrogen sulfide and tar in producer gas generated from biomass gasification. Energy 2017, 130, 318–326. [Google Scholar] [CrossRef]
  22. Dăncilă, A.M.; Căprărescu, S.; Bobiricǎ, C.; Purcar, V.; Gârleanu, G.; Vasile, E.; Modrogan, C.; Borda, C.; Dobrotǎ, D. Optimization of the Technological Parameters for Obtaining Zn-Ti Based Composites to Increase the Performance of H2S Removal from Syngas. Processes 2020, 8, 562. [Google Scholar] [CrossRef]
  23. Motta, I.L.; Miranda, N.T.; Filho, R.M.; Maciel, M.R.W. Biomass gasification in fluidized beds: A review of biomass moisture content and operating pressure effects. Renew. Sustain. Energy Rev. 2018, 94, 998–1023. [Google Scholar] [CrossRef]
  24. Opydoa, M.; Dudeka, A.; Kobyłeckib, R. Characteristics of solids accumulation on steel samples during cocombustion of biomass and coal in a CFB boiler. Biomass Bioenergy 2019, 120, 291–300. [Google Scholar] [CrossRef]
  25. Silvennoinen, J.; Hedman, M. Co-firing of agricultural fuels in a full-scale fluidized bed boiler. Fuel Process. Technol. 2013, 105, 11–19. [Google Scholar] [CrossRef]
  26. Kułazynski, M.; Jabłonski, S.; Kaczmarczyk, J.; Swiatek, L.; Pstrowska, K.; Łukaszewicz, M. Technological aspects of sunflower biomass and brown coal co-firing. J. Energy Inst. 2018, 5, 668–675. [Google Scholar] [CrossRef]
  27. Heidelberg Cement, Sustainability Report 2021. Available online: https://www.heidelbergcement.com/en/sustainability-report (accessed on 14 February 2022).
  28. LafargeHolcim Integrated Annual Report 2020. Available online: https://www.holcim.com/sites/holcim/files/documents/26022021-finance-lafageholcim_fy_2020_report-full-en.pdf (accessed on 15 February 2022).
  29. Umweltbundesamt Stand der Technik zur Kalk, Gips und Magnesiaherstellung, Beschreibung von Anlagen in Österreich. 2017. Available online: https://www.umweltbundesamt.at/fileadmin/site/publikationen/REP0128.pdf (accessed on 14 February 2022).
  30. Joint Research Centre; Institute for Prospective Technological Studies; Kourti, I.; Delgado Sancho, L.; Schorcht, F.; Scalet, B.; Roudier, S. Best Available Techniques (BAT) Reference Document for the Production of Cement, Lime and Magnesium Oxide: Industrial Emissions Directive 2010/75/EU (Integrated Pollution Prevention and Control), Publications Office. 2013. Available online: https://data.europa.eu/doi/10.2788/12850 (accessed on 12 January 2022).
  31. Available online: https://www.grecianmagnesite.com/ (accessed on 7 February 2022).
  32. Available online: http://bambooproject.eu/ (accessed on 3 February 2022).
  33. International Organization for Standardization ISO 14040:2006-Environmental Management-Life Cycle Assessment-Principles and Framework, 2006. Available online: https://www.iso.org/standard/37456.html (accessed on 8 February 2022).
  34. Klöpffer, W.; Grahl, B. Life Cycle Assessment (LCA): A Guide to Best Practice; Wiley-VCH: Weinheim, Germany, 2014; ISBN 978-3-527-32986. Available online: http://onlinelibrary.wiley.com/book/10.1002/9783527655625 (accessed on 8 February 2022).
  35. Guine, J. Life Cycle Sustainability Assessment: What Is It and What Are Its Challenges. In Taking Stock of Industrial Ecology; Clift, R., Druckman, A., Eds.; Springer: Cham, Switzerland, 2016. [Google Scholar] [CrossRef] [Green Version]
  36. Guinee, J.B. Handbook on life cycle assessment operational guide to the ISO standards. Int. J. LCA 2002, 7, 311–313. [Google Scholar] [CrossRef]
  37. Cooper, J.S. Specifying functional units and reference flows for comparable alternatives. Int. J. LCA 2003, 8, 337–349. [Google Scholar] [CrossRef]
  38. Li, J.; Zhang, Y.; Shao, S.; Zhang, S. Comparative life cycle assessment of conventional and new fused magnesia production. J. Clean. Prod. 2015, 91, 170–179. [Google Scholar] [CrossRef]
  39. Directive (EU) 2018/2001 of the European Parliament and of the Council of 11 December 2018 on the Promotion of the Use of Energy from Renewable Sources. Available online: http://data.europa.eu/eli/dir/2018/2001/oj (accessed on 13 January 2022).
  40. European Commission; Joint Research Centre; Agostini, A.; Marelli, L.; Edwards, R.; Marelli, L.; Padella, M.; O’Connell, A. Solid and Gaseous Bioenergy Pathways: Input Values and GHG Emissions: Calculated According to the Methodology Set in COM(2016) 767, Publications Office. 2017. Available online: https://data.europa.eu/doi/10.2790/27486 (accessed on 8 February 2022).
  41. European Commission. Reference Document for the Production of Cement, Lime and Magnesium Oxide; European Commission: Brussels, Belgium; Luxembourg, 2013; Available online: https://eippcb.jrc.ec.europa.eu/sites/default/files/2019-11/CLM_Published_def_0.pdf (accessed on 8 February 2022). [CrossRef]
  42. Nakhaei, M.; Wu, H.; Grévain, D.; Jensen, L.S.; Glarborg, P.; Johansen, K.D. CPFD simulation of petcoke and SRF co-firing in a full-scale cement calciner. Fuel Process. Technol. 2019, 196, 106153. [Google Scholar] [CrossRef]
  43. Ngadi, Z.; Lahlaouti, M.L. CFD modeling of petcoke co-combustion in a realcement kiln: The effect of the turbulence-chemistry interaction model applied with K-ε variations. Int. Rev. Appl. Sci. Eng. 2021, 13, 148–163. [Google Scholar] [CrossRef]
  44. Prabhakaran, S.; Swaminathan, G.; Joshi, V.V. Thermogravimetric analysis of hazardous waste: Pet-coke, by kinetic models and Artificial neural network modeling. Fuel 2021, 287, 119470. [Google Scholar] [CrossRef]
  45. Liu, M.; Shen, Z.; Liang, O.; Xu, J.; Liu, H. In situ experimental study of CO2 gasification of petcoke particles on molten slag surface at high temperature. Fuel 2021, 285, 119158. [Google Scholar] [CrossRef]
  46. Wang, Y.; Li, X.; Wendt, J.O.L. On ash deposition rates from air- and oxy-combustion of pulverized coal, petroleum coke and biomass. Energy Fuels 2019, 33, 5849–5858. [Google Scholar] [CrossRef]
  47. Bourtsalas, A.C.; Zhang, J.; Castaldi, M.J.; Themelis, N.J.; Karaiskakis, A.N. Use of non-recycled plastics and paper as alternative fuel in cement production. J. Clean. Prod. 2018, 181, 8–16. [Google Scholar] [CrossRef]
  48. Ba, Z.; Zhao, J.; Li, C.; Huang, J.; Fang, Y.; Zhang, L.; Kong, L.; Wang, Q. Developing efficient gasification technology for high-sulfur petroleum coke to hydrogen-rich syngas production. Fuel 2020, 267, 117170. [Google Scholar] [CrossRef]
  49. Gamero, M.P.; Díaz, J.L.; Valverde, J.L.; Silva, L.S.; Sánchez, P. Dolomite effect on steam co-gasification of olive pomace, coal and petcoke: TGA-MS analysis, reactivity and synergistic effect. Fuel 2018, 234, 142–150. [Google Scholar] [CrossRef]
  50. Available online: https://phyllis.nl/Browse/Standard/ECN-Phyllis#sunflower%20husk%20pellets (accessed on 22 February 2022).
  51. Available online: https://phyllis.nl/Browse/Standard/ECN-Phyllis#wood%20chips (accessed on 22 February 2022).
  52. Gray, R.J.; Moore, G.F. Burning the Sub-Bituminous Coals of Montana and Wyoming in Large Utility Boilers; ASME paper; American Society of Mechanical Engineers: New York, NY, USA, 1974; p. 74-WA/FU-1. [Google Scholar]
  53. Karampinis, E.; Vamvouka, D.; Sfakiotakis, S.I.; Panagiotis, G.; Itskos, G.; Kakaras, E. A comparative study of combustion properties of five energy crops and greek lignite. Energy Fuels 2012, 26, 869–878. [Google Scholar] [CrossRef]
  54. Mclennan, A.R.; Bryant, G.W.; Bailey, C.W.; Stanmore, B.R.; Wall, T.F. Index for iron-based slagging for pulverized coal firing in oxidizing and reducing conditions. Energy Fuel 2000, 14, 349–354. [Google Scholar] [CrossRef]
  55. Frandsen, F. Empirical Prediction of Ash Deposition Propensities in Coal-Fired Utilities; Department of Chemical Engineering, Technical University of Denmark: Lyngby, Denmark, 1997. [Google Scholar]
  56. Maraver, A.G.; Sanchez, J.M.; Carpio, M.; Jimenez, J.A.P. Critical review of predictive coefficients for biomass ash deposition tendency. J. Energy Inst. 2017, 90, 214–228. [Google Scholar] [CrossRef]
  57. IEA. Energy Technology Perspectives 2020, Special Report on Carbon Capture Utilisation and Storage, CCUS in clean energy transition. 2020. Available online: https://www.iea.org/reports/energy-technology-perspectives-2020 (accessed on 28 February 2022).
  58. Golroudbary, S.R.; Makarava, I.; Kraslawski, A. Environmental Assessment of Global Magnesium Production. Miner. Process. Extr. Metall. Rev. 2022, 1–18. [Google Scholar] [CrossRef]
Figure 1. GMs calcination plant.
Fuels 03 00039 g001
Figure 2. GM’s general production flowsheet.
Fuels 03 00039 g002
Figure 3. Biomass at GM: Co-firing mode.
Fuels 03 00039 g003
Figure 4. Biomass at GM: Co-feeding with raw magnesite.
Fuels 03 00039 g004
Figure 5. The new fuel mix preparation and feed system for Rotary Kiln No. 3. The part under the red line refers to the new installation.
Fuels 03 00039 g005
Figure 6. NO2 pollutant concentration in flue gases during 100% pet-coke trial. NOx trial average is 980 mg/Nm3 at 10% O2.
Fuels 03 00039 g006
Figure 7. SO2 and NO2 concentration of the flue gases at kiln exit during the 5-day trial (February 2022).
Fuels 03 00039 g007
Figure 8. Pictures of fuels used during experimental campaign (a) pet coke, (b) sunflower husk pellets, (c) wood chips, and (d) sample of mixed fuel (sunflower husk pellets and pet coke).
Fuels 03 00039 g008
Figure 9. GWP of 1 ton of CCM MgO (upper figure) and relative GWP savings against business-as-usual scenario (lower figure) based on scenario description of Table 4.
Fuels 03 00039 g009
Figure 10. GWP of 1 ton of DBM MgO (upper figure) and relative GWP savings against business-as-usual scenario (lower figure) based on scenario description of Table 4.
Fuels 03 00039 g010
Table 1. Laboratory tests and standards.
Laboratory Tests and Standards for Fuel AnalysisLaboratory Tests and Standards for Biomass Analysis
TestingStandardTestingStandard
Collection and preparation of samplesASTM D346/D346M-11Collection and preparation of samplesISO 14780
Test method for total moistureASTM D 3302, ASTM D 7582Test method for total moistureISO 18134-1
Moisture/ash volatilesASTM D 7582, ASTM D 3174Moisture/ash volatilesISO 18134-3, ISO 18122, ISO 18123
Elemental analysis (CHN)ASTM D 5373Elemental analysis (CHN)ISO 16948
Sulfur analysisASTM D 3177Sulfur and chlorine analysisISO 16994, ASTM D 516
Chlorine analysisASTM D 4208Gross calorific valueISO/DIS 18125
Gross calorific valueASTM D 5865Ash fusibilityCEN/TS 15370-1
Ash fusibilityASTM D 1857-03Mechanical durabilityISO 17831-1
Bulk densityISO 17828
Major elementsISO 16967
Minor elementsISO 16968
Table 2. Main LCI parameters of MgO production plant [33].
ParameterCCMDBMUnit
inputs
MgCO3147104kt/a
electricity demand288288MJ/tMgO
thermal energy kiln zone2.042.04GJ/tMgO
thermal energy calcination zone8.111.6GJ/tMgO
substitution of thermal energy in kiln zone with biomass0–100–10%
substitution of thermal energy in calcination zone with biomass0–700–70%
outputs
MgO6243.8kt/a
Table 3. Transportation routes and LHV of MgO production plant inputs [33].
ResourceShip [km]Ship Payload [t]Truck [km]Truck Payload [t]Truck [km]Truck Payload [t]LHVGJ/t
magnesium carbonate (MgCO3)--240.62.322-
pet coke37030002022--31.4
sunflower husk pellets (SHP)175030002022--16.56
wood saw dust (WSD)--18022--11.33
olive kernels (OK)--2022--17.64
wood chips (WC)--28024.7--9.68
pruning (PRU)--28024.7--15.00
Table 5. Old vs. new burner.
AveragesNew BurnerOld Burner
Data range (days)4.365
NO2 (mg/Nm3)980 (−41%)1670
CO (mg/Nm3)20001180
SO2, pre FGD * (mg/Nm3)47804560
Exit temperature (°C)450450–500
* FGD: Flue gas desulfurization.
Table 6. Fuel mix main trail compared with 100% pet-coke.
CaseBulk Density of ProductRaw Kiln FeedPet CokeSunflower Husk PelletResidual Fuel Wood ChipsBiomass Energy ContributionSwirl OutSwirl InSintering TemperatureSO2 Pre FGDNO2CO
g/cm3tphkg/hkg/hkg/hkg/h% ° Cmg/Nm3mg/Nm3mg/Nm3
100% Pet coke3.07–3.1814200000000.90.9158047809802000
SHP/Pet coke3.16–3.2013.71090221000500.90.9~160025307701740
Initial April–June Trials3.18–3.314–12.60–9001170–1600300–40040040–760.90.91630–1850322–1600115–872590–1700
Table 7. Emission limit values according to BAT-AEL [41] for magnesia industry.
Polluting SubstanceEmission Limit (mg/Nm3)
Dust<20–35
NOx stated as NO2<500–1500
CO<50–1000
SOx expressed as SO2<50–400 mg/Nm3 (<1500 mg/Nm3 in absence of wet scrubber)
Table 8. Pet coke analysis.
TypeValue
Proximate Analysis
Moisture (%w.b.)0.37
Ash (%d.b.)0.5
V.M. (%d.b.)13.77
Ultimate analysis and Cl
C (%d.b.)83.57
H (%d.b.)5.05
N (%d.b.)1.52
S (%d.b.)3.12
Cl (ppm d.b.)<400
Energy Content
HHV (cal/g d.b.)8603.4
HHV (cal/g a.r.)8479.5
LHV (cal/g d.b.)8345.9
LHV (cal/g a.r.)8217.4
Ash Melting Behavior
ST (°C)1127
DT (°C)1169
HT (°C)1178
FT (°C)1187
Table 9. Studies from literature review on the properties of pet coke.
C (%)H (%)O (%)S (%)N (%)VM (%)Ash Content (%)Moisture (%)HHV (kj/kg)Reference
84.73.51.351.911.82.70.933.2[42]
863.741.43.981.6210.60.581.5834.81[43]
81.573.494.0110.250.68 6.240.7335.25[44]
91.633.46 2.781.687.992.030.71 [45]
82.516.020.495.651.7110.82.99 35.72[46]
9031.22.751.458.80.751.15 [47]
88.973.612.853.431.149.80.80.6735.72[48]
82.213.117.025.51.9130.26 [49]
Table 10. Sunflower husk pellet analysis.
TypeValueTypeValue
Proximate AnalysisMajor and Minor Elements Analysis
Moisture (%w.b.)5.5Al (ppm d.b.)222.92
Ash (%d.b.)3.5Ca (ppm d.b.)4701.3
V.M. (%d.b.)75.4Fe (ppm d.b.)231.44
Ultimate analysis and ClK (ppm d.b.)7905.75
C (%d.b.)50.58Mg (ppm d.b.)2811.59
H (%d.b.)6.74Na (ppm d.b.)97.3
N (%d.b.)0.54Si (ppm d.b.)720
S (%d.b.)0.12Cd (ppm d.b.)0
Cl (%d.b.)0.12Co (ppm d.b.)7.16
Energy ContentCr (ppm d.b.)3.03
HHV (cal/g d.b.)4770.8Cu (ppm d.b.)14.4
HHV (cal/g a.r.)4421.8Ni (ppm d.b.)4.28
LHV (cal/g d.b.)4329.5Pb (ppm d.b.)1
LHV (cal/g a.r.)3958.8Zn (ppm d.b.)17.17
Ash Melting Behavior
ST (°C)707
DT (°C)928
HT (°C)>1550
FT (°C)>1550
Table 11. Wood chip analysis.
TypeValueTypeValue
Proximate AnalysisMajor and Minor Elements Analysis
Moisture (%w.b.)3.7Al (ppm d.b.)274.27
Ash (%d.b.)1.5Ca (ppm d.b.)5465.96
V.M. (%d.b.)79.3Fe (ppm d.b.)198.85
Ultimate analysis and ClK (ppm d.b.)7905.75
C (%d.b.)51.13Mg (ppm d.b.)1226.28
H (%d.b.)5.86Na (ppm d.b.)87.68
N (%d.b.)0.26Si (ppm d.b.)793.53
S (%d.b.)0.05Cd (ppm d.b.)0.11
Cl (%d.b.)0.08Co (ppm d.b.)7.16
Energy ContentCr (ppm d.b.)3.03
HHV (cal/g d.b.)4690.1Cu (ppm d.b.)2.62
HHV (cal/g a.r.)2733.4Ni (ppm d.b.)1.63
LHV (cal/g d.b.)4385.2Pb (ppm d.b.)0.24
LHV (cal/g a.r.)2312.2Zn (ppm d.b.)26.01
Ash Melting Behavior
ST (°C)1078.0
DT (°C)1357.0
HT (°C)1497.0
FT (°C)1514.0
Table 12. Mixed fuel analysis.
TypeValue
Proximate Analysis
Moisture (%w.b.)4.2
Ash (%d.b.)5.1
V.M. (%d.b.)38.6
Ultimate analysis and Cl
C (%d.b.)70.66
H (%d.b.)4.61
N (%d.b.)1.48
S (%d.b.)2.11
Cl (ppm d.b.)0.04
Energy Content
HHV (cal/g d.b.)6701.2
HHV (cal/g a.r.)6419.1
LHV (cal/g d.b.)6464.2
LHV (cal/g a.r.)6167.5
Ash Melting Behavior
ST (°C)810
DT (°C)1266
HT (°C)1340
FT (°C)1361
Table 13. Ash melting temperatures and deposit formulation trends.
SampleAsh Melting Temperatures (°C)
Shrinkage (ST)Deformation (DT)Hemisphere (HT)Flow (FT)Rs Index
Pet coke11271169117811871170.8
(high trend)
Sunflower husk pellets707928>1550>1550>1052.4
(very high trend)
Wood chips10781357149715141385
(low trend)
Mixture of SHP and pet coke8101266134013611280.8
(medium trend)
Publisher’s Note: MDPI stays neutral with regard to jurisdictional claims in published maps and institutional affiliations.

