1. Introduction
As the signs from climate change and global warming are becoming even more alarming, there is a necessity for minimization, even elimination, of the carbon footprint in energy-consuming sectors such as chemical industry and transportation [
1]. Even though the electrification of several sectors can lead to a significant reduction in GHG emissions, the decarbonization of chemical production and several kinds of transportation means, such as vehicles and aviation, can be achieved only via other sustainable ways, such as the use of non-fossil fuels based on renewable or low-carbon fuels.
Methanol is a valuable chemical with multiple applications and uses, including as an alternative fuel or as a readily transportable intermediate to other products such as olefins, gasoline and dimethyl ether (DME) [
2]. Almost 100 million tonnes of methanol per year are produced worldwide, nearly all either from natural gas or from coal [
3]. Indicatively, in China, the coal to methanol plants contribute almost 21% to the total emissions derived from the coal chemical sector [
4], and the methanol production in this country is exclusively derived from hard coal and coke oven gas [
5]. According to IRENA [
3], the global interest for methanol has dramatically increased in recent decades, and the environmental impacts will be tremendous (~1.5 Gt
CO2/y) if it is produced by natural gas and coal solely. These facts make clear that the adoption of low-carbon solutions for methanol production is more than essential [
6,
7].
Since the sustainable methanol production from renewable H
2 is not yet competitive and economically viable, a considerable part of the demand can be covered through the effective conversion of low-carbon solid fuels into methanol by means of gasification. When this is combined with CO
2 capture or reuse, the associated environmental impact further decreases. Khalafalla et al. [
8] presented various conceptual designs for coal-to-methanol pathways with CO
2 capture, revealing their improved performance in terms of energy requirements and methanol production costs of 21.9 GJ/tCH
3OH and 142.5 USD/tCH
3OH, respectively.
Another promising pathway to produce low-carbon synthetic methanol is from waste thermal valorization and especially from standardized refused derived fuels, such as solid recovered fuel (SRF), a high-quality product that has a high heating value and is usually dried and processed into pallets or balled [
9,
10]. The SRF gasification concepts attract interest for further industrial development mainly because they (a) represent a sustainable way for landfilling mitigation, (b) improve the energy security in regions such as the EU and UK that are large fossil fuel importers and (c) are an environmentally friendly option for waste management [
11,
12]. Taking into account these considerations, the valorization of either coal (or lignite) with SRF for the production of liquid fuels such as methanol is a promising option towards the production of alternative fuels with lower environmental impact. In such a concept, fluidized bed gasification technology can handle quite effectively technical issues that may occur due to the high ash and moisture content, achieving high conversion rates [
13,
14,
15,
16].
The concept of valorizing lignite and SRF together in a fluidized bed gasifier is quite new and is investigated in the European project LIG2LIQ [
17], the objective of which is the development of a viable process for the production of liquid fuels from lignite and SRF, by means of the HTW gasification technology. Under the framework of this project, Savuto et al. [
18,
19] and Gallucci et al. [
20] firstly investigated the steam/air gasification of lignite–SRF in lab-scale fluidized bed gasification units aiming at evaluating the influence on various process parameters (temperature, steam/air ratio and type of bed material) on conversion efficiency and on syngas quality. Rolfe et al. [
12] recently highlighted the economic and environmental benefits from the co-gasification of lignite and SRF for the production of methanol, revealing it as an option favorably comparable to the natural gas based configurations. Moreover, it was shown that the higher the portion of SRF is, the lower the global warming effects and the break-even selling price (BESP) are.
The selection of the HTW gasifier as the most suitable technology lies in the fact that it is one of the oldest gasification technologies and its efficient handling of both fossil-derived solid fuels and wastes has already been demonstrated in large-scale applications [
21]. As its operation is based on the fluidization principles, it can keep the gasification performance (CGE and char conversion) at a high rate (higher than those of entrained flow or plasma gasifier [
22]) under variable feedstock quality, which is very important for the present study [
23]. Moreover, unlike other types of gasifiers (i.e., dual fluidized bed), its operation under pressurized conditions (>20 bar) has been successfully demonstrated [
24].
This study offers insight on the low-carbon methanol synthesis at an industrial level. The novelty of the current paper is the investigation of SRF and lignite mixtures when they are used as feedstock for gasification-based low-carbon liquid fuels. In addition, the process integration of the whole value chain and the investigation of several design and operational parameters, such as the way tars are handled and HC accumulation at the methanol plant is avoided, are investigated, providing useful information regarding the proposed system. The involvement of feedstock with biogenic fraction (i.e., SRF) with lignite converted into a raw syngas by means of an HTW gasifier along with a Rectisol® unit for pure CO2 are novel aspects towards the advanced fuel production with reduced environmental impact. In addition, one of the potential uses of methanol is explored and an upgrading unit is evaluated for the production of advanced drop-in fuels for transportation use. The objective of the study is to present a process design tool and to evaluate how different feedstock blending ratios and design configurations affect the plant’s overall performance. Utilizing a number of indicators such as the methanol yield, oxygen and steam consumption, CO2 emissions, EFE, electrical consumption and excess heat for exploitation, a comprehensive picture of the plant’s efficiency and performance can be obtained.
2. Description of the Process
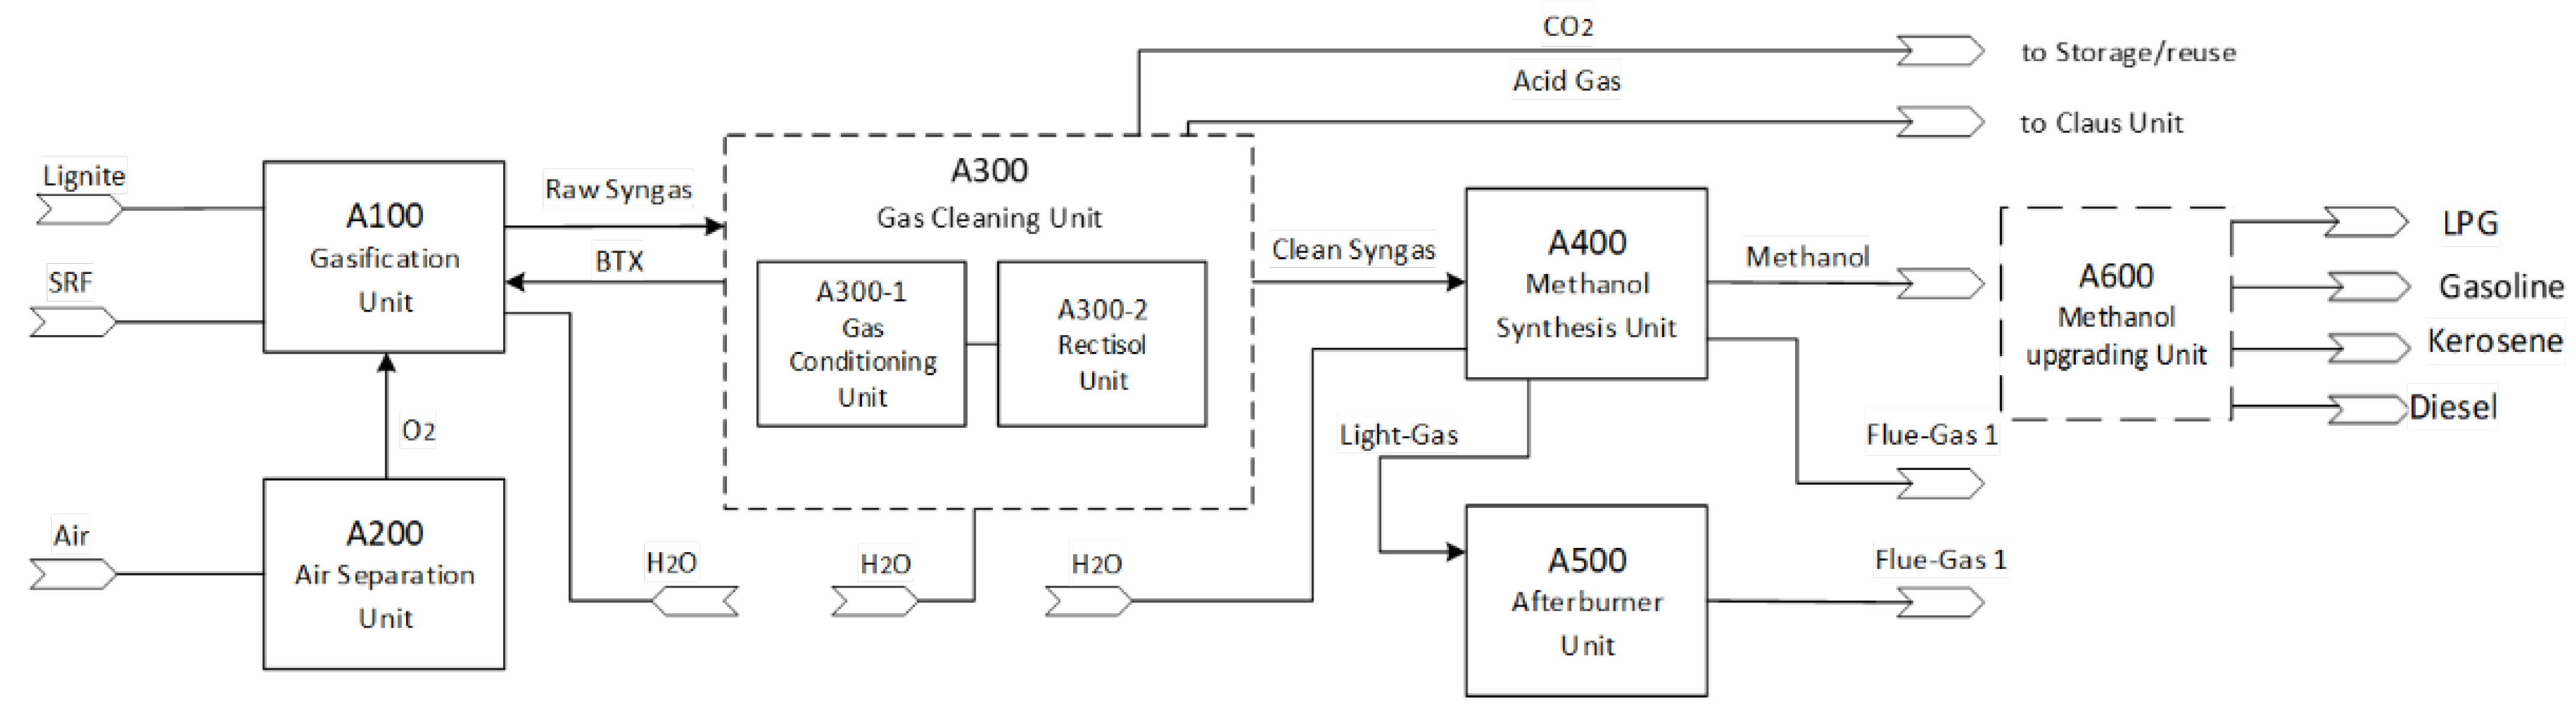
The block flow diagram depicts the integration of the selected process units for the synthetic methanol plant (
Figure 1). In particular, the proposed value chain begins with the gasification unit that converts the solid feedstock consisting of pre-dried lignite coal (LEG) and solid recovered fuel (SRF) into a hot raw syngas by means of an HTW gasifier. This is achieved by the addition of steam for the activation of steam gasification reactions and the addition of oxygen for the required heat generation via partial oxidation of the fuel. Concerning the latter, an ASU provides pure oxygen to the gasifier at a very high purity. The raw syngas that exits the gasifier enters the gas cleaning unit. After the removal of potential dust and remaining solids (e.g., ash, unconverted carbon traces) via hot gas filters, the syngas is treated by cold circulating water in a water scrubber to remove chlorine, ammonia and heavier tars by controlling the pH value. With the first impurities scrubbed out, the syngas is sent to the water–gas shift (WGS) section for the adjustment of H
2/CO ratio as required in syngas to methanol synthesis (~2) [
3]. After the subsequent syngas cooling and the wastewater removal, the gas enters the Rectisol
® process, which is the core of the gas cleaning unit and where the AGR (H
2S and CO
2) takes place. With the involvement of Rectisol
®, an almost pure CO
2 off-gas stream can be generated that can be further stored or utilized (CCS/CCU). A second, smaller CO
2 stream containing H
2S is recovered as well and sent to the sulfur recovery unit (e.g., Claus process). Moreover, within Rectisol
®, BTX and naphthalene components are removed from the syngas simultaneously and can be recovered. The clean syngas, containing H
2, CO and CH
4, is afterwards transferred in the methanol synthesis unit. Due to the relatively high concentrations of CH
4 in the produced syngas, a steam methane reformer (SMR) is considered in the methanol synthesis unit to achieve satisfactory methanol yields. In the suggested process layout, the SMR position was fixed in an outer recycling loop around the methanol synthesis reactor. Finally, an afterburner unit combusts the off-gases from the methanol synthesis unit in order to produce additional thermal power.
Moreover, in this study, one of the potential uses of methanol, the MTO-MOGD (methanol-to-olefins, Mobil’s olefins to gasoline and distillate) process, is explored to produce advanced drop-in fuels for transportation use.
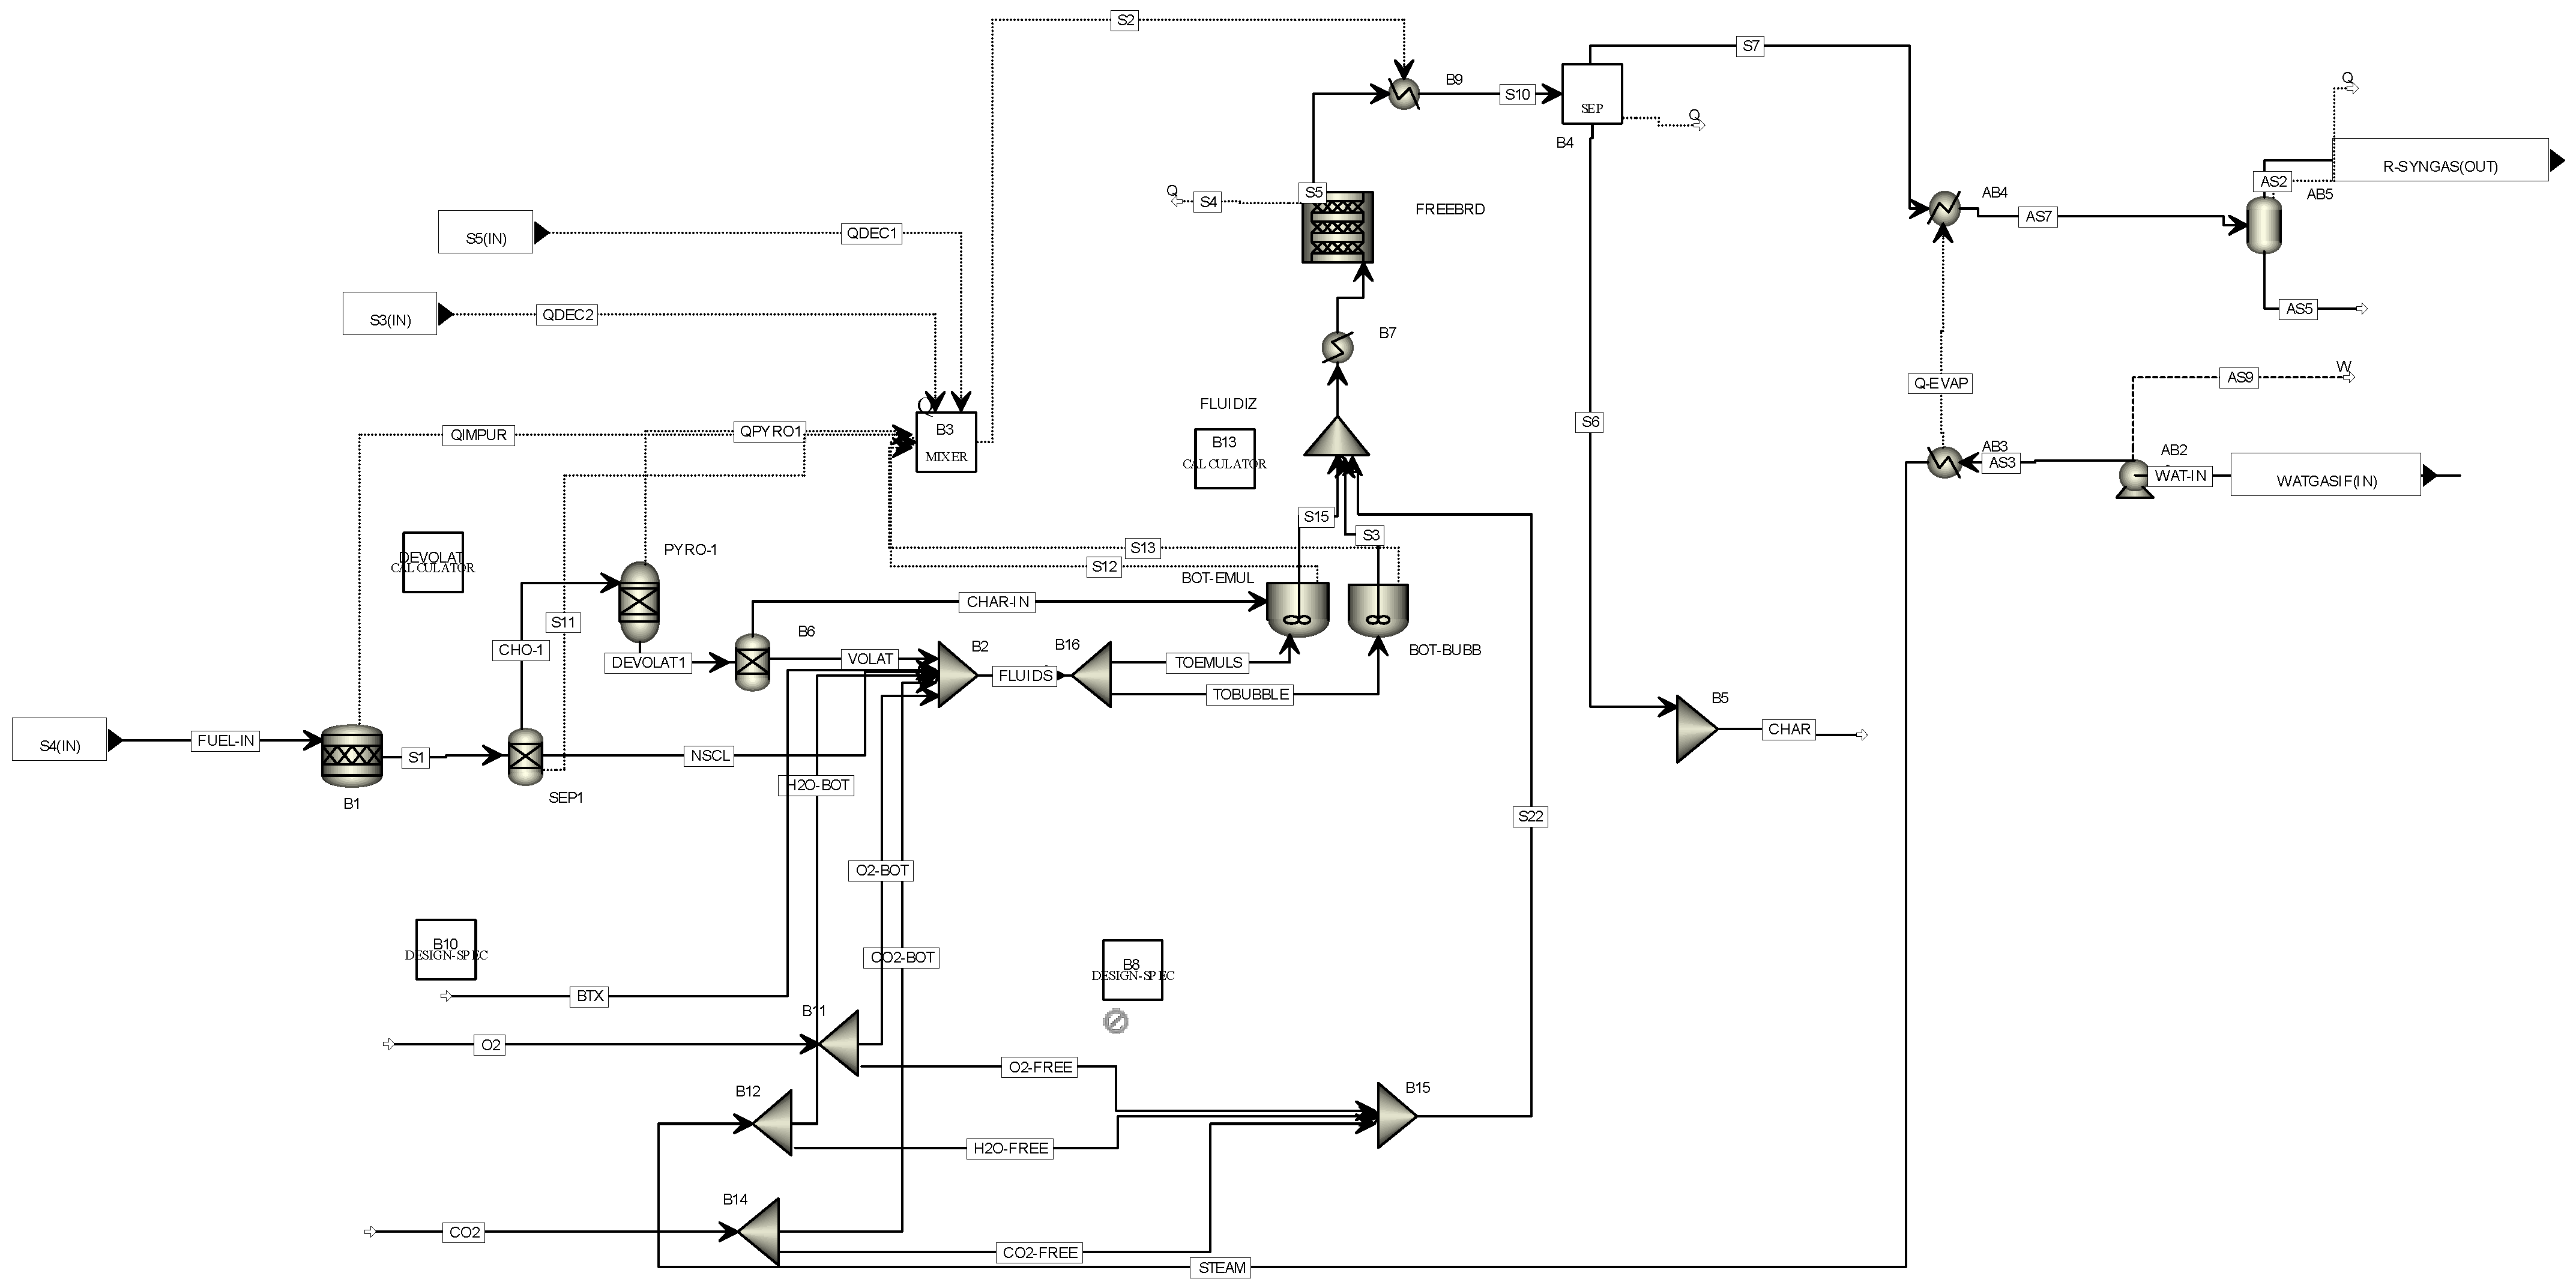
2.1. A100 Gasification Unit
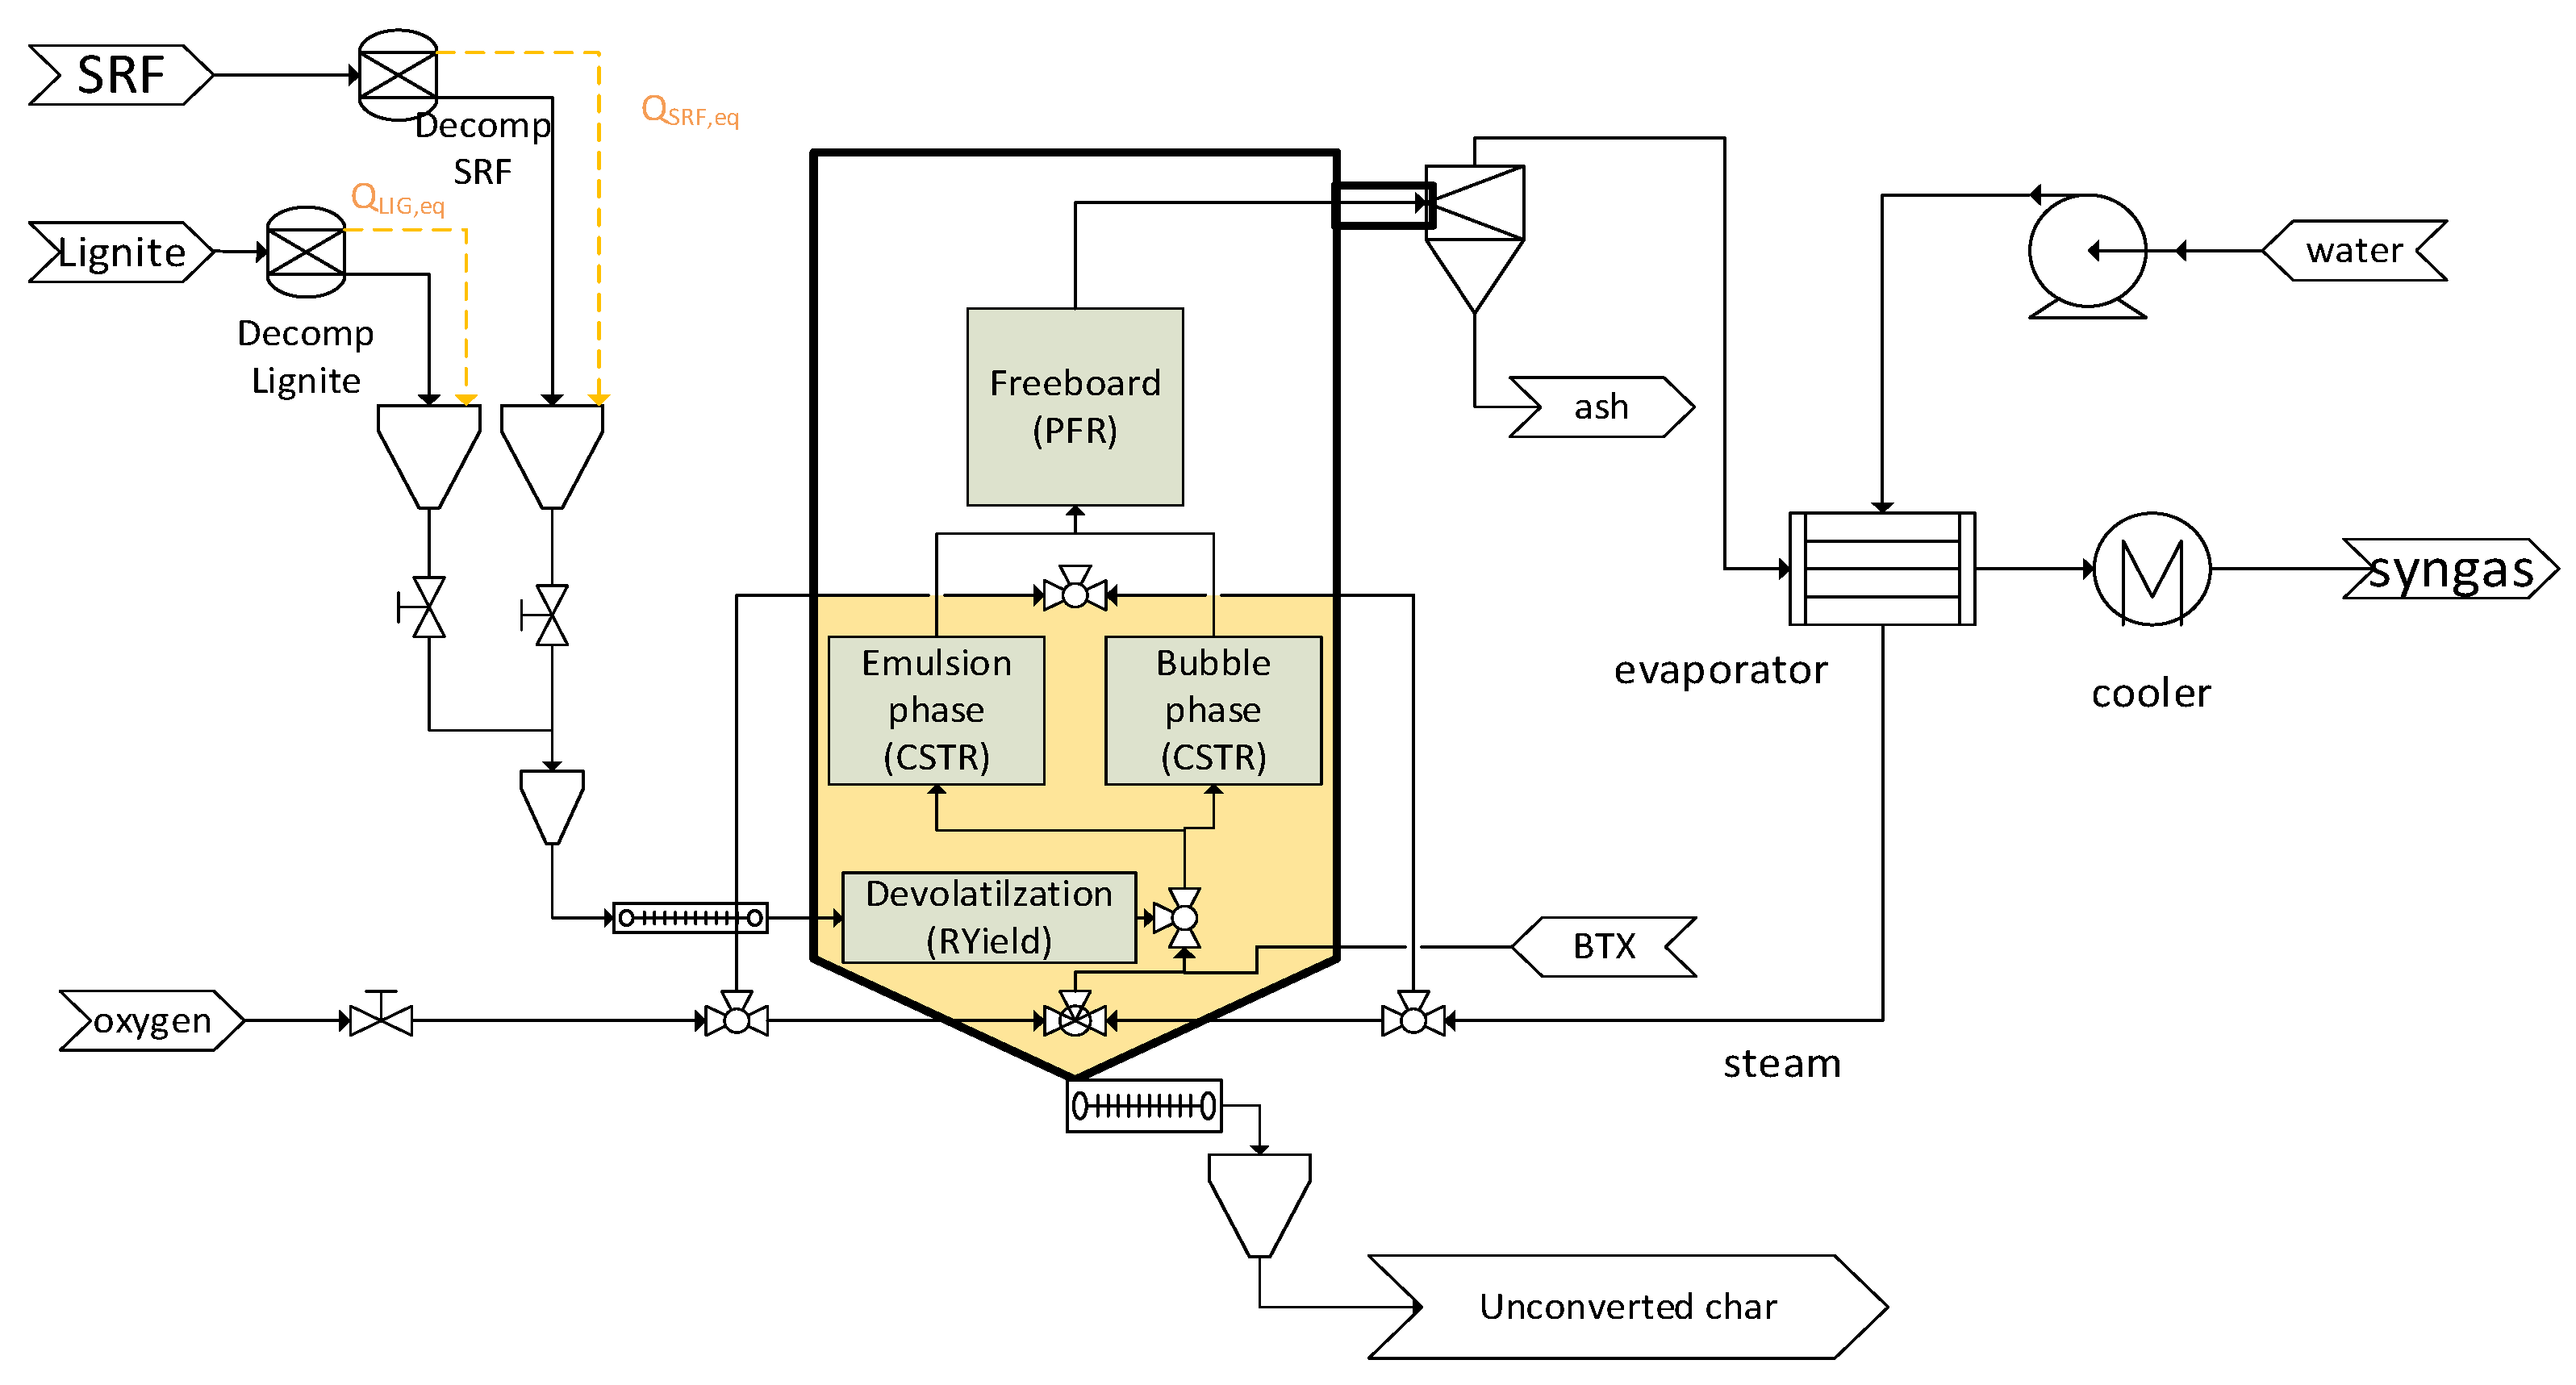
The HTW gasification unit is the first process unit in the proposed process chain. Solid raw material consisting of solid recovered fuel (SRF) and pre-dried lignite coal is prepared and mixed for feeding into the gasifier. The identified zones of the HTW gasifier, which is a bubbling fluidized bed reactor, are shown in
Figure 2. More details concerning the modeling of the gasification process are provided in
Section 3.1. With the assistance of the gasification agents, oxygen and steam, the solid feed is converted into a raw syngas stream that exits the reactor from the top. In particular, the partial oxidation of the fuel via oxygen addition provides the system with the necessary heat for the strongly endothermic steam gasification reactions. Ash particles along with unconverted carbon leave the reactor via a sluicing system to form the bottom product. Fly ash entrained with the raw syngas is removed by means of a cyclone, while smaller particles (dust) still present in the raw gas are removed via a hot particle filter downstream. The heat of the hot raw product gas of the gasification reactor is exploited via a heat recovery steam generation (HRSG) unit for the generation and pre-heating of the entering high-pressure steam. Side products such as BTX components and naphthalene, recovered in the gas cleaning unit, are recycled to the HTW gasifier for enhancing the syngas conversion rate of the overall plant.
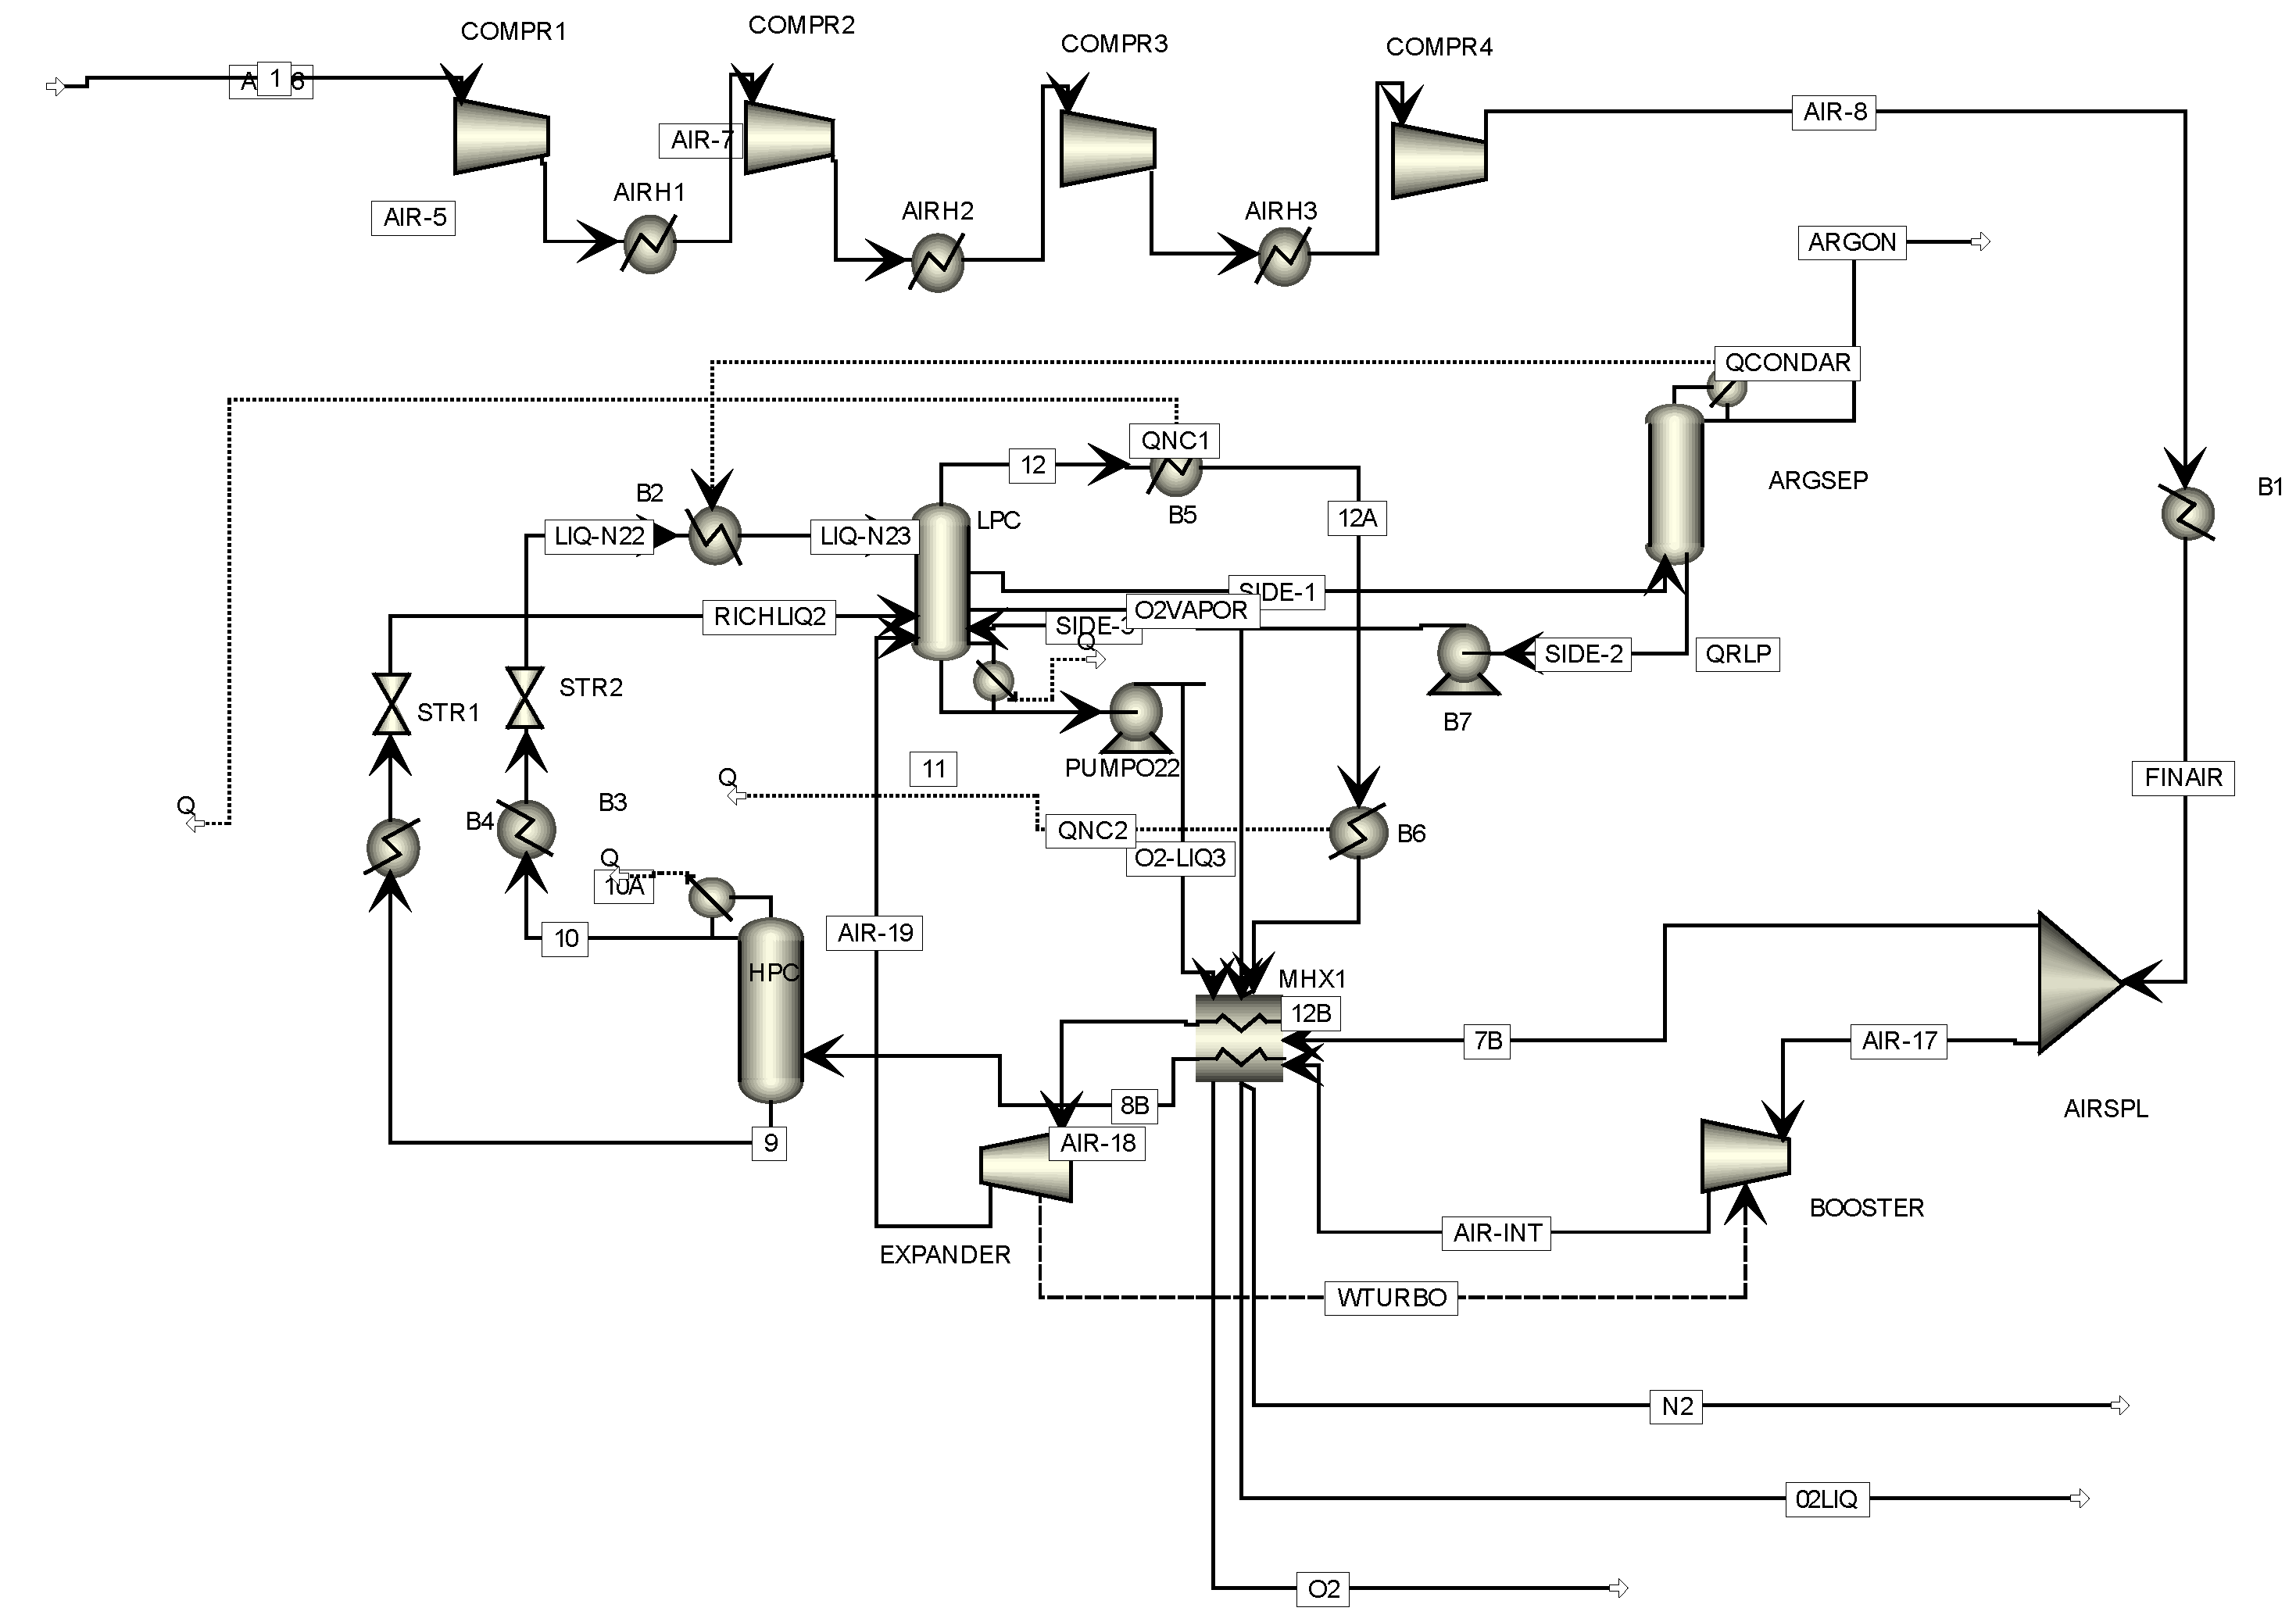
2.2. A200 Air Separation Unit
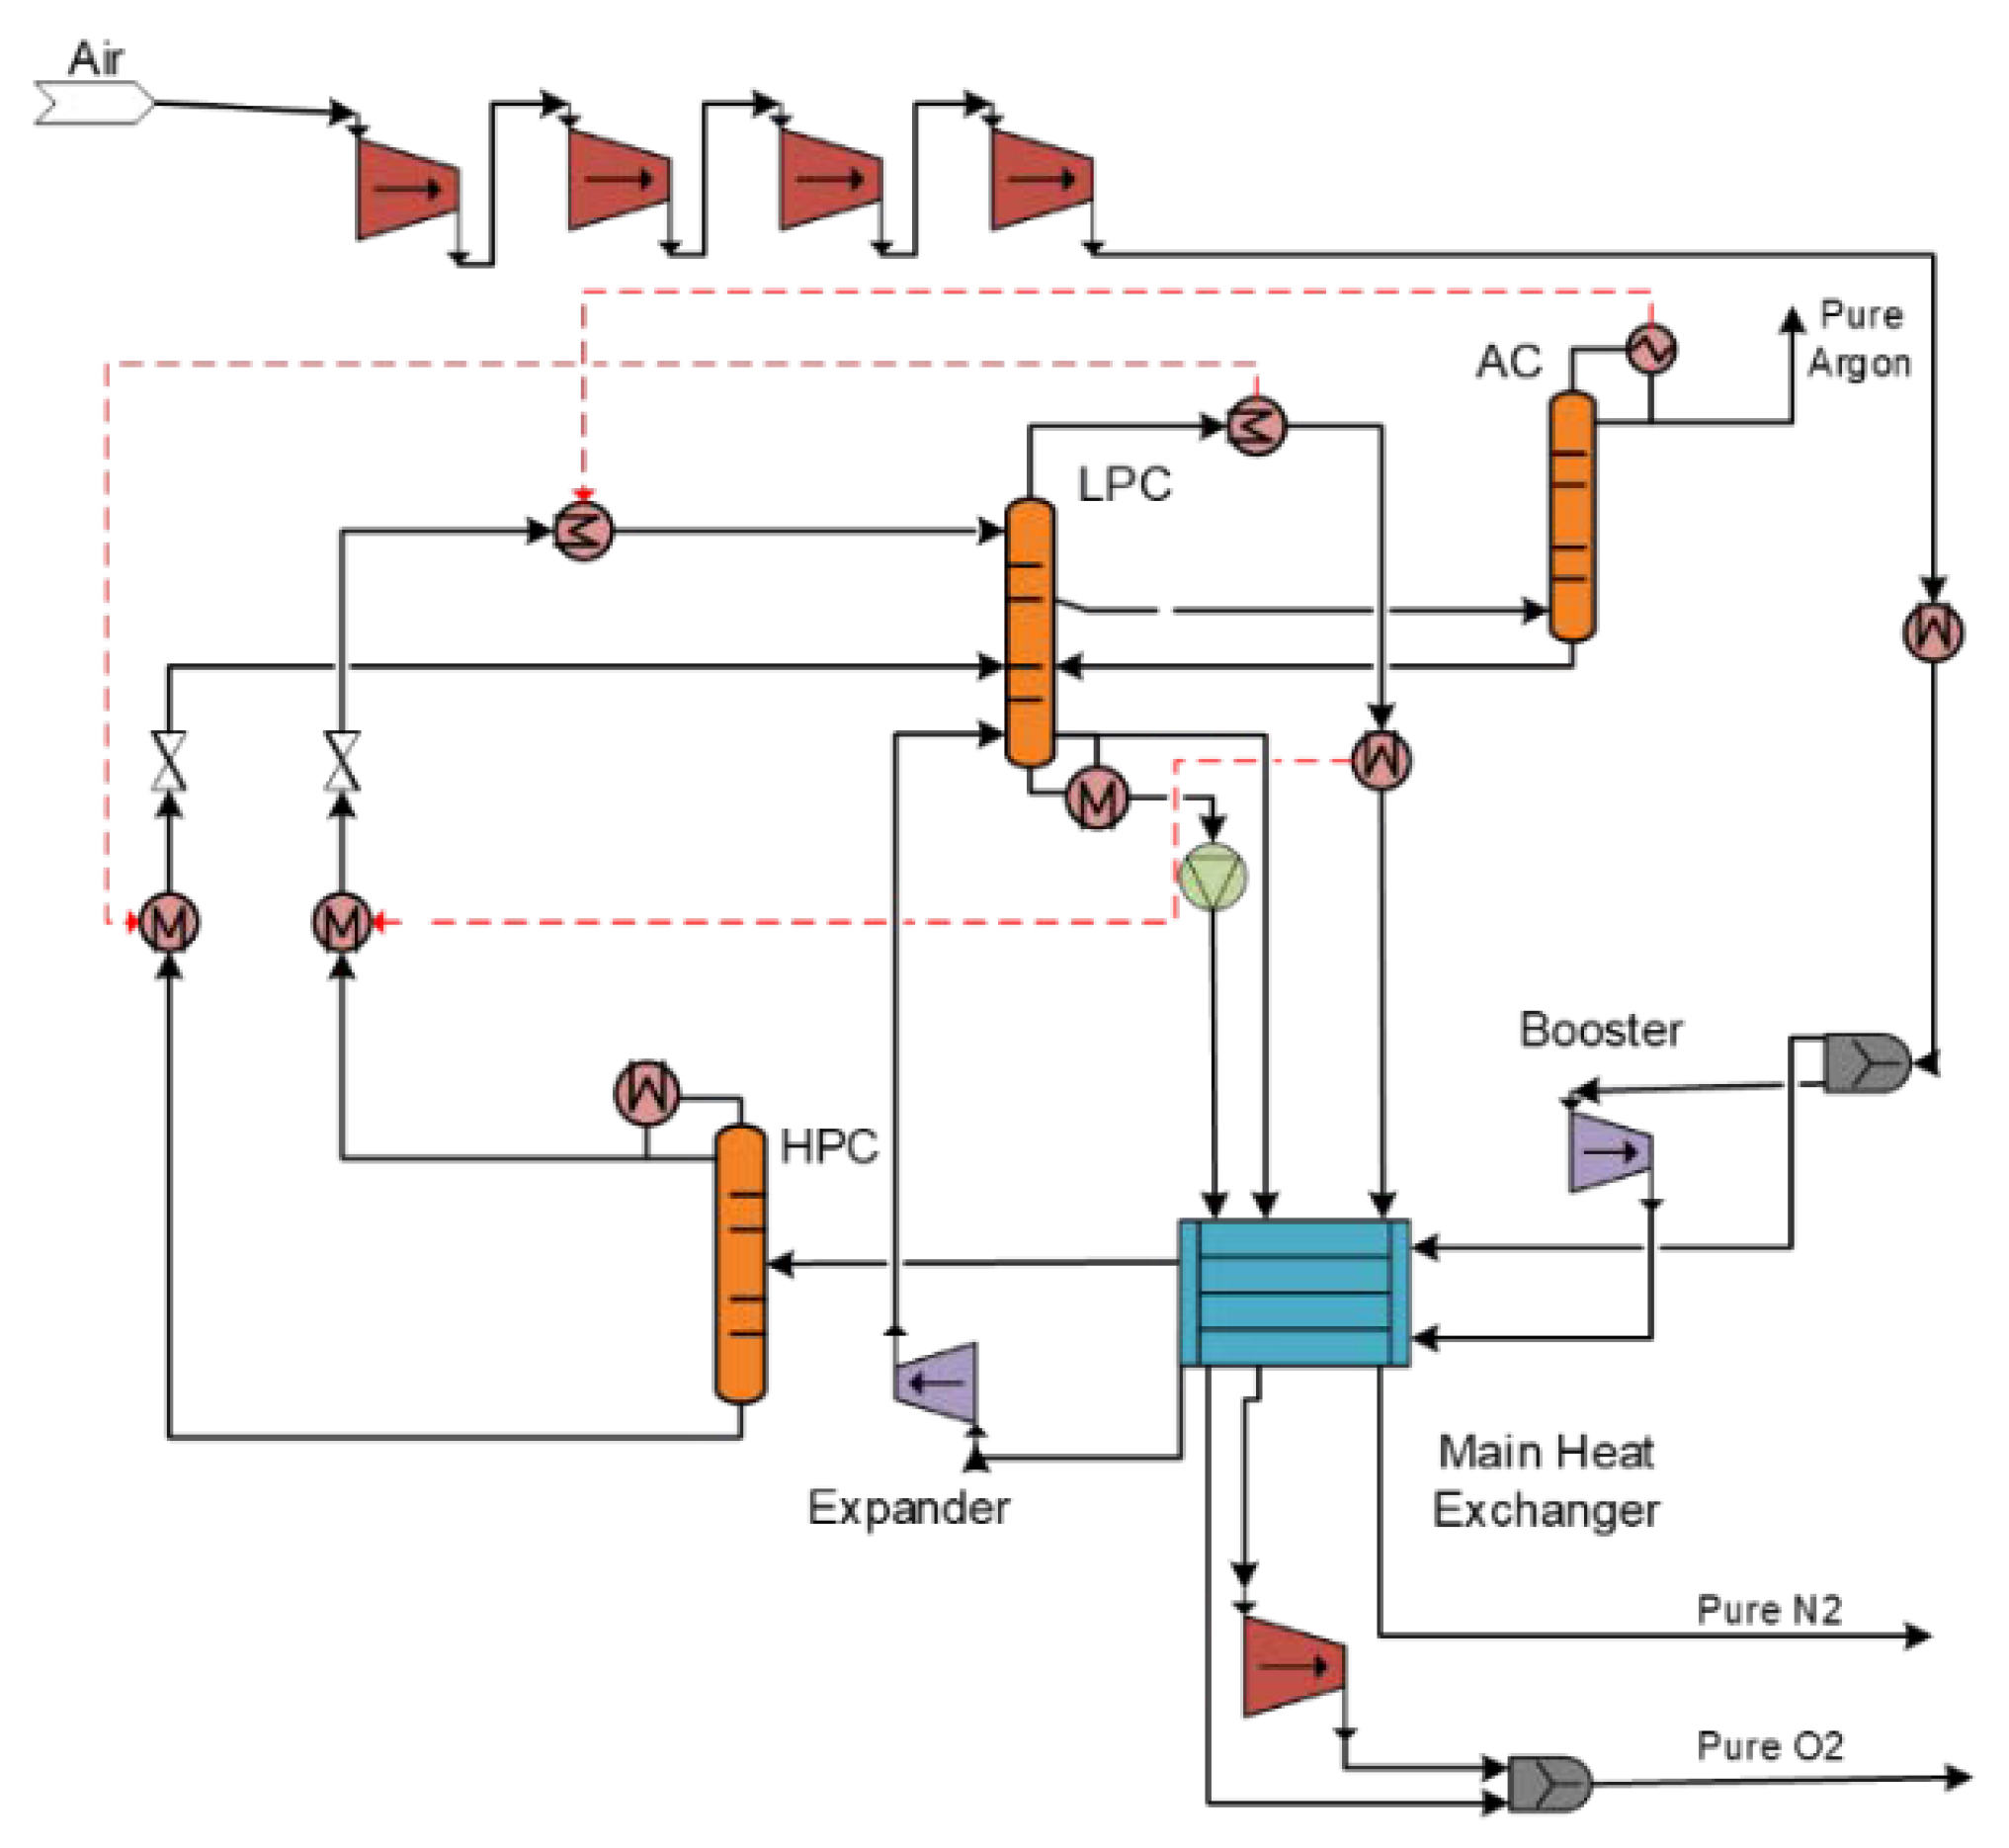
The air separation unit delivers the HTW gasifier with one of its gasification agents, oxygen (
Figure 3). The separation of air into its components is an energy-intensive process. In this study, a cryogenic ASU with three coupled primary columns is used. The air feed stream is first compressed and afterwards cooled by a primary heat exchanger. A portion of the air feed stream is introduced into the low-pressure distillation column (LPC), and the remaining stream enters the bottom of the high-pressure distillation column (HPC) at a low temperature of −172 °C. In addition, a vapor stream is withdrawn from the side of the LPC and is fed to the argon column (AC). The liquid from the bottom of the AC is recycled back to the LPC at the location of the vapor stream withdrawal while the argon vapor stream is removed overhead. The overhead of the HPC is a high-purity nitrogen stream and enters the LPC at the top. The overhead product is gaseous nitrogen with the same purity as the liquid nitrogen product from the HP column. Both liquid and gaseous oxygen are drawn from the bottom of the column. The final oxygen stream is compressed and introduced to the HTW gasifier.
2.3. A300 Gas Cleaning Unit
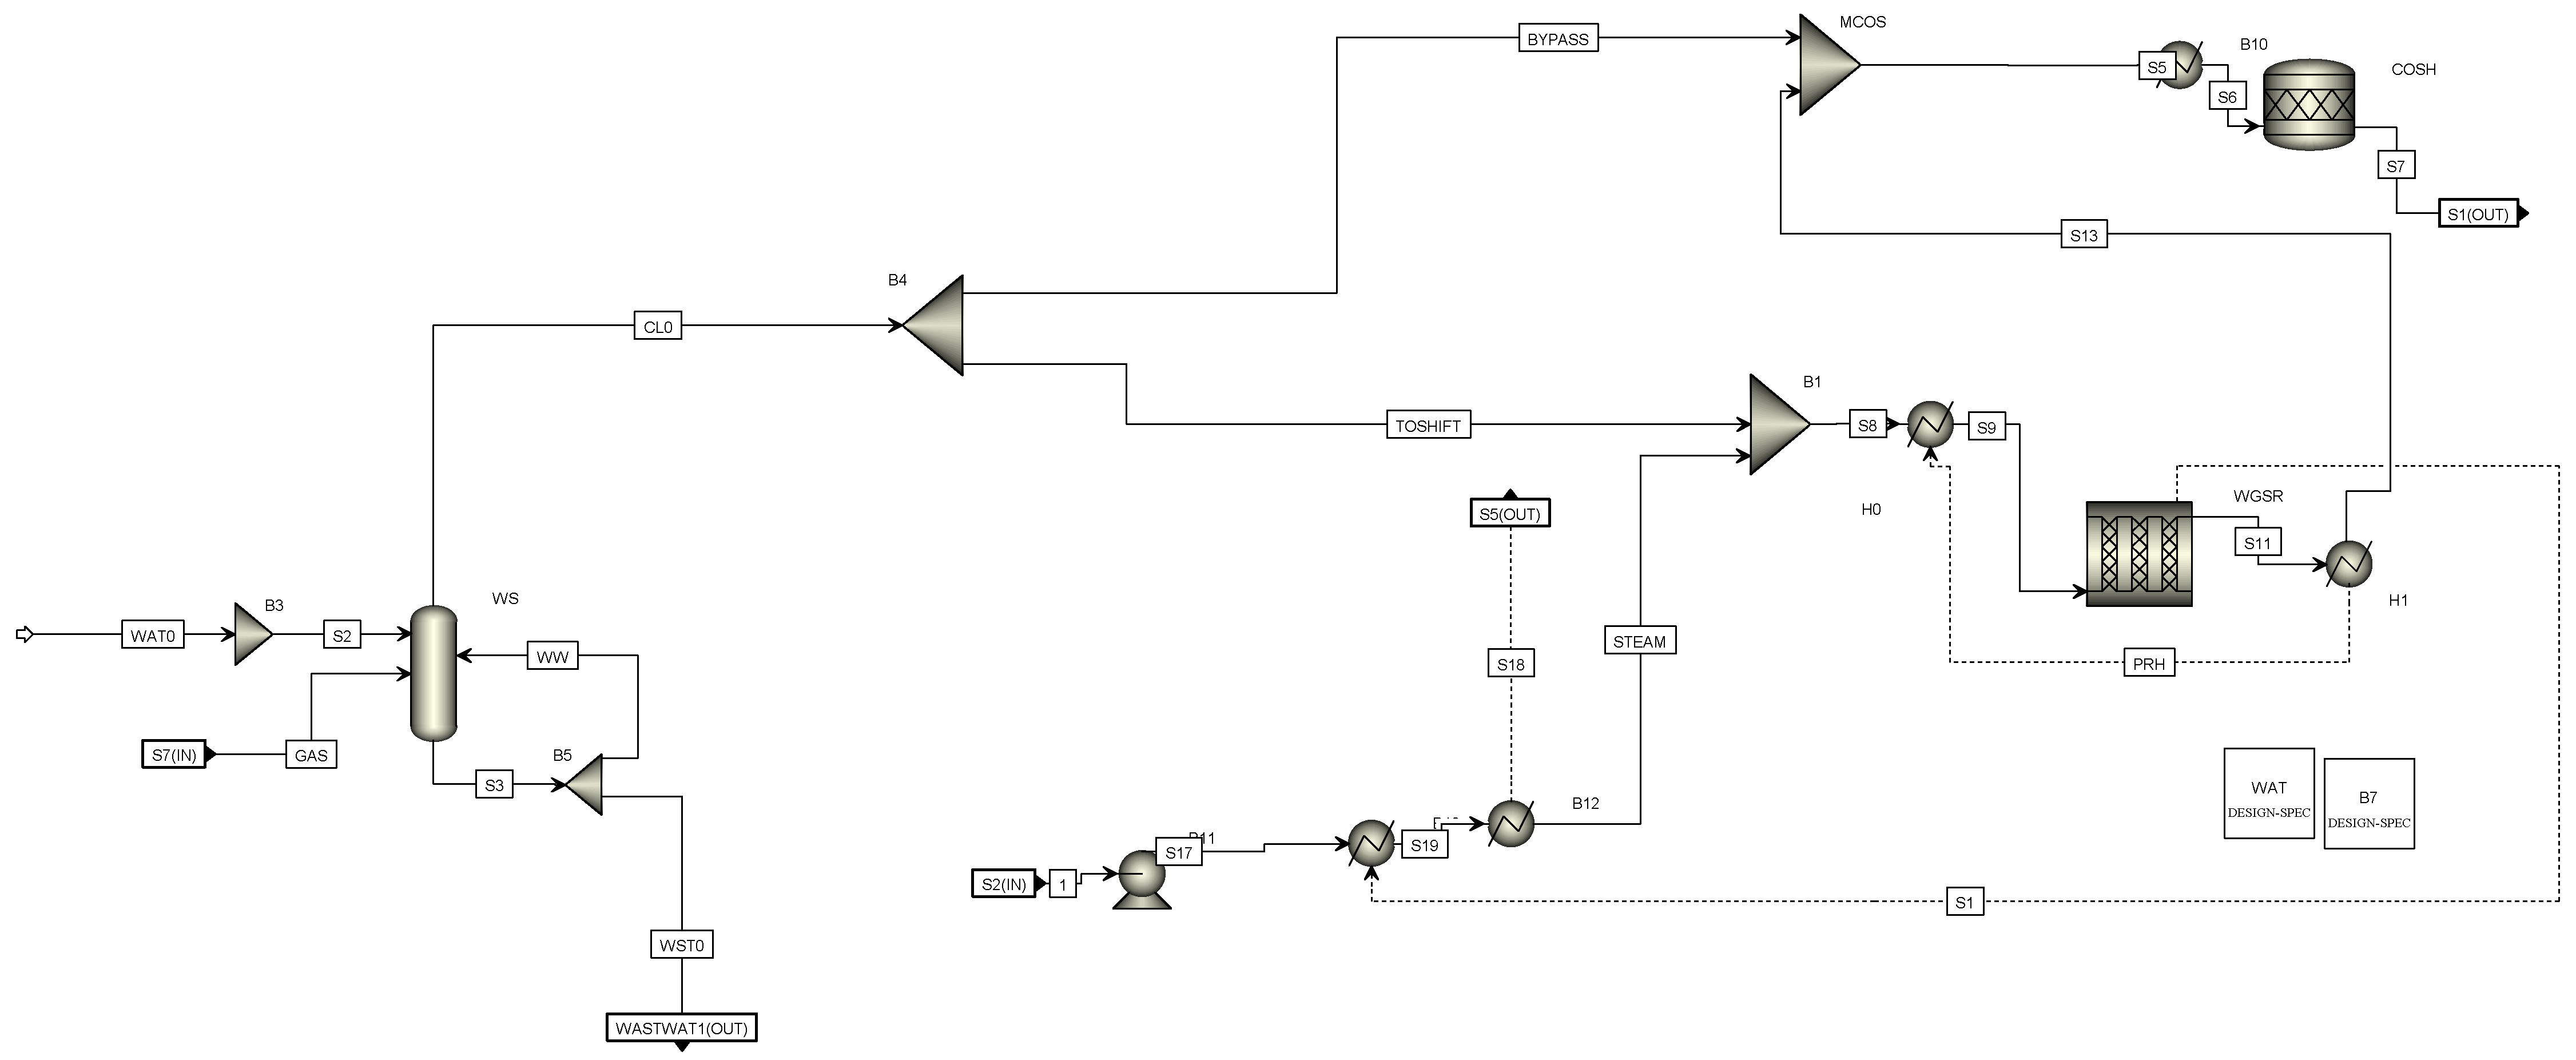
2.3.1. A310 Syngas Scrubbing–Raw Gas Shift
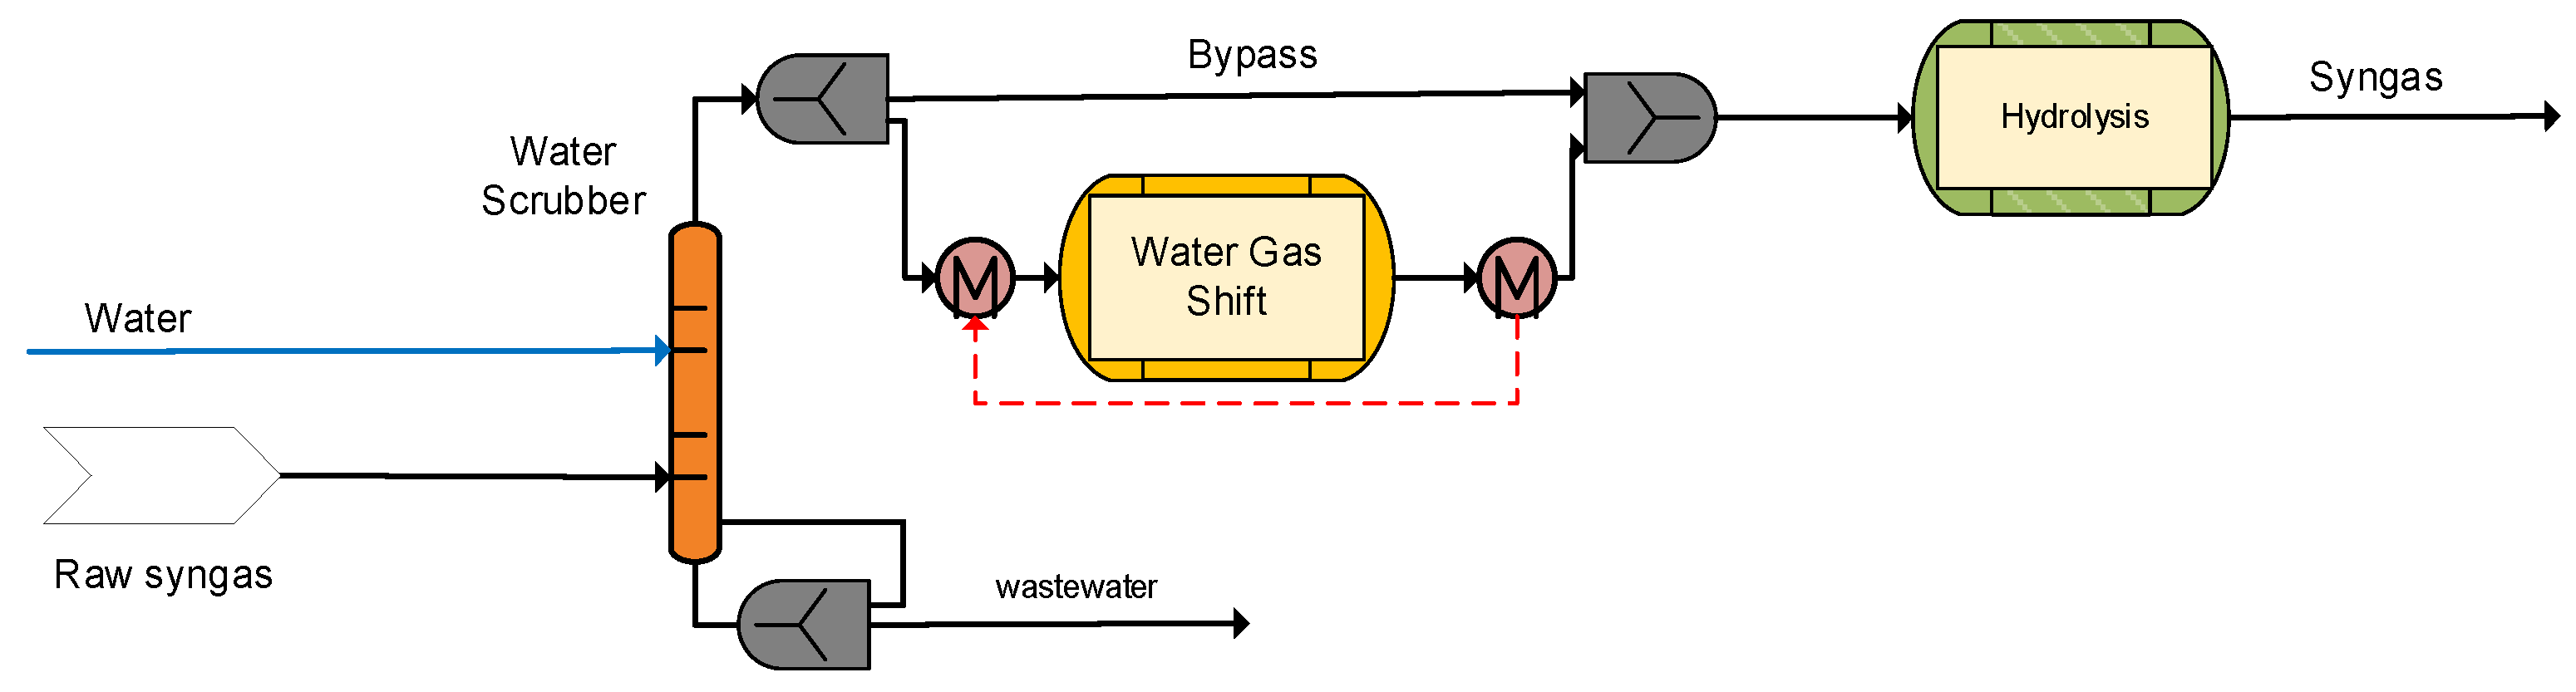
After heat recovery and filtering, the raw syngas undergoes a water scrubbing process for cooling and saturation. In the water scrubber, complete removal of HCl along with partial removal of NH3 and heavier tars are sought. The syngas is saturated and cooled down close to dew point of 170 °C. Moreover, in case of defects in the upstream filter system, residual particles are removed by the water. Due to the saturation, process water is consumed by the cooled syngas and fresh demineralized water needs to be added. In order to control the amount of soluble components such as chlorides and ammonia, some water is withdrawn from the circulating water as a bleed stream.
Afterwards, the syngas enters the WGS section to adjust the H
2/CO ratio, as required for the methanol synthesis process to be ~2. Due to the feedstock variations (lignite/SRF), different H
2/CO ratios may be observed in the obtained syngas with typical values below 2. Therefore, the WGS section is necessary in order to ensure the appropriate ratio (~2) prior to the methanol synthesis unit. In particular, a partial stream of the syngas passes in the CO shift reactor to generate hydrogen, while the amount of bypassed syngas is controlled by a process analyzer downstream of the reactor that ensures the desired H
2/CO ratio in the outlet gas stream. The shifted gas stream and the bypass stream are mixed and routed to the downstream COS hydrolysis reactor, where complete conversion of organic sulfur to H
2S takes place (
Figure 4).
In process configurations where physical solvents are applied for the AGR (e.g., Rectisol®), the tar removal process step can be performed simultaneously without the need for a separate dedicated tar removal unit.
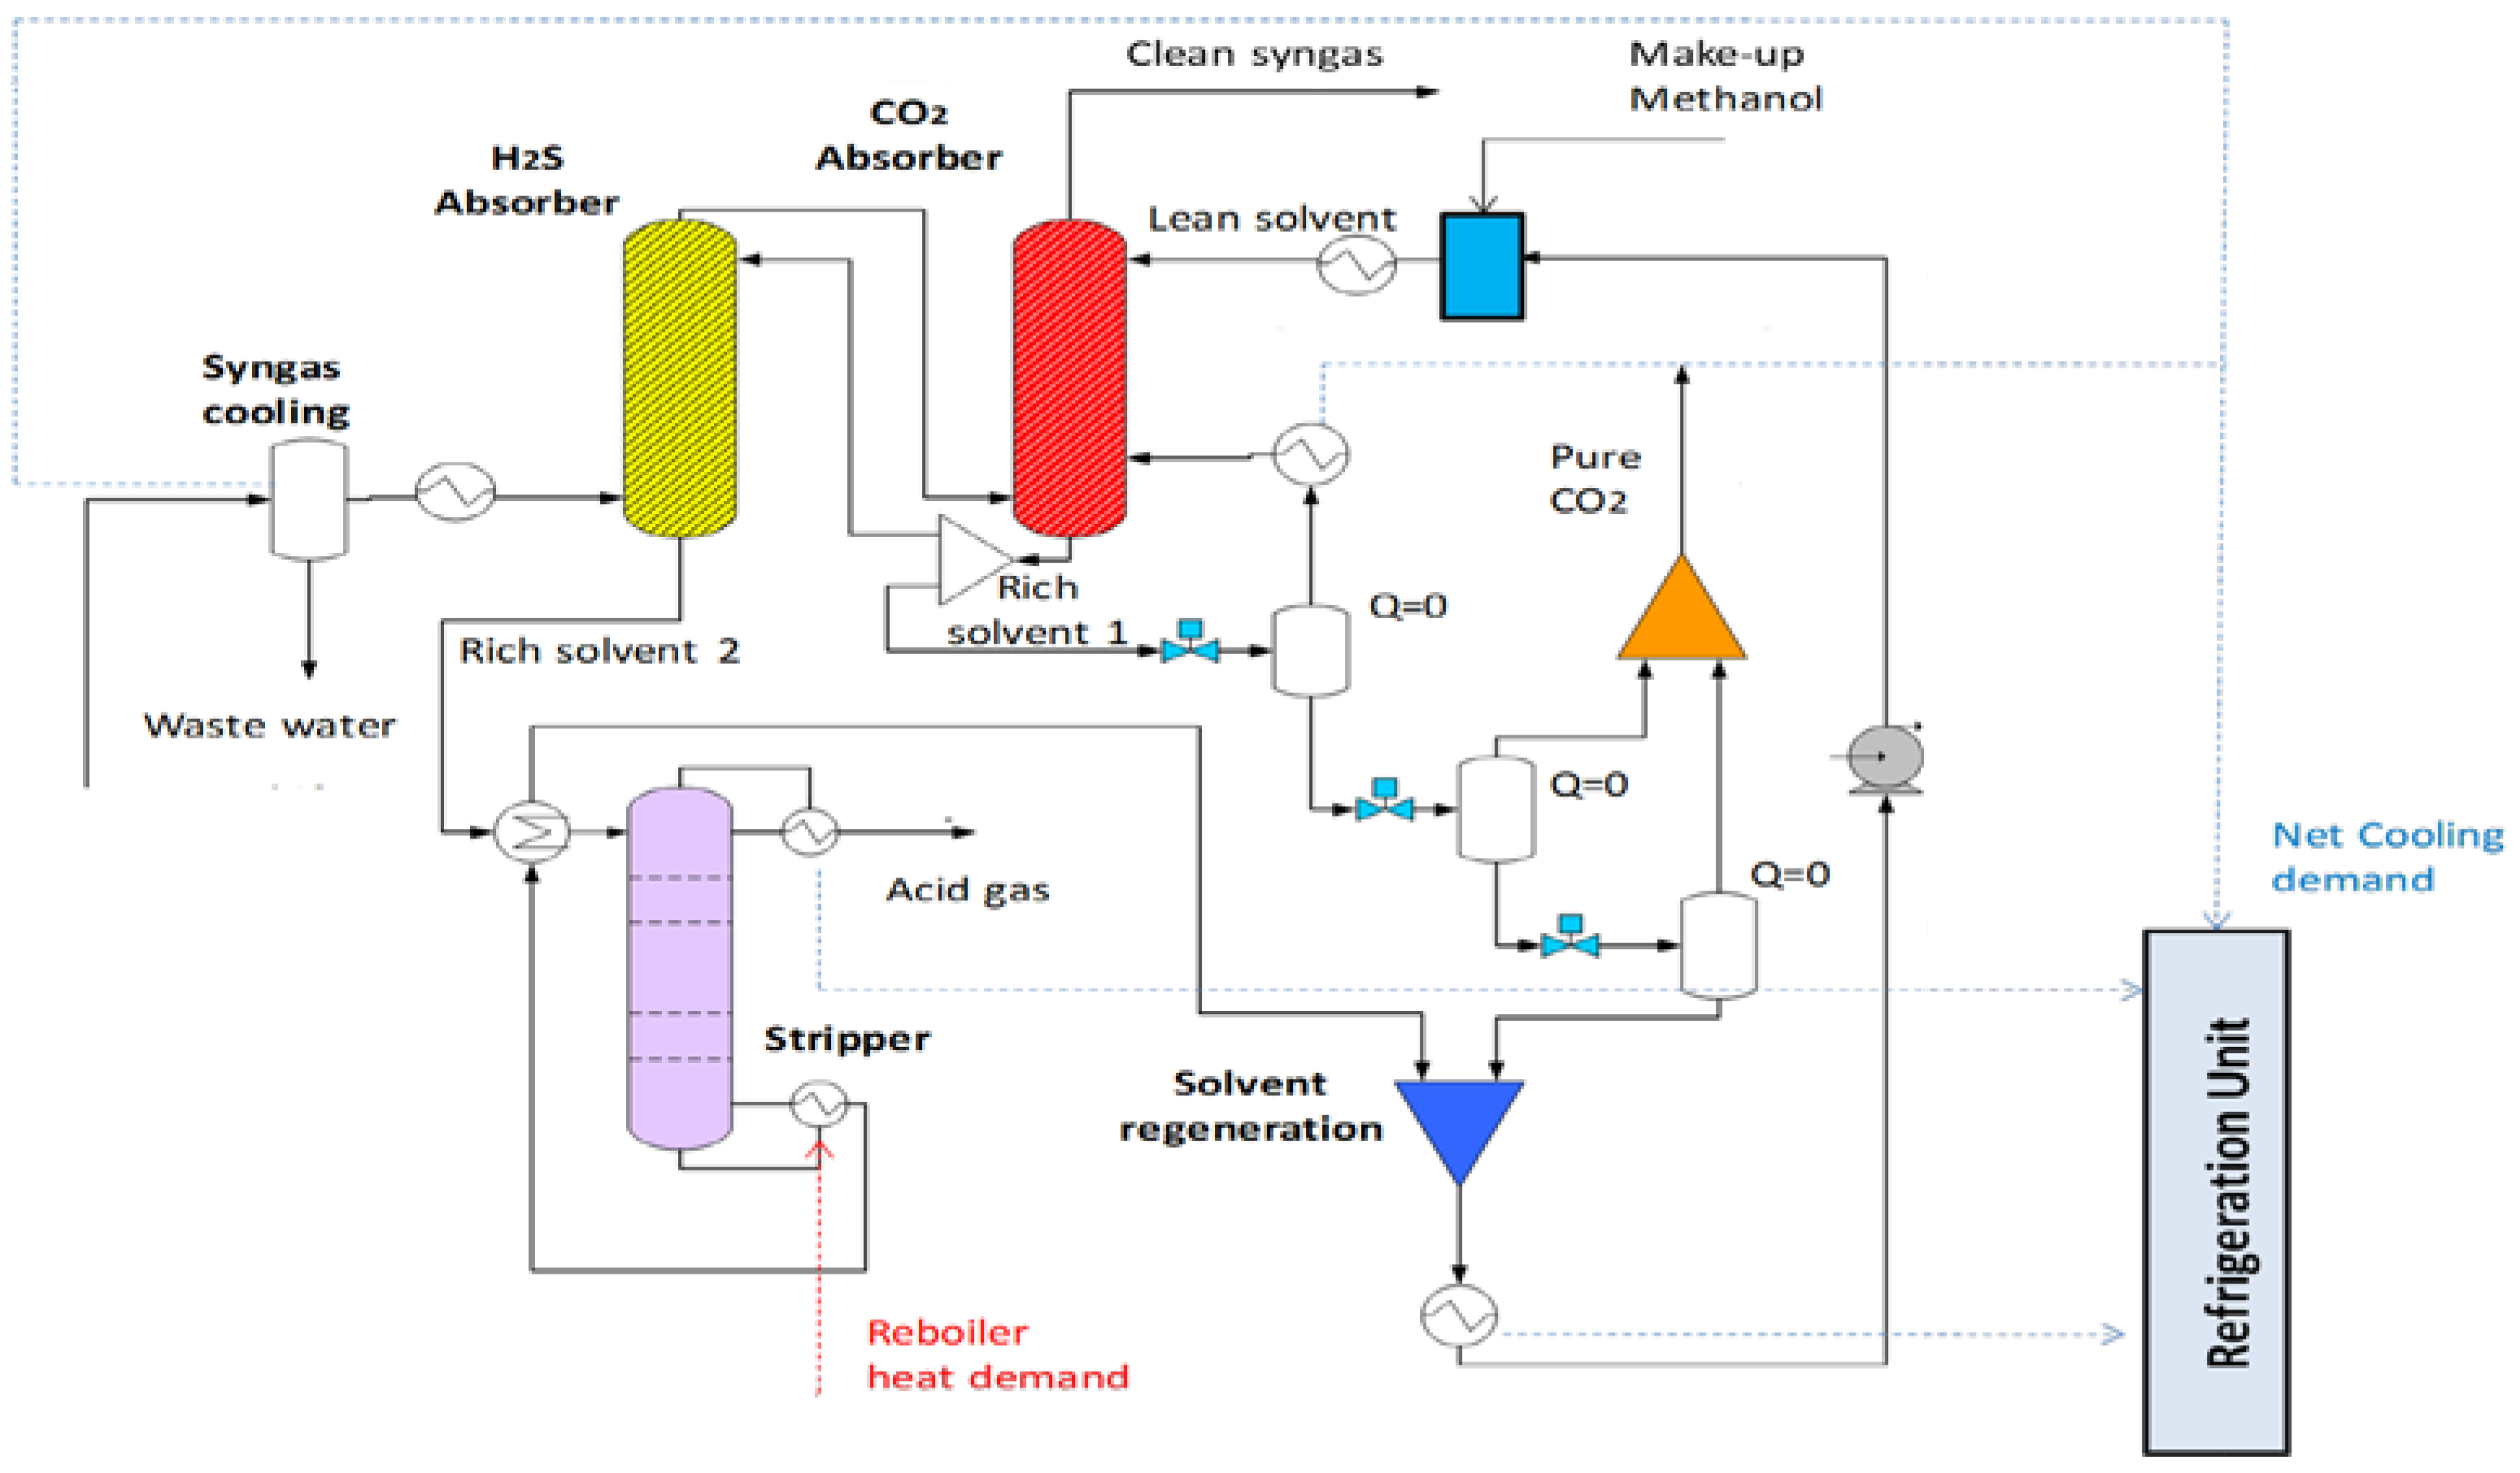
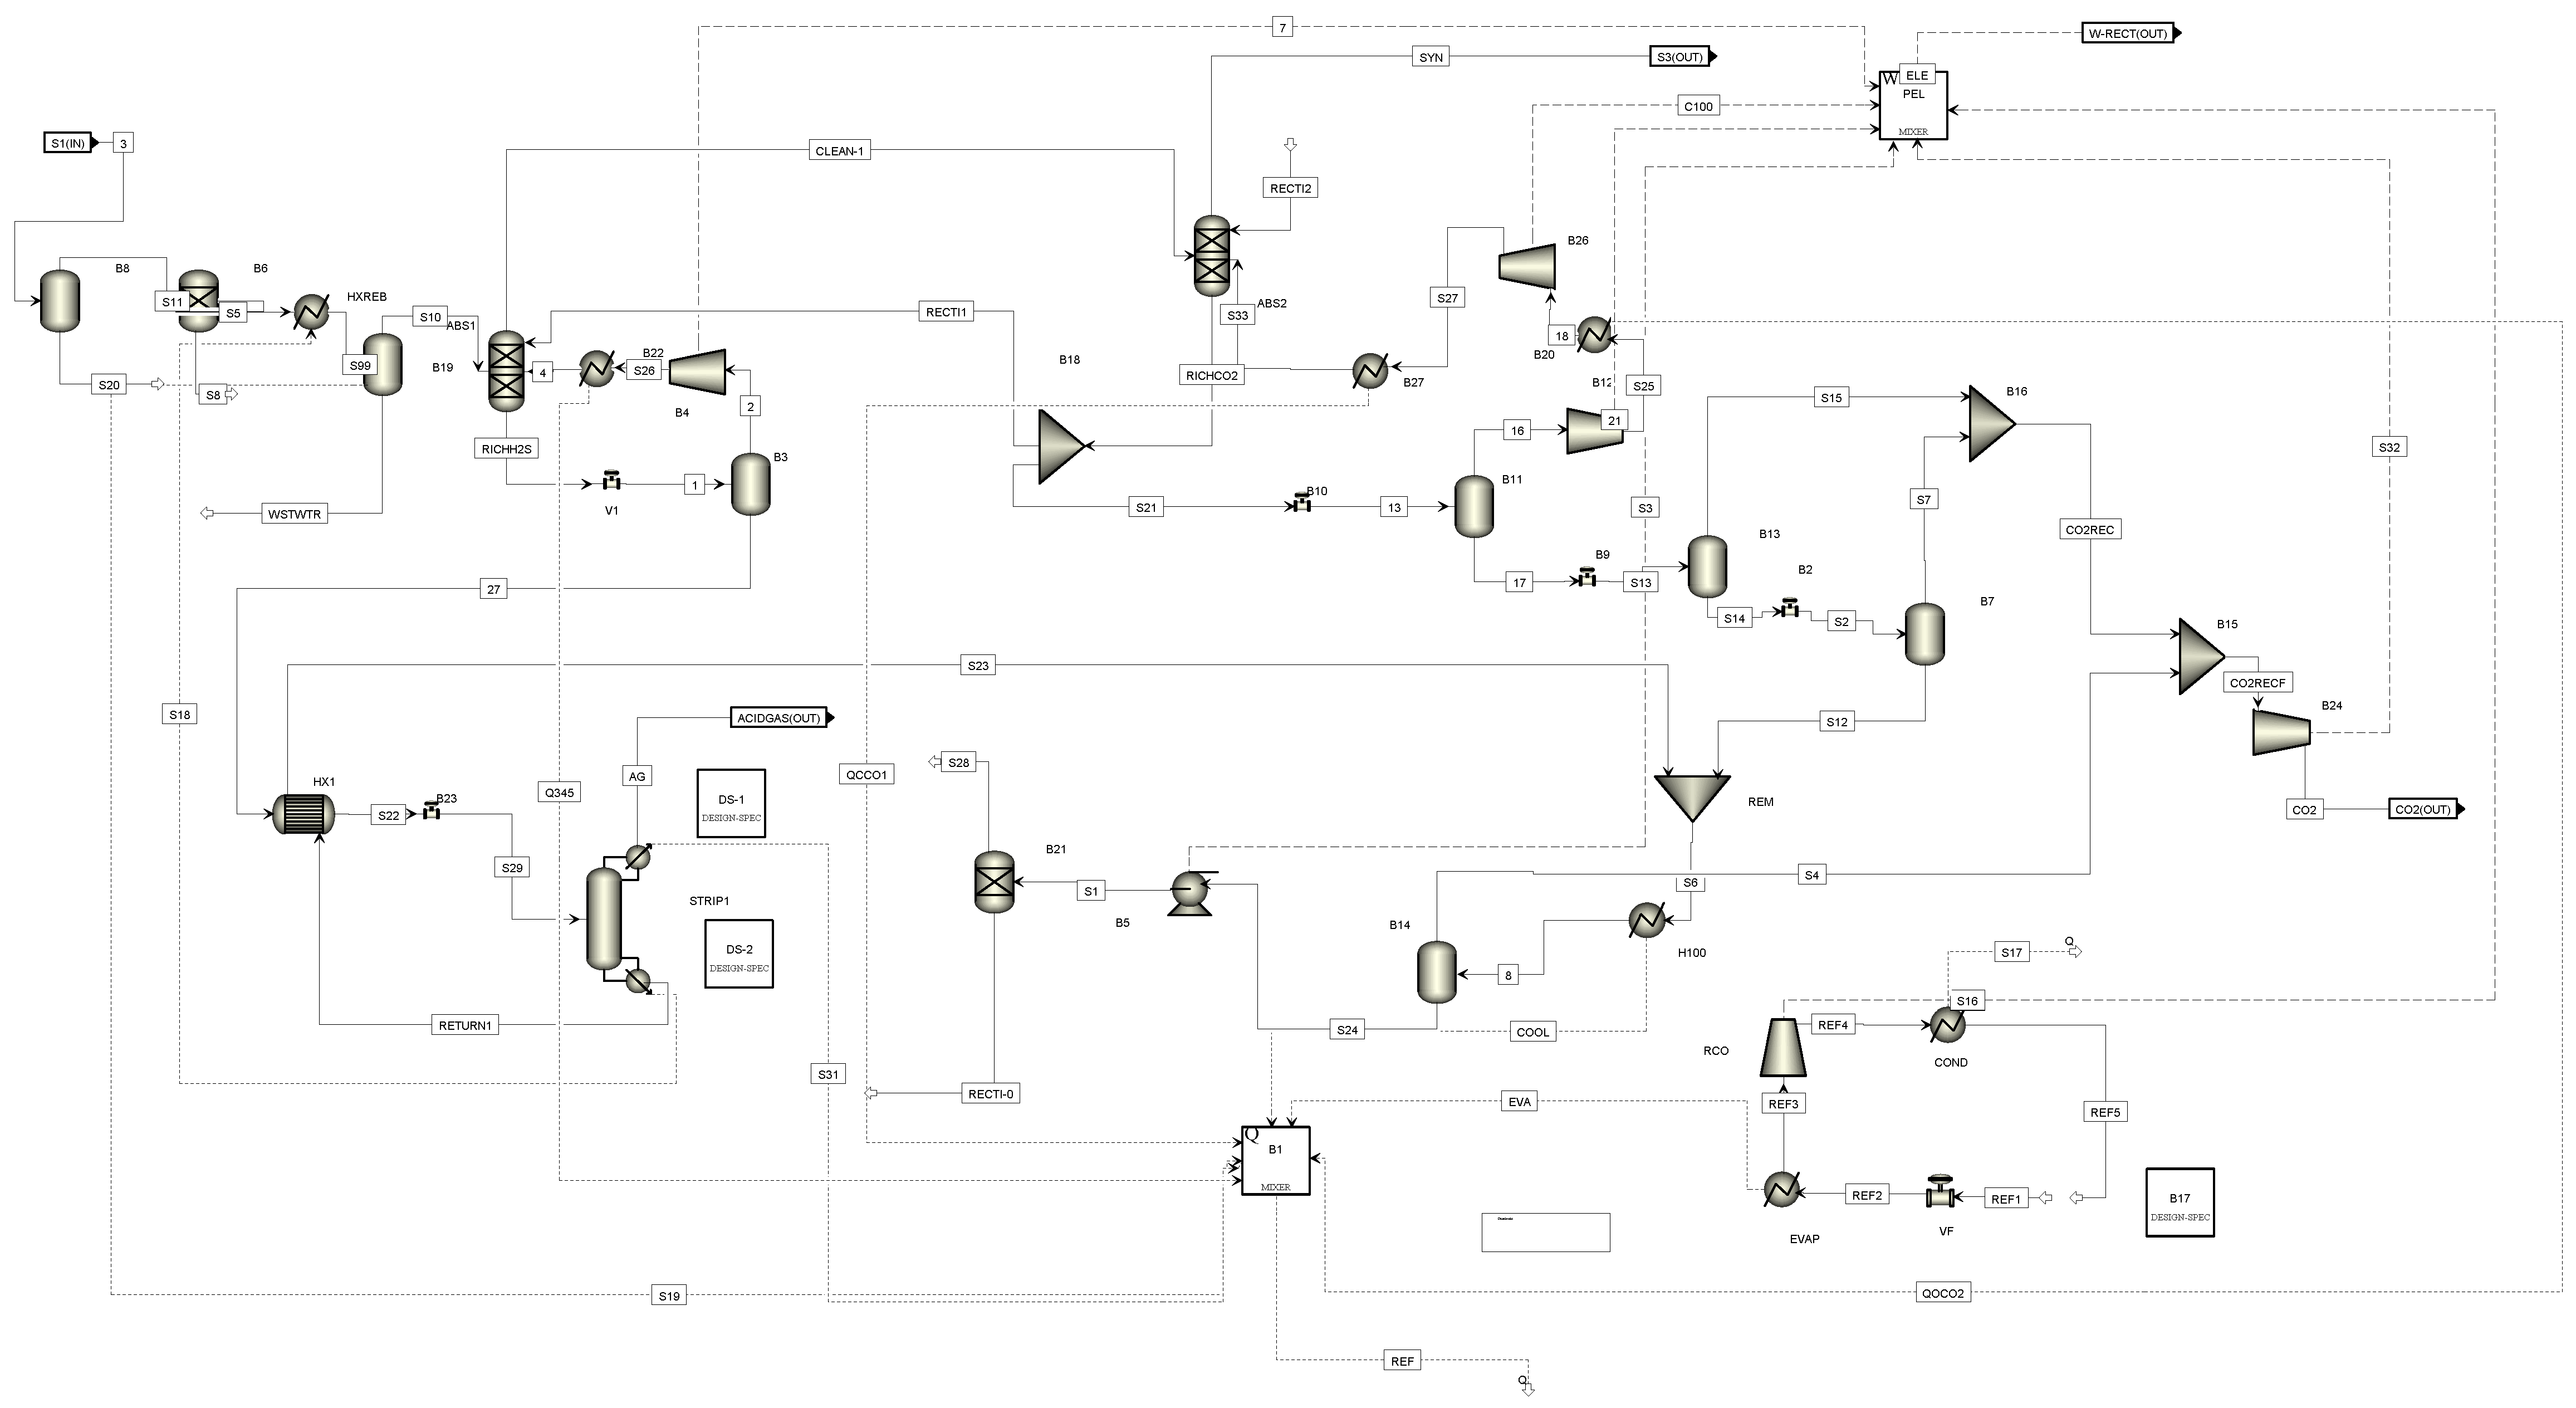
2.3.2. A320 Rectisol Unit for H2S/CO2 Removal
The Rectisol
® process has found applications in various plants to remove acid gases from gas streams by physical absorption in organic solvents without chemical reactions. It has a great potential for removing sulfur compounds and CO
2, but it is accompanied by the requirement of high refrigeration demand and very low solvent temperatures. In particular, the syngas is intensively contacted with cold methanol absorbing BTX, naphthalene and the sour gas components CO
2 and H
2S. The treated syngas (clean syngas, <2 vol % CO
2 and <1 ppm H
2S) exits the absorber at the top and, after being reheated, is sent to a final purification unit (e.g., ZnO guard bed), where possibly remaining sulfur traces are removed down to the ppb level. In several downstream stages, the rich solvent is flashed to release CO
2. The process configuration shown in
Figure 5, after the syngas cooling and the wastewater removal, consists of two absorbers and one stripper. The selection of the latter has the advantage of maximizing the separation of the pure recovered CO
2 from the sulfur-containing compounds (H
2S). In this configuration, an almost pure CO
2 off-gas stream can be generated and subsequently exploited via CCS/CCU. A second, smaller CO
2 stream containing H
2S is recovered at the top of the stripper and sent to the sulfur recovery unit. The carbon capture ratio in the form of pure CO
2 can be further enhanced after the desulphurization (i.e., Claus) that is applied in the minor output acid gas stream of the Rectisol
® process. Moreover, any tar species are captured and recycled back to the HTW gasification unit. The cooling demands of the process are covered from an external refrigeration unit.
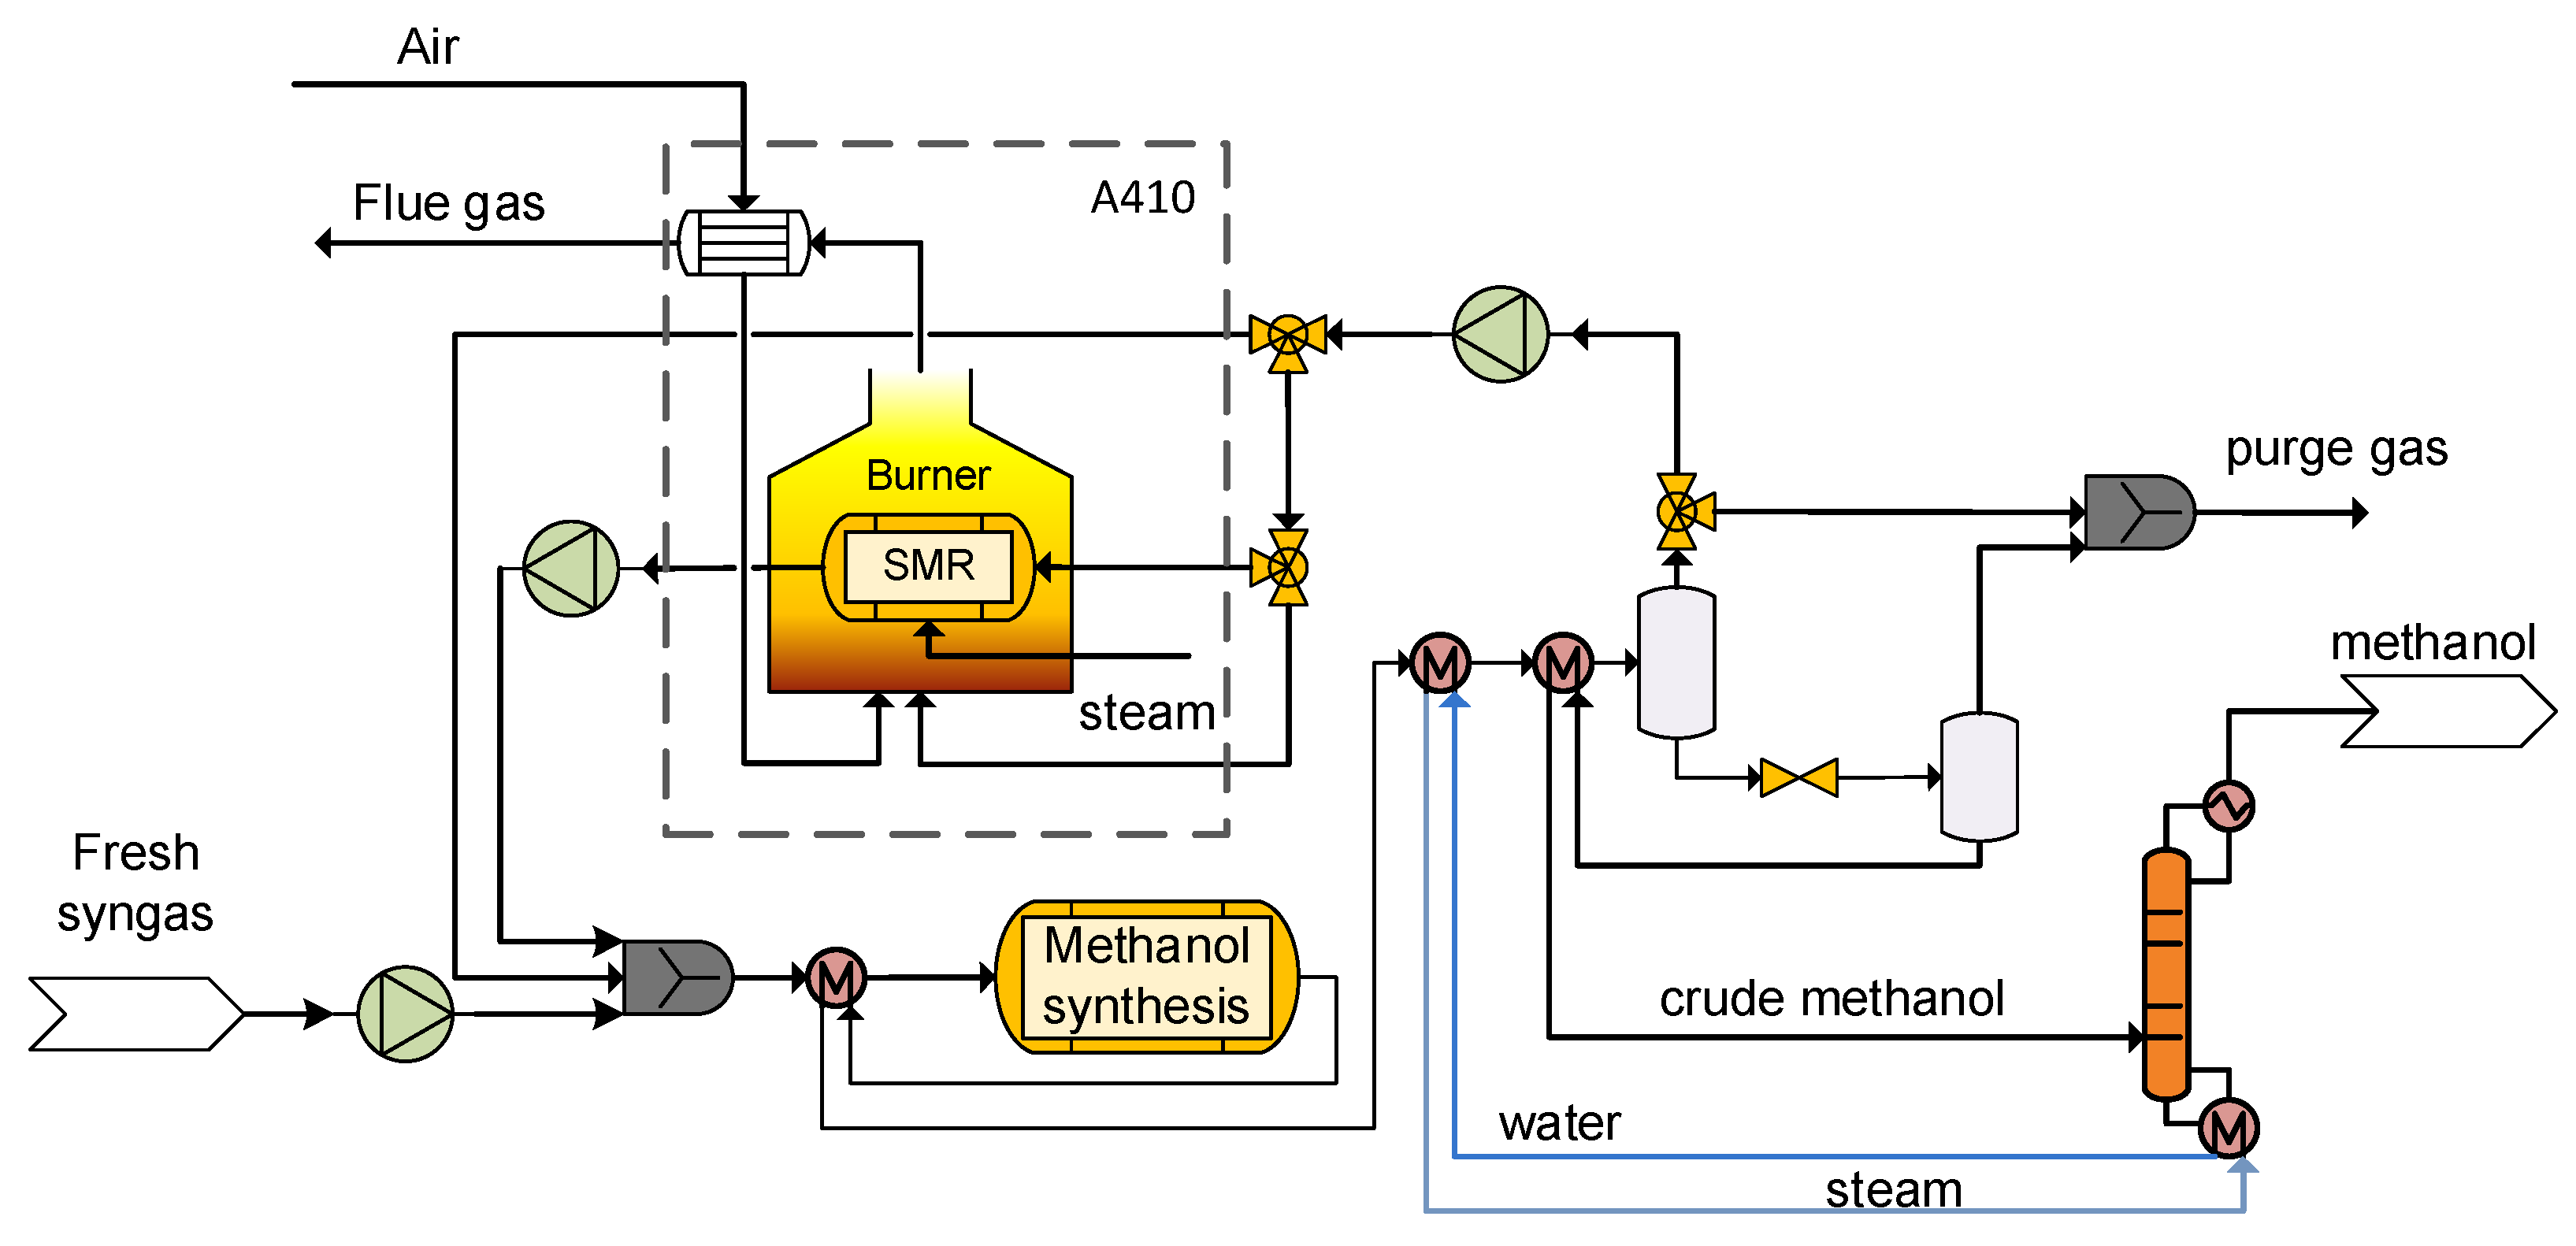
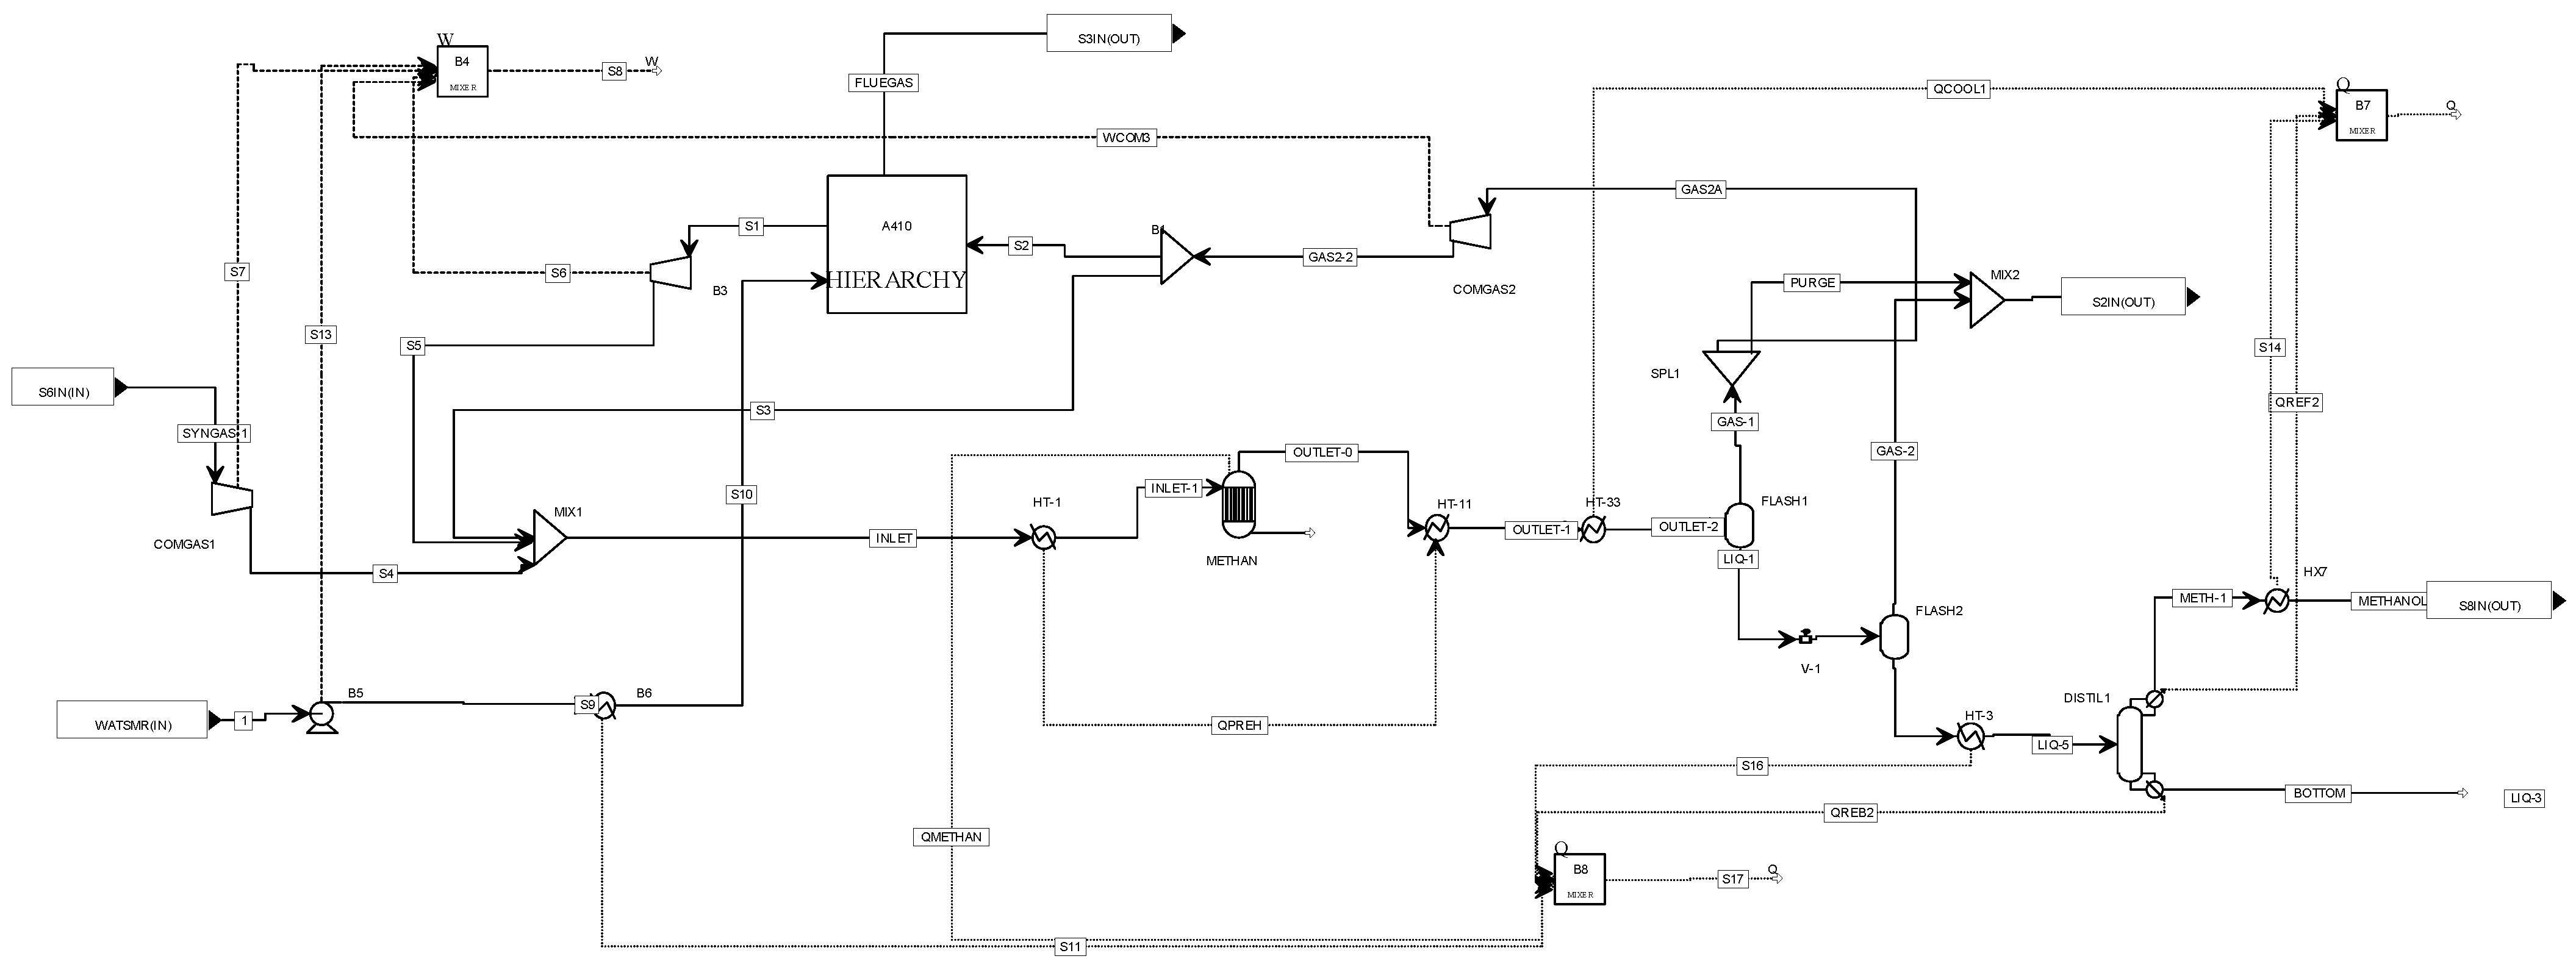
2.4. A400 Methanol Synthesis Unit
Methanol is usually produced with high selectivity, generating only a small amount of side products (off-gases). The fresh syngas prior entering the reactor is compressed and mixed with the unconverted gas that is recycled back to the reactor as well as the SMR output. The H2/CO ratio of the process gas in the reactor inlet is kept constant at around 2. In the isothermal reactor, the methanol synthesis reaction is performed. The overall conversion rate of a methanol process is high and achieved by recirculation of a part of the reactor product back to the syngas feed for mixture along with the presence of the SMR unit, which converts the circulating methane to H2 and CO that can be utilized in the methanol synthesis. The syngas, which exits the reactor, is cooled down in several stages, and the condensed crude methanol is separated from the water and extracted by the overhead of the methanol column. The remaining part of unreacted syngas is split and a portion of it enters the SMR unit while the other one is redirected to the reactor. A small fraction of unreacted syngas exits the unit and forms the tail gas, which is used afterwards in the afterburner as fuel gas. The condensed crude methanol stream leaves the unit for further use in the chemical or petrochemical industry. The separated process condensate leaves the unit as a wastewater stream for treatment in a biological wastewater plant (not modeled in this study).
As already mentioned, in case considerable concentrations of CH4 are present in the clean syngas, the implementation of an SMR in the fuel synthesis unit is beneficial for the methanol production and the overall process efficiency. In particular, with the presence of an SMR, instead of recycling methanol synthesis inert gases such as CH4 repeatedly, the conversion of the latter one into CO and H2 complements the recycling of gases that take part in methanol production. The EFE as well as carbon utilization (CU) increase via the utilization of the carbon and energy contained inside the methane which would otherwise be unavailable for the methanol synthesis. Due to the endothermic reforming reactions, a part of the recycled gases is combusted in order to thermally assist the SMR operation. Moreover, large recycling ratios are also translated to requirements of larger fuel synthesis equipment and cost. However, the beneficial impact that the SMR unit has on the methanol synthesis derived from a CH4-rich syngas is large enough to impose its presence aiming for high carbon conversion factors despite the shortcomings (complex configuration, higher CAPEX).
The process flow diagram of the methanol synthesis and recovery unit along with the SMR unit is shown in
Figure 6.
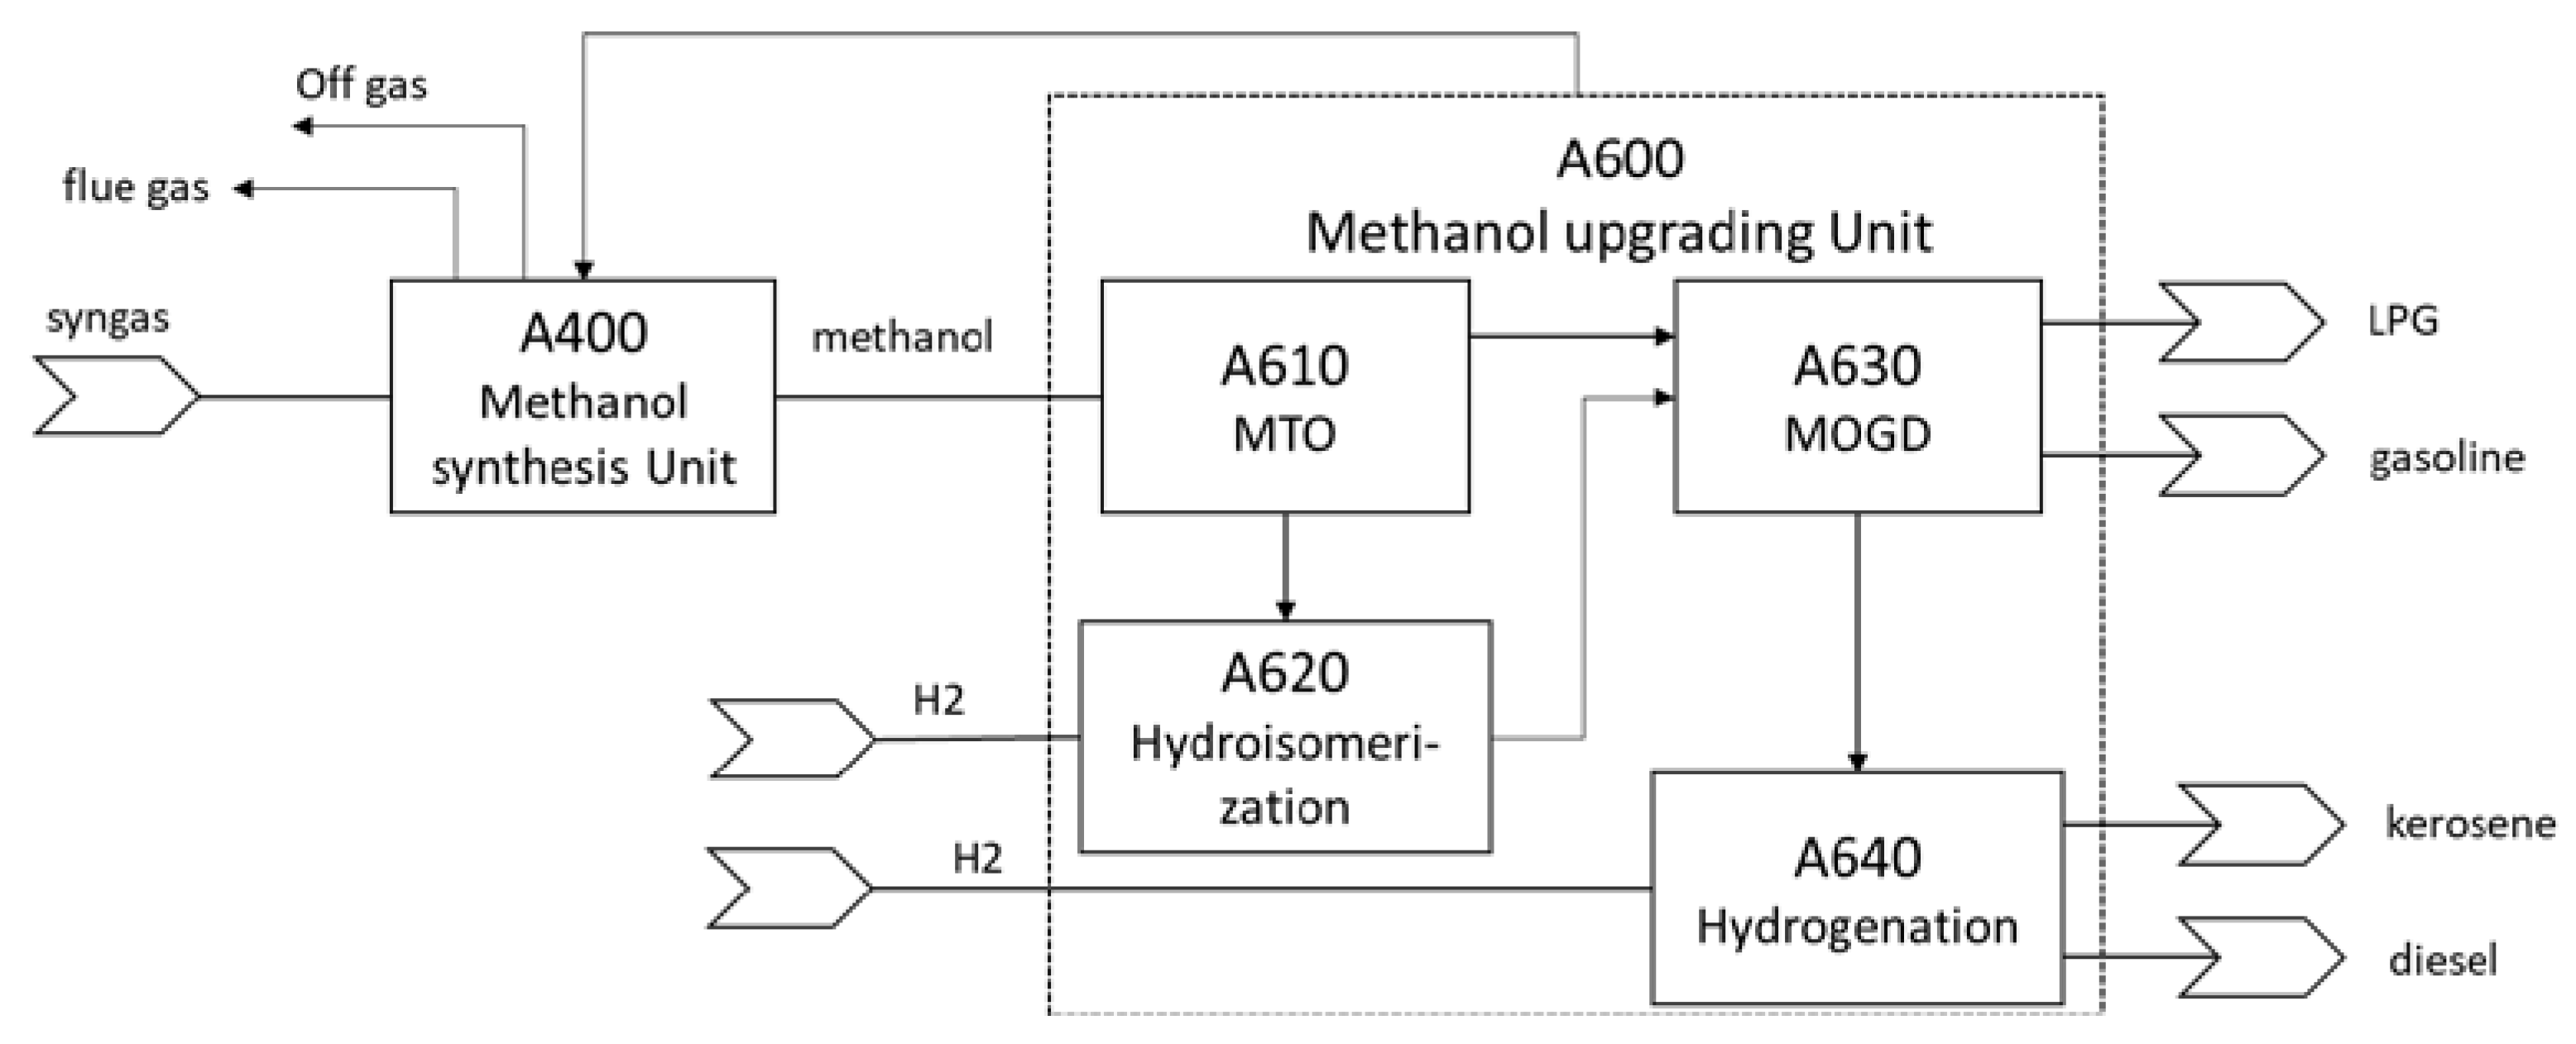
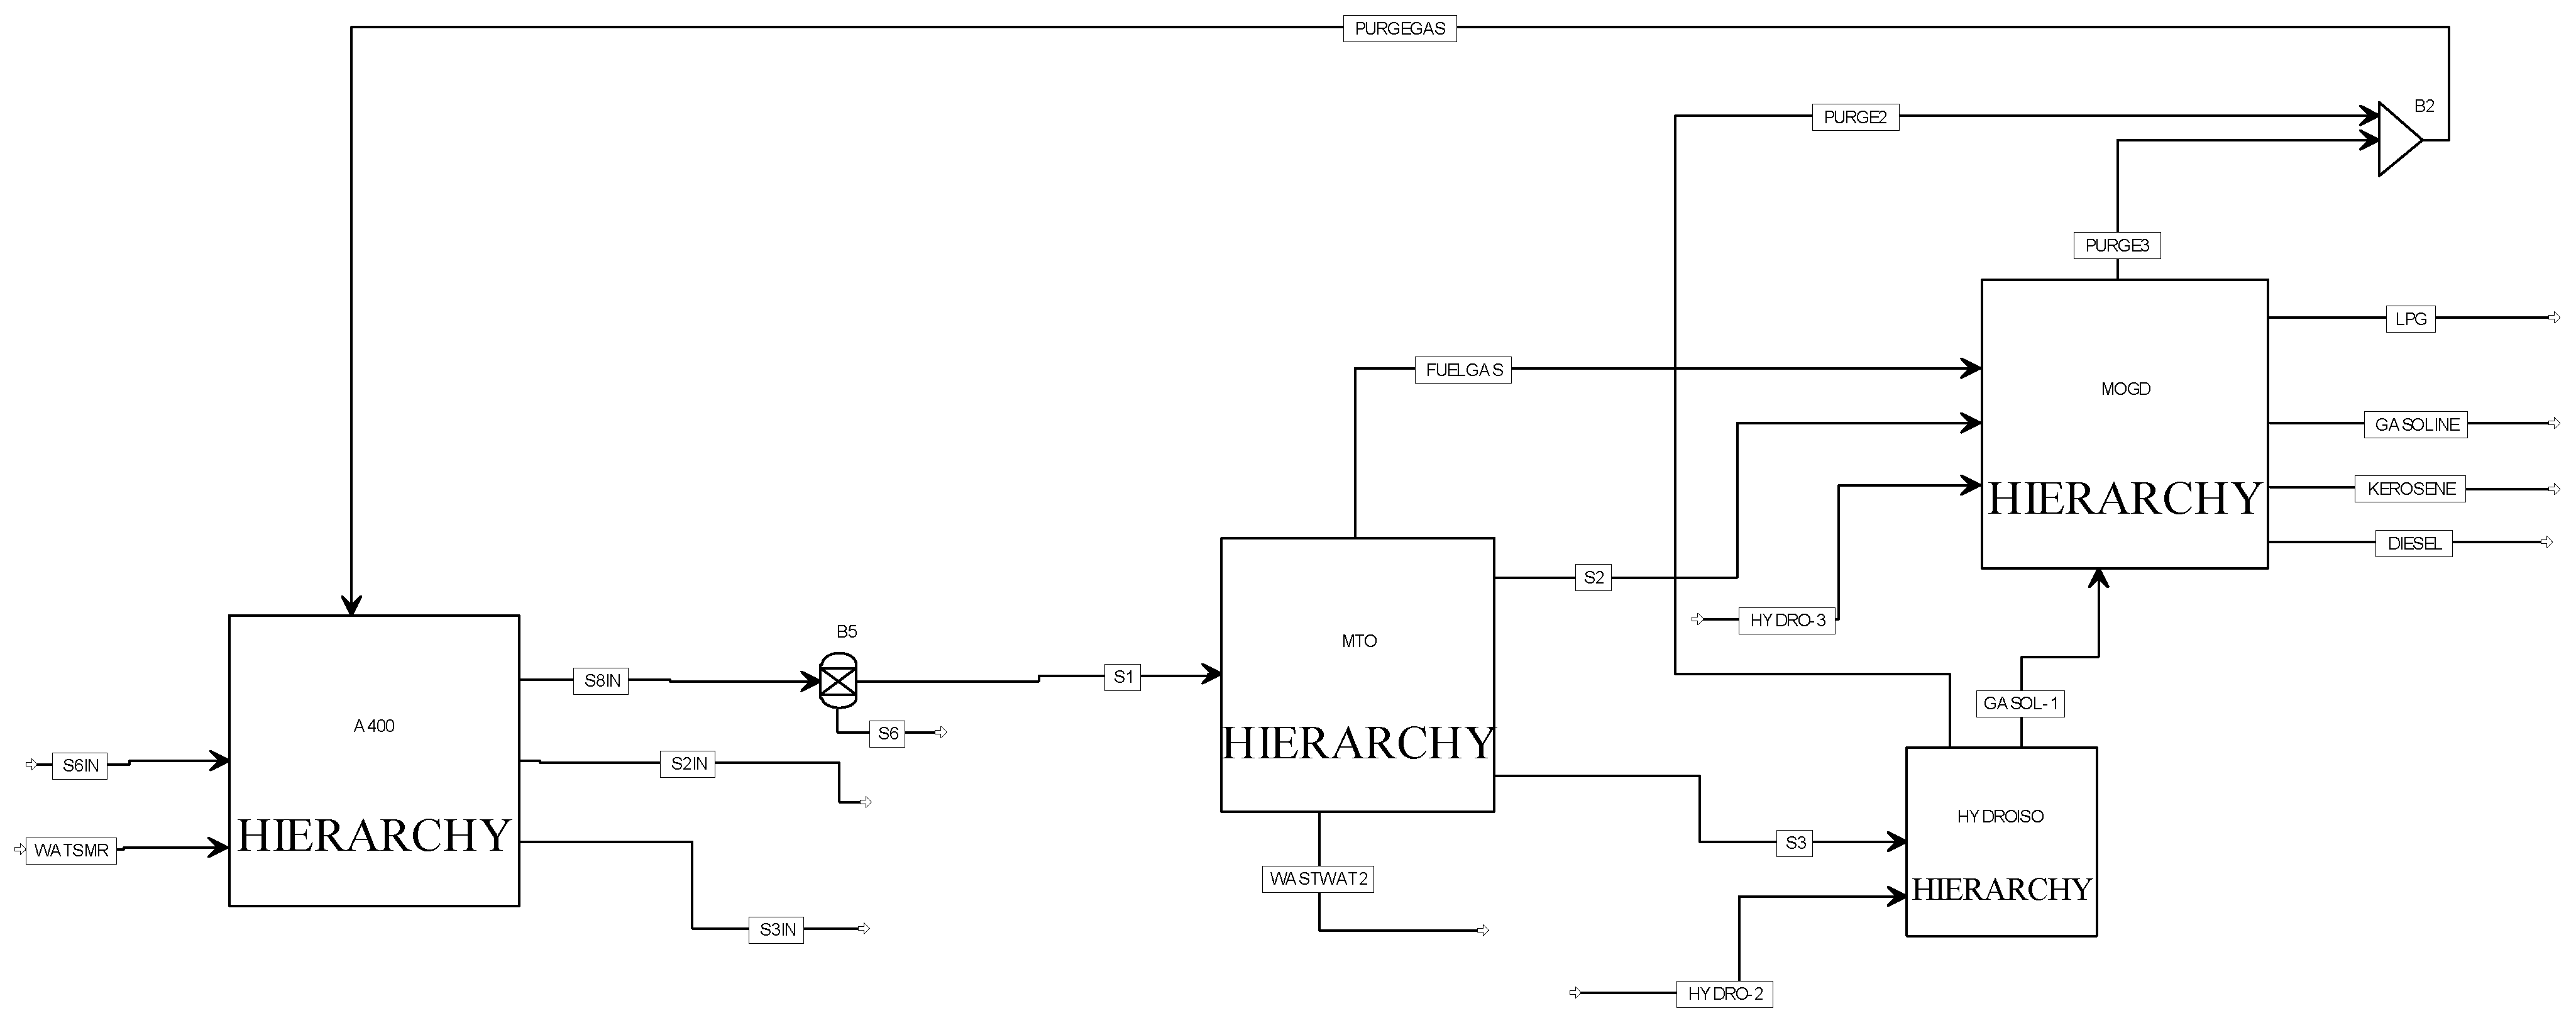
2.5. A600 Methanol Upgrading into Liquid Transport Fuels
In this study, the production of advanced, drop-in fuels for transportation use is investigated as an indicative option for methanol’s further valorization as a chemical block. To achieve this, the so-called MTO-MOGD (methanol-to-olefins, Mobil’s olefins to gasoline and distillate) process is employed. This is an interesting technology for methanol conversion into liquid fuels, developed by Mobil three decades ago but still in a pre-commercial stage [
25]. The MTO process employs the ZSM-5 zeolite to convert methanol into a range of olefins, which in turn are upgraded into a mixture of gasoline and distillate within an oligomerization reactor (MOGD). Moreover, the produced crudes from the MTO and MOGD reactors undergo hydroisomerization and hydrogenation, respectively, in order for the gasoline and distillates to obtain the required specifications according to the standards of the respective fossil-derived fuels. The block flow diagram of the methanol conversion section is seen in
Figure 7. More details on the process and the principles of the reactors’ operation can be found in [
25,
26,
27,
28]. The detailed process flowsheet has been fully adopted in the recent study of Ruokonen et al. [
27] that modeled and analyzed this technology for a concept that methanol is derived from CO
2 hydrogenation. The only point of differentiation is that in this study, all the purge gas streams along with the light fuel gas are sent back to the methanol synthesis unit.
3. Model Methodology
The overall integrated process model was developed in the commercial software Aspen Plus
TM (Aspen Technology, Inc., MA, USA) elaborated with the implementation of calculator blocks to simulate as efficiently as possible complex processes such as HTW gasification The reference case, described hereinafter, refers to a plant operation with an initial fuel composition of 50% LEG and 50% SRF (873 MW
th thermal input). To achieve this, an integrated refinery concept is considered. The selected main feedstock specifications for the reference scenario are presented in
Table 1.
An important aspect for the proper operation and integration of the individual units (HTW gasifier, syngas scrubbing, Rectisol, methanol synthesis) is the definition of the appropriate property method for the accurate estimation of the thermo-physical properties of the material streams of the process.
Following the same approach with other past relevant studies, the property method selected for the syngas production, conditioning and conversion into methanol is RK-SOAVE [
29,
30]; for the methanol recovery is NRTL [
29]; and for the methanol upgrading is Peng–Robinson [
31].
3.1. HTW Gasifier
Gasification can be regarded as the most challenging part of the model development. Hydrodynamics play a considerable role in the process performance. Like in the majority of detailed BFB gasification process models in the literature, the Kunii–Levenspiel model for bubbling fluidized bed was employed [
32,
33]. Information such as fluidization agent characteristics (
U,
μ), gas/solids density (
ρg,
ρp), particle mean diameter (
dp), reactor main dimensions (
D,
Ht,
At), perforations and solids inventory (
W) are used as input in order to calculate the bed height (
hf), dense zone/freeboard volume area, solid volume fraction distribution as well the bubble/emulsion phase volume ratio (
δ).
The minimum fluidization velocity is calculated as [
32]:
The bed height is estimated as [
34]:
where
U is the superficial velocity and
hmf is calculated as:
The volume fraction of the bed consisting of bubbles (
δ) is defined as:
where the relative bubble velocity (
ub) is calculated as [
35]:
The bubble diameter (
db) is calculated from the following equation [
36]:
where the maximum bubble diameter (
dbm) and the initial bubble diameter (
db0) are respectively:
Concerning the reaction mechanism, it is split into two steps, i.e., the devolatilization and the gasification step. The devolatilization step is modeled as instantaneous (no effect of time), but the remaining char is modeled as C instead of C
aH
bO
c. Representation in the form of C
aH
bO
c could not work, as the feedstock composition varies with the lignite/SRF fraction variations and the selected components along with their properties must be defined a priori in Aspen Plus. The H and O that do not participate in the char formation remain in gaseous form, thus respecting the elemental balance closure:
where the mass concentrations of the gases are calculated as a function of the gasification temperature and the respective expressions were retrieved based on the experimental results from coal pyrolysis of Zeng et al. [
37]:
For the impurities’ synthesis, the following reactions are assumed:
To model the impurities’ formation, an RSTOIC is employed. The conversion rates were determined from the respective experimental results in [
19] and are 0.9 for S in (R2), 0.1 for S in (R3), 0.98 for N
2 in (R4) and 1.0 for Cl
2 in (R5).
In the gasification step, it is assumed that only homogeneous reactions take place in the bubble (CSTR) and freeboard (RPLUG) zone, whereas in the emulsion zone (CSTR), both homogeneous and heterogeneous reactions are considered.
The kinetic rate expressions (see
Table 2) are obtained from the literature, but the kinetic parameters are fine-tuned accordingly in order to approach the desired gasification product yield provided by [
19].
The main input parameters for the HTW gasifier unit are summarized in
Table 3.
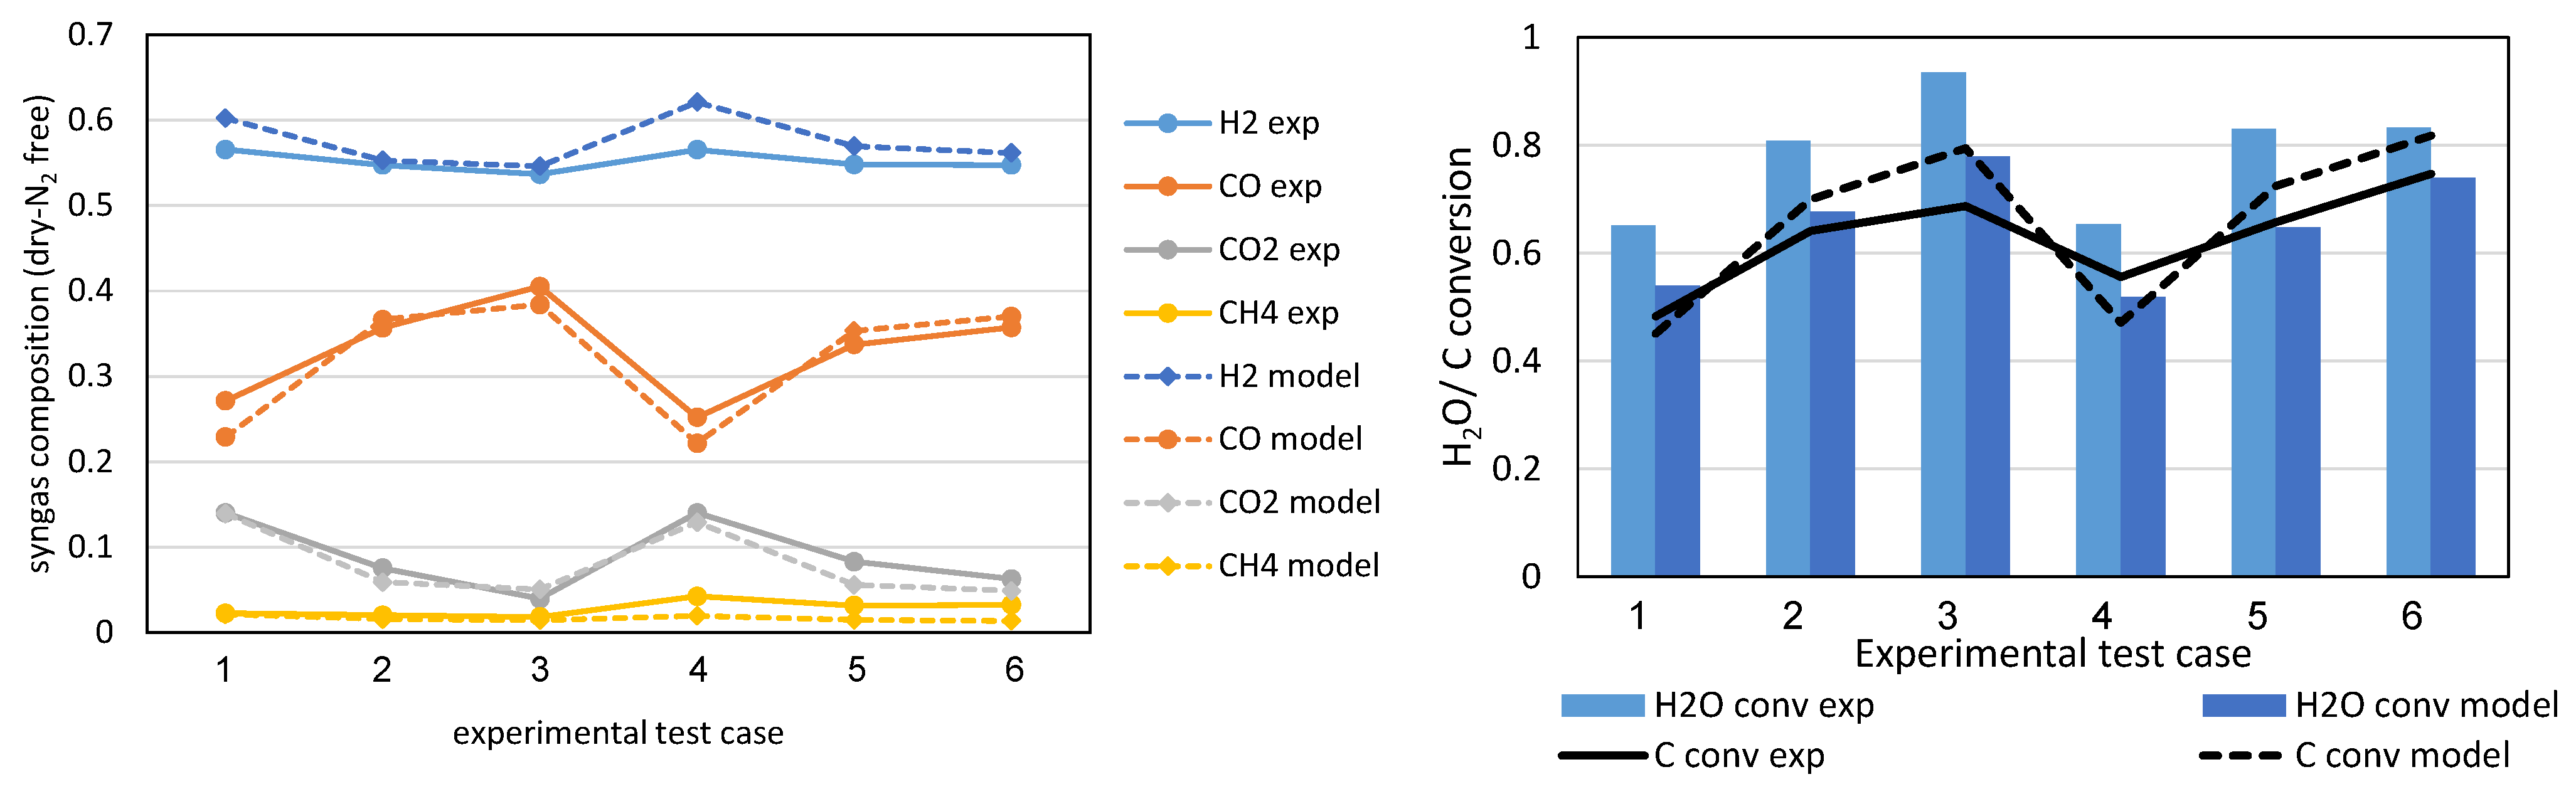
The gasifier model follows the experimental data from [
19], where steam/air gasification tests were performed with a lab-scale bubbling bed reactor using the same lignite/SRF fuels as the present study.
Figure 8 presents the main syngas compounds’ concentration and the carbon and water conversion from various test runs and the respective values predicted by the model. It is seen that generally, the gasifier model-derived results are in agreement with the experimental results. The water conversion is under-predicted due to the lower reaction rate of the water–gas reaction (R13) that that of the heterogeneous reaction (R15).
3.2. Air Separation Unit
There are two principal methods in the industry to supply oxygen, i.e., the pressure swing absorption (PSA) and cryogenic air separation unit (ASU) [
38]. PSA is mostly suited for small/medium-scale plants with lower pressure and oxygen purity up to 95%. ASU, on the other hand, is suited mostly for large-scale plants and produces higher purities up to 99.99%. The present ASU model was developed and taken from the literature [
39]. The developed ASU model generates an oxygen purity of 99.55%
v/
v, a nitrogen purity of 98.37%
v/
v and argon purity of 97.5%
v/
v.
3.2.1. Air Refrigeration
Ambient air is used as an input stream in the separation process which includes 78.11% N2, 20.96% O2 and 0.93% Ar. A series of four compressors with isentropic efficiency 91% increase the pressure of the incoming air stream to 6.07 bar. The normal boiling points of nitrogen and oxygen are 77 K and 90 K, respectively. This means that the air afterwards must be cooled down as much as possible to very low temperatures for the separation to take place. The compressed air is split and about 10% is compressed even more, cooled down and passed through an expander. The work produced by the expander is used to drive the compressor.
3.2.2. High Pressure Column (HPC)
The main air feed which is cooled down at a temperature of −172 °C enters the HPC. This column separates nitrogen from argon and oxygen, producing pure (99.7%
v/
v) liquid nitrogen at the overhead. The flowrate of the bottom product from the HPC is 55% of the feed rate and it contains about 39.1% oxygen and 1.4% argon, with the remainder being nitrogen [
39].
3.2.3. Low Pressure Column (LPC)
The LPC operates at about 1.5 atmospheres and separates the nitrogen and oxygen to give high-purity products of each. The overhead product is gaseous nitrogen with the same purity as the liquid nitrogen product from the HPC. Both liquid and gaseous oxygen are drawn from the bottom of the column. The oxygen product stream will be more than 99.55% pure because the argon is removed from the side draw. The main oxygen feed to the LPC is the bottom from the HPC. It is subcooled by exchange with the low-pressure nitrogen product and is used to provide cooling in the argon column condenser. The air from the turbo-expander is fed a few trays below the main feed. The reflux in the LPC is supplied by the liquid nitrogen product from HPC. This stream is subcooled by exchange with the low-pressure nitrogen product and flashed through a valve.
3.2.4. Argon Column (AC)
The AC feed is a vapor side draw from the bottom section of the LPC and the argon vapor is removed overhead. Because nitrogen is more volatile than argon, it is essential that the feed contains very little nitrogen. In order to ensure this, the draw from the LPC is taken a few trays below the maximum argon concentration. The draw rate is about 20% of the air feed rate to the plant and only about 4% of the draw stream is removed as argon product. The main input parameters for the ASU are summarized in
Table 4.
3.3. Cleaning and Conditioning Unit
The gas cleaning and conditioning unit includes raw syngas scrubbing with intermediate cooling, the CO-shift reactor and the developed Rectisol® process. The syngas scrubbing unit was implemented using a RADFRAC column with a fixed overhead operating temperature at 170 °C to remove the HCL and the ammonia. The methanol solvent inlet temperature was selected to be −60 °C. All the cooling requirements of the Rectisol® process are covered from a developed refrigeration system. For the two absorbers, the selected pressure was set to 27 bar, while the stripper inlet pressure was set to 1 bar. The unit operation that was used for the modeling of these three columns is RADFRAC. The selected upstream targets for the Rectisol® process are low contaminant and inert concentrations (H2S < 1 ppm and CO2 < 2–3% v/v) and desired H2/CO molar ratio = 2.0.
Since the syngas ratio has to be achieved upstream of the methanol synthesis reactor, the impact of the CH
4 reforming also has to be considered. Therefore, the molar ratio H
2/CO at the exit of the WGS reactor was fixed to a value slightly below 2, to achieve the desired H
2/CO ratio at the methanol synthesis. Concerning the WGS reactor parameters, adiabatic operation at 250 °C and 34.7 bar was imposed [
40]. For the WGS reactor modeling, an RPLUG block unit was employed. The RPLUG considers that only the water–gas shift reaction takes place in the reactor with kinetic parameters [
41], contrary to RGIBBS which considers an overall chemical equilibrium (i.e., the production or consumption of compounds other than H
2, CO, CO
2 and H
2O). The main input parameters for the gas cleaning and conditioning unit are summarized in
Table 5.
3.4. Methanol Synthesis Unit
After the CO
2 removal, the syngas is compressed up to 80 bar and cooled down to a temperature of 230 °C prior to the methanol synthesis reactor [
42]. The methanol synthesis was modeled as an equilibrium reactor with specified reactions, (R9) and (R16):
The REQUIL block unit calculates equilibrium by solving stoichiometric chemical and phase equilibrium equations, and the constants are calculated from Gibbs free energy. In order to be in agreement with conversion rates in the LPMEOH
TM process (Air Products’ liquid-phase conversion company trademark for methanol synthesis [
43]), a temperature approach of 27 K for both reactions is assumed [
42]. After the reactor, the rich methanol product gas is cooled down to 30 °C and enters a flash separator. The gas leaving the flash overhead is mainly unreacted gas which is recycled through the SMR to increase the utilization of carbon and energy contained inside the methane. Due to the endothermic reaction in the reformer, a portion of the recycled gases is combusted to thermally assist the SMR operation. The overall yield is high with a value of 99% recovery, with the remaining 1% sent to purge. A 99% recovery was chosen to obtain as high an overall methanol yield as possible, and at the same time reduce build-up of process gas. After the reformer, the recycled gas is compressed and heated to reach the requirement of 240 °C and 80 bar.
The methanol stream is imposed in two consecutive flashes to separate some of the unreacted gas dissolved in the methanol. Afterwards, it is transferred to a 30-stage RADFRAC column where a mole purity of 97.1% methanol is achieved. The main parameters for the methanol synthesis unit are summarized in
Table 6.
3.5. Methanol Conversion and Upgrading
The modeling that concerns the MTO-MOGD process was based on the study of Ruokonen et al. [
27], where the model methodology, selected operation units and properties methods are presented with a high level of detail.
3.6. Investigated Scenarios
The two fuels considered in this study are lignite and SRF. Producing SRF from waste minimizes and reduces the associated environmental issues. The use of lignite could help to provide more stable gasification process conditions and prevent problems caused by SRF quality [
44]. The gasification of SRF and lignite using the commercial HTW gasification technology is an attractive alternative that ensures syngas of high quality along with high carbon conversion efficiency [
21]. The main three fuel mix options considered in the study for the production of methanol are:
Case 1:
Case 2:
Case 3:
The stream results for each feedstock with the exit streams of each of the main sub-units of the plant concept (i.e., HTW gasifier, gas cleaning and conditioning, methanol synthesis) are presented in
Section 4 and the
Appendix A. Moreover, the heat and mass balances of the overall value chain were calculated for each case examined and the overall performance of the concept was assessed via key performance indicators, such as
CU and
EFE.
The term for the exergy of heat stream is defined by [
45] for
Section 4.4:
where
T is the temperature, at which
Q is available and
T0 is 25 °C.
The term of thermal efficiency is introduced in
Section 4.5 for a more holistic approach and comparison between the alternative methanol production routes, as defined by [
46]:
For
Section 4.6, where the role of methanol for advanced liquid fuel production is examined, the
EFE is defined as:
4. Results and Discussion
4.1. Process Simulation Results
The results from the process calculations for case 2 are presented and analyzed in this section.
4.1.1. Material Balance
The proposed concept for methanol synthesis responds well to all three examined cases and the system behavior is similar for every selected feedstock mixture (i.e., 80/20, 50/50, 20/80 wt % lignite/SRF). This is because, in each case, the production of a similar syngas composition and gasification efficiency from the HTW gasification unit via the appropriate adjustment of the gasification agents (oxygen and steam), is sought. This allows for gasification stability and proven feedstock flexibility that ensures the concept adaptability in each case without major changes in the selected configuration. Therefore, within this section, we elected to include only the stream results (
Table 7) and corresponding H&Ms for the 50/50 scenario (case 2), since they can be considered as representative in order to define the general nature of the process. The main differentiations of the other two cases (80/20, 20/80) derive mainly from the concentrations of feedstock contaminants (e.g., sulfur, nitrogen, chloride) and their subsequent removal prior to the methanol synthesis unit. Moreover, due to the slightly higher energy content of SRF compared to lignite, increased yields in the methanol production and the overall concept performance are observed when the SRF fraction in the initial feedstock mixture increases. The stream results for the other two cases are in the
Appendix A.
Starting with the HTW gasification unit, a 50% LEG–50% SRF wt % solid feedstock mixture (A100-S1 and A100-S2) enters the gasifier, where, with the addition of steam (A100-S3) and pure oxygen (A200-S2), it is transformed into valuable syngas. The ASU utilizes air (A200-S1) and provides the appropriate oxygen amount to the system for auto thermal operation of the HTW gasifier (~1% of the total thermal input is considered as heat losses). Concerning the raw syngas composition (A100-S4), remarkable points are the notable CH4 formation that indicates reforming requirements for efficient fuel (i.e., methanol) production and the limited tar production rates due to the relatively high gasification temperatures that are applied in the HTW unit.
In the water scrubber, complete removal of HCl along with partial removal of NH3 and heavier tars are achieved (A300-S1). Then, around 30% of the syngas passes in the CO shift reactor to generate hydrogen and mixes with the bypass stream. The shifted gas is routed to the downstream COS hydrolysis reactor, where complete conversion of organic sulfur to H2S takes place along with HCN conversion to CO and NH3 (A300-S2). The outlet streams of the developed Rectisol® configuration are the cleaned pure syngas (A300-S4) that enters the methanol synthesis unit and the obtained pure CO2 stream (A300-S3) that paves the way for CCS/CCU and further carbon exploitation of the concept. In addition, a smaller acid gas stream (A300-S5) contains mainly CO2 but also notable H2S concentrations, which explains its redirection into a sulfur recovery unit (i.e., Claus).
A400-S1 contains the unconverted components that are recycled back to the reactor. A H2-rich external loop (A400-S2) enters the reactor after reforming and re-compression up to the methanol synthesis reactor pressure. Liquid methanol (A400-S3) is extracted at environmental conditions and separated from off-gases.
4.1.2. Energy Balance
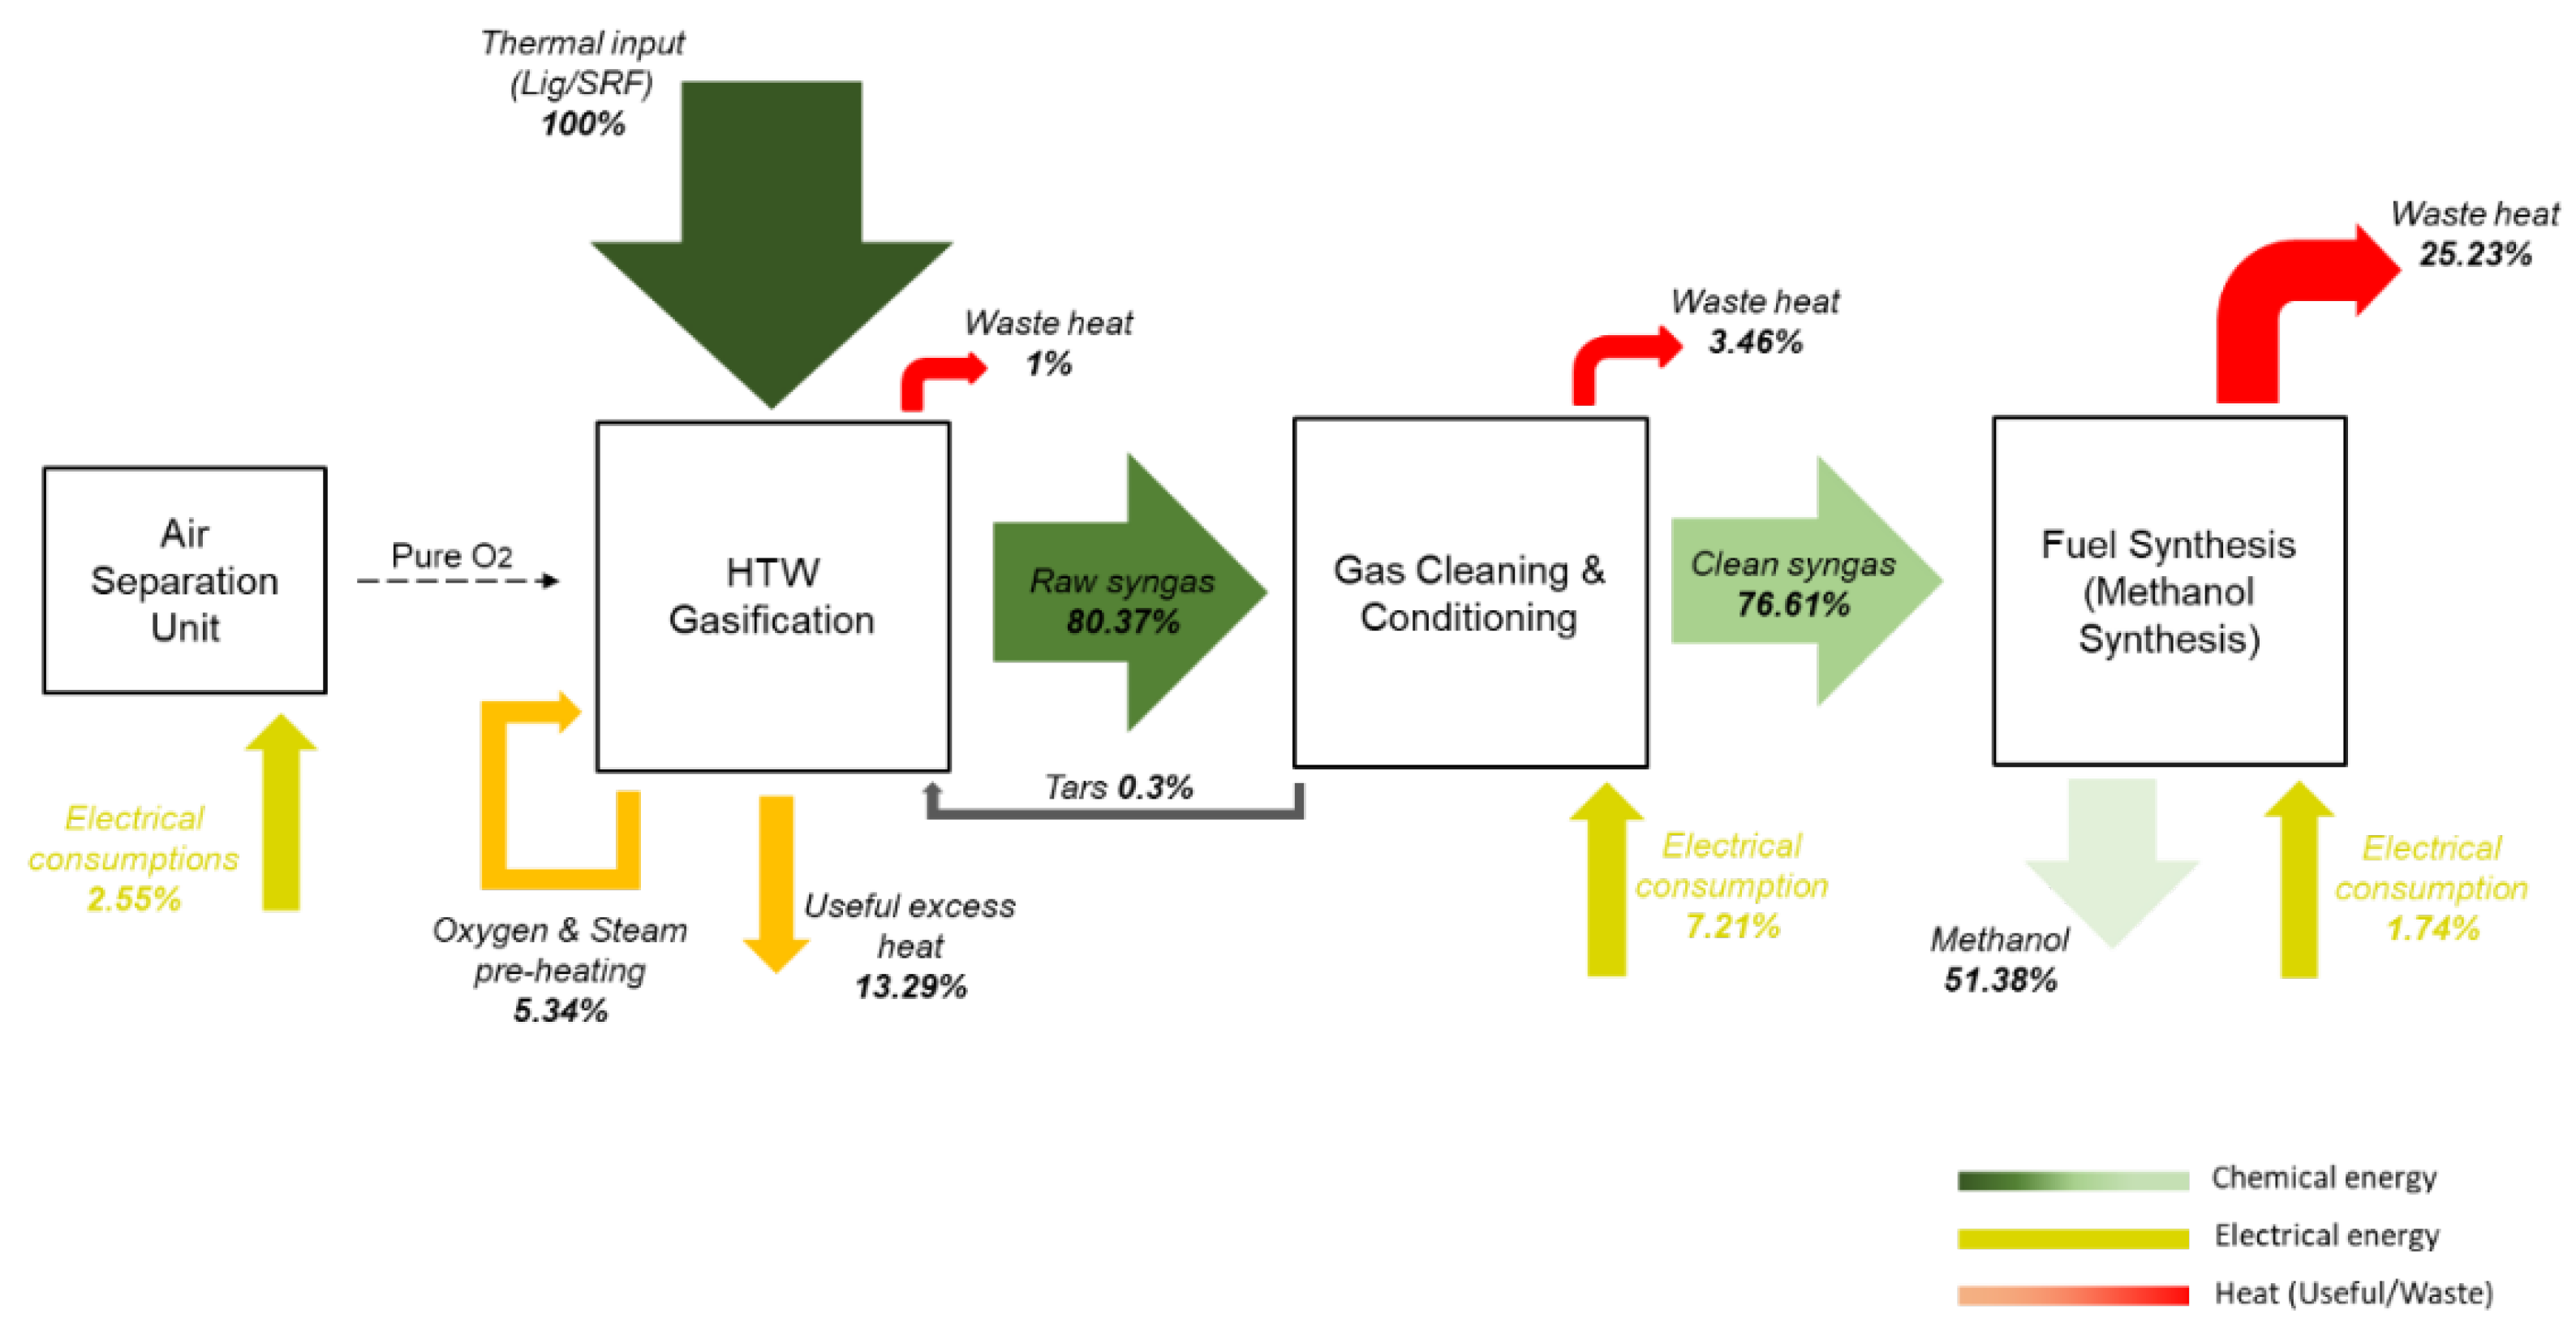
The heat balances of the concept for case 2 (50/50 LEG/SRF feedstock) are presented in
Figure 9.
CGE around 80% is achieved from the HTW gasification unit, while the thermal exploitation of the hot raw syngas accounts for around 20%. This thermal exploitation refers to the preheating demands of oxygen and steam that will be involved in the gasification process as well as the useful excess heat that can be utilized for further steam generation and provide it as an external source. Moreover, 1% heat losses of the total thermal input within the HTW gasification unit are envisaged. The heat losses of the gas cleaning and conditioning unit are minor, while the main heat losses of the process are observed in the methanol synthesis procedure (~25%), due to (i) the exothermic reactions of methanol production, (ii) the partial syngas combustion for the SMR heat assistance as well as (iii) the off-gases that leave the process. Concerning the latter, their combustion in an afterburner provides further exploitable heat in the process chain, but this is considered as a “loss” from the as high as possible energy content sought from the produced methanol stream. Nevertheless, a fair EFE around 51% is calculated, referring to the fraction of chemical energy of initial feedstock mixture that is found in the final methanol product. Finally, regarding the electrical requirements of the plant, the major electrical consumption is located in the gas cleaning and conditioning unit due to the presence of the Rectisol® process, while the ASU and the high-pressure methanol synthesis are the other two energy-intensive units of the concept. The electrical consumption is presented in correlation (%) with the thermal input of the process.
4.1.3. Carbon Balance
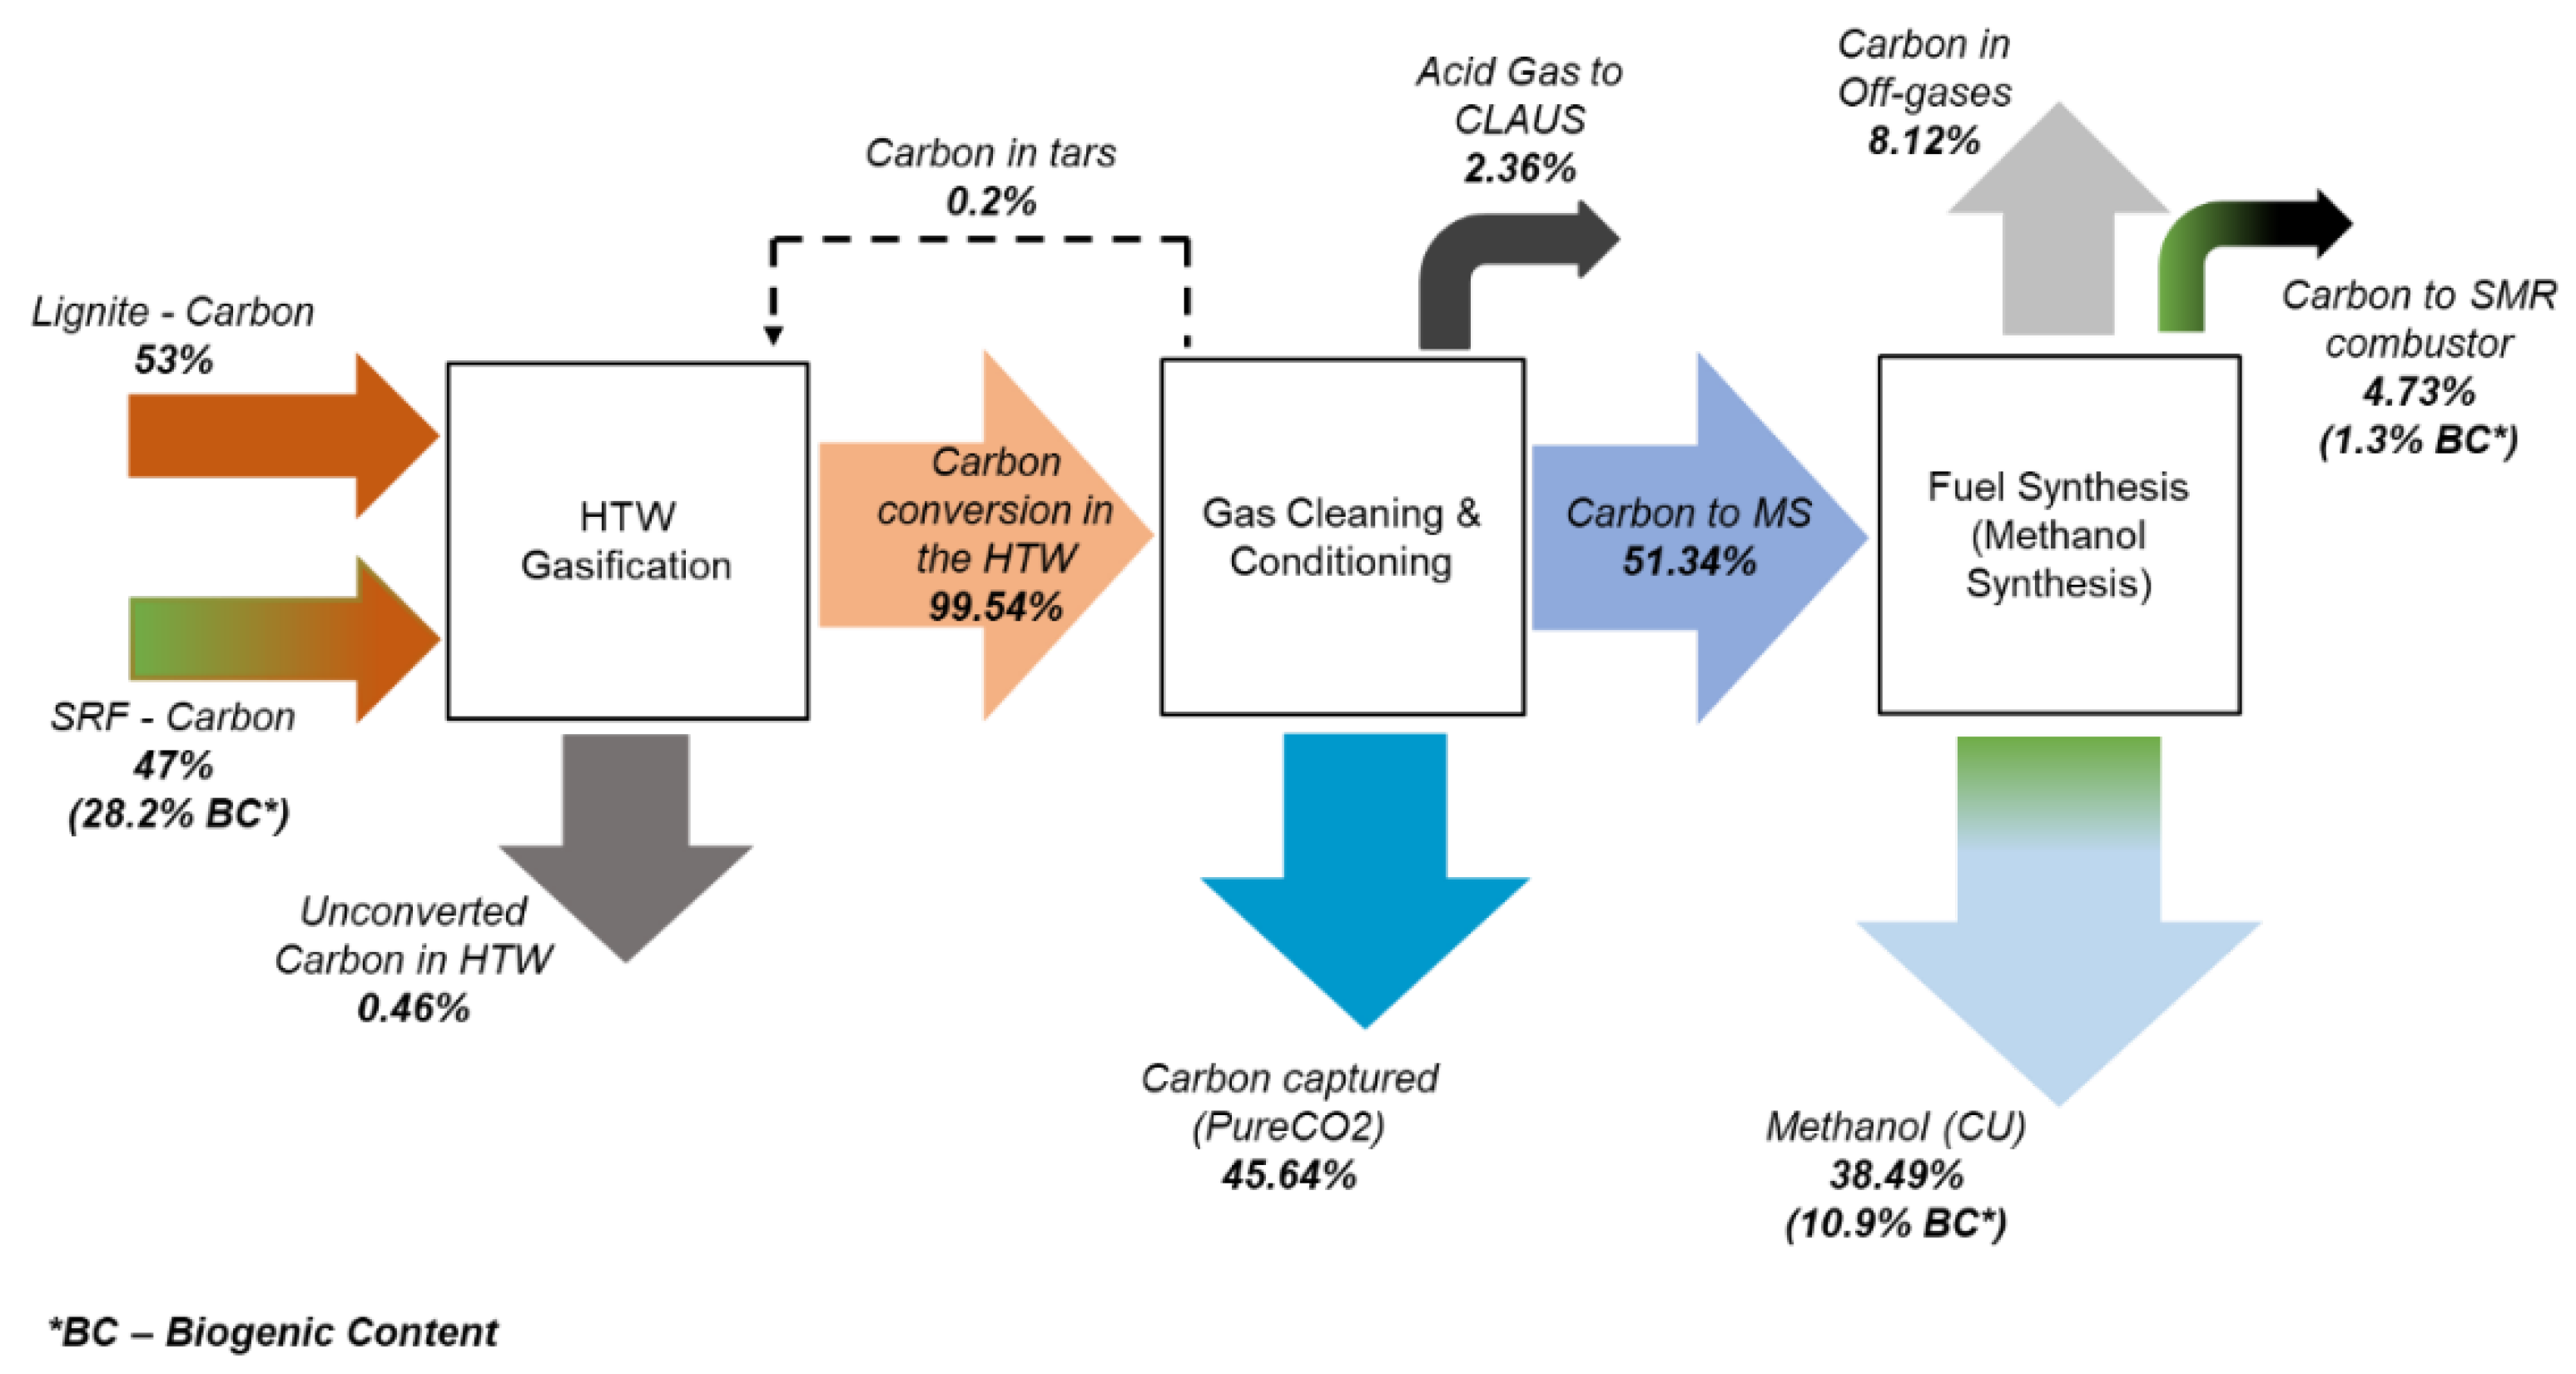
The carbon balance of the concept for case 2 (50/50 LEG/SRF feedstock) is presented in
Figure 10.
Efficient conversion (~99.5%) of the carbon that enters the HTW gasification unit is observed in the gasification process. Nevertheless, due to the biogenic content of the SRF fuel, 28.2% of the total input carbon in the 50/50 case can be considered renewable. This biogenic fraction of the input carbon has an impact on the overall carbon emissions of the process. Furthermore, the processed carbon leaves the gasification unit in the form of mainly CO, CO2 and CH4 via the produced syngas and enters the gas cleaning and conditioning unit. Then, after a partial carbon transformation from CO to CO2 via the CO shift reaction, a high percentage of carbon (~45%) is captured in the form of pure CO2 in the AGR unit. The remaining carbon in the clean syngas is directed to the methanol synthesis unit to participate in the formation of the end-product of the process. There, partial syngas/carbon combustion for the heat demands of the SMR takes place (~5%), where 1.3% can be considered biogenic, while a remarkable carbon portion (~8%) leaves the process via the produced off-gases. The rest of the carbon can be found in the valuable methanol stream yielding a decent CU equal to around 38%, of which 10.9% is biogenic.
4.2. Effect of Oxygen Purity
The effect of oxygen purity on the plant performance is investigated in this section. In the current parametric study, due to the rather high thermal input of the plant (872 MWth), an oxygen-based gasification with 95% O2 molar purity of the ASU is compared with the aforementioned 99.55% molar purity scenario of the 50/50 feedstock case.
In
Table 8, the main differences between the two case studies are presented. The reduction in the power consumption of the ASU for the lower oxygen purity is observed. Even though the ASU power demand for the 95% case is remarkably lower, the total plant consumption is more or less the same as the 99% case, since the presence of nitrogen and argon as inert gases in the produced syngas result in higher gas volumes. The CGE clearly has drop-off as the purity of the gasification oxidant decreases. This reduction in performance is due to the increasing burden of nitrogen and argon, which during gasification play no direct role in the chemical transformations, but the sensible heat to heat them up to the specific gasifier temperature is obtained by the additional oxidation of the fuel components, thus supplying more oxygen to the reactor. This results in a syngas with lower heating value, as observed in
Table 8, and hence lower conversion efficiency. As Chapman et al. [
47] also concluded, the application of purer oxygen in the gasification process contributes to richer syngas and the additional costs associated with it are more than offset by the savings made in plant capital cost and operating expenses.
Another interesting aspect is the N2/Ar concentration in the syngas. For the 95% oxygen purity case, the inert gases’ concentration at the clean syngas is 10 times greater, whereas their concentration at the methanol synthesis reactor inlet is considerably high (8.73%) due to their circulation. This leads to a 2.5 times greater inlet stream volume flow and consequently to a greater reactor size and cost by the same scale.
4.3. Effect of Reformer Type
In this section, we investigate the way the recycling gas is handled in the methanol synthesis unit. As in the base case scenario, no tars/hydrocarbons reforming is considered after the gasifier, so the avoidance of methane accumulation should be taken into account. Although the purge gas that is extracted from the recycling gas can achieve this, the inclusion of a reformer and its role in the overall plant performance is analyzed here.
At first, the type of the reformer is evaluated by examining the case of using an autothermal, oxy-fired reactor instead of a steam methane reformer that is externally heated, as it is considered in the base case. The ATR modeling is based on the assumption of chemical equilibrium, and an RGIBBS is used. Both reformers operate at 35 bar and 950 °C, and the steam to carbon ratio is specified as 2.5.
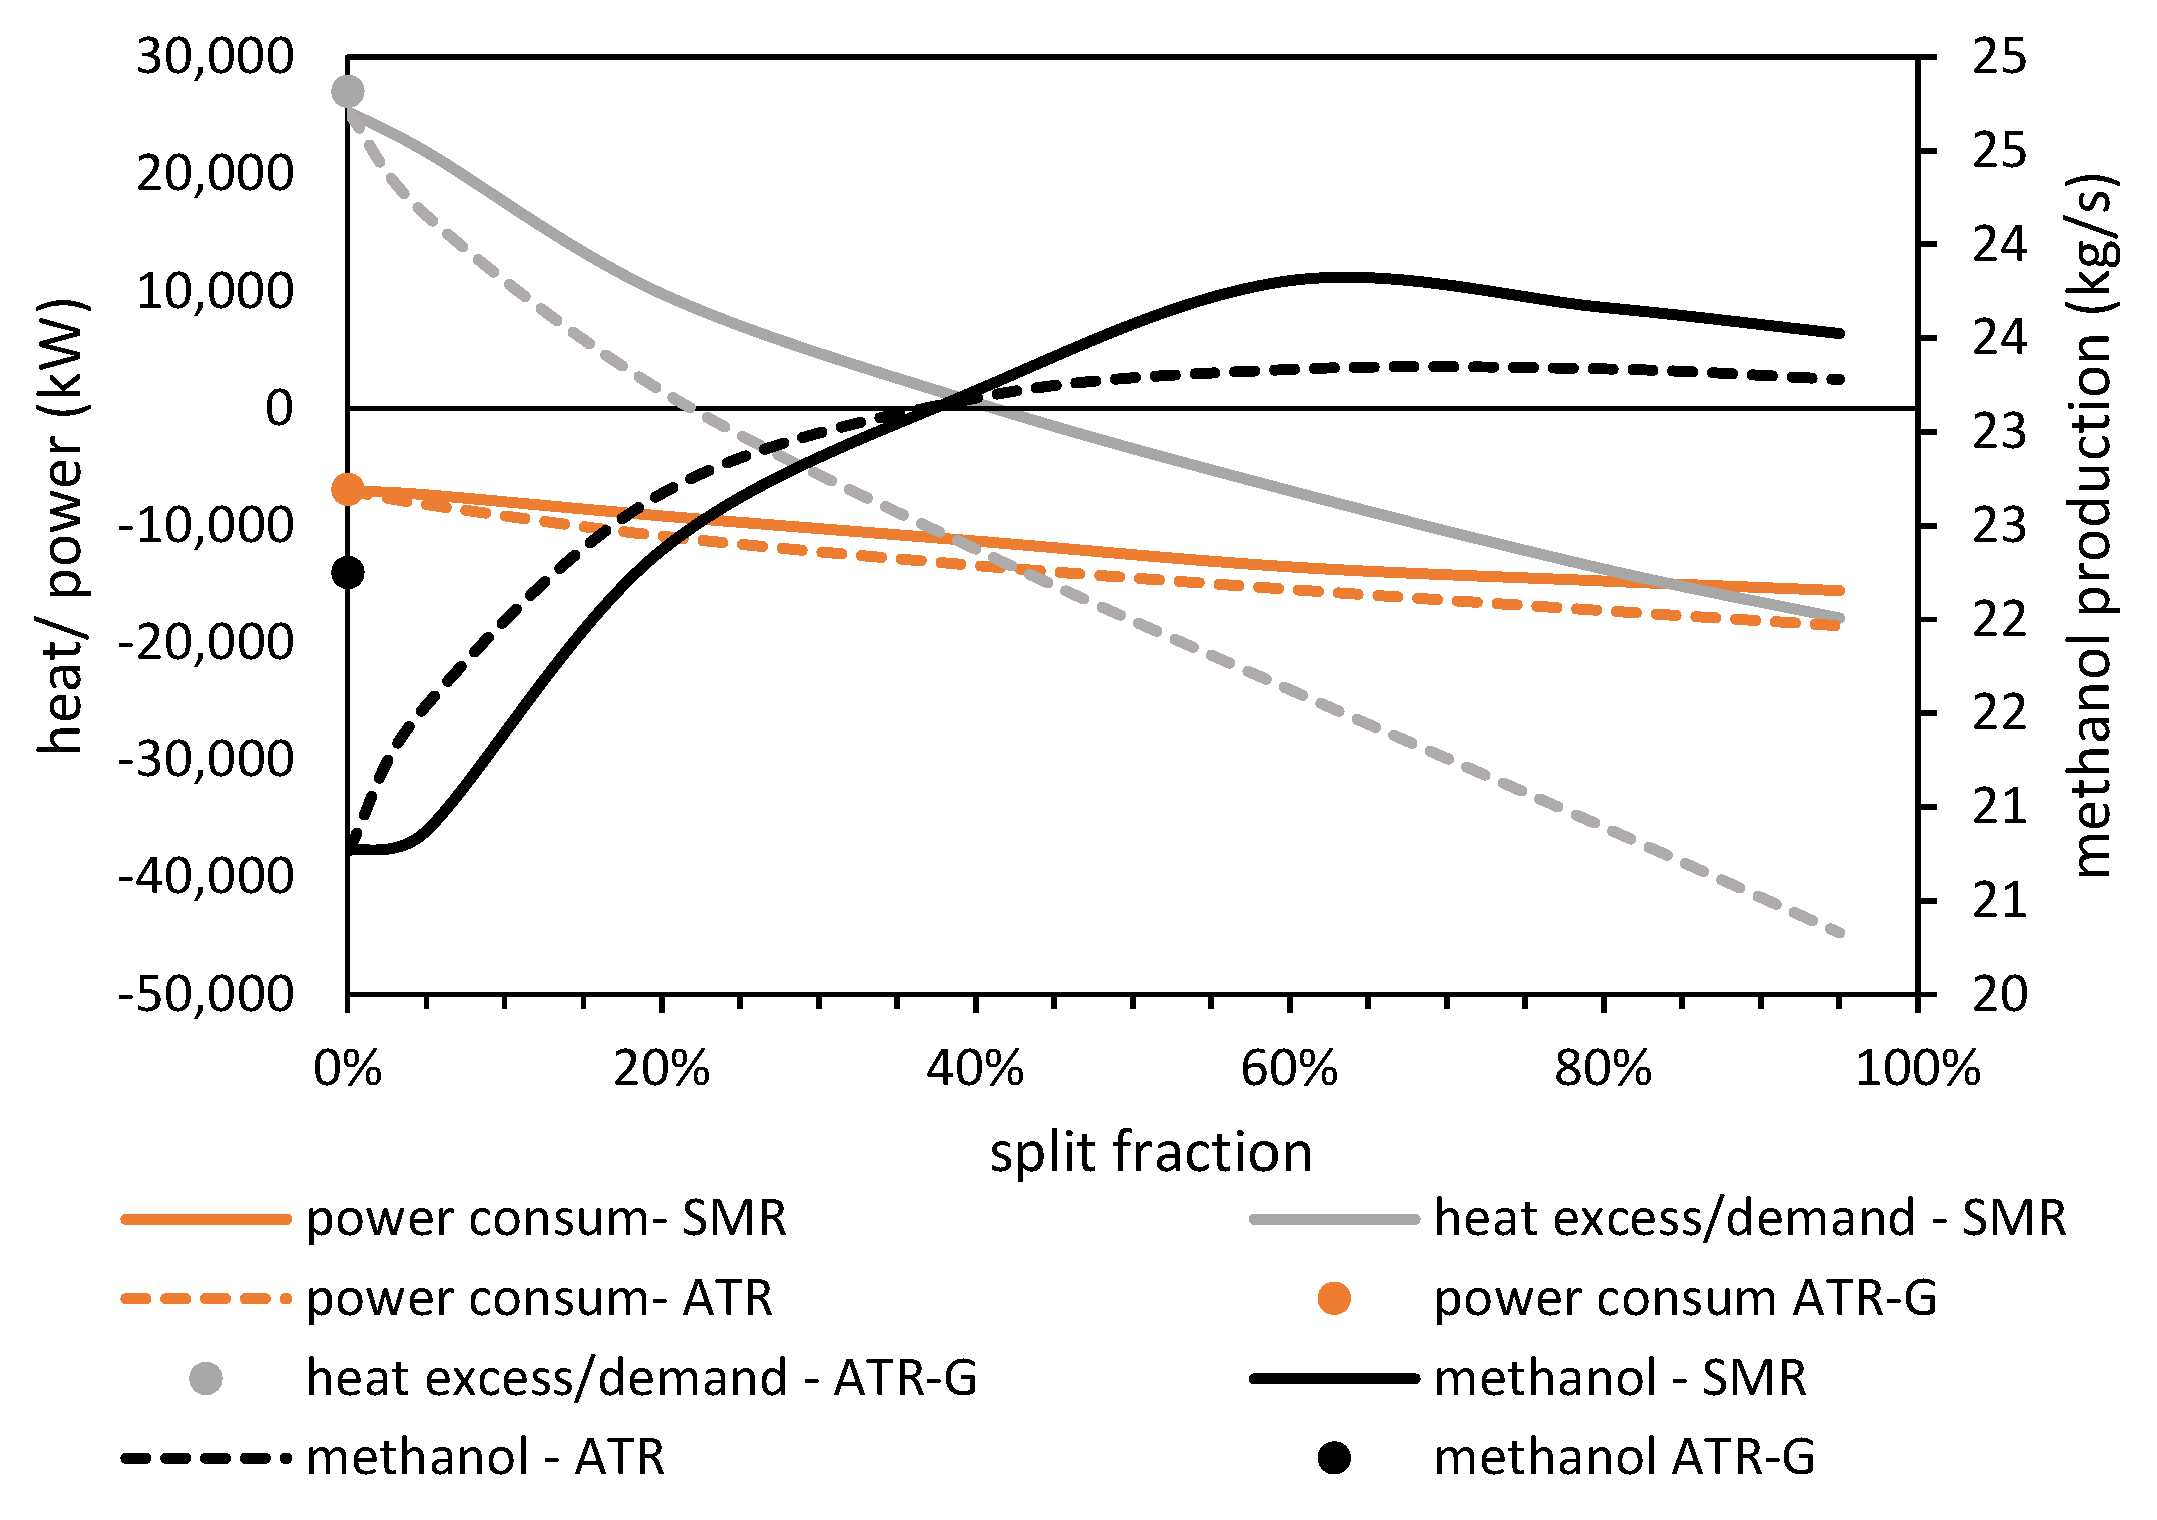
Figure 11 illustrates the effect of the fraction of the recycling gas that undergoes reforming on critical parameters such as the methanol production rate, the power r at the methanol synthesis unit (including the increase in ASU consumption due to the increase in oxygen demand) and the heat balance in the methanol synthesis and purification unit. At first, it makes clear that the inclusion of a reformer, regardless of its type, can increase the methanol yield by 12–15%, without any significant increase in the total power consumption. The conversion of the light hydrocarbons (mainly CH
4) that exist in the final syngas into CO and H
2 has a beneficial impact on the methanol productivity against the low-cost option to extract a portion of the recycling gas. For both reformer types, the methanol yield maximizes for a split fraction rate of 40–60%. On the other hand, for low split fraction rates, the power consumption is low due to the energy demands to compress the recycling gas from 35 bar up to 80 bar after the reformer. Comparing the two reformer types, it seems that the SMR reactor has a more beneficial impact on the plant performance, as the methanol productivity is slightly higher and the heat demands are substantially lower. This is attributed to the higher methane conversion in SMR, a fact that leads to lower heat demands for steam generation.
Moreover, the positioning of a reformer reactor after the gasifier instead of the methanol unit is investigated. An ATR reactor is considered that operates at 950 °C at the same pressure with the gasifier (35 bar) and with a steam to carbon ratio of 2.5. The simulation results show reduced methanol production compared to the optimal cases that position the reformer reactor at the methanol synthesis unit. The reason for that is the high oxygen and steam demands in order to achieve high CH
4 conversion rates in the reformer that operates under high pressure. Nevertheless, the additional power consumption at ASU as well the excess heat at the methanol unit are at the same level with those of the case where no reformer reactor is considered (
Figure 11).
4.4. Effects of Different Feedstock Blending Ratios
In this section, the effects of the three feedstock blending ratios (20/80%, 50/50%, 80/20%) are analyzed. The main simulation results as well as the basic overall process parameters are summarized for each feedstock ratio in
Table 9. In general, the different ratios exhibit similar behaviors concerning the plant performance. This is attributed to the lower heating values of the two solid fuels that are very similar, resulting in the total thermal power input being roughly the same, with a maximum difference of 19.06 MW
th. The relative stability of syngas quality is expressed also with the CGE parameter, defined as the ratio of the chemical energy content of the produced syngas to the thermal input of the gasifier. The
CGE varies slightly, having a decrease of 2.08% from the 20/80 to 80/20 case, in which it achieves a value of 79.04%. The latter has an effect on the raw methanol production stream, which subsequently decreases. The steam to biomass ratio is increased by 11.61% to keep the CGE as high as possible in each case. With typical biogenic content of around 60% in SRF [
44], the CO
2 emissions are reduced to 6.6% in the case where the mixing ratio is 20/80% LEG-SRF, while in the 80/20 case, it increases by 5%. Furthermore, in the methanol stream, the carbon flow of the 20/80 case consists of 52% carbon-neutral content.
As mentioned above, the supply of steam needed by the gasifier increases along with the increase in lignite, taking energy for the pre-heating of the steam from the syngas. In addition, the CGE, which behaves in the opposite context, is reducing the flow rate of produced syngas. Due to these factors, a decrease is observed in the exergy of excess heat as the amount of lignite in the feedstock increases.
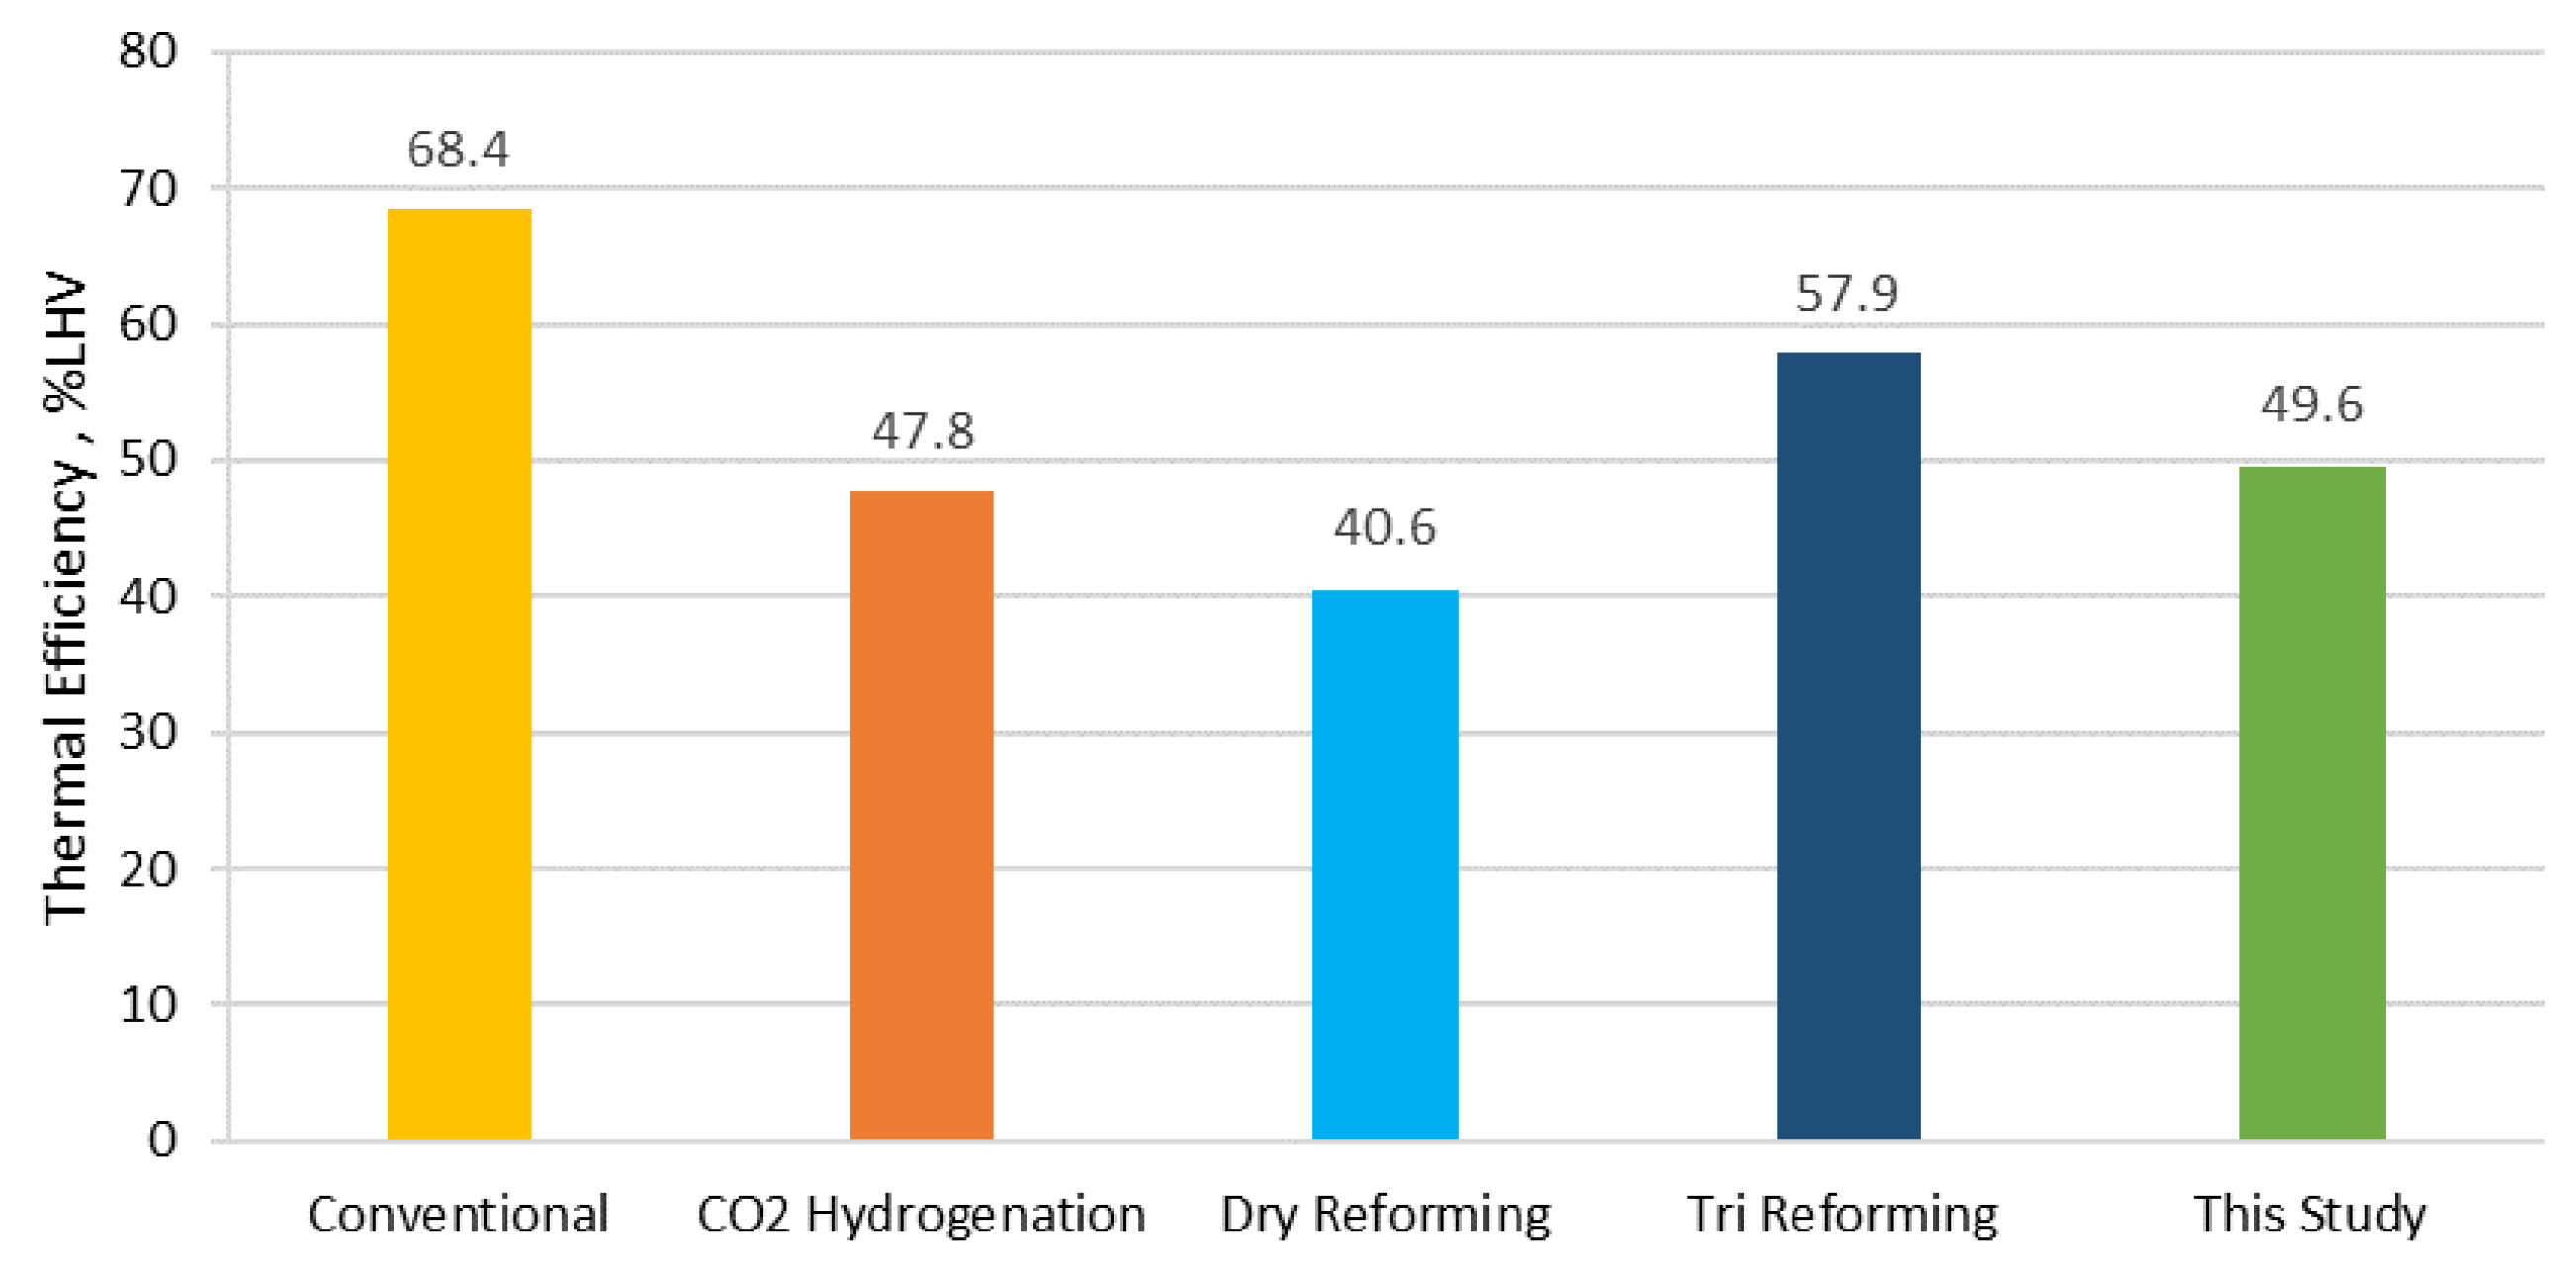
4.5. Comparison with Alternative Methanol Production Routes
This section aims at the “placement” of the proposed methanol production pathway among other technologies and their comparison in terms of thermal and electrical requirements, CO
2 emissions and efficiency. In particular, the main process characteristics of this study are investigated in comparison with the conventional fossil-based methanol production pathway (i.e., SMR/ATR reforming of natural gas) as well as alternative technologies (e.g., electro-methanol routes) such as CO
2 hydrogenation, dry reforming (reforming in the absence of steam) and tri-reforming (parallel reforming with both steam and CO
2). The main process characteristics of these alternative routes have been extracted from [
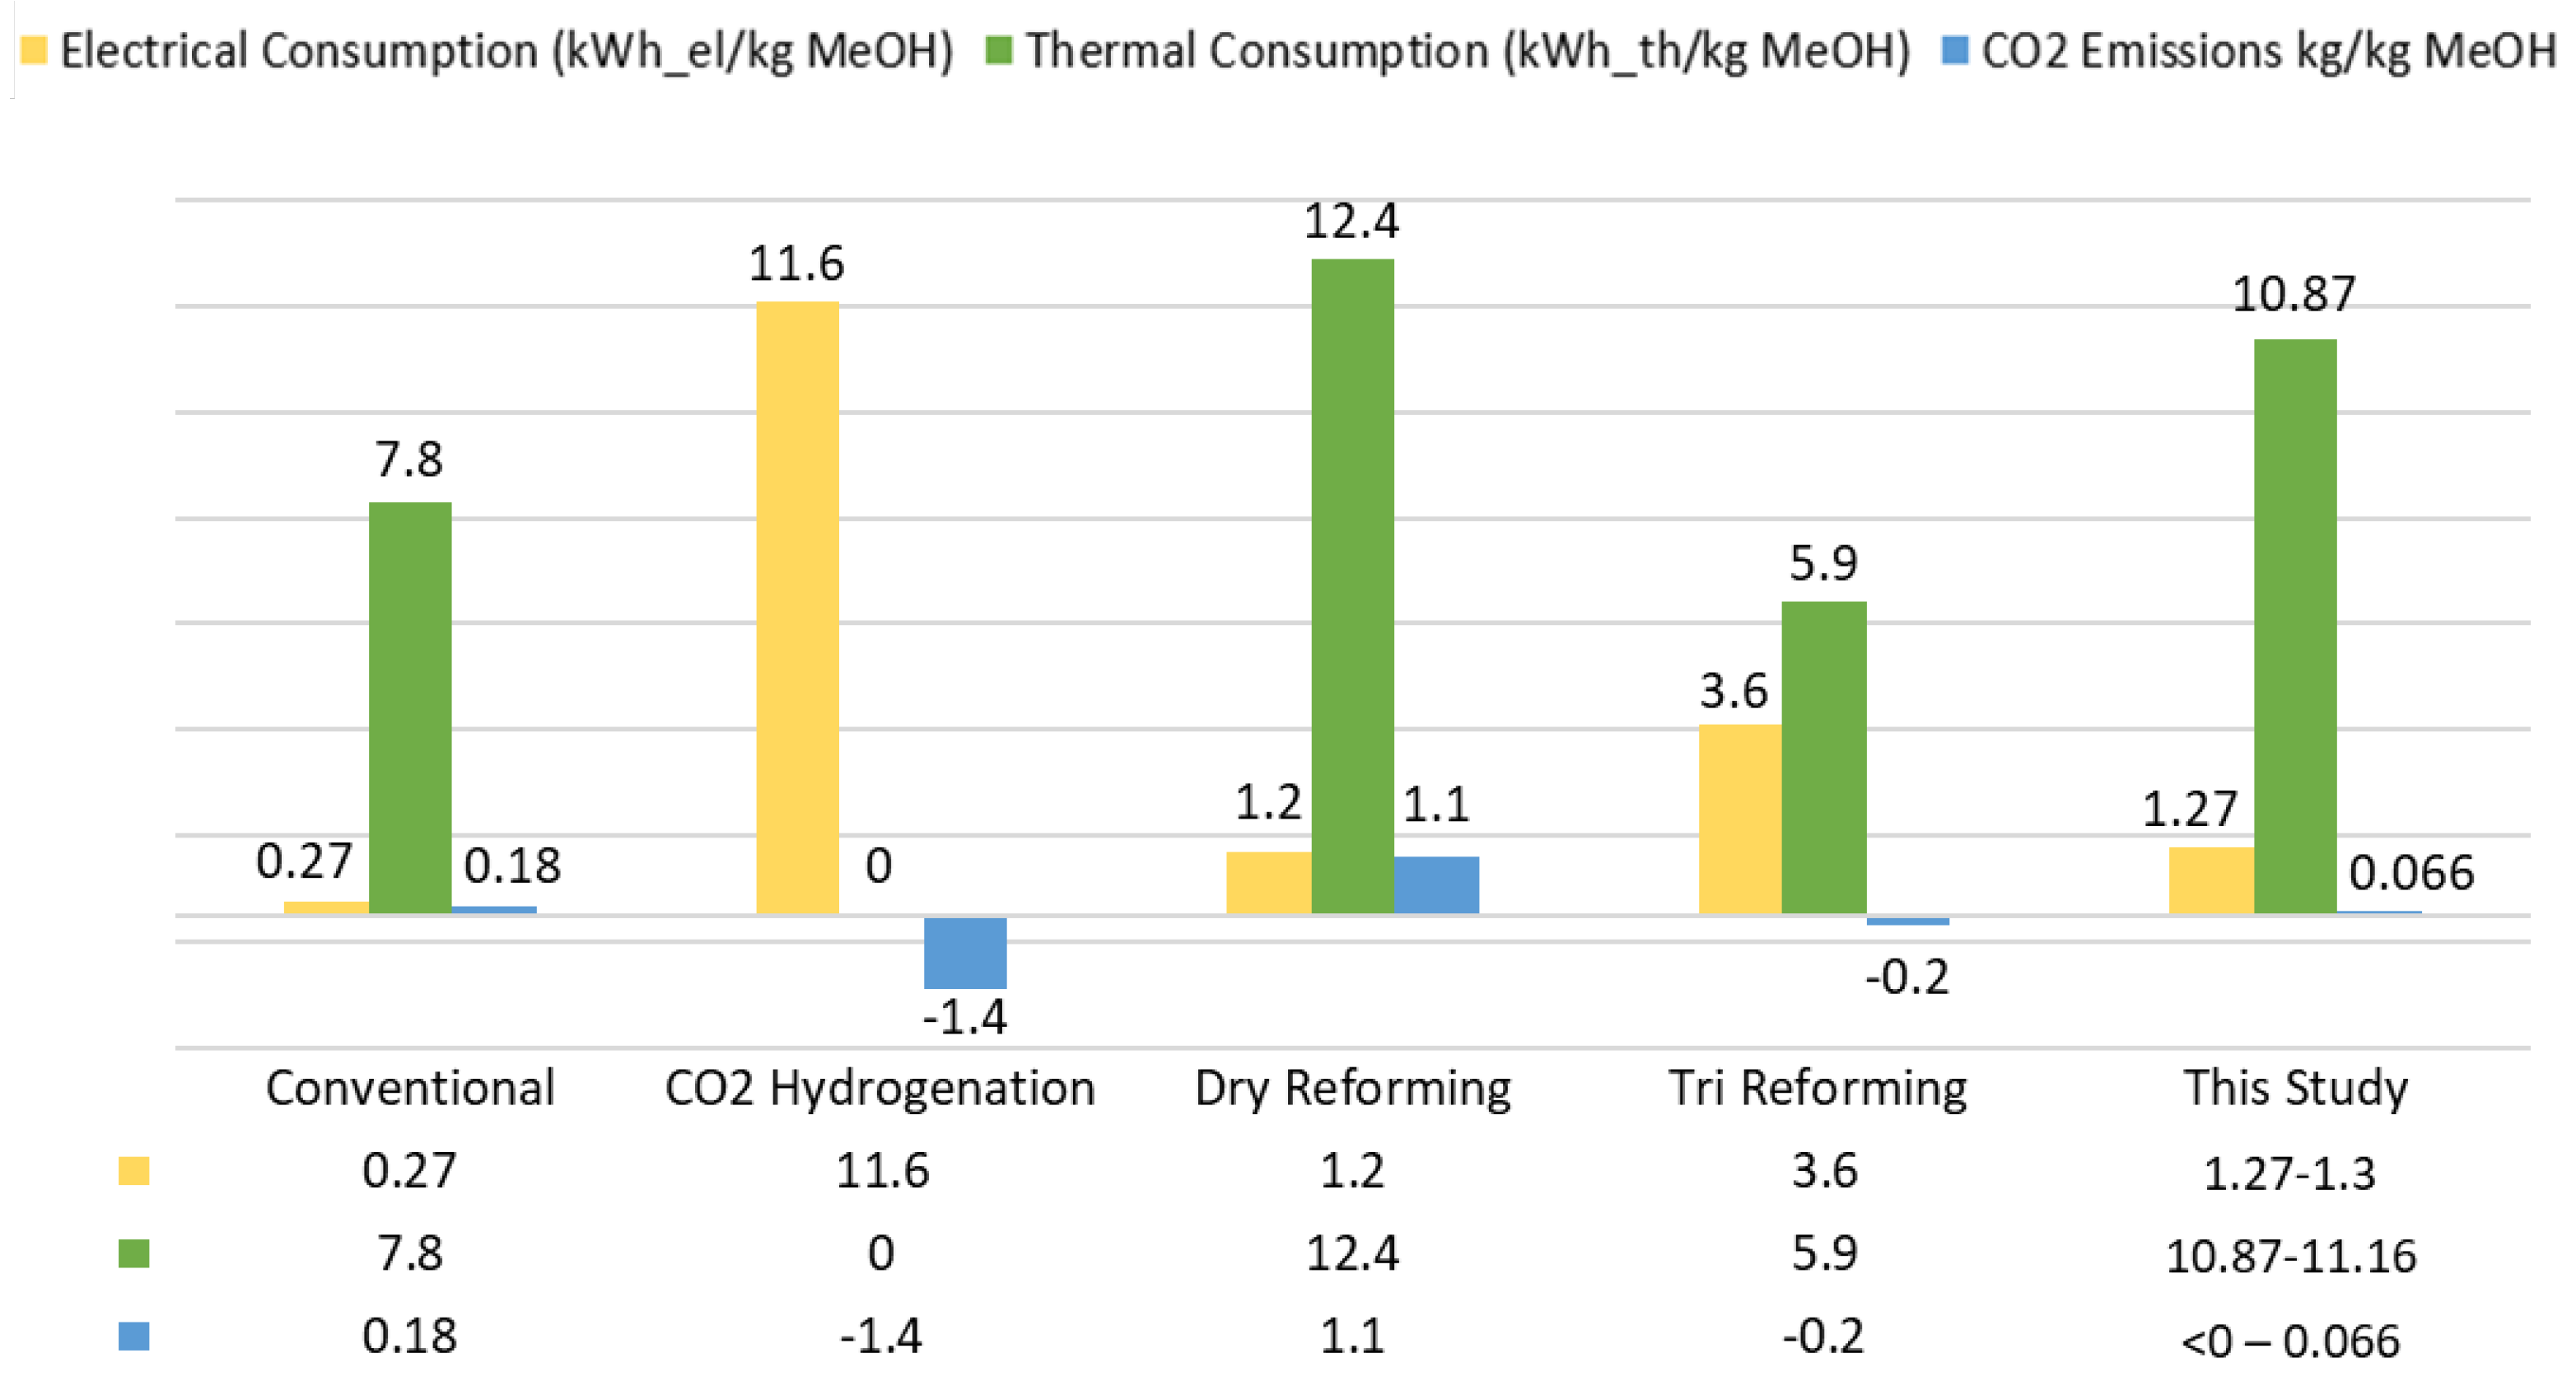
46] and are presented in
Figure 12 along with the results of this study.
It can be observed that the proposed concept with the co-gasification of lignite/SRF presents competitive values for the electrical consumption of the overall process, the fuel requirements as well as the identified CO
2 emissions. Concerning electrical consumption, the presence of ASU and Rectisol
® may form a remarkable power demand, but the extended electrolysis involvement that is suggested in other processes (e.g., CO
2 hydrogenation) is clearly a more energy-demanding choice. The thermal input requirements of the process related to the obtained methanol production are decent, as already mentioned with the relatively high
EFE values (see
Section 4.2). Then, the presence of SRF and therefore the presence of biogenic and sustainable feedstock in the process allows for minimization of the CO
2 emissions. Moreover, the pure CO
2 stream that is obtained from the Rectisol
® process can be further exploited in other process schemes. The latter fact paves the way for even lower or even negative CO
2 emissions of the overall plant in cases with extended SRF involvement in the feedstock mixture.
The conventional process of steam reforming of desulfurized natural gas is the most energy-efficient process (68.4%) and justifies its so far remarkable penetration of the market. The CO
2 hydrogenation presents a notable efficiency (47.8%); nevertheless, the extended electrolysis requirements make this technology sustainable only in places where renewable electricity is accessible. Dry reforming is a route with low efficiency (40.6%) and far from the standards of the conventional process, while the tri-reforming pathway comes up with suitable numbers (57.9%). However, given the need for alternative sustainable routes that involve renewable feedstock, the proposed concept presents a competitive thermal efficiency (49.6%) that can be further enhanced and provides a reliable and advantageous methanol production pathway. In particular, in the absence of ASU, which can be achieved with the utilization of indirect gasification systems (e.g., dual fluidized bed gasification) [
48], the electrical consumption of the process will be reduced and thus, the overall efficiency of the proposed scheme will further increase (
Figure 13).
4.6. Advanced Liquid Fuel Production from Methanol
The role of methanol as the intermediate chemical block for advanced liquid fuel production is examined in this section.
Table 10 summarizes the main process results for the case where methanol is upgraded into transportation fuels. The produced syngas is converted into liquid fuels with an efficiency of 52.5%, whereas the corresponding methanol to liquid fuel conversion is 70.1% on an LHV basis. The energy content of the additional H
2 that is required for the hydroprocessing steps is 6.2 MW
th or 0.7% of the initial feedstock heat input that can be covered either from an external electrolyzer or from the extraction of the amount of 0.052 kg/s from the off-gases that are sent for combustion in an afterburner (A500 unit). The portion of C that finally ends up in the transportation fuels is 32%. Considering then that the CU factor for methanol synthesis is 38.5%, less than 17% of carbon that exists in methanol is finally converted into CO
2 due to the unavoidable light gases (C1–C2) considered as side products and sent to SMR for converting them into syngas. The
EFE for that case is calculated as 40.7%. It should be remarked that the proposed flowsheet enhances the production of high-value fuels such as kerosene and diesel, as they have more than 75% of the energy content of the produced fuels in total.
The basic metrics of
EFE and total C utilization are comparable to those for the traditional FT route [
30], revealing the competitiveness of the proposed pathway for the production of advanced liquid fuels and illustrating that this is an effective option for methanol valorization.
5. Conclusions
In this study, a novel value chain for methanol synthesis and advanced drop-in fuels is presented. The proposed concept has efficient performance for the three main examined cases with a similar system behavior for every selected feedstock mixture (80/20, 50/50, 20/80 wt % lignite/SRF). The production of similar syngas in composition and gasification efficiency is achieved (79.04–81.12%) and a fair EFE of around 51% is calculated. This aspect allows for gasification stability and proven feedstock flexibility that ensures the concept adaptability in each case without major changes in the selected configuration.
An efficient conversion of approximately 99.5% of the carbon that enters the gasifiers is accomplished, with ~45% of carbon captured in the form of pure CO2. The impact of the reformer type and portion of the recycling gas that is reformed is investigated, resulting in SMR having a more beneficial impact on the plant’s performance than ATR, as the methanol productivity is higher and the heat demands are substantially lower. Finally, the role of methanol as the intermediate chemical block for advanced fuel production was examined. The produced syngas is converted into liquid fuel with an efficiency of 52.5%, whereas the corresponding methanol to liquid fuel conversion efficiency is 70.1% on an LHV basis. The basic metrics of EFE and total C utilization are 40.7% and 32%, respectively, revealing the competitiveness of the proposed pathway and an effective option of methanol valorization.
To sum up, the investigated concept of lignite/SRF co-gasification seems to be a competitive enough option for alternative methanol production, with significant potential for further optimization. The involvement of feedstock with biogenic fraction (i.e., SRF) along with the pure CO2 capture are valuable aspects towards the sustainability of the process, and the dependence of electro-methanol routes on cheap renewable electricity for decent environmental efficiency is a barrier that can be more easily overcome in the proposed scheme.


 ,
, 


