1. Introduction
Soot research is important given the effect of soot emission on climate change and environmental issues. However, its characterization is a very difficult task due to complex structure and nanometric size of the soot particles. In particular, soot is characterized by a multiscale organization and cannot be considered neither wholly crystalline, nor amorphous. Soot is composed of three-dimensional aggregates, consisting of complexly branched chains of spherical primary particles, which in turn are composed of concentrically arranged carbon layers. These layers are parallel to each other with interplanar distances higher with respect to that of graphite (about 0.335 nm), featuring a structure at the atomic scale corresponding to a turbostratic, i.e., biperiodic, stacking of a few nanometer-sized layers [
1].
Due to this characteristic multi-scale organization, soot can be clearly distinguished from other carbon solid particles when observed by transmission electron microscopy (TEM). TEM, indeed, is the only diagnostic tool giving access to the soot multi-scale organization and especially nanostructure, which can be explored by the high resolution mode of TEM (HRTEM), measuring structural parameters through mathematical approaches for image analysis [
1]. However, it should be emphasized that this technique has significant limitations, such as being labor-intensive, having limited statistics, and being limited by the loss of most of highly volatile species [
2]. Moreover, being a diffraction-based technique, TEM images only aromatic systems whereas does not “see” sp
3 bonding. While TEM imaging focuses on the inelastic interaction of the primary beam electrons with the electrons from the sample, inelastically scattering electrons can be measured by electron energy-loss spectroscopy (EELS). The analysis of the energy distribution of electrons that have come through the specimen reveals a wealth of chemical and electronic state information. For this reason, it is particularly useful to combine TEM with EELS [
3].
Various carbonaceous materials, such as crystalline graphite, amorphous carbon, diamond-like carbon (DLC) films and fullerenes, as well as nanotubes, have been analyzed by EELS, making it possible to characterize differences in their structure and the relative abundance of sp
3 and sp
2 hybridized carbon [
4]. This approach has already been proved to give interesting insight in soot composition and evolution during its formation and growth [
5] and oxidation [
6]. Indeed, EELS has been numbered among the spectroscopy-based techniques that are more useful to trace soot maturation [
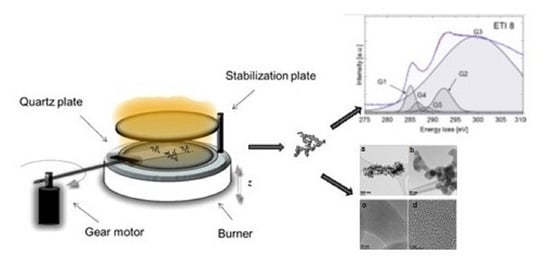
7]. The spectrum of high energy losses shows values corresponding to the excitations of electrons from the localized orbitals of the sample to the unoccupied, delocalized orbitals with energy higher than the Fermi level. The K line of absorption edge for carbon is close to about 285 eV. It has a complex shape, in which several components can be distinguished:
− G1 peak at approximately 285 eV, corresponding to a C=C π* component;
− G2 peak at approximately 292 eV, corresponding to a C–C σ* component;
− G3 peak at approximately 300 eV, corresponding to a C=C σ* component.
In addition, two other components (G4 and G5 bands at approximately 287 and 289 eV, respectively) can be indicated, related to the presence of heteroatoms (oxygen or hydrogen) or the presence of carbon atoms connected by a sp
2 bond, but not forming planar layers (e.g., fullerene-like structures) [
8,
9]. In particular, Nyberg et al. [
10] found that C-K absorption spectra of C60 and C70 fullerenes consist of double-peaked π* component. Therefore, as reported also by other authors, shoulder on the high energy side of the 1 s to π* peak centered at 287 eV (G4 bands) was attributed to non-planar sp
2 bonds [
11,
12].
By analyzing the energy of inelastic scattered electrons (loss of electron energy after passing through the analyzed sample), one can obtain information on the chemical composition (electronic structure). For carbon, the core shell electrons can scatter only to the unoccupied antibonding σ* and π* states. The intensities of the transitions from 1 s to π* (∼285 eV) and 1 s to σ* (∼292 eV) are proportional to the density of states (π* and σ*) and can thus be used to calculate sp
2 and sp
3 content [
4,
13] and to follow soot graphitization process [
5].
In this paper, a method for the EELS spectrum analysis of carbonaceous materials recently developed for electron-irradiated graphite [
8] and glassy carbon [
14] composition analysis has been tested for the first time on soot samples. The article reports the results obtainable from a combined use of TEM, HRTEM, and EELS with this method on test soot samples, collected in premixed flames with different hydrocarbon fuels. The innovation of the method lies in the possibility to retrieve important information on the amount of planar sp
2 and non-planar fullerene-like sp
2 bonds, going beyond the identification of the sp
2 hybridization degree.
2. Materials and Methods
Carbon particulate matter was thermophoretically sampled from laminar premixed flames. An ethylene flame and a methane flame (ethylene 3.0; methane 4.5 and oxygen 2.5, SOL S.p.A.) were produced on a McKenna burner (Holthuis & Associates) at the same cold gas velocity (4 cm/s) and different equivalent ratios (φ), 3 and 2.4, respectively, producing similar maximum flame temperatures (1670 K and 1650 K, respectively). The mass flow rates were controlled by gas flow was controlled by Bronkhorst mass flow controllers (HI-TEC Type F201AC). Carbon particulate matter was collected at 8 mm of height above the burner in both the flames to collect young soot, i.e., soot just after soot inception region at its maximum formation rate [
5,
15,
16].
The samples were named in the paper ETI8 and MET8, referring to young soot from ethylene and methane flame, respectively.
Thermophoretic sampling was carried out by fast insertion of a glass plate (75 × 25 × 1 mm), inserted horizontally and rotating by a gear motor with a rotation speed of 1.4 gear/s. The insertion/deposition time of the plate was regulated at 60 ms per lap to avoid the plate heating [
16]. The insertions were repeated continuously many times reaching the total deposition time for each sample of 25 s.
A scheme of the burner with the system for the thermophoretic sampling is reported in
Figure 1. More experimental details are reported in a previous paper [
16].
Carbon particulate samples were scratched from the glass plate and extracted with dichloromethane (DCM, CH2Cl2) (Sigma Aldrich, USA by Merck group, Darmstadt, Germany, purity > 99.9%) for separating organic species (soluble in DCM) from solid carbon particles insoluble in DCM, referred to as soot.
Samples for TEM, HRTEM, and EELS studies were made by dispersing a small amount of soot in ethanol (CH3OH, Sigma Aldrich, USA by Merck group, Darmstadt, Germany, purity > 99.8%). A drop of this dispersion was then applied to a microscopy copper grid covered with a lacey carbon layer. TEM studies were performed on S/TEM Titan 80–300 microscope from (FEI, Hillsboro, OR, USA), operating at 300 kV. The EELS spectra were acquired in the same microscope, operating at 80 kV and equipped with a Gatan Tridiem 863 spectrometer (Gatan, Pleasanton, CA, USA). For EELS analysis, relatively large volumes of the material (approx. 50 nm × 50 nm) were subjected.
For such volumes, the carbon layers are anisotropically arranged (in all directions, there is no privileged orientation). An EELS energy resolution, measured as the full width at half maximum (FWHM) of the Zero Loss Peak (ZLP), was 1.8 eV. Energy loss spectra were recorded in two ranges: low energy losses (<50 eV) and core loss (270–360 eV). Six spectra were recorded for each sample. For spectral deconvolution, the FITYK program was used [
17].
3. Results and Discussion
The TEM and HRTEM images of young ethylene and methane soot are reported in
Figure 2 and
Figure 3, respectively. The images, reported at different magnifications, confirm the characteristic, multi-scale structure of the soot in the two tested samples, showing different aggregates made of smaller particles. Aggregates composed of single particles and containing thousands of such particles were observed (
Figure 2a and
Figure 3a). It was a characteristic property of the tested samples, depending on the selected fragment of the observed sample, small or large aggregates were visible.
An average diameter of the individual particle size can be estimated to be around 30–50 nm (
Figure 2b and
Figure 3b). This broad estimate is due to the presence of large coalesced structures, with just few primary particles mainly located on the edge. Indeed, the individual particles that make up the aggregates are not simple connected perfect spheres, with one embryo in the central part. Instead, numerous embryos, around which carbon layers have grown, can be noticed. These embryos fused at the early stage of soot formation and then the entire structure continued to grow. Therefore, in the pictures, the diameter of the primary particles forming the aggregates is not clearly identifiable (
Figure 2b and
Figure 3b).
As already observed in young soot in previous works [
1,
5], the presence of both graphitic-like and amorphous-like components in the young soot, visible in the HRTEM images (
Figure 2c,d and
Figure 3c,d), is remarkable. The arrangement of the carbon layers is also visible. Quantitative fringe analysis revealed that they are about 1–2 nm in size, arranged parallel to each other and approximately at a constant distance (about 0.35 nm). Carbon layers are arranged concentrically around the embryos (and they are smaller in these areas), closer to the outer surface—parallel to this surface (and then longer). These inferences did not show any significant (noticeable) differences between young soot formed in methane and ethylene flames.
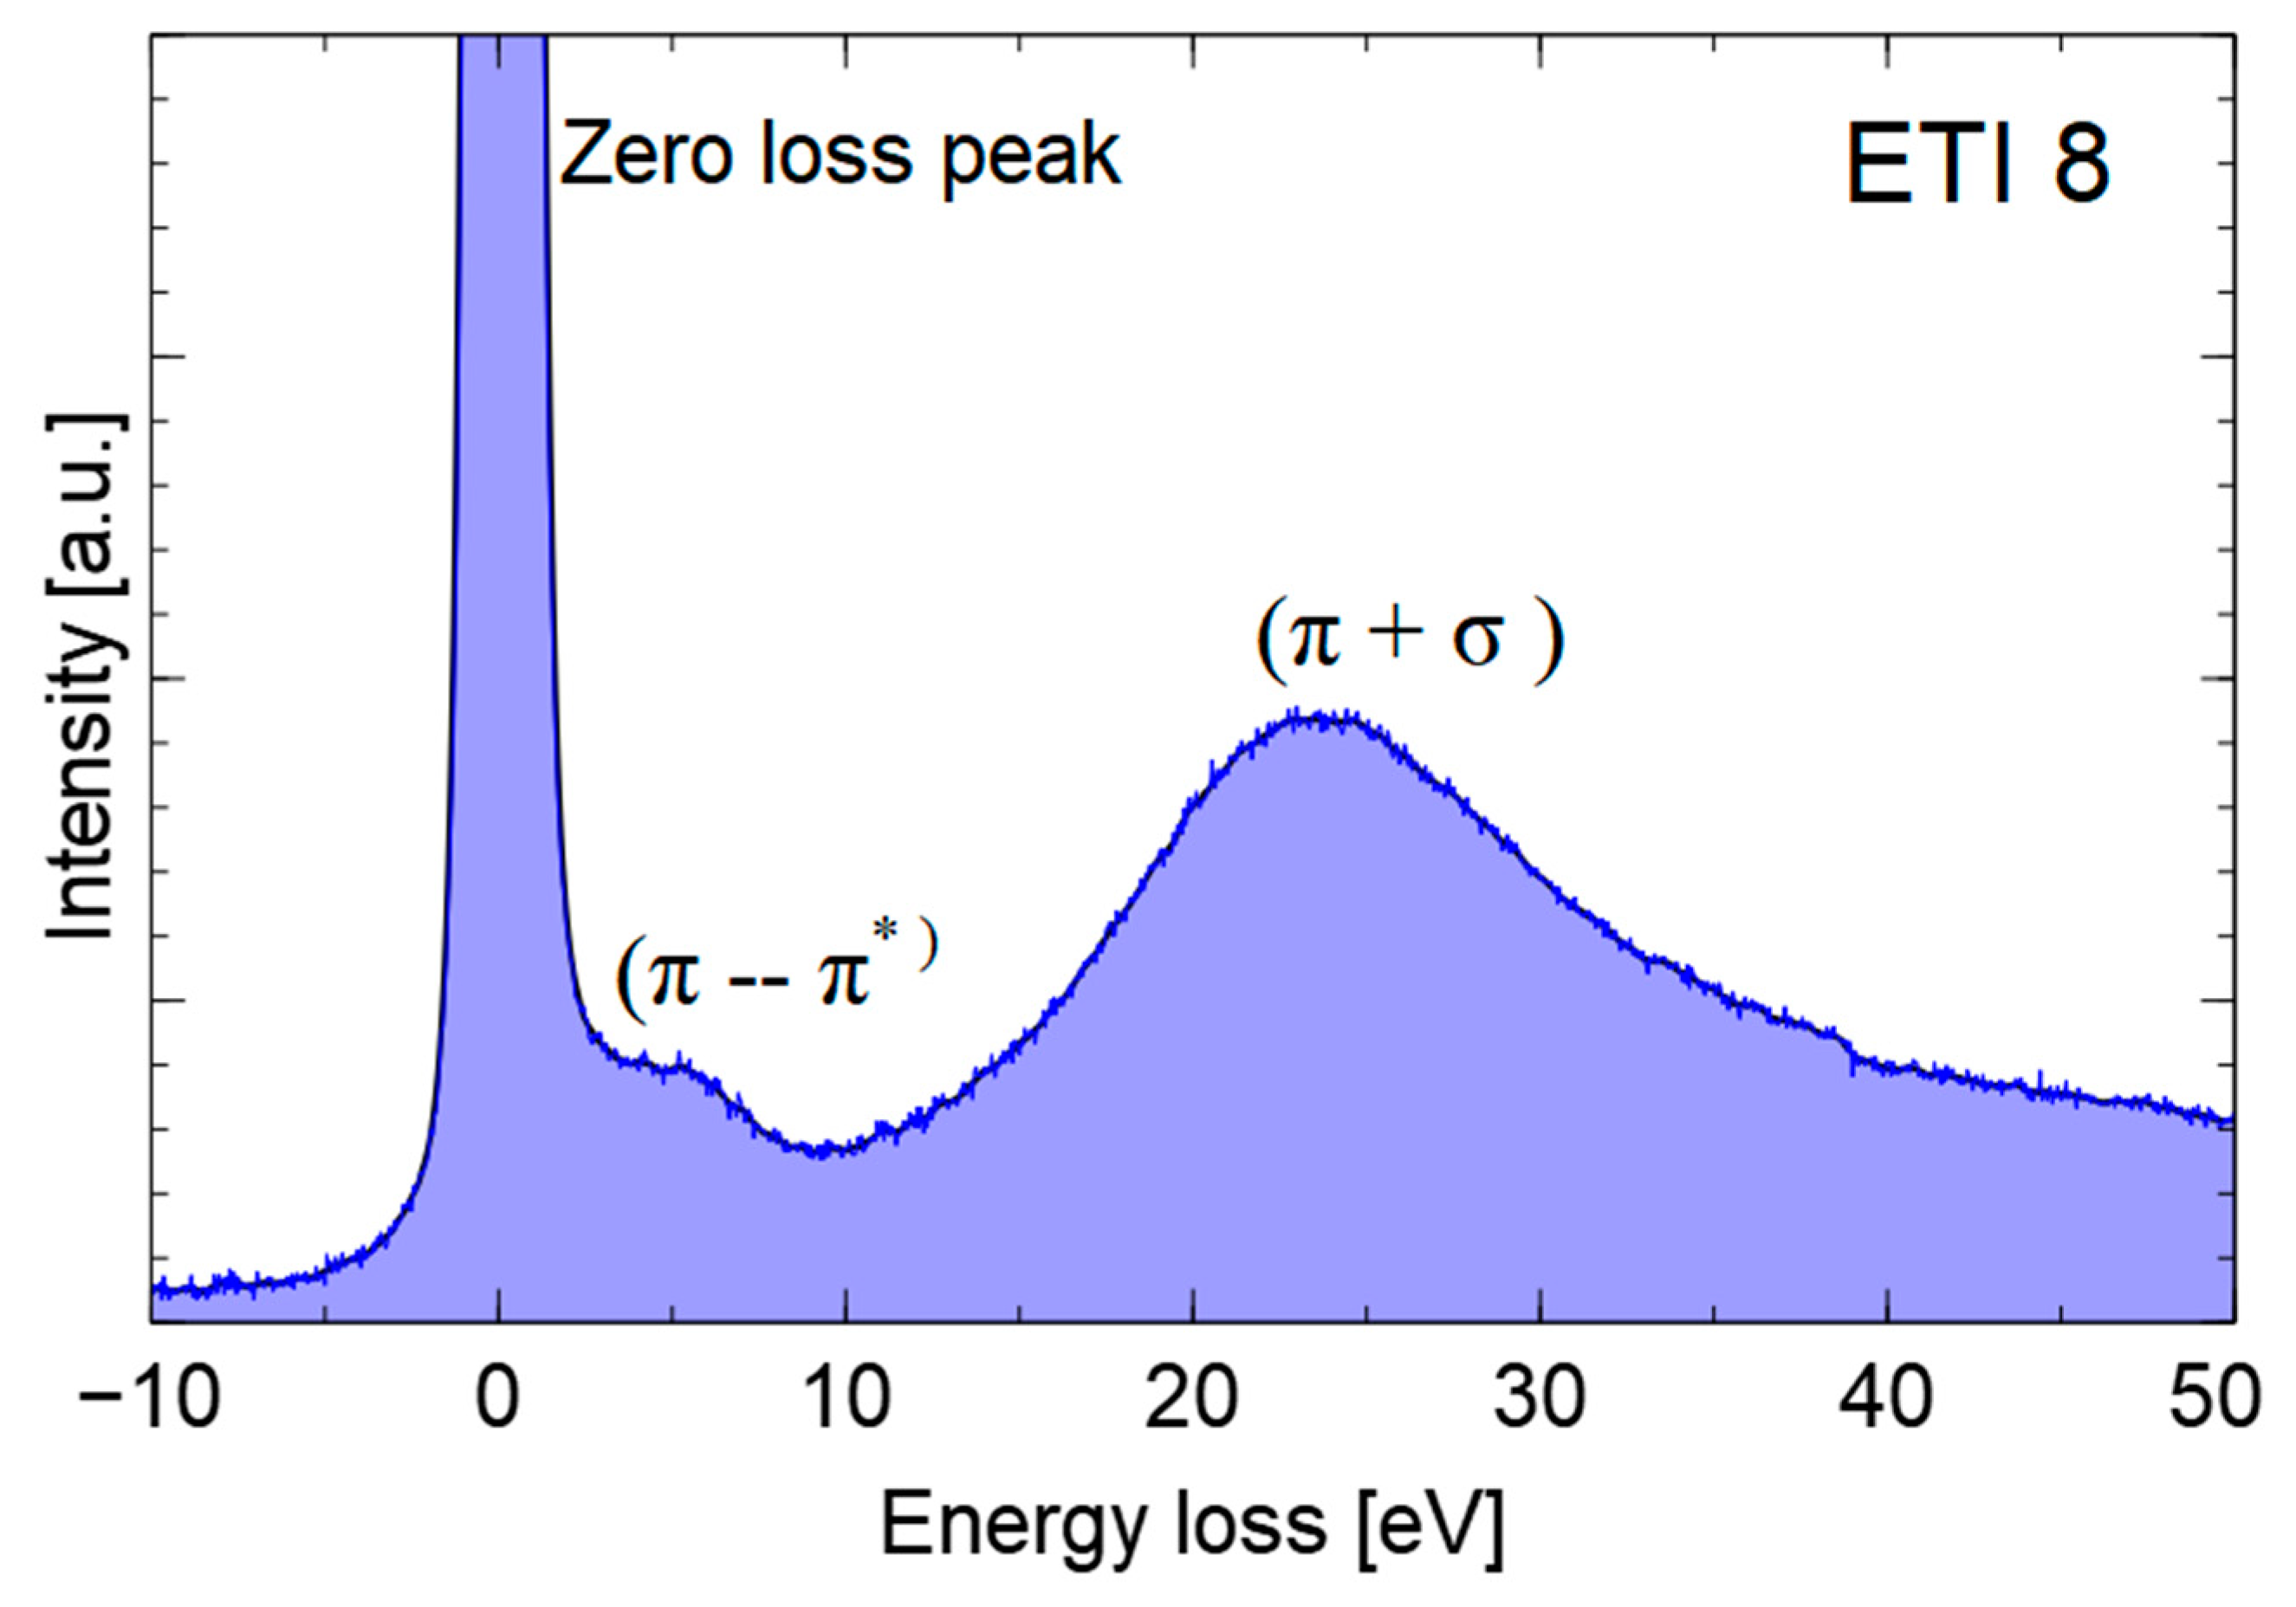
Figure 4 shows an exemplary spectrum (obtained for young ethylene soot) of electron energy losses in the low energy range (<50 eV), which includes the ZLP band and the faintly visible band, corresponding to the π→π* transitions (6 eV) and the band corresponding to the collective oscillations of the valence electrons (π + σ). The location of the plasmonic peak (energy approx. 22–26 eV) characterizes the electron density in the valence band and is an indicator of the degree of graphitization of the tested material [
9]. The position of the peak was determined by taking the first derivative of the spectrum.
The position of this band is 27 eV for highly oriented pyrolytic graphite (HOPG), which is higher than that observed for the two young soot samples and next to that assigned to amorphous carbon (approx. 23 eV), indicating a low level of graphitization of the samples.
An example of the C
K absorption curve in the energy range, from 270 to 360 eV, is shown in
Figure 5. It shows the peaks corresponding to the transitions from the 1 s orbital to π* (approx. 285 eV) and σ* (approx. 292 eV) and the band marked as MSR (Multiple Scattering Resonance, approx. 330 eV). A comparison of the C
K absorption curves of the two soot samples is shown in
Figure 6. The presented results are typical of low-graphitization carbon materials [
18] and reveal that there are no significant differences between the investigated samples.
The percentage of sp
2 hybridized carbon atoms was determined by analyzing the shape of the absorption curve C
K. For the obtained core-loss spectra background was subtracted and the multiple scattering was then removed by Fourier-ratio deconvolution with the low-loss spectrum obtained for exactly the same region of the sample. The maximum of the π* peak was fixed at 284.5 eV to minimize systematic error from peak position. To determine the ratio of (planar) sp
2 bonded carbon to total carbon, the spectra were fitted by five Gaussian peaks (
Figure 7) [
8]:
− the first Gaussian (G1) centered at 284.5 eV (C=C π* component);
− the second Gaussian (G2) centered at 291.75 eV (C–C σ*component);
− the third Gaussian (G3) centered at 297.75 eV (C=C σ*component);
− two additional (G4 and G5) 286–288 eV (due to the presence of additional heterospecies or the presence of a non-planar sp2-bonded carbon component).
According to the methodology presented in the paper [
8], the planar sp
2 content was calculated by comparing the ratio of the π* intensity (G1) with the total C
K-edge intensity, calculated over a 20-eV window of onset 282.5 eV. It is proportional to the total number of carbon atoms present in the probed volume. The obtained ratio was normalized to the factor determined from spectra of a 100% sp
2-hybridized material [
19,
20,
21], as shown in the Equation (1):
As reference material, graphite has been generally used in EELS studies since it presents 100% sp
2 content and a density of states of 1:3 π*:σ* [
4]. However, it was found that graphite suffers of orientation effects due to the fact that scattering cross-sectional areas depend on orientation. Therefore, in a previous work [
5], a multifaceted polyhedral carbon, obtained by heat treatment of carbon black, was employed as a calibration standard, assuming it is 100% sp
2 (i.e., 1:3 π*:σ*). It presents a spherical geometry and, therefore, it is free of orientation effects. In the present paper, a similar material, a glassy carbon heated at 2500 °C, which is a material containing near 100% sp
2 carbon hybridization [
22], was used.
For ethylene young soot, the percentage of total sp
2 bonds is 85 ± 4%, which is very similar, in the error limit, to the percentage for methane young soot: 83 ± 4%. As soot is an sp
2-rich aromatic disordered carbon [
23], significant differences in terms of sp
2 content for soot collected at the same stage of maturation were not expected.
The fraction of sp
2-bonded carbon atoms, which are bonded in a non-planar fashion, was determined as ratio according to the Equation (2):
where I
π*np is the combined intensities under G4 and G5; I
π*total is the combined intensities under the G4, G5, and G1 peaks. For ethylene young soot, the percentage of non-planar fullerene-like sp
2 bonds is 42 ± 5%, which is slightly lower with respect to that of methane young soot, which is: 46 ± 5%. The results are summarized in
Table 1.
This intensity ratio should reflect the degree of curvature of soot structure due to non-planar, strained sp
2 bonds. Therefore, EELS, in agreement with TEM and HRTEM, showed a somewhat disordered and heterogeneous structure for young soot, with a relatively low sp
2 content and slight presence of fullerene-like structures, which are more evident in the case of methane soot, hinting at the effect of more saturated aliphatic fuels on soot characteristics at soot inception. The importance of being able to distinguish soot from different hydrocarbons is multiple. On the one hand, if the different fuel changes the structure of the soot, by studying the latter, one can trace the source of the emission of the soot [
24]. On the other hand, the influence of the nature of the fuel on the nanostructure of the soot can help us to understand the soot formation mechanism.
4. Conclusions
In this paper, a method for the EELS spectrum analysis of carbonaceous materials recently developed for electron-irradiated graphite and glassy carbon composition analysis was tested for the first time on soot samples. The EELS results were compared to TEM and HRTEM observations.
The feasibility of quantitative EELS for evaluating the contribution of sp2 and sp3 bonds to soot nanostructure, distinguishing also between planar sp2 and non-planar fullerene-like sp2 bonds, was demonstrated.
EELS, in agreement with TEM and HRTEM, showed a somewhat disordered and heterogeneous structure for young soot, with a very low effect of more saturated aliphatic fuels as methane on the disorder and sp2 content of soot structure. As soot is an sp2-rich aromatic disordered carbon, significant differences in terms of sp2 content for soot collected at the same stage of maturation were not expected. Anyway, the present method is able to retrieve important information on the amount of planar sp2 and non-planar fullerene-like sp2 bonds, going beyond the identification of the sp2 hybridization degree. Thus, the effect of fuel chemical nature on soot, in terms of higher curvature in the structure with higher saturation degree, was put in evidence, even if it is slight.
Future work was planned for extending investigation on soot sampled at the exhaust and soot formed from different fuels (aromatics, oxygenated and so on), in order to check the reliability of the technique for correlating soot emission to its source. Pinpointing the exact sources of the pollution is important for policymakers working on addressing the pollution problem.


 ,
, 


