Article

Investigation of Elastic Properties of WO3 Thin Films Supported on Quartz in Surface Acoustic Wave Sensing Devices

Aix Marseille Univ, Université de Toulon, CNRS, IM2NP, CS 60584, Toulon Cedex 9, F-83041, France
*
Author to whom correspondence should be addressed.
Electron. Mater. 2022, 3(1), 124-135; https://doi.org/10.3390/electronicmat3010012
Submission received: 28 January 2022 / Revised: 8 March 2022 / Accepted: 14 March 2022 / Published: 17 March 2022
(This article belongs to the Special Issue Feature Papers of Electronic Materials II)

Abstract

:
This study aims to discuss the combined theoretical and experimental results of elastic properties of tungsten trioxide films supported on Quartz (YX)/45°/10° resonator to form surface acoustic wave (SAW) devices. The SAW systems with different thicknesses of WO3 thin films were imaged and structurally characterized by X-ray diffraction, atomic force, and transmission electron microscopy. The deposited WO3 films (100, 200, and 300 nm of thickness) crystallized in a single monoclinic phase. The acoustoelectric properties of the SAW system were obtained by combining theoretical simulations with experimental measurements. The modeling of the SAW devices has been performed by the finite element and boundary element methods (FEM/BEM). The elastic constants of the films at room temperature were assessed via electrical admittances experiments in light of theoretical calculations. The gravimetric effect of the deposited layers is observed by a shift of the resonance frequency to lower values as the thickness of the films increases. Moreover, the acoustic losses are affected by the dielectric losses of the WO3 films while the resonant frequency decreases almost linearly. SAW devices revealed strong displacement fields with low acoustic losses as a function of WO3 thicknesses. For all the deposited layers, the measured Young’s moduli and Poisson’s ratios are 8 GPa and 0.5, respectively.

1. Introduction

Surface acoustic wave (SAW) devices have been largely studied as chemical gas sensors to determine micromass changes. The enthusiasm over SAW devices originates in its easy-to-use and highly sensitive characteristics. The working principle is the measurement of the modification of the surface propagating wave due to the interaction of the active material with a specific gas molecule [1,2,3,4]. Indeed, the surface wave resonator, which is confined within few wavelengths of the piezoelectric crystal surface, is strongly sensitive to any changes in the physical and/or chemical properties of the thin active layer (as in the present study) [5]. Provided that the thickness of the sensitive material is less than the wavelength of the surface wave, the waves can be considered Rayleigh waves. The associated mechanisms (phenomena) are mass loading effects, changes of the elastic properties and electrical conductivity [6,7,8].
Variations in electrical conduction of the sensitive film disturb the propagation of the acoustic wave on the quartz surface and consequently its speed. The first study on the acoustoelectric effects was demonstrated on SAW sensor covered with a semiconductor thin film under hydrogen exposure [9]. This effect is generalized through an acoustoelectric parameter calculation showing that the wave propagation is affected either by mass effect, change in electrical conductivity of the film, or by combining both [10,11]. This effect has been theorized and is described by an acoustoelectric parameter that depends on mass variations and changes in electrical conductivity of the film, or on a combination of both quantities.
The tungsten trioxide WO3 is a well-known material in sensor technology that has been studied extensively, particularly in our lab [12,13]. Moreover, WO3-based materials, known as heavy metal oxides, have been considered as promising glasses due to their high thermal stability, good mechanical properties, and electrical conductivity [14,15]. Ideally, the tungsten trioxide structure is cubic and formed by a three-dimensional network of corner sharing octahedra [16]. However, the structure of WO3 reveals phase transitions as a function of the preparation temperature, showing a polymorphic behavior. The different crystallographic structures result from the distortion of the network through tilts of the octahedra and/or ions displacement vacancies. Thus, all modifications of WO3 crystal network depend on the various oxidation states of the different coordination polyhedral [17].
Currently, the elastic parameters of WO3 in single crystal or powder form have been determined using atomic level simulation methods [18]. However, to date, no simple and reproducible method has been able to determine the elastic constants of this material as a thin layer. In other words, the acoustic characterization of WO3 as thin films is almost non-existent in the literature. In this paper, we consider the elastic constants of thin films found in the literature as a starting point for the fitting of the elastic parameters.
Our theoretical study offers a methodology that allows to estimate the elastic parameters of a thin film deposited on the SAW resonator starting from unknown physical parameters of an element constituting the acoustic component and from simulation-measurement agreement. The modeling of the SAW devices has been performed by the finite element method (FEM), and is based on the adjustment of the thin layer density allowing the agreement between simulations and measurements. This work deals with the direct analysis of the acoustoelectric signals of different layers deposited on SAW resonator to extract some physical properties of the material such as the Young’s modulus, E, and the Poisson’s ratio, ν. The originality of this work lies in the use of SAW devices to study the electromechanical behavior of thin layers constituting our SAW sensor.

2. Experimental and Theoretical Approach

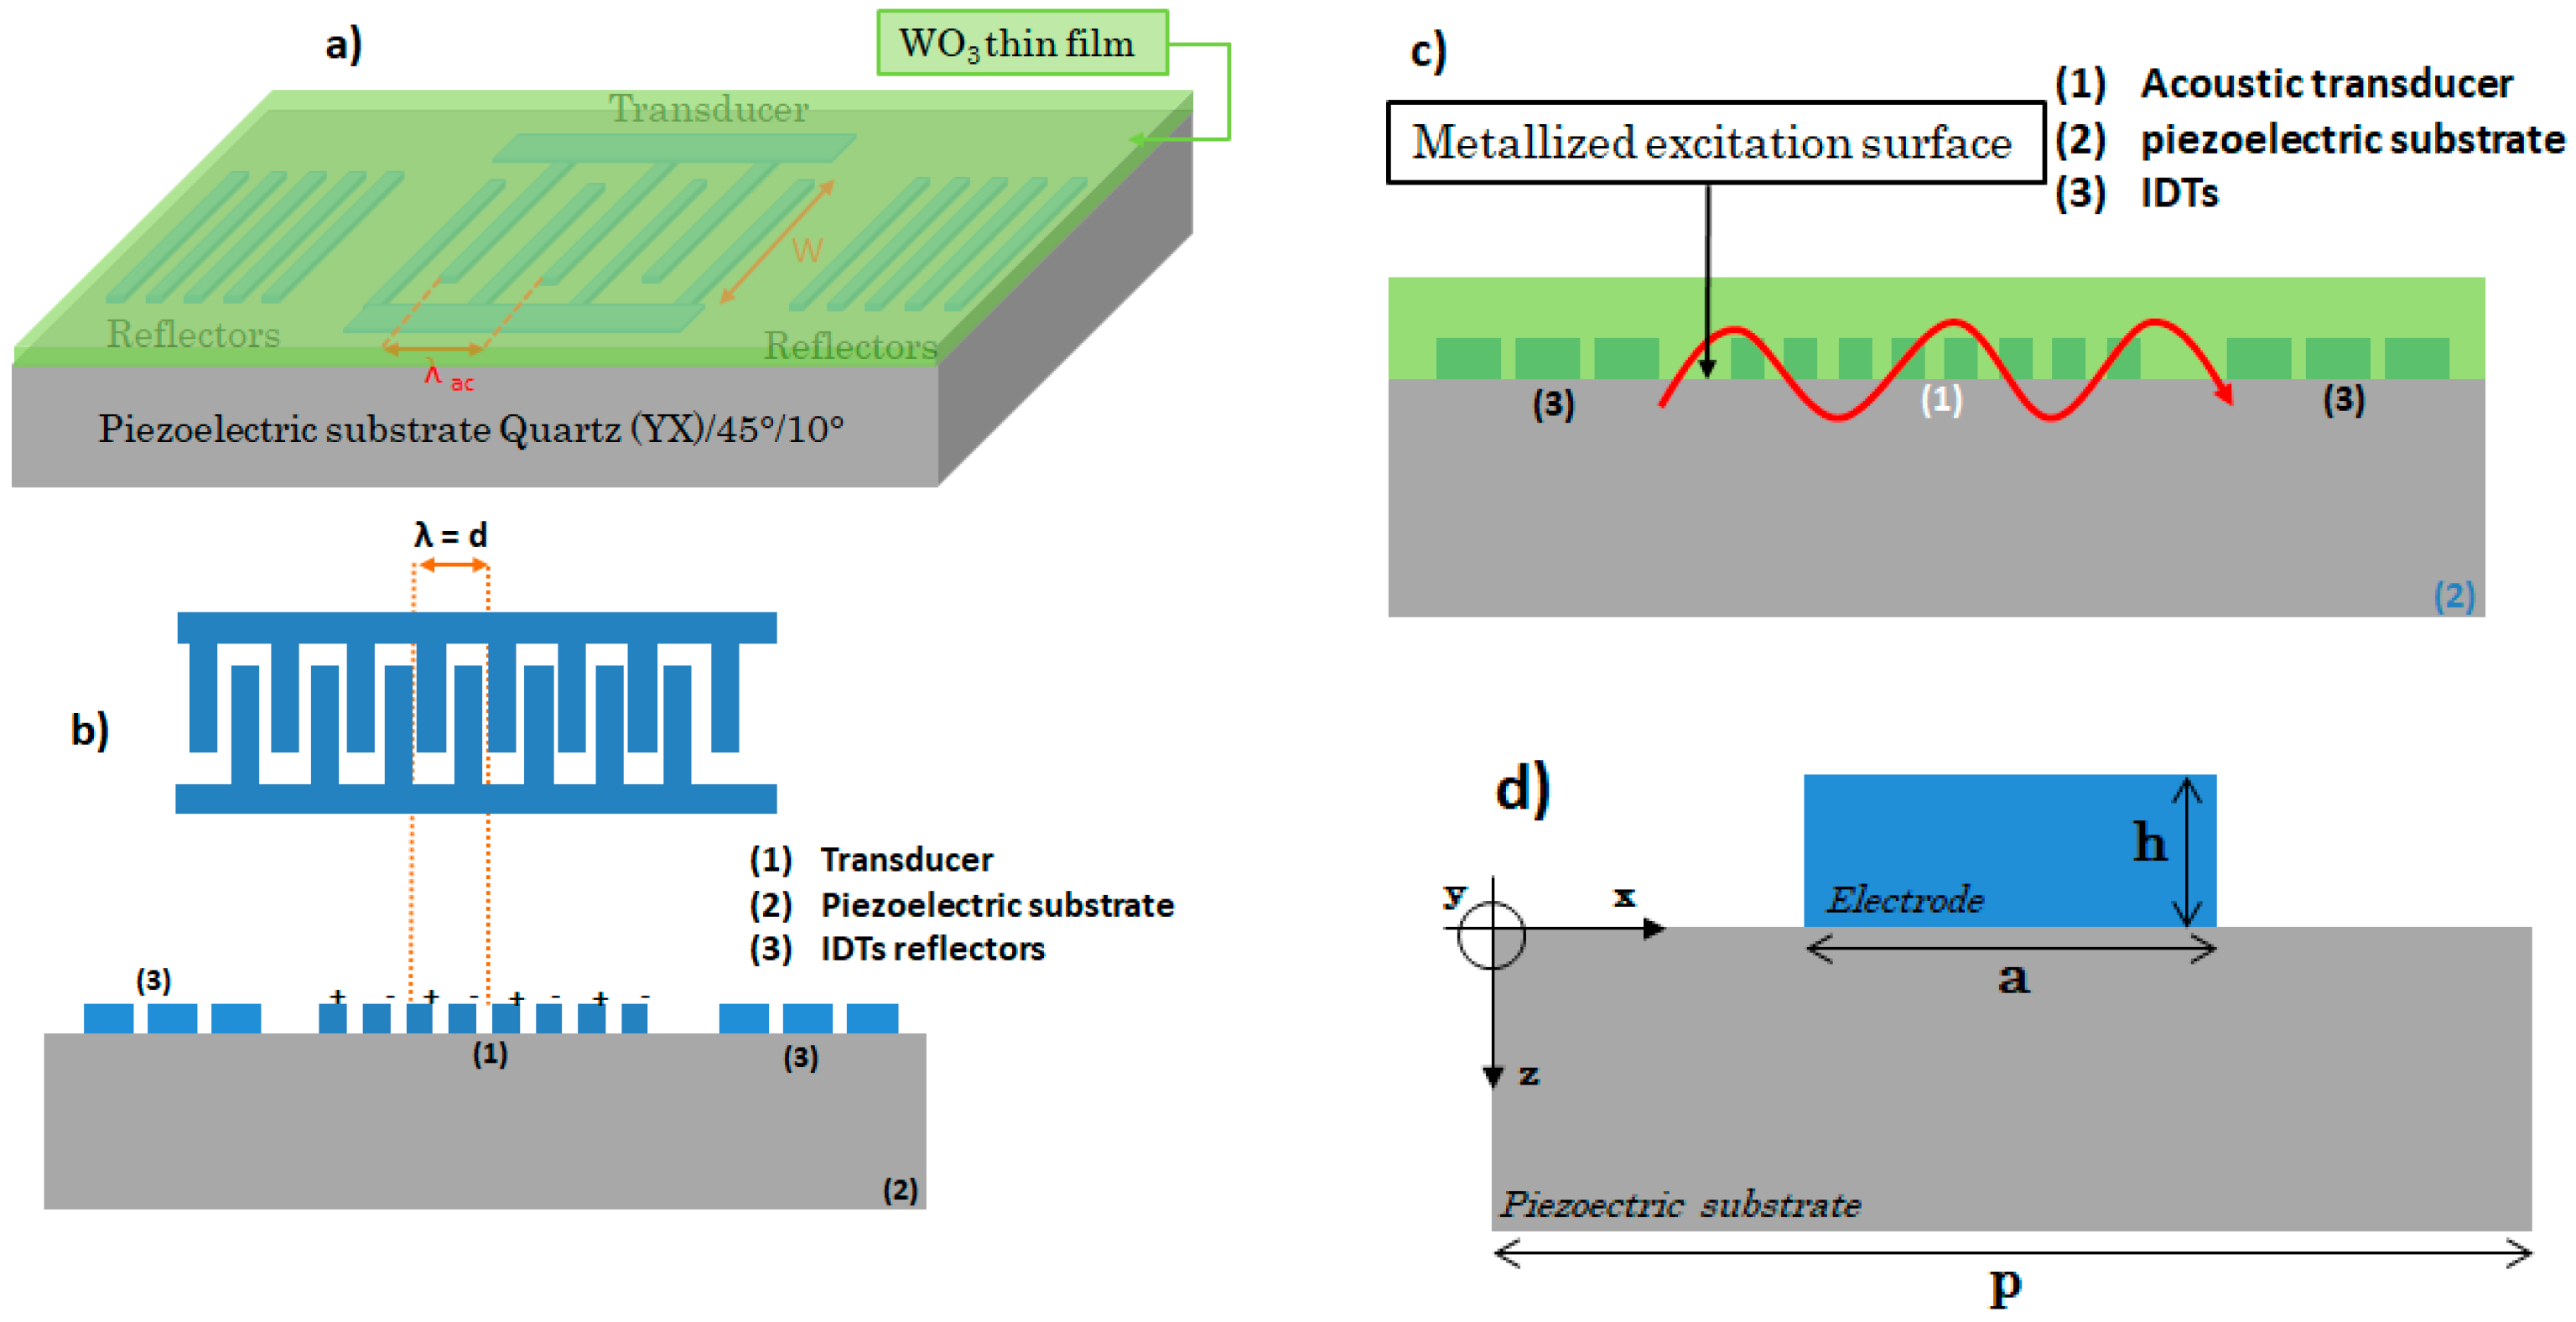
2.1. SAW Sensing Device

SAW device configuration: SAW device consists in a Quartz (YX)/45°/10° resonator equipped with a transducer and interdigital structures, IDTs, used as reflectors and different layers of WO3. The surface wave devices that were used to perform this study are quartz-based single-port resonators operating at 434 MHz. Figure 1 represents the structure of the SAW transducer used in this study. Table 1 gathers the physical characteristics of SAW devices.
In all cases, the layer deposited on the piezoelectric substrate acts as a sensitive layer but also as a guide for the elastic waves; this is done by judiciously choosing the possible vibration modes of the structure and the anisotropy properties of the considered substrates.
The WO3 layers were deposited on the entire surface of the resonator, as shown in Figure 1. The interest of such configuration is to work with waves propagating on the metallized excitation surface and not on the free surface (Figure 1c). The interest is to significantly improve the sensitivity to the effects of films conductivity variation.

2.2. Experimental Setup
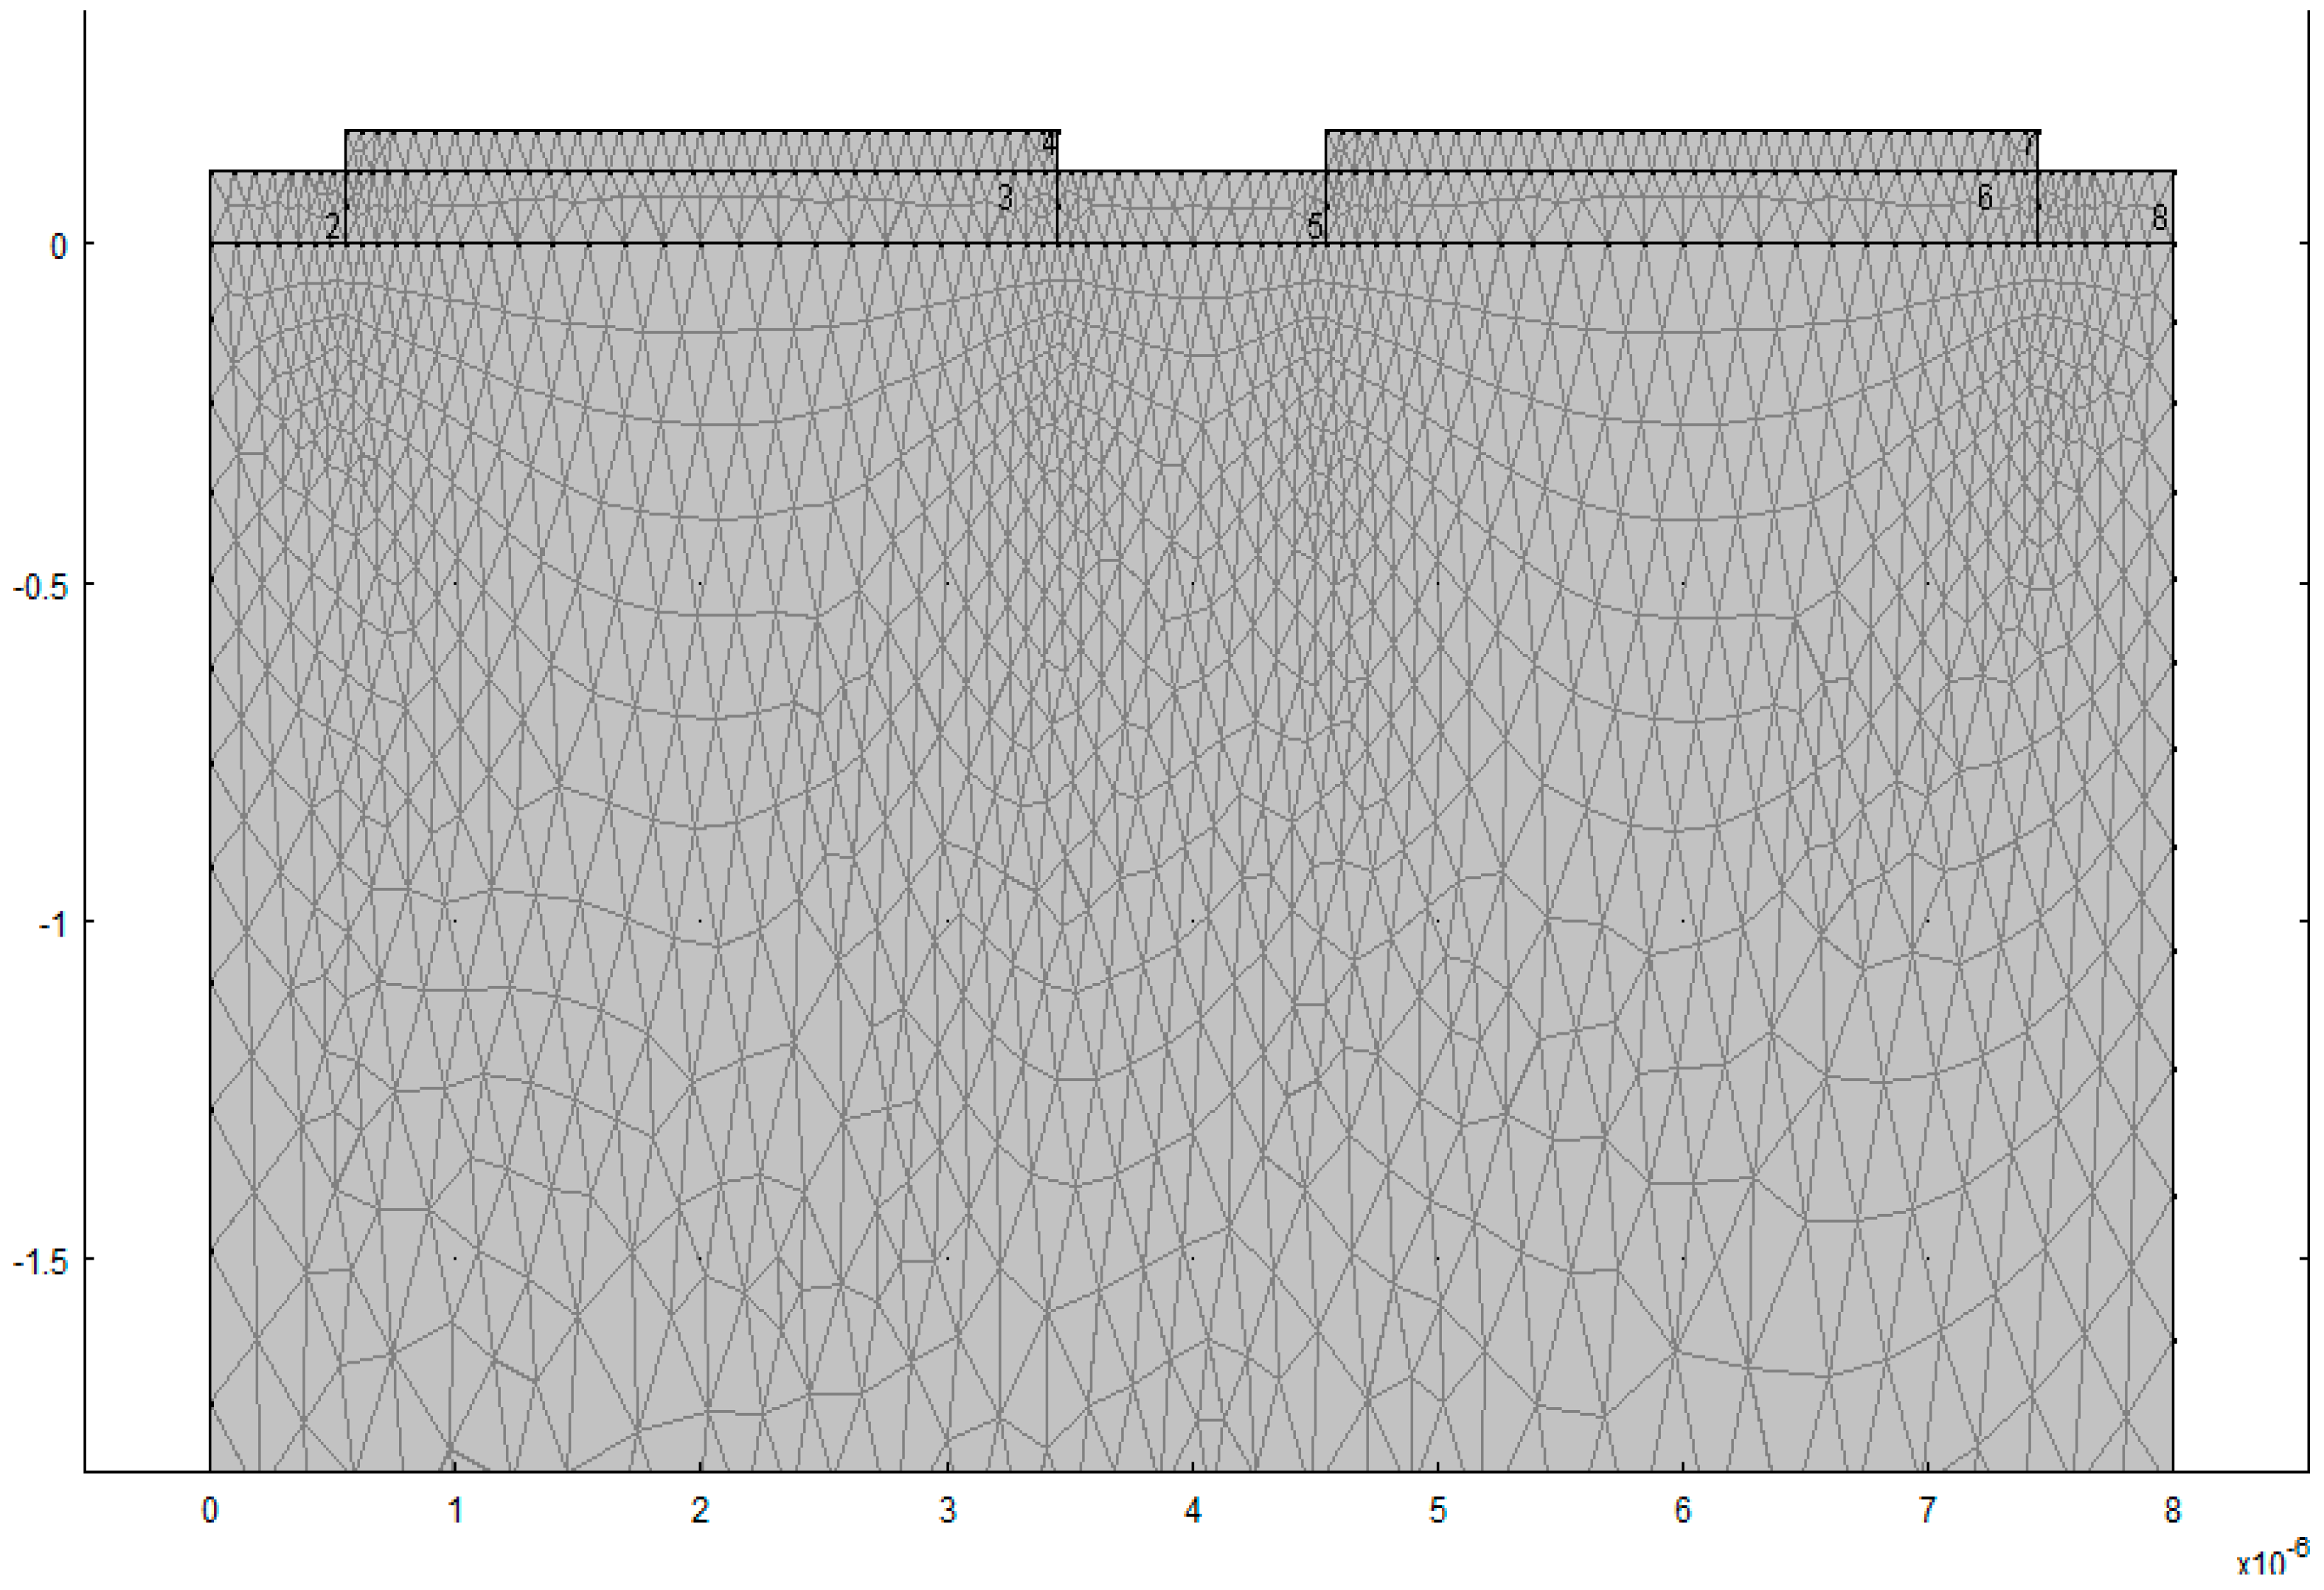
Film synthesis: WO3 films were prepared by reactive radio frequency (13.56 MHz) magnetron sputtering, using a 99.9% pure tungsten target. The thin films were sputtered on quartz substrate of SAW devices with aluminum electrodes, in a reactive atmosphere under oxygen–argon mixture (PAr/P(O2) = 1.6). Several WO3 layers with different thicknesses, have been deposited. After layer deposition, the films were annealed at 400 °C for 3 h in air to stabilize the chemical composition and the crystalline structure. The synthesis setup and standard procedure have been already published with more details elsewhere [12,13].
Characterization methods: The morphological analyses of WO3 thin films were conducted by atomic force microscopy (AFM) and with a conventional transmission microscope (TEM), Tecnai 200 kV, equipped with a LaB6 source.
The structural characterization of WO3 films were obtained by X-ray powder diffraction (XRD) in the classical θ–2θ mode, from 10° to 80° (step size 0.003°, scan speed 0.004°·s−1), with an Empyrean Panalytical diffractometer, equipped with a Cu anticathode. X-ray patterns were compared with those of the inorganic crystal structure datasheets (ICSD).
Acoustic measurement: The output signal of SAW devices was measured by a HP Agilent 4396B Network Analyzer. The set parameters of (YX)/45°/10° quartz SAW resonator are reported in Table 1.

2.3. Simulation

For theoretical acoustic studies, a combination of finite element and boundary element methods (FEM/BEM), which is widely used to model complex multilayer systems, such as SAW device [19,20,21,22], has been modified using Mathematica software to match our specific system. To simulate our piezoelectric resonators, we built a model that takes into account each material constituting the SAW devices. This approach is similar to the one used for volume wave acoustic resonators [23]. Each element can be considered as points of a given structure for which the physical parameters will be computed using the finite element method coupled with the boundary element method. Each subset constitutes a domain, which makes the structure discontinuous. However, in order to give the best account of the physical quantities of our system, it must be seen as a set of continuous domains, hence the need to discretize the volume or the study surface by creating a mesh. The mesh, represented in Figure 2, subdivides the study area into sub-elements or finite elements, interconnected by particular points called “nodes”.
The propagation of acoustic waves in linear homogeneous media can be formulated as an eigenvalue problem according to the Fahmy–Adler approach [24]. In this approach, the propagation is considered to be in the (x,z) plane and the dependence along y is given by the system of equations to solve. A state vector mixing displacements and generalized constraints in the propagation plane can thus be defined and the time dependence is set to be of harmonic type (ejωt).
The calculation is based on the stress relations (Hooke’s law extended to piezoelectricity) and the electric displacement vector to define an eigenvalue system [25,26], described by the following equations:
T i = C i j k l   S k l + e i j k E k
D i = e i k l   S k l e i k E k
Where T is the stress tensor, C is the elastic stiffness tensor, S is the elastic strain tensor, e is the piezoelectricity tensor, E is the electric field, D is the electric displacement, ԑ is the dielectric permittivity tensor, and i represents the three directions (x, y, z).
The usual piezoelectric coefficient e is expressed in matrix form as follows: e = d C, where [C] is the elastic stiffness matrix and [d] is the piezoelectric strain coefficient matrix of quartz. In the case of anisotropic materials, the existence of symmetries in a crystal reduces the number of admissible stiffness tensor components Cijkl (independent elastic constants) to 21. Given its trigonal symmetry, α-quartz has six independent elastic constants.
The isotropic character of a cubic structure, as it is the case of tungsten oxide WO3 (see structural characterization section), satisfies the relation: 2C66 = C11 − C12. The Young’s modulus (E) and the Poisson’s ratio (ν) are then expressed in terms of the elastic constants C11, C12, and C66 as follows:
ν = C 12 C 11
E = 4   C 66 ( C 11 C 66 ) C 11
To characterize the propagation of acoustic waves generated by the piezoelectric effect, conditions on the boundaries of the domains are associated with the constitutive equations of piezoelectricity. The piezoelectric material should not be treated as an infinite substrate, but with dimensions defined by mechanical and electrical boundary conditions, such as:
  • For the electrical domain, a potential difference is assigned to the electrodes;
  • The mechanical stress T is zero at the free surfaces of WO3 and the electrodes;
  • The boundary conditions at the piezoelectric substrate-electrode and piezoelectric substrate–WO3 interfaces require continuous mechanical displacements and stresses.

3. Results and Discussion

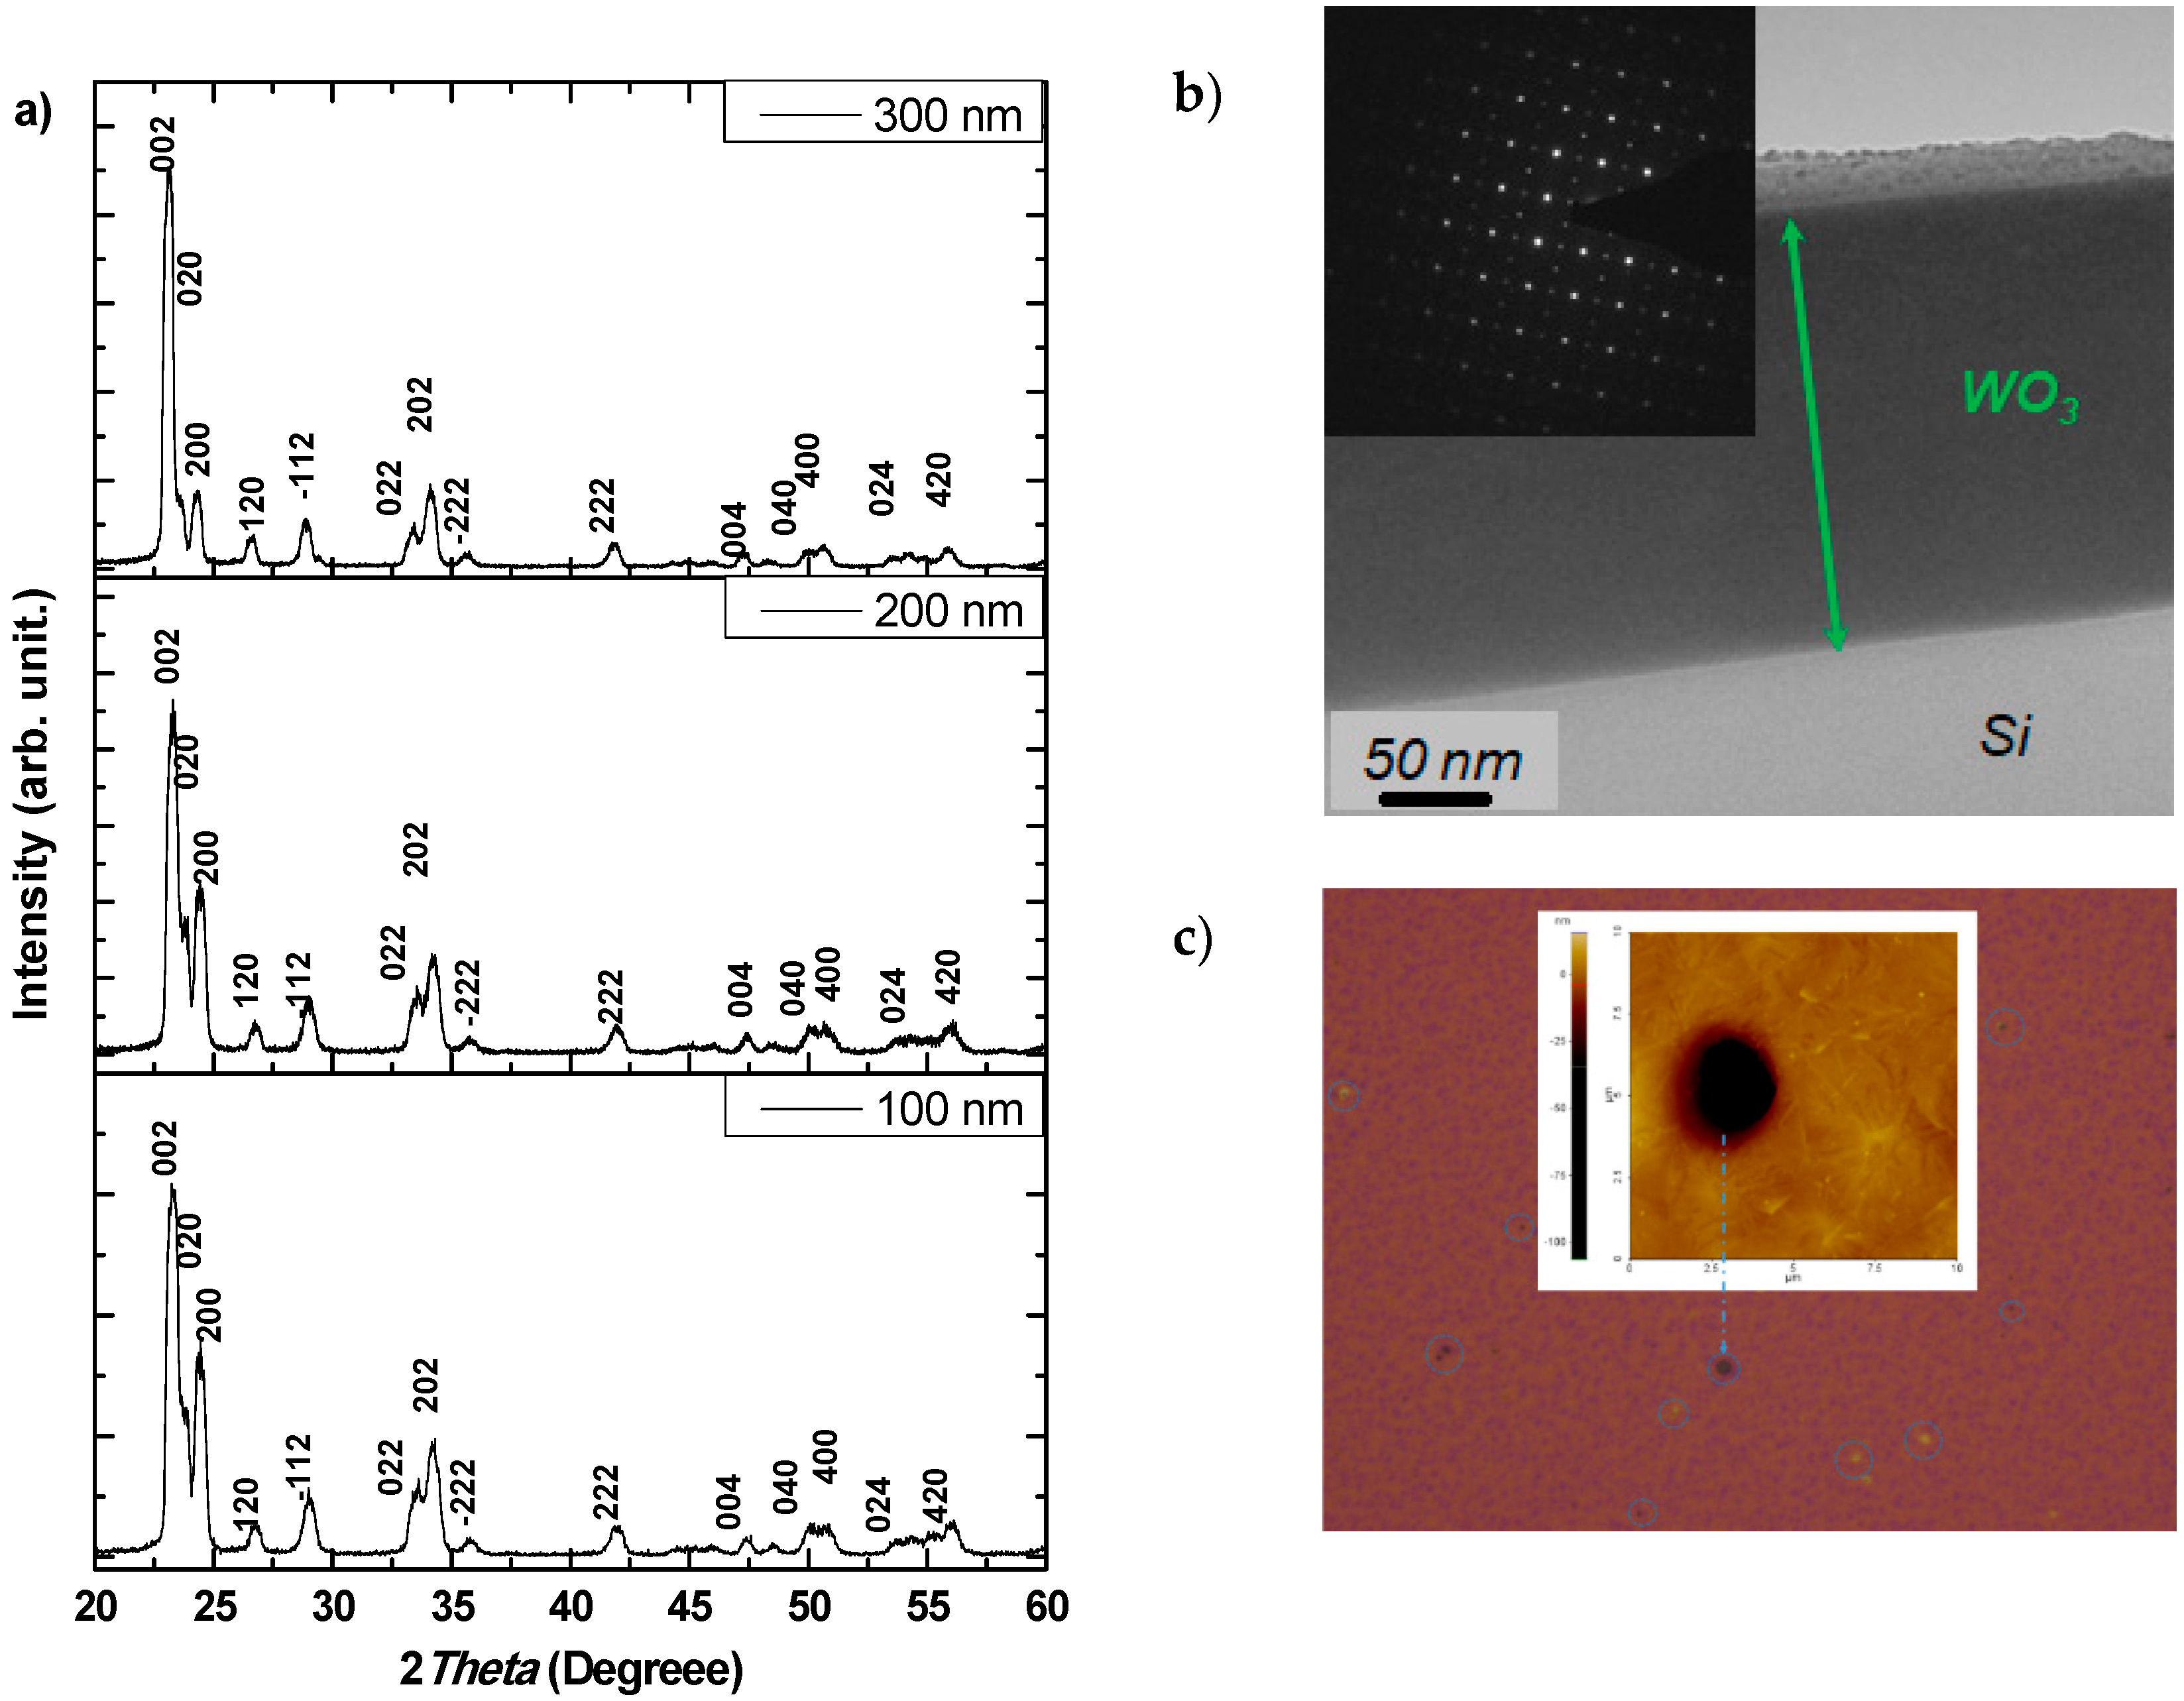
3.1. Structural and Morphological Characterization of WO3 Thin Films

Figure 3a represents the typical X-ray diffraction patterns of WO3 films with thicknesses of 100 nm, 200 nm, and 300 nm. The identified diffraction Bragg peaks are characteristic of a single-phase monoclinic structure of WO3 according to the ICSD standard database (ICSD datasheet N° 050727). As reported in a previous study [16], Rietveld refinement of experimental XRD patterns provided satisfactory figures of merit with the previously mention ICSD datasheet and pointing out the presence of small WO3 crystallites (40 nm ± 10 nm). Hence, the three films have similar structures based on tridimensional networks of corners-sharing WO6 octahedra.
The tilt and the distortion of the octahedra, lead to monoclinic phase whereas ideal ReO3 structure (without tilting) corresponds to the cubic structure. The ratios of intensity of (200) and (020) peaks as compared to the (002) peak vary with the thickness of the films indicating a dependence of the film orientation with thickness. As a function of the thicknesses deposited, the three main peaks oriented in the main directions change in intensity and width at mid-height. However, all WO3 films have a similar structure close to the cubic phase that behave as an isotropic system. The lattice parameters show little variations and remain close to the cubic phase for all the films, resulting in the set of mean values: a = 7.316 Å, b = 7.528 Å, c = 7.397 Å, α = γ = 90°, and β = 90.82° that are associated to the space group of P21/C (N° 14).
The TEM image (Figure 3b) is an example of a cross section of a WO3 film deposited on quartz substrate with a thickness of 200 nm. The electronic diffraction pattern of a selected area (insert Figure 3b) shows that the film is monocrystalline and confirms the distorted cubic phase, in agreement with XRD results: the strong spots correspond to the initial cubic phase and the weak ones are induced by the deformation of the octahedral.
The AFM images of the deposited films (see example in the Figure 3c) reveals a weak roughness and a high porosity. This porosity increases with the film thickness ranging from 100 nm to a few microns. Moreover, this analysis allowed to verify the thickness of the deposited layers by using the largest pores.

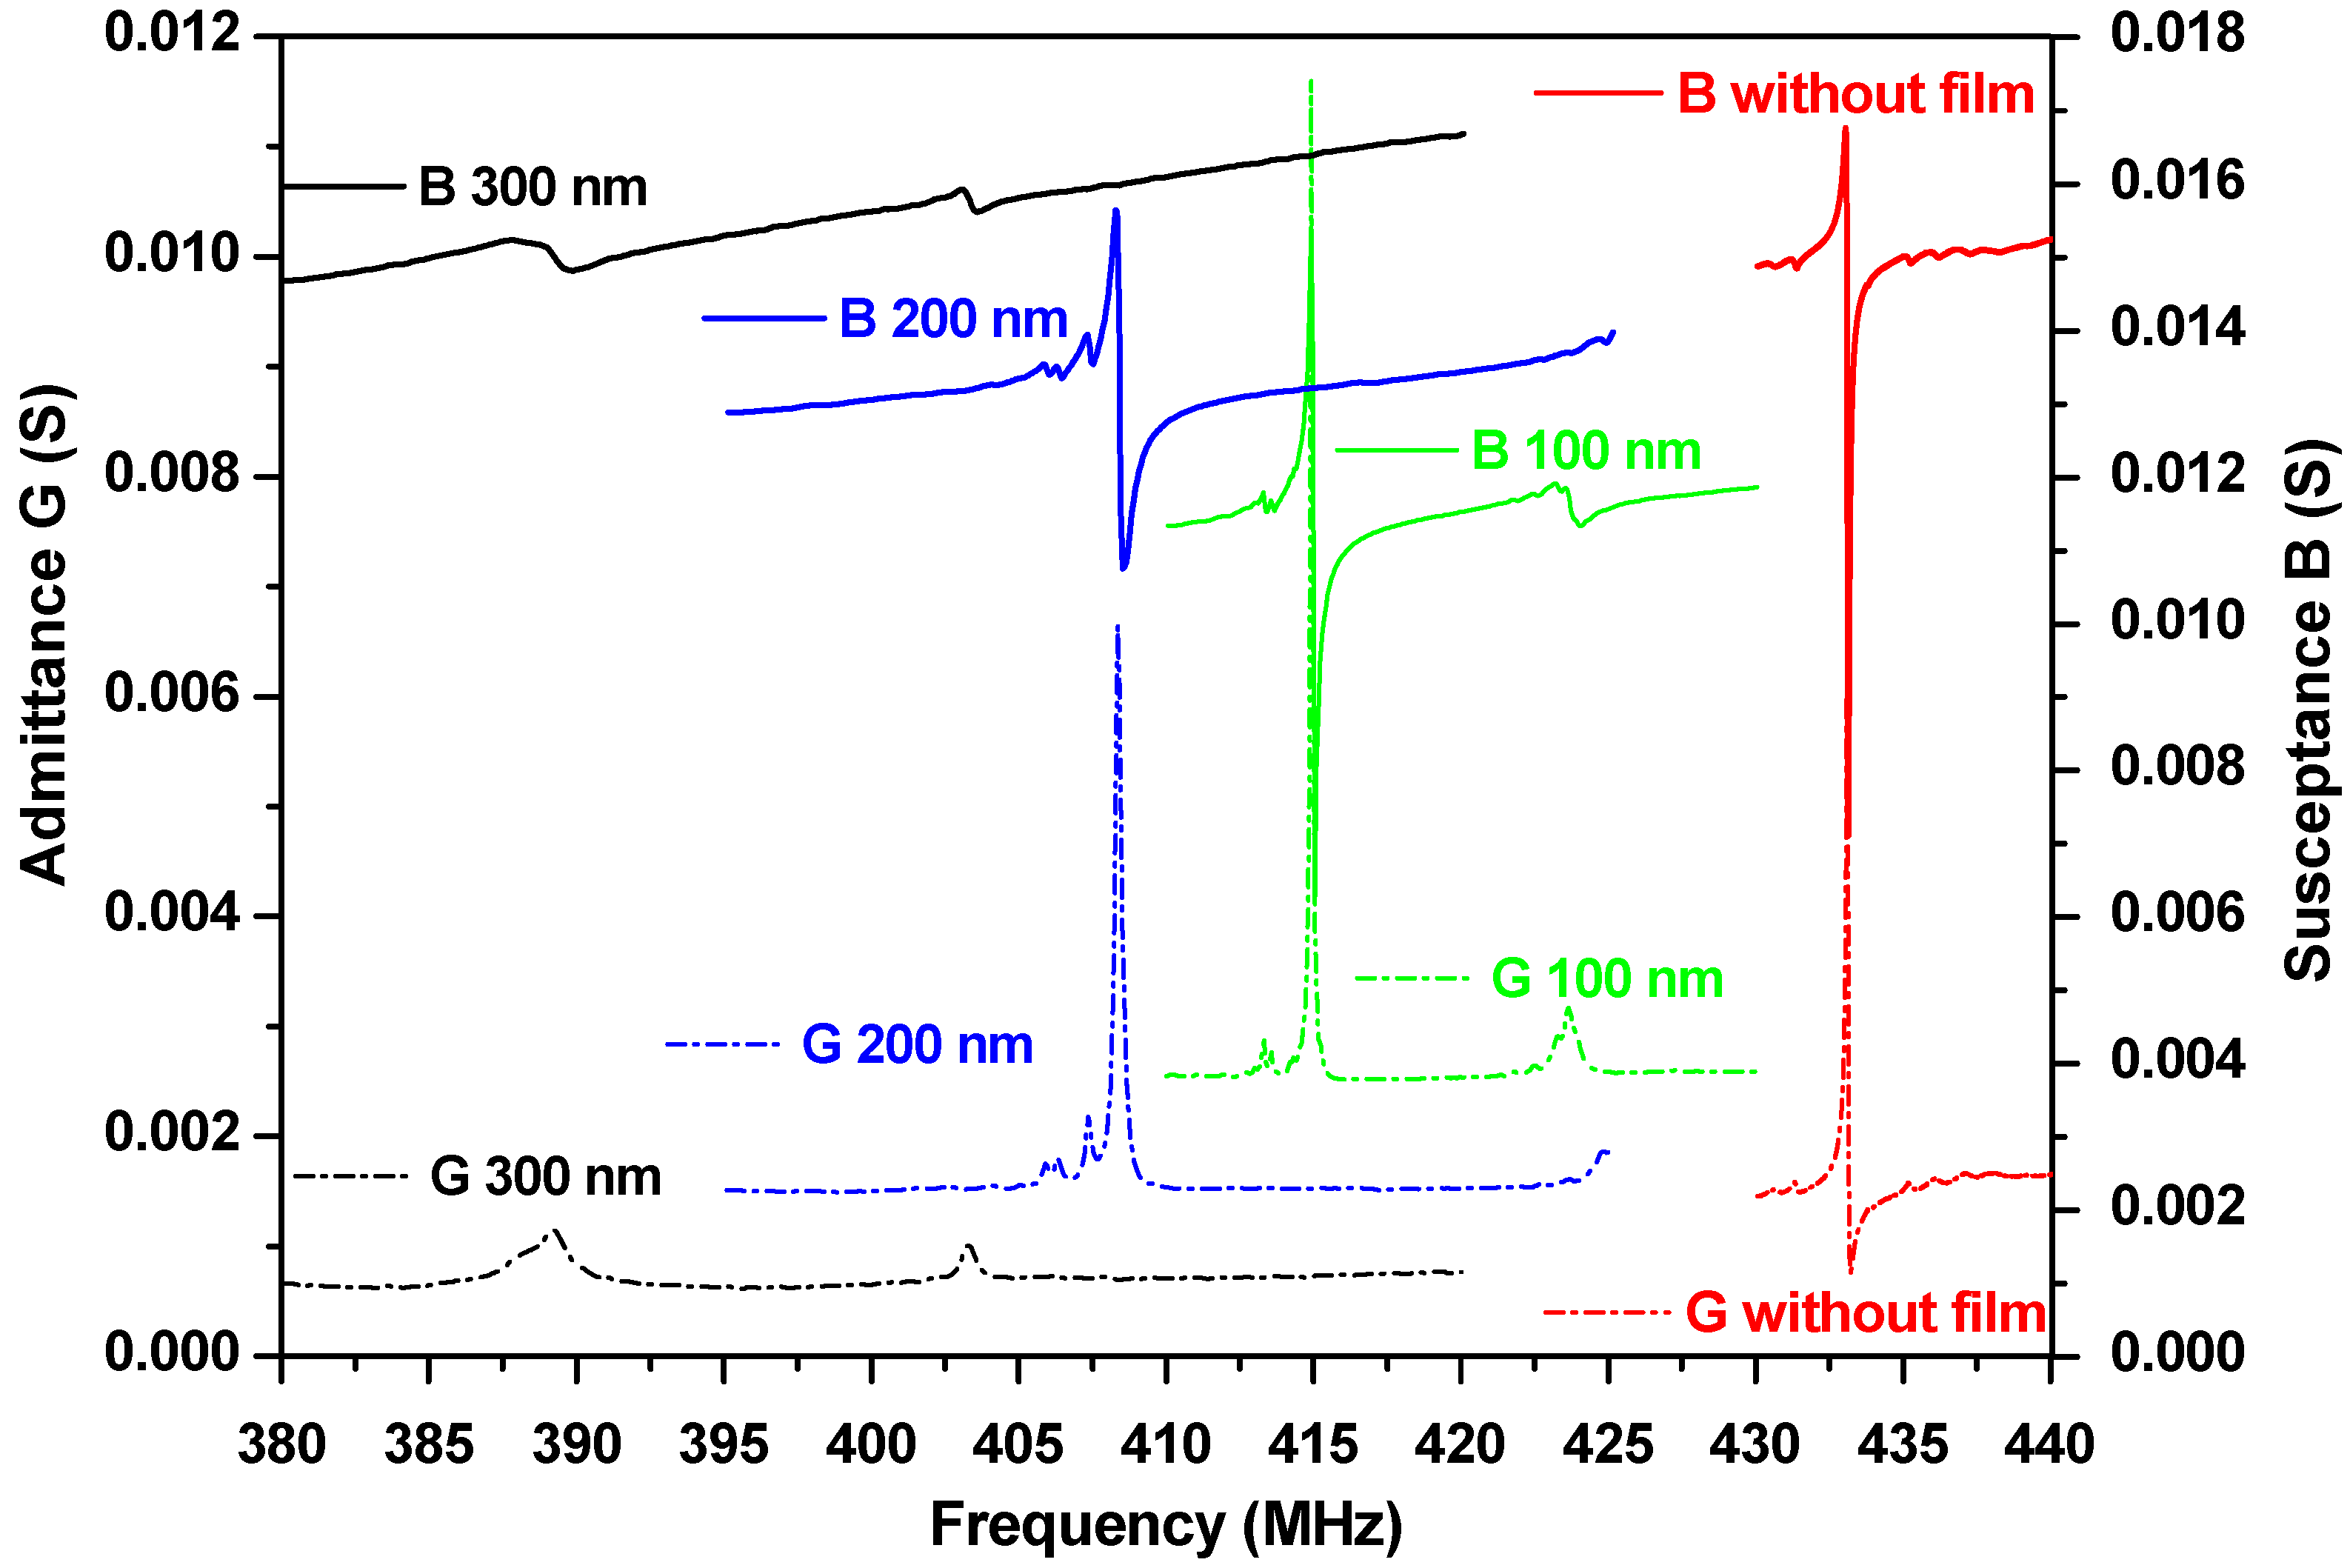
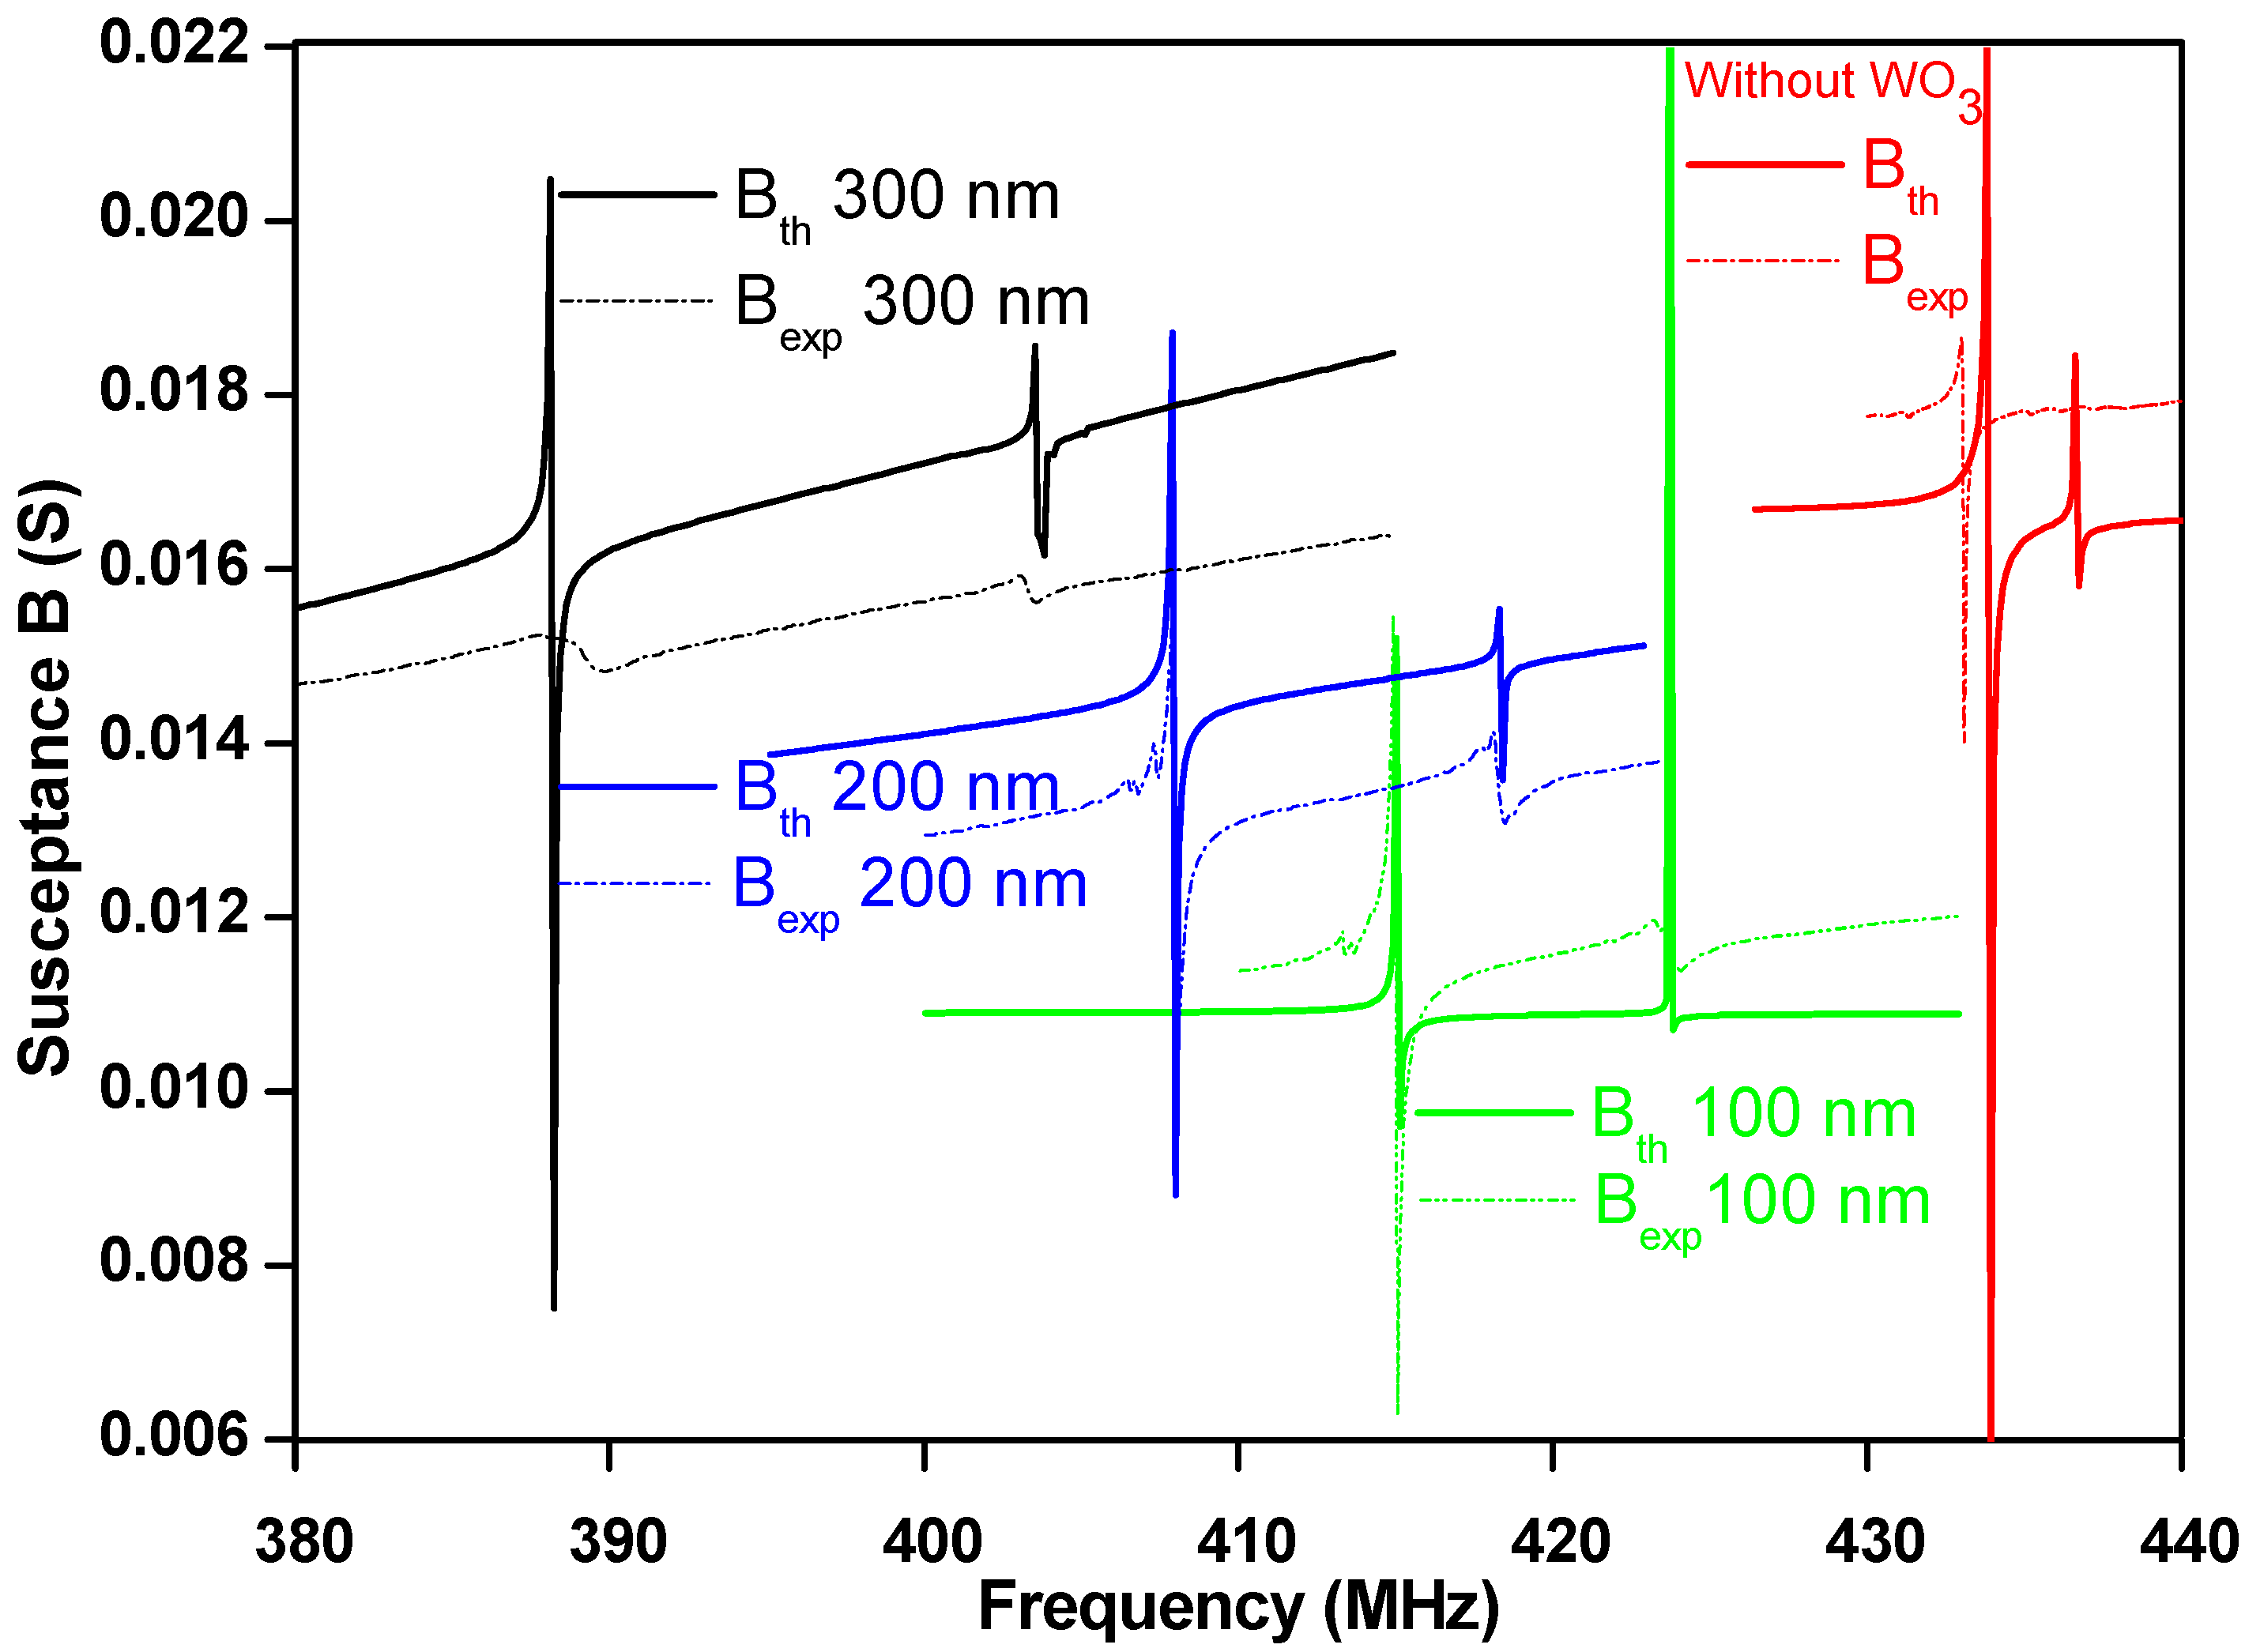
3.2. Piezoelectric Characteristic

To model the electromechanical behavior of surface acoustic wave devices, the periodic electrode array must be decomposed into elementary single-electrode cells; this allows the evaluation of the impact of electrical behavior on wave propagation (Figure 1d). From theoretical calculations, it is possible to determine the harmonic admittance. This method was developed by Ventura [27] and then by Baghaï-Wadji [28].

3.2.1. Sensitivity to the Gravimetric Effect

The first approach was to investigate the gravimetric sensitivity of these acoustic systems when they are coated with thin 100, 200, and 300 nm-thick layers of tungsten oxide. To do this, we have calibrated the simulation calculations on the experimental results performed at 25 °C. We assumed that the WO3 thin films were homogeneous and uniformly distributed on the whole resonator, i.e., on the reflectors and the transducer. This implies that the topology of the material covering the acoustic component is like the initial relief induced by the presence of the electrodes. Besides, we considered the case of a metallized surface excited wave with free charge motion modeled by a Green function (Figure 1c).
The harmonic admittance is given by the evolution of the conductance and the harmonic susceptance as a function of the frequency, defined by Y(f) = G(f) + j B(f). Figure 4 shows the measured admittances on resonators for three different thicknesses of WO3 thin film. After integration of WO3 with different thicknesses (passivation effect), we observed a significant shift toward low frequencies highlighting the mass effect following the deposition. The mass–frequency shift variation is described by the Sauerbrey relation: Δ f = 2 f 0 2 C 66 ρ q Δ m (f0 is SAW resonance frequency and ρq is quartz density). To take into account the passivation effect, we had to consider frequency shifts of 18, 26, and 45 MHz respectively for thicknesses of 100, 200, and 300 nm. We observe the disappearance of the exploitable resonance conditions for a film of 300-nm thick. Therefore, this thickness is considered as the maximum thickness compatible with a proper use of the acoustoelectric signals from Rayleigh wave resonators within our conditions.

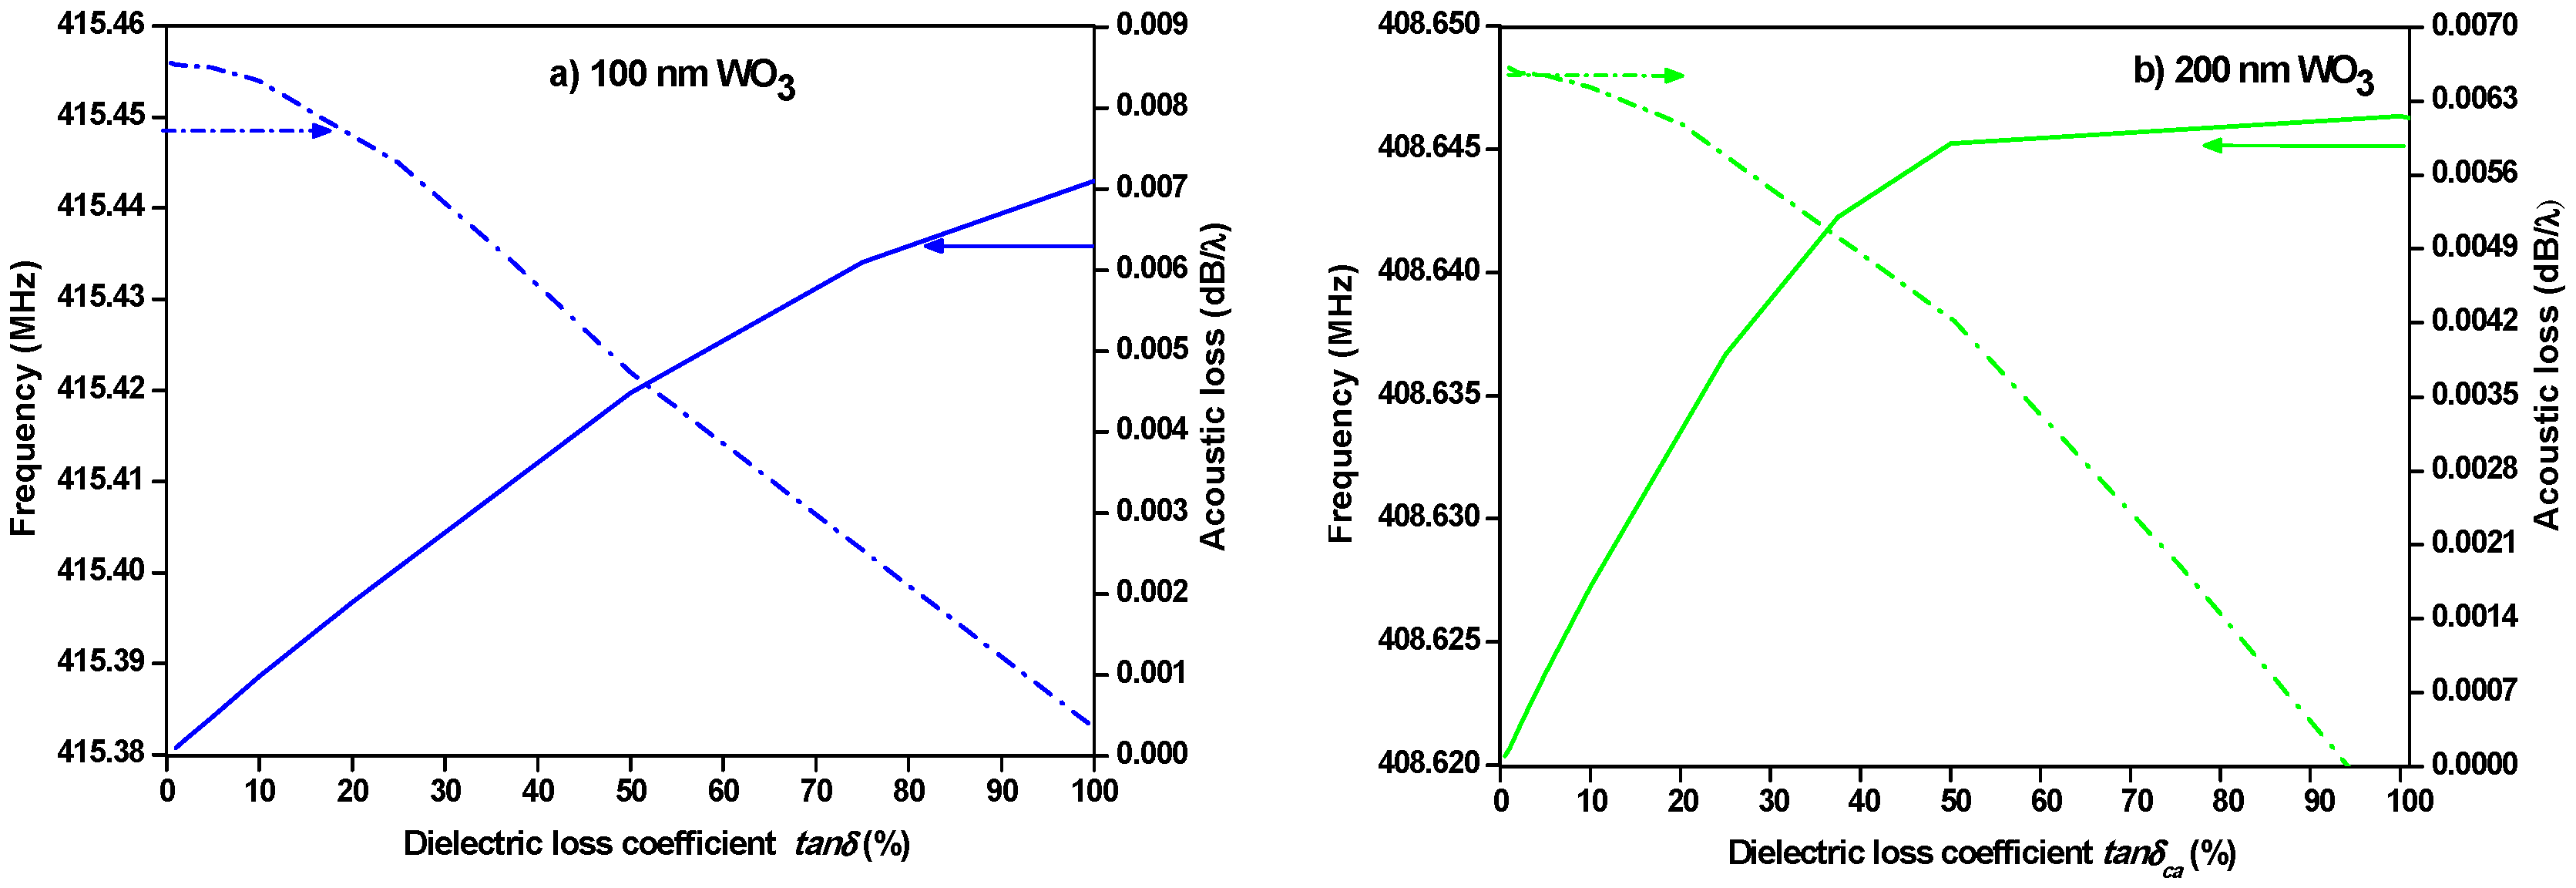
3.2.2. Sensitivity to the Variations of the WO3 Films Dielectric Properties

To consider the impact of conduction effects in the WO3 semiconductor layer on the acoustic wave properties, free charges must be introduced. The sensitivity of the SAW propagation parameters to the effects of variations in the dielectric properties of the metal oxide layer is monitored by the dielectric losses, denoted as tan(δ) and describe by the formula:
tan ( δ ) = σ ε   ω
where σ is the real conductivity, ԑ is the dielectric constant, and ω is the pulsation. For all simulations, a dielectric constant of 5.24 was set as reported in the literature [29].
Considering the WO3 film being a cubic structure and knowing its conducting behavior, the displacement of free charges under the action of an electric field (E) is described by the following equation [30]:
σ i j E j x i + j w ε i j   E j x i = 0
Some of the electroacoustic energy is converted to conduction current in the sensitive layer, resulting in attenuation of the wave as it propagates. These losses will be even more important as the electromechanical coupling is strong.
The simulation of the acoustic losses of the resonator according to the dielectric characteristics of the sensitive layer of WO3 was carried out with devices covered with 100 nm and 200 nm thickness. The parameters determined were deduced from Green’s function calculations that allow the characterization of the sensitivity of the wave properties (phase velocity, acoustic losses, and electromechanical coupling) at first order.
Figure 5 shows the acoustic losses as a function of the dielectric losses around the resonant frequency for each film thickness. The acoustic losses are slightly affected by the dielectric losses of the WO3 films. At the same time, the frequency decreases almost linearly. The acoustic losses increase with the thickness of the deposited films, to the limit of 300 nm.

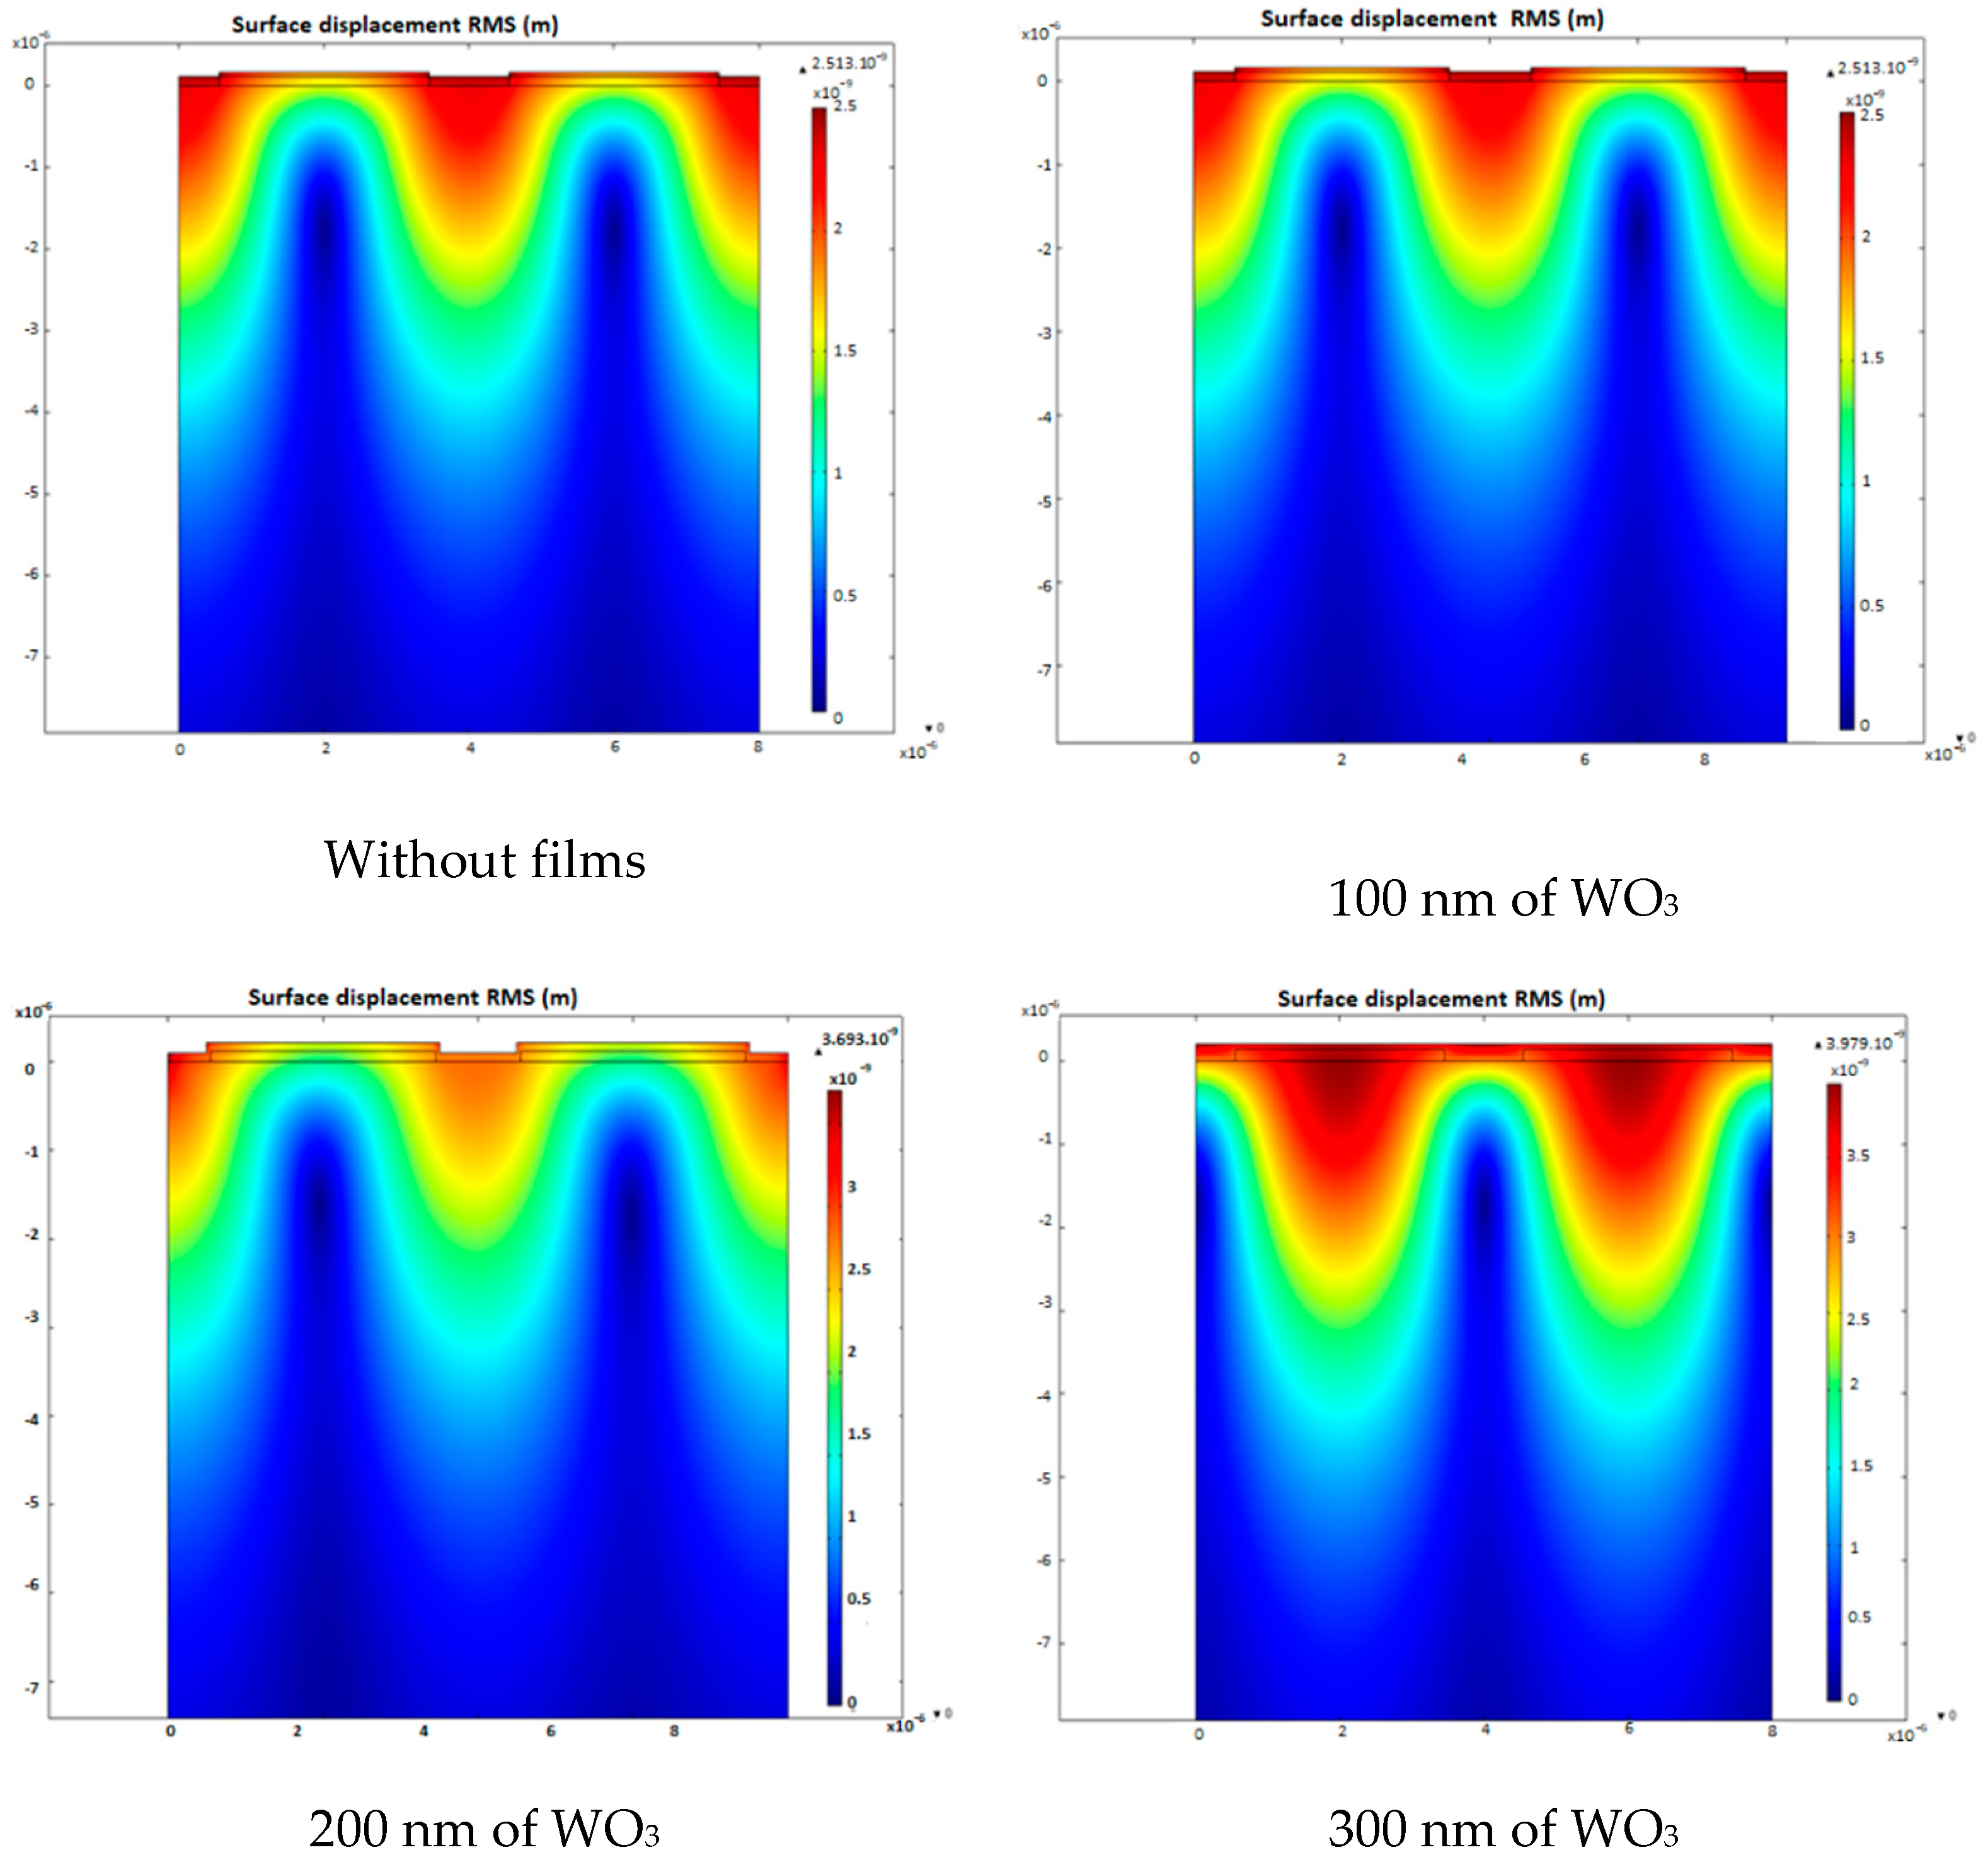
3.2.3. Elastic Properties of WO3 Thin Films

It is important to point out the lack of data about the elastic properties of WO3 as thin film. Therefore, the dielectric constants found in the literature was used as a starting point for fitting the elastic parameters. E. Salje reported values of the dielectric constants as high as 230 [29]. The magnitude of this value is in accordance with the strong dielectric polarizability in the piezoelectric phase of WO3. To simplify the simulation calculations, we assumed that the sensitive layer is isotropic. Figure 6 represents the theoretical and experimental electroacoustic responses (electrical admittances) obtained at room temperature in the case of quartz resonators (YX)/45°/10°. The signals obtained show the presence of a clear resonance at the end of the stop band corresponding to a precise reflection coefficient. From this characteristic, it is possible to determine the properties of the WO3 layer. For each configuration, a set of constants was adjusted to obtain the maximum agreement between the simulated and experimental results; the final results are reported in Table 2. As can be seen, the acoustic dissipation increases as a function of WO3 thickness such that above 300 nm, the experimental signal was no longer usable (Figure 6). In addition, the viscoelastic losses of the overlay were also adjusted according to the experimental observations resulting in an equivalent mechanical quality factor of 50.
As shown in Table 2, the density was adjusted for each WO3 thickness to obtain the best fits. The obtained results with SAW resonator, show similar elastic characteristic than those obtained with bulk acoustic wave (BAW) resonator. SAW results are slightly lower but remain of the same order of magnitude as those obtained using BAW [23]. This agreement shows that our approach remains reliable for the evaluation of elastic constants.
One can imagine that the mass density remained unchanged with respect to the thickness of WO3 film, but the ratio between the elastic constants would then have remained unchanged. From a technological point of view, the film is polycrystalline, and the porosity size is affected by the thickness of the deposited layers. Within each grain, the elasticity behavior is not modified but the total mass of the layer does increase as a function of the deposit (thickness).
We believe that the low values of elastic constants in Table 2 compared to those obtained in the literature [18] mainly originate in response to the acoustic disturbance of the grain boundaries of WO3. We therefore considered WO3 as a two-dimensional plate consisting of grains and grain boundaries. Under the external stress action, the elastic deformation within the material occurs at the grain boundaries. In this case, the elastic constants Cij define the local deformation leading to an electroacoustic response of the device.
The simulations were performed at different levels to differentiate the eigenmodes from the parasitic modes and to calculate the resonance frequency of our systems constituted by the piezoelectric substrate and the electrodes in presence or not of a WO3 layer. The maps shown on Figure 7 exhibit the thickness shearing vibration mode (TSM) representing the displacement fields in a SAW system.

4. Conclusions

The elastic properties of tungsten trioxide films were investigated in SAW sensor devices. The deposited layers (100, 200, and 300 nm) crystallized in a single-phase monoclinic structure, obtained after calcination at 400 °C. The analysis of the surface showed the presence of a strong porosity, ranging from a hundred nanometers to a few micrometers. Consequently, the effective volume densities decrease with the thickness of the WO3 layers.
The effective elastic constants Cij of WO3 was evaluated owing to the harmonic admittance obtained by simulations using FEM/BEM methods combined with experimental measurements. The calculated Young’s modulus and Poisson’s ratio are in the order of 8 GPa and 0.5, respectively. The electroacoustic modeling of SAW informs about the elastic deformation not within the completely thin layer but rather at the local level, i.e., at the interface between the grain boundaries constituting the crystal.
The SAW electroacoustic responses to the gravimetric effect and acoustic loss are dependent on the thickness of the deposited layers. As the thickness increases, resonance frequency shifts to lower values, followed by acoustic losses. Moreover, the displacement fields linked to the deformations become very important at the interface electrode—WO3 films.
Future work will involve sensing application using WO3 layers with better electroacoustic coupling.

Author Contributions

Conceptualization, methodology, and investigation, M.A.; formal analysis and data curation, V.M., V.C., C.T., C.L.; writing—original draft preparation, M.A.; writing—review and editing, M.A., V.M., V.C., C.T., C.L.; supervision, project administration, and funding acquisition, M.A. All authors have read and agreed to the published version of the manuscript.

Funding

We gratefully acknowledge the Regional Council of Provence-Alpes-Côte d’Azur General Council of Var, the agglomeration community of Toulon Provence Mediterranean and Toulon University for their financial supports in the framework of the “Nanomaterials for sensor devices” project.

Institutional Review Board Statement

Not applicable.

Informed Consent Statement

Not applicable.

Data Availability Statement

The data presented in this study are available on request from the corresponding author.

Conflicts of Interest

The authors declare no conflict of interest.

References

  1. Pan, Y.; Molin, Q.; Guo, T.; Zhang, L.; Cao, B.; Yang, J.; Wang, W.; Xue, X. Wireless passive surface acoustic wave (SAW) technology in gas sensing. Sens. Rev. 2021, 41, 135–143. [Google Scholar] [CrossRef]
  2. Palla-Papavlu, A.; Voicu, S.; Dinescu, M. Sensitive Materials and Coating Technologies for Surface Acoustic Wave Sensors. Chemosensors 2021, 9, 105. [Google Scholar] [CrossRef]
  3. David, M.; Arab, M.; Martino, C.; Delmas, L.; Guinneton, F.; Gavarri, J.-R. Carbon nanotubes/ceria composite layers deposited on surface acoustic wave devices for gas detection at room temperature. Thin Solid Films 2012, 520, 4786–4791. [Google Scholar] [CrossRef]
  4. Devkota, J.; Ohodnicki, P.R.; Greve, D.W. SAW Sensors for Chemical Vapors and Gases. Sensors 2017, 17, 801. [Google Scholar] [CrossRef] [PubMed] [Green Version]
  5. Briscoe, J.; Dunn, S. Piezoelectric nanogenerators—A review of nanostructured piezoelectric energy harvesters. Nano Energy 2015, 14, 15–29. [Google Scholar] [CrossRef]
  6. Mauder, A. SAW gas sensors: Comparison between delay line and two port resonator. Sens. Actuators B Chem. 1995, 26, 187–190. [Google Scholar] [CrossRef]
  7. Anisimkin, V.; Kotelyanskii, I.; Fedosov, V.; Caliendo, C.; Verardi, P.; Verona, E. Analysis of the different contributions to the response of SAW gas sensors. In Proceedings of the 1995 IEEE Ultrasonics Symposium: An International Symposium, Seattle, WA, USA, 7–10 November 1995. [Google Scholar] [CrossRef]
  8. Ricco, A.J.; Martin, S.J. Thin metal film characterization and chemical sensors: Monitoring electronic conductivity, mass loading and mechanical properties with surface acoustic wave devices. Thin Solid Films 1991, 206, 94–101. [Google Scholar] [CrossRef]
  9. Jakubik, W.P. Surface acoustic wave-based gas sensors. Thin Solid Films 2011, 520, 986–993. [Google Scholar] [CrossRef]
  10. Ippolito, S.J.; Kandasamy, S.; Kalantar-Zadeh, K.; Wlodarski, W. Layered SAW hydrogen sensor with modified tungsten trioxide selective layer. Sens. Actuators B Chem. 2005, 108, 553–557. [Google Scholar] [CrossRef]
  11. Sadek, A.Z.; Wlodarski, W.; Shin, K.; Kaner, R.; Kalantar-Zadeh, K. A polyaniline/WO3 nanofiber composite-based ZnO/64° YX LiNbO3 SAW hydrogen gas sensor. Synth. Met. 2008, 158, 29–32. [Google Scholar] [CrossRef]
  12. Guérin, J.; Bendahan, M.; Aguir, K. A dynamic response model for the WO3-based ozone sensors. Sens. Actuators B Chem. 2008, 128, 462–467. [Google Scholar] [CrossRef]
  13. Faleh, R.; Gomri, S.; Aguir, K.; Kachouri, A. A new combined transient extraction method coupled with WO3 gas sensors for polluting gases classification. Sens. Rev. 2021, 41, 437–448. [Google Scholar] [CrossRef]
  14. Ovcharenko, N.V.; Smirnova, T.V. High refractive index and magneto–optical glasses in the systems TeO2–WO3–Bi2O3 and TeO2–WO3–PbO. J. Non-Crystalline Solids 2001, 291, 121–126. [Google Scholar] [CrossRef]
  15. Mahmoud, I.S.; Issa, S.A.M.; Zakaly, H.M.H.; Saudi, H.A.; Ali, A.S.; Saddeek, Y.B.; Alharbi, T.; Tekin, H.O. Material characterization of WO3/Bi2O3 substituted calcium-borosilicate glasses: Structural, physical, mechanical properties and gamma-ray resistance competencies. J. Alloys Compd. 2021, 888, 161419. [Google Scholar] [CrossRef]
  16. Dirany, N.; Arab, M.; Madigou, V.; Leroux, C.; Gavarri, J.R. A facile one step route to synthesize WO3 nanoplatelets for CO oxidation and photodegradation of RhB: Microstructural, optical and electrical studies. RSC Adv. 2016, 6, 69615–69626. [Google Scholar] [CrossRef]
  17. Chatten, R.; Chadwick, A.V.; Rougier, A.A.; Lindan, P.J.D. The Oxygen Vacancy in Crystal Phases of WO3. J. Phys. Chem. B 2005, 109, 3146–3156. [Google Scholar] [CrossRef] [PubMed]
  18. Dendzik, Z.; Dhrobak, D.; Nowak, R. Elastic constants and analytic bond order potential for atomistic simulations of simple cubic tungsten trioxide. Task Q. 2009, 13, 93–98. [Google Scholar]
  19. Ventura, P.; Steichen, W. Pascal FEM/BEM Analysis of a Generalized Periodic Array. IEEE Trans. Ultrason. Ferroelectr. Freq. Control. 2007, 54, 2052–2059. [Google Scholar] [CrossRef] [PubMed]
  20. Perois, X.; Pastureaud, T.; Girard, P.-A.; Lardat, R. Analysis of saw devices using FEM/BEM method and parallel computing. In Proceedings of the IEEE Ultrasonics Symposium, Rotterdam, The Netherlands, 18–21 September 2005; IEEE: Rotterdam, The Netherlands, 2005; Volume 3, pp. 1564–1567. [Google Scholar] [CrossRef]
  21. Ventura, P.; Gratier, J. FEM/BEM analysis of infinite periodic grating covered with an SiO2 overlay. In Proceedings of the 2008 IEEE Ultrasonics Symposium, Beijing, China, 2–5 November 2008. [Google Scholar] [CrossRef]
  22. Li, H.; Lu, Z.; Ke, Y.; Tian, Y.; Luo, W. A Fast Optimization Algorithm of FEM/BEM Simulation for Periodic Surface Acoustic Wave Structures. Information 2019, 10, 90. [Google Scholar] [CrossRef] [Green Version]
  23. Arab, M.; Dirany, N.; David, M. BAW Resonator as Elastic Characterization Tools of WO3 Thin Films. Mater. Today Proc. 2016, 3, 152–156. [Google Scholar] [CrossRef]
  24. Fahmy, A.H.; Adler, E.L. Propagation of acoustic surface waves in multilayers: A matrix description. Appl. Phys. Lett. 1973, 22, 495–497. [Google Scholar] [CrossRef]
  25. Chopra, I. Review of State of Art of Smart Structures and Integrated Systems. AIAA J. 2002, 40, 2145–2187. [Google Scholar] [CrossRef]
  26. Covaci, C.; Gontean, A. Piezoelectric Energy Harvesting Solutions: A Review. Sensors 2020, 20, 3512. [Google Scholar] [CrossRef] [PubMed]
  27. Ventura, P.; Dufilie, P.; Hecht, F. Full analysis of the mixed matrix parameters for a SAW transducer having aperiodic multi electrode cells. In Proceedings of the 2014 IEEE International Ultrasonics Symposium, Chicago, IL, USA, 3–6 September 2014. [Google Scholar] [CrossRef]
  28. Reichinger, H.; Baghai-Wadji, A. Dynamic 2D analysis of SAW-devices including massloading. In Proceedings of the IEEE 1992 Ultrasonics Symposium, Tucson, AZ, USA, 20–23 October 1992. [Google Scholar] [CrossRef]
  29. Salje, E. Lattice dynamics of WO3. Acta Crystallogr. Sect. A 1975, 31, 360–363. [Google Scholar] [CrossRef]
  30. Royer, D.; Dieulesaint, E. Ondes Elastiques dans les Solides; Masson: Paris, France, 1996. [Google Scholar]
Figure 1. (a) Schematic of SAW device with a WO3-coated quartz, (b) configuration of the IDTs transducer, (c) SAW system with metallized excitation surface and (d) representation of an elementary cell.
Electronicmat 03 00012 g001
Figure 2. Representation of the typical mesh of two neighboring electrodes in a periodic array covered with WO3 films.
Electronicmat 03 00012 g002
Figure 3. (a) XRD pattern of the deposited WO3 films, (b) TEM cross section of 200 nm thick film, the insert picture corresponds to the electronic diffraction pattern, (c) AFM image of the surface porosity of a film on SAW device.
Electronicmat 03 00012 g003
Figure 4. Experimental admittances of Quartz (YX)/45°/10° alone and with WO3 films, 200 nm and 300 nm.
Electronicmat 03 00012 g004
Figure 5. Evolution of acoustic and dielectric losses and frequencies for a resonator covered with a WO3 film of thickness: (a) 100 nm and (b) 200 nm.
Electronicmat 03 00012 g005
Figure 6. Theoretical and experimental responses of quartz (YX)/45°/10° resonators for different WO3 thicknesses: 100 nm, 200 nm, and 300 nm.
Electronicmat 03 00012 g006
Figure 7. Displacement modes in SAW devices for different layers.
Electronicmat 03 00012 g007
Table 1. The IDT specifications of YX/45°/10° quartz SAW resonator.
Resonator Type Quartz (YX/45°/10°)
Type of ElectrodesAluminium
Electrode width a (µm)2.9
IDT period p (µm)3.63
Wavelegnth λ (µm)8
Electrode thickness h (nm)120
Metallization ratio a/p0.8
Metallization thickness h/λ (%)1.5
Acoustic velocity v (m/s)3462
Table 2. Elastic constants of WO3 thin film at 100 nm, 200 nm, and 300 nm thicknesses obtained from modeling of quartz (YX)/45°/10° resonators by the mixed matrix method.
ResonatorQuartz (YX)/45°/10°
Thickness of WO3100 nm200 nm300 nm
Density ρ (kg/m3)650047003900
C11 (GPa)141512.5
C12 (GPa)887
C66 (GPa)2.52.52.5
Poisson Coefficient ν0.570.530.56
Young’s modulus E (GPa)8.28.38.0
Publisher’s Note: MDPI stays neutral with regard to jurisdictional claims in published maps and institutional affiliations.

