


Detection of Metabolic Syndrome Using Insulin Resistance Indexes: A Cross-Sectional Observational Cohort Study

 , ,
, ,
Abstract
:1. Introduction
2. Materials and Methods
2.1. Study Design
2.2. Study Population
2.3. Anthropometric Data
2.4. Blood Pressure Measurements
2.5. Laboratory Analyses
2.6. Diagnosis of Metabolic Syndrome
2.7. Calculation of Body Mass Index
2.8. Calculation of Clinical Indicators
2.9. Ethics Approval and Consent to Participate
2.10. Statistical Analyses
3. Results
4. Discussion
5. Strengths and Limitations
6. Conclusions
Author Contributions
Funding
Institutional Review Board Statement
Informed Consent Statement
Data Availability Statement
Acknowledgments
Conflicts of Interest
References
- Laurindo, L.F.; Barbalho, S.M.; Marquess, A.R.; Grecco, A.I.S.; Goulart, R.A.; Tofano, R.J.; Bishayee, A. Pomegranate (Punica granatum L.) and Metabolic Syndrome Risk Factors and Outcomes: A Systematic Review of Clinical Studies. Nutrients 2022, 14, 1665. [Google Scholar] [CrossRef] [PubMed]
- Huang, S.; Li, Y.; Shi, K.; Wang, J.; Jiang, L.; Gao, Y.; Yan, W.F.; Yang, Z.G. Impact of Metabolic Syndrome on Left Ventricular Deformation and Myocardial Energetic Efficiency Compared Between Women and Men: An MRI Study. J. Magn. Reson. Imaging 2022. [Google Scholar] [CrossRef] [PubMed]
- Chen, W.; Pang, Y. Metabolic Syndrome and PCOS: Pathogenesis and the Role of Metabolites. Metabolites 2021, 11, 869. [Google Scholar] [CrossRef]
- Grundy, S.M.; Cleeman, J.I.; Daniels, S.R.; Donato, K.A.; Eckel, R.H.; Franklin, B.A.; Gordon, D.J.; Krauss, R.M.; Savage, P.J.; Smith, S.C., Jr.; et al. Diagnosis and management of the metabolic syndrome: An American Heart Association/National Heart, Lung, and Blood Institute Scientific Statement. Circulation 2005, 112, 2735–2752. [Google Scholar] [CrossRef] [PubMed] [Green Version]
- Reaven, G.M. Why Syndrome X? From Harold Himsworth to the Insulin Resistance Syndrome. Cell Metab. 2005, 1, 9–14. [Google Scholar] [CrossRef] [Green Version]
- Silveira Rossi, J.L.; Barbalho, S.M.; Reverete de Araujo, R.; Bechara, M.D.; Sloan, K.P.; Sloan, L.A. Metabolic syndrome and cardiovascular diseases: Going beyond traditional risk factors. Diabetes Metab. Res. Rev. 2022, 38, e3502. [Google Scholar] [CrossRef]
- Barbalho, S.M.; Direito, R.; Laurindo, L.F.; Marton, L.T.; Guiguer, E.L.; Goulart, R.A.; Tofano, R.J.; Carvalho, A.C.A.; Flato, U.A.P.; Capelluppi Tofano, V.A.; et al. Ginkgo biloba in the Aging Process: A Narrative Review. Antioxidants 2022, 11, 525. [Google Scholar] [CrossRef]
- Fahed, G.; Aoun, L.; Bou Zerdan, M.; Allam, S.; Bou Zerdan, M.; Bouferraa, Y.; Assi, H.I. Metabolic Syndrome: Updates on Pathophysiology and Management in 2021. Int. J. Mol. Sci. 2022, 23, 786. [Google Scholar] [CrossRef]
- Santos-Moreno, P.; Rodríguez-Vargas, G.S.; Martínez, S.; Ibatá, L.; Rojas-Villarraga, A. Metabolic Abnormalities, Cardiovascular Disease, and Metabolic Syndrome in Adult Rheumatoid Arthritis Patients: Current Perspectives and Clinical Implications. Open Access Rheumatol. 2022, 14, 255–267. [Google Scholar] [CrossRef]
- Jakubiak, G.K.; Osadnik, K.; Lejawa, M.; Osadnik, T.; Goławski, M.; Lewandowski, P.; Pawlas, N. “Obesity and Insulin Resistance” Is the Component of the Metabolic Syndrome Most Strongly Associated with Oxidative Stress. Antioxidants 2022, 11, 79. [Google Scholar] [CrossRef]
- Kayssi, A.; Al-Jundi, W.; Papia, G.; Kucey, D.S.; Forbes, T.; Rajan, D.K.; Neville, R.; Dueck, A.D. Drug-eluting balloon angioplasty versus uncoated balloon angioplasty for the treatment of in-stent restenosis of the femoropopliteal arteries. Cochrane Database Syst. Rev. 2019, 1, Cd012510. [Google Scholar] [CrossRef]
- Jakubiak, G.K.; Pawlas, N.; Cieślar, G.; Stanek, A. Pathogenesis and Clinical Significance of In-Stent Restenosis in Patients with Diabetes. Int. J. Environ. Res. Public Health 2021, 18, 11970. [Google Scholar] [CrossRef] [PubMed]
- Bruce, K.D.; Byrne, C.D. The metabolic syndrome: Common origins of a multifactorial disorder. Postgrad. Med. J. 2009, 85, 614–621. [Google Scholar] [CrossRef] [Green Version]
- Abou Ziki, M.D.; Mani, A. Metabolic syndrome: Genetic insights into disease pathogenesis. Curr. Opin. Lipidol. 2016, 27, 162–171. [Google Scholar] [CrossRef]
- Mirr, M.; Skrypnik, D.; Bogdański, P.; Owecki, M. Newly proposed insulin resistance indexes called TyG-NC and TyG-NHtR show efficacy in diagnosing the metabolic syndrome. J. Endocrinol. Investig. 2021, 44, 2831–2843. [Google Scholar] [CrossRef]
- Freeman, A.M.; Pennings, N. Insulin Resistance. In StatPearls; StatPearls Publishing LLC.: Treasure Island, FL, USA, 2022. [Google Scholar]
- Lohman, T.G.; Roche, A.F.; Martorell, R. Anthropometric Standardization Reference Manual; Human Kinetics Books: Champaign, IL, USA, 1988. [Google Scholar]
- Gibson, R.S. Principles of Nutritional Assessment; Oxford University Press: Oxford, UK, 2005. [Google Scholar]
- Rushton, M.; Smith, J. How to measure blood pressure manually. Nurs. Stand. 2016, 30, 36–39. [Google Scholar] [CrossRef] [PubMed]
- Sakboonyarat, B.; Rangsin, R.; Mittleman, M.A. Incidence and risk factors of metabolic syndrome among Royal Thai Army personnel. Sci. Rep. 2022, 12, 15692. [Google Scholar] [CrossRef] [PubMed]
- Sinatora, R.V.; Chagas, E.F.B.; Mattera, F.O.P.; Mellem, L.J.; Santos, A.; Pereira, L.P.; Aranão, A.L.C.; Guiguer, E.L.; Araújo, A.C.; Haber, J.; et al. Relationship of Inflammatory Markers and Metabolic Syndrome in Postmenopausal Women. Metabolites 2022, 12, 73. [Google Scholar] [CrossRef]
- Lear, S.A.; Gasevic, D. Ethnicity and Metabolic Syndrome: Implications for Assessment, Management and Prevention. Nutrients 2019, 12, 15. [Google Scholar] [CrossRef] [Green Version]
- Kurisu, S.; Nitta, K.; Sumimoto, Y.; Ikenaga, H.; Ishibashi, K.; Fukuda, Y.; Kihara, Y. Frontal QRS-T angle and World Health Organization classification for body mass index. Int. J. Cardiol. 2018, 272, 185–188. [Google Scholar] [CrossRef]
- Huang, R.; Cheng, Z.; Jin, X.; Yu, X.; Yu, J.; Guo, Y.; Zong, L.; Sheng, J.; Liu, X.; Wang, S. Usefulness of four surrogate indexes of insulin resistance in middle-aged population in Hefei, China. Ann. Med. 2022, 54, 622–632. [Google Scholar] [CrossRef] [PubMed]
- Demir, A.K.; Şahin, Ş.; Kaya, S.U.; Bütün, İ.; Çıtıl, R.; Önder, Y.; Taşlıyurt, T.; Demir, O.; Deveci, K.; Kutlutürk, F. Prevalence of insulin resistance and identifying HOMA1-IR and HOMA2-IR indexes in the Middle Black Sea region of Turkey. Afr. Health Sci. 2020, 20, 277–286. [Google Scholar] [CrossRef] [PubMed]
- Er, L.K.; Wu, S.; Chou, H.H.; Hsu, L.A.; Teng, M.S.; Sun, Y.C.; Ko, Y.L. Triglyceride Glucose-Body Mass Index Is a Simple and Clinically Useful Surrogate Marker for Insulin Resistance in Nondiabetic Individuals. PLoS ONE 2016, 11, e0149731. [Google Scholar] [CrossRef] [PubMed]
- García, A.G.; Urbina Treviño, M.V.; Villalpando Sánchez, D.C.; Aguilar, C.A. Diagnostic accuracy of triglyceride/glucose and triglyceride/HDL index as predictors for insulin resistance in children with and without obesity. Diabetes Metab. Syndr. 2019, 13, 2329–2334. [Google Scholar] [CrossRef] [PubMed]
- Drozdz, D.; Alvarez-Pitti, J.; Wójcik, M.; Borghi, C.; Gabbianelli, R.; Mazur, A.; Herceg-Čavrak, V.; Lopez-Valcarcel, B.G.; Brzeziński, M.; Lurbe, E.; et al. Obesity and Cardiometabolic Risk Factors: From Childhood to Adulthood. Nutrients 2021, 13, 4176. [Google Scholar] [CrossRef]
- Çin, N.N.A.; Yardımcı, H.; Koç, N.; Uçaktürk, S.A.; Akçil Ok, M. Triglycerides/high-density lipoprotein cholesterol is a predictor similar to the triglyceride-glucose index for the diagnosis of metabolic syndrome using International Diabetes Federation criteria of insulin resistance in obese adolescents: A cross-sectional study. J. Pediatr. Endocrinol. Metab. 2020, 33, 777–784. [Google Scholar] [CrossRef]
- Dong, J.; Liu, Y.H.; Lu, Y.K.; Hu, L.K.; Chen, N.; Ma, L.L.; Chu, X.; Yan, Y.X. Association between surrogate indicators of insulin resistance and risk of type 2 diabetes combined with hypertension among Chinese adults: Two independent cohort studies. Nutr. Metab. 2022, 19, 85. [Google Scholar] [CrossRef]
- Won, K.B.; Chang, H.J.; Kim, H.C.; Jeon, K.; Lee, H.; Shin, S.; Cho, I.J.; Park, S.H.; Lee, S.H.; Jang, Y. Differential impact of metabolic syndrome on subclinical atherosclerosis according to the presence of diabetes. Cardiovasc. Diabetol. 2013, 12, 41. [Google Scholar] [CrossRef] [Green Version]
- Sabio, J.M.; Vargas-Hitos, J.; Zamora-Pasadas, M.; Mediavilla, J.D.; Navarrete, N.; Ramirez, A.; Hidalgo-Tenorio, C.; Jáimez, L.; Martín, J.; Jiménez-Alonso, J. Metabolic syndrome is associated with increased arterial stiffness and biomarkers of subclinical atherosclerosis in patients with systemic lupus erythematosus. J. Rheumatol. 2009, 36, 2204–2211. [Google Scholar] [CrossRef]
- Lopes-Vicente, W.R.P.; Rodrigues, S.; Cepeda, F.X.; Jordão, C.P.; Costa-Hong, V.; Dutra-Marques, A.C.B.; Carvalho, J.C.; Alves, M.; Bortolotto, L.A.; Trombetta, I.C. Arterial stiffness and its association with clustering of metabolic syndrome risk factors. Diabetol. Metab. Syndr. 2017, 9, 87. [Google Scholar] [CrossRef] [Green Version]
- Chen, S.; Mei, Q.; Guo, L.; Yang, X.; Luo, W.; Qu, X.; Li, X.; Zhou, B.; Chen, K.; Zeng, C. Association between triglyceride-glucose index and atrial fibrillation: A retrospective observational study. Front. Endocrinol. 2022, 13, 1047927. [Google Scholar] [CrossRef] [PubMed]
- Wang, Z.; Hui, X.; Huang, X.; Li, J.; Liu, N. Relationship between a novel non-insulin-based metabolic score for insulin resistance (METS-IR) and coronary artery calcification. BMC Endocr. Disord. 2022, 22, 274. [Google Scholar] [CrossRef] [PubMed]
- Wu, Z.; Cui, H.; Li, W.; Zhang, Y.; Liu, L.; Liu, Z.; Zhang, W.; Zheng, T.; Yang, J. Comparison of three non-insulin-based insulin resistance indexes in predicting the presence and severity of coronary artery disease. Front. Cardiovasc. Med. 2022, 9, 918359. [Google Scholar] [CrossRef] [PubMed]


| Variables | Sex | Anova | |||||||||
|---|---|---|---|---|---|---|---|---|---|---|---|
| Men | Women | p-Value | |||||||||
| MetS | |||||||||||
| with MetS (n = 70) | without MetS (n = 82) | with MetS (n = 41) | without MetS (n = 75) | Sex | MetS | Interaction | |||||
| Mean | SD | Mean | SD | Mean | SD | Mean | SD | ||||
| Age | 58.0 | 14.7 | 53.1 † | 13.9 | 55.6 | 14.1 | 59.8 ‡ | 11.8 | 0.214 | 0.853 | 0.009 *** |
| BMI (kg/m2) | 29.5 | 4.8 | 30.0 | 5.9 | 30.7 | 7.8 | 29.3 | 5.2 | 0.740 | 0.539 | 0.201 |
| NC (cm) | 40.8 | 3.5 | 40.5 | 4.3 | 36.3 ‡ | 3.1 | 36.0 ‡ | 3.8 | <0.001 * | 0.469 | 0.941 |
| WC (cm) | 110.4 | 13.7 | 94.1 † | 13.9 | 106.0 | 11.7 | 97.1 † | 12.3 | 0.691 | <0.001 ** | 0.028 *** |
| HDL-c (mg/dL) | 38.9 | 9.7 | 54.0 † | 11.9 | 41.1 | 11.2 | 48.9 †,‡ | 16.8 | 0.371 | <0.001 ** | 0.026 *** |
| TG/FG | 2.15 | 0.10 | 2.01 † | 0.13 | 2.18 | 0.10 | 2.01 † | 0.09 | 0.223 | <0.001 ** | 0.252 |
| WHtR | 0.64 | 0.08 | 0.54 † | 0.09 | 0.66 | 0.08 | 0.61 †,‡ | 0.08 | <0.001 * | <0.001 ** | 0.044 *** |
| NHtR | 0.24 | 0.02 | 0.24 | 0.03 | 0.22 ‡ | 0.02 | 0.22 ‡ | 0.02 | 0.003 * | 0.716 | 0.818 |
| TyG | 9.19 | 0.46 | 8.57 † | 0.58 | 9.34 | 0.48 | 8.57 † | 0.45 | 0.223 | <0.001 ** | 0.252 |
| TyG-BMI | 271.1 | 46.7 | 257.6 | 58.9 | 285.8 | 68.7 | 250.9 † | 46.2 | 0.555 | 0.001 ** | 0.123 |
| TyG-WC | 1013.5 | 127.9 | 809.1 † | 141.5 | 991.3 | 125.9 | 833.5 † | 112.2 | 0.947 | <0.001 ** | 0.151 |
| TyG-WHtR | 5.89 | 0.78 | 4.71 † | 0.88 | 6.20 ‡ | 0.81 | 5.26 †,‡ | 0.77 | <0.001 * | <0.001 ** | 0.250 |
| TyG-NC | 375.5 | 39.1 | 347.3 † | 47.9 | 339.6 ‡ | 33.8 | 308.9 †,‡ | 33.8 | <0.001 * | <0.001 ** | 0.800 |
| TyG-NHtR | 2.18 | 0.23 | 2.02 † | 0.29 | 2.13 | 0.23 | 1.94 † | 0.21 | 0.043 * | <0.001 ** | 0.752 |
| METS-IR | 49.3 | 9.7 | 43.5 † | 9.9 | 51.0 | 14.0 | 43.9 † | 9.0 | 0.435 | <0.001 ** | 0.614 |
| Variables | Sex | |||||||||||
|---|---|---|---|---|---|---|---|---|---|---|---|---|
| Men | Women | |||||||||||
| MetS | ||||||||||||
| With MetS (n = 70) | Without MetS (n = 82) | With MetS (n = 41) | Without MetS (n = 75) | |||||||||
| Median | 25th | 75th | Median | 25th | 75th | Median | 25th | 75th | Median | 25th | 75th | |
| Fasting glucose (mg/dL) | 109.0 | 98.7 | 12.8.5 | 94.0 † | 88.0 | 99.2 | 106.0 | 95.0 | 125.0 | 93.8 † | 88.2 | 101.0 |
| TG (mg/dL) | 161.0 | 126.5 | 222.5 | 106.4 † | 75.6 | 150.7 | 187.0 ‡ | 165.0 | 274.0 | 108.0 † | 83.0 | 158.0 |
| Systolic blood pressure (mmHg) | 140.0 | 120.0 | 150.0 | 120.0 † | 120.0 | 130.0 | 137.0 | 120.0 | 155.0 | 120.0 † | 120.0 | 130.0 |
| Diastolic blood pressure (mmHg) | 80.0 | 80.0 | 100.0 | 80.0 † | 80.0 | 80.0 | 80.0 | 80.0 | 100.0 | 80.0 † | 80.0 | 80.0 |
| TG-HDL-c | 4.11 | 3.07 | 5.94 | 2.04 † | 1.40 | 3.19 | 4.81 | 3.63 | 7.54 | 2.38 † | 1.69 | 3.69 |
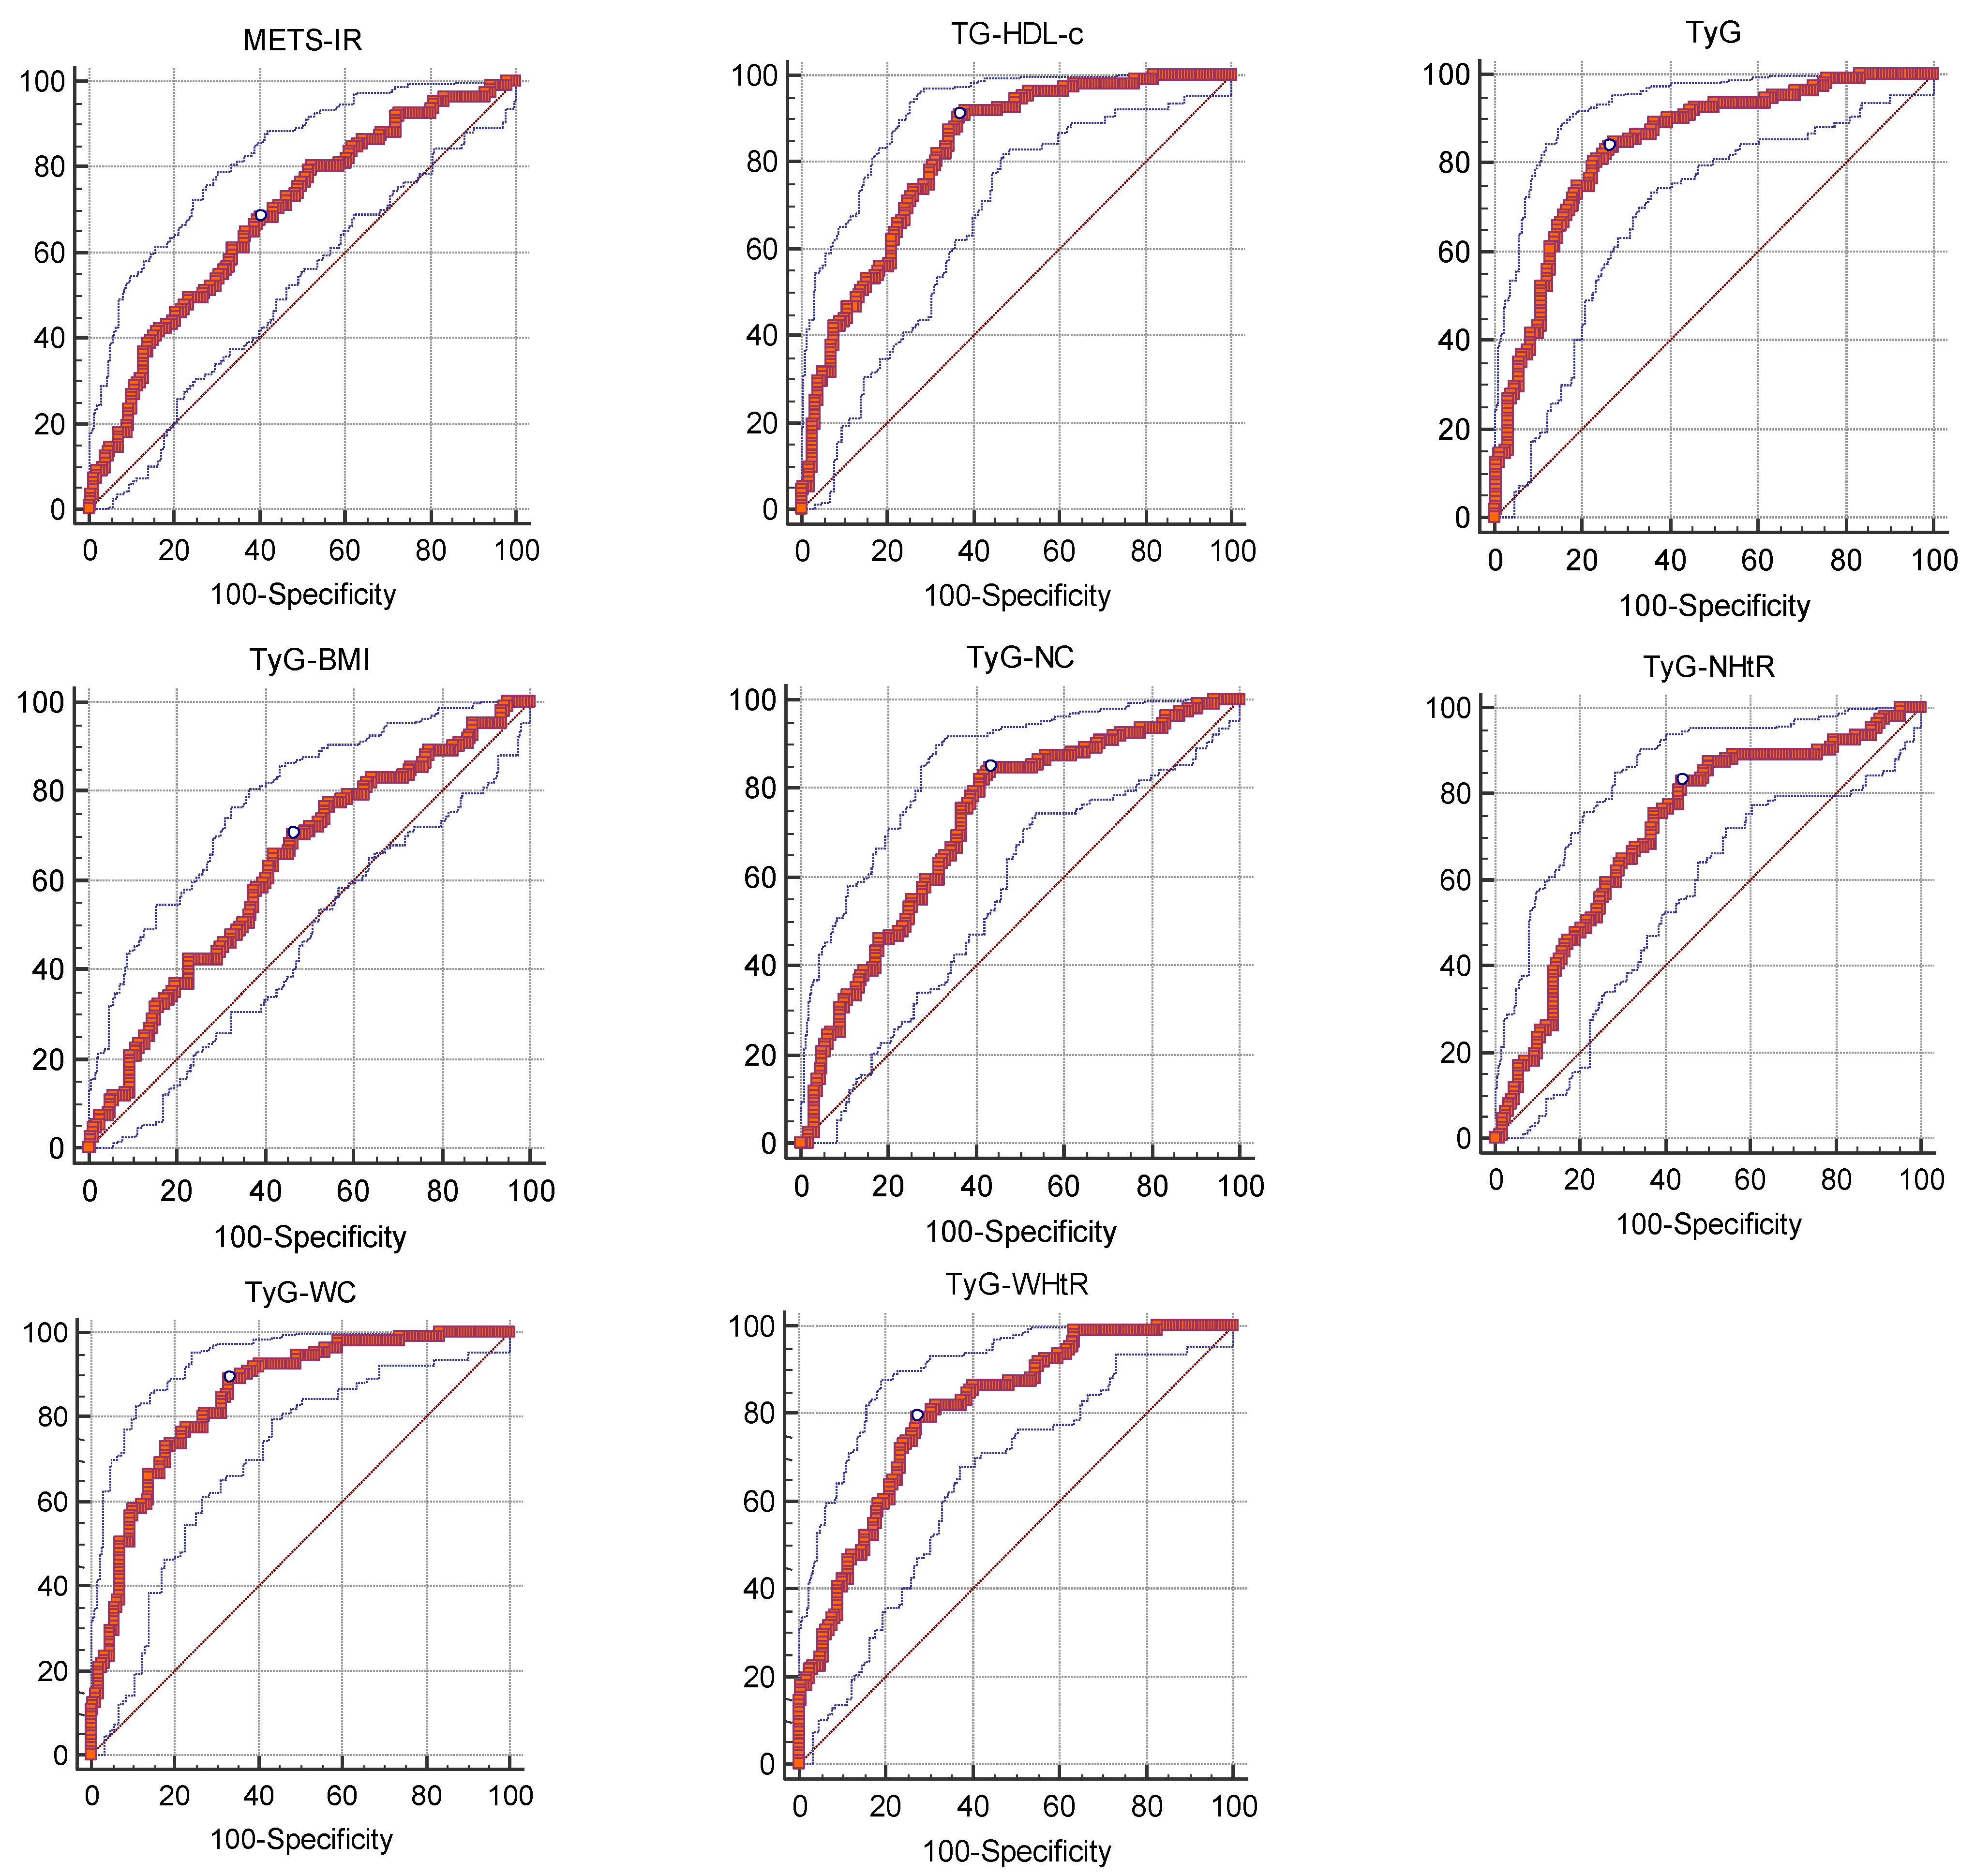
| Variables | Cut-off Points for MetS | AUC (IC95%) | Sensitivity | 95% CI | Specificity | 95% CI | +PV | 95% CI | −PV | 95% CI |
|---|---|---|---|---|---|---|---|---|---|---|
| WHtR | >0.607361963 | 0.715 (0.657–0.768) * | 70.27 | 60.9–78.6 | 66.24 | 58.3–73.6 | 59.5 | 50.6–68.0 | 75.9 | 67.9–82.8 |
| NHtR | >0.219298246 | 0.541 (0.479–0.601) | 76.58 | 67.6–84.1 | 36.31 | 28.8–44.3 | 45.9 | 38.6–53.4 | 68.7 | 57.6–78.4 |
| TyG | >8.882048782 | 0.837 (0.787–0.879) * | 83.78 | 75.6–90.1 | 73.89 | 66.3–80.6 | 69.4 | 60.9–77.1 | 86.6 | 79.6–91.8 |
| TyG-BMI | >249.3913555 | 0.630 (0.569–0.688) * | 70.27 | 60.9–78.6 | 53.5 | 45.4–61.5 | 51.7 | 43.4–59.9 | 71.8 | 62.7–79.7 |
| TyG-WC | >860.7463699 | 0.849 (0.800–0.889) * | 89.19 | 81.9–94.3 | 66.88 | 58.9–74.2 | 65.6 | 57.4–73.1 | 89.7 | 82.8–94.6 |
| TyG-WHtR | >5.365297405 | 0.804 (0.751–0.850) * | 79.28 | 70.5–86.4 | 72.61 | 64.9–79.4 | 67.2 | 58.4–75.1 | 83.2 | 75.9–89.0 |
| TyG-NC | >328.0513282 | 0.722 (0.664–0.774) * | 84.68 | 76.6–90.8 | 56.69 | 48.6–64.6 | 58 | 50.0–65.7 | 84 | 75.6–90.4 |
| TyG-NHtR | >1.9845651 | 0.713 (0.654–0.766) * | 82.88 | 74.6–89.4 | 56.05 | 47.9–64.0 | 57.1 | 49.1–64.9 | 82.2 | 73.7–89.0 |
| TG-HDL-c | >2.552631579 | 0.817 (0.765–0.861) * | 90.99 | 84.1–95.6 | 63.06 | 55.0–70.6 | 63.5 | 55.5–71.0 | 90.8 | 83.8–95.5 |
| METS-IR | >43.82124867 | 0.683 (0.623–0.738) * | 68.47 | 59.0–77.0 | 59.87 | 51.8–67.6 | 54.7 | 46.0–63.1 | 72.9 | 64.3–80.3 |
Disclaimer/Publisher’s Note: The statements, opinions and data contained in all publications are solely those of the individual author(s) and contributor(s) and not of MDPI and/or the editor(s). MDPI and/or the editor(s) disclaim responsibility for any injury to people or property resulting from any ideas, methods, instructions or products referred to in the content. |
© 2023 by the authors. Licensee MDPI, Basel, Switzerland. This article is an open access article distributed under the terms and conditions of the Creative Commons Attribution (CC BY) license (https://creativecommons.org/licenses/by/4.0/).
Share and Cite
Fornari Laurindo, L.; Minniti, G.; José Tofano, R.; Quesada, K.; Federighi Baisi Chagas, E.; Maria Barbalho, S. Detection of Metabolic Syndrome Using Insulin Resistance Indexes: A Cross-Sectional Observational Cohort Study. Endocrines 2023, 4, 257-268. https://doi.org/10.3390/endocrines4020021
Fornari Laurindo L, Minniti G, José Tofano R, Quesada K, Federighi Baisi Chagas E, Maria Barbalho S. Detection of Metabolic Syndrome Using Insulin Resistance Indexes: A Cross-Sectional Observational Cohort Study. Endocrines. 2023; 4(2):257-268. https://doi.org/10.3390/endocrines4020021
Chicago/Turabian StyleFornari Laurindo, Lucas, Giulia Minniti, Ricardo José Tofano, Karina Quesada, Eduardo Federighi Baisi Chagas, and Sandra Maria Barbalho. 2023. "Detection of Metabolic Syndrome Using Insulin Resistance Indexes: A Cross-Sectional Observational Cohort Study" Endocrines 4, no. 2: 257-268. https://doi.org/10.3390/endocrines4020021