Article

On the Characterization of Viscoelastic Parameters of Polymeric Pipes for Transient Flow Analysis

by
Giuseppe Pezzinga
Department of Civil Engineering and Architecture, University of Catania, Via Santa Sofia 64, 95123 Catania, Italy
Modelling 2023, 4(2), 283-295; https://doi.org/10.3390/modelling4020016
Submission received: 13 March 2023 / Revised: 30 May 2023 / Accepted: 15 June 2023 / Published: 20 June 2023

Abstract

:
The behaviour of polymeric pipes in transient flows has been proved to be viscoelastic. Generalized Kelvin–Voigt (GKV) models perform very well when simulating the experimental pressure. However, in the literature, no general indications on the evaluation of the model parameters are given. In the present study, the calibration of GKV model parameters is carried out using a micro-genetic algorithm for experimental tests of transient flows in polymeric pipes taken from the literature. The results confirm that the higher the number of Kelvin–Voigt elements, the better the reproduction of experimental tests, but it is difficult to search for general rules for parameter characterization. Assuming a Kelvin–Voigt (KV) model with a single element, it is shown that the retardation time is related to the oscillation period that can be obtained from the elastic modulus and from easily evaluable pipe characteristics. A simple procedure is then proposed for the characterization of the viscoelastic parameters that can be used by manufacturers and technicians. Considering the limits of such a model, the procedure has to be considered as a first step for the characterization of the viscoelastic parameters of more complex models.

1. Introduction

The behaviour of polymeric pipes in transient flows has been proved to be viscoelastic [1,2,3,4,5]. For such a material, an instantaneous elastic strain is followed by a gradual, retarded one. In the literature, several contributions refer to transients, both in entirely polymeric pipelines [6,7,8,9,10] and in pipe systems in which only a small additional polymeric pipe is inserted to protect the main pipe [11,12,13,14,15]. The relative weight of unsteady friction and viscoelasticity was also examined [16,17]. The behaviour of a viscoelastic material has been represented by different models; usually, a combination of linear elastic elements (spring) and linear viscous elements (dashpot) is considered. In a Maxwell element, the spring and dashpot are in series. In a Kelvin–Voigt (KV) element, the spring and dashpot are in parallel. To overcome the limits of both Maxwell and KV models, models with fractional derivatives were also proposed, in which an element-defined springpot is introduced [18]. Usually, the generalized Kelvin–Voigt (GKV) model is used to simulate the behaviour of polymeric pipes in transient flows. The GKV model is made of a spring representing the instantaneous strain and one or more KV elements. This model reproduces very well the experimental tests of transient flow in polymeric pipe [7,10], provided that a proper calibration of the model parameters is carried out.
The calibration of the parameters can be carried out by means of theoretical considerations [1], by trial-and-error procedures [11,12], or using optimization algorithms [7,14,18,19,20,21,22,23] in the ambit of an inverse transient analysis (ITA). Weinerowska-Bords [24] discussed problems connected with the number of parameters, methods of estimation, potential non-uniqueness of the solution, and accuracy of the obtained results. Covas et al. [7] examined the dependence of the numerical results on the number of KV elements, finding that a number of KV elements greater than five does not further improve the comparison between numerical and experimental results. They propose to arbitrarily set the relaxation time of each dashpot equal to values of different orders of magnitude and to calibrate the related modulus of elasticity. Pezzinga et al. [10] calibrated both the modulus of elasticity and relaxation time of each element, limiting the number of KV elements to three. Pezzinga [14], for the transient in an installation with polymeric additional pipe, found that it is difficult to generalize the calibrated parameters, even for a GKV model with one element only (three parameters). Yet, by assuming a single-element KV model (i.e., removing the purely elastic element representing the instantaneous strain), the relaxation time of such an element is significantly related to the oscillation period. This result was confirmed for a fully polymeric pipe [10]. Given that the oscillation period can be related to the elastic modulus, in the installations with both a fully polymeric pipe and a polymeric additional pipe, the correlation between relaxation time and oscillation period provides a potential general method for the characterization of viscoelastic parameters; however, the model with a single spring–dashpot element can give rise to errors greater than those obtained by a high number of KV elements.
This paper presents the results of the calibration of the viscoelastic parameters to reproduce the results of unsteady flow experimental tests taken from the literature [1]. A micro-genetic algorithm [25,26] is used for this purpose, as previously made for similar calibrations [10,14]. The experimental tests of Güney [1] are taken into account, obtained for a gravity low-density polyethylene (LDPE) pipeline, carried out for five different water temperatures and for transients both with and without cavitation. These tests were recently used to examine the role of unsteady friction in the tests without cavitation [27] and to examine the performance of different cavitation models for the tests with cavitation [28,29,30]. Here, only the tests without cavitation are considered. The water temperature influences the mechanical parameters, changing the oscillation period, then giving the opportunity to extend the analysis on the dependence of the relaxation time on the oscillation period. An implementation of the method of characteristics, called MOC-Z, is used, as already proposed for transient cavitating pipe flow [31,32]. The mechanical parameters are estimated using a quasi-two-dimensional (quasi-2D) model [31] to take into account unsteady friction. Although unsteady friction has a minor effect on the energy dissipation for the examined problem, the calibrated parameters are influenced by it [10,14]. A quasi-steady 1D model is used to address the search for the optimal micro-GA parameters requiring a reasonable computation time.

2. Mathematical Models

2.1. Continuity Equation

Under the hypothesis of low Mach numbers, the quasi-2D form of the continuity equation for a pipe can be written as
p t + ρ a w 2 u x + 2 ρ a w 2 ε t = 0
where p is the internal pressure, t is the time, ρ is the fluid density, a w is the wave speed of pure water, u is the velocity component in the longitudinal direction, x is the longitudinal coordinate along pipe axis, and ε is the total circumferential strain of the pipe. Equation (1) is a quasi-2D form because u is assumed to depend on x , r , t , being r the radial coordinate, whereas the internal pressure is assumed to depend on x , t [31]. By using a different stress–strain model, different forms of Equation (1) can be obtained. If an elastic (E) model is assumed
ε = σ E
where σ is the circumferential normal stress, and E the Young’s modulus of elasticity of the pipe; the continuity equation can be written as
p t + ρ a 2 u x = 0
where a is the wave speed.
For polymeric pipes, the E model gives poor results. The behaviour can be better simulated by a KV model. A KV element consists of a spring combined in parallel to a dashpot; as a consequence, the total strain ε has to be evaluated using the equation:
ε t = 1 η σ E ε
being η the viscosity.
More often, a GKV model is assumed, in which the material behaviour is represented by a simple spring and a series of KV elements [2,5]. The spring accounts for the instantaneous strain component ε i , whereas the series of KV elements simulates the retarded strain component ε r . The total strain is then given by the sum of the instantaneous strain component and the retarded one:
ε = ε i + ε r
The instantaneous strain component is expressed as
ε i = σ E 0
where E 0 is the instantaneous Young’s modulus of elasticity of the pipe. Using a GKV model with n elements, the retarded strain component is the sum of the single k -th element deformations
ε r = k = 1 n ε k
each of them given by the differential equation:
ε k t = 1 η k σ E k ε k
being η k and E k the viscosity and the modulus of elasticity of the k -th element, respectively. Under usual hypotheses, for a pipe with circular cross-section, such a relationship can be rewritten as:
ε k t = 1 θ k D λ 2 s E k p ε k
where θ k = η k / E k is the retardation time of the k -th element, D is the pipe diameter, s is the pipe thickness, and λ is a parameter depending on the pipe constraint conditions.
Then, the quasi-2D continuity equation for the GKV model can be written as
p t + ρ a i 2 u x + 2 ρ a i 2 k = 1 n ε k t = 0
In Equation (10), a i is computed by using E i . Here, three GKV models are considered, labelled as GKV1, GKV2, and GKV3, respectively with 1, 2, and 3 Kelvin–Voigt elements. The auxiliary variable φ is introduced and defined as:
φ = p ρ g + 2 a w g ε
where g is the gravitational acceleration. The continuity equation can be written in the form:
φ t + a w 2 g u x = 0
If a 1D model is adopted, by replacing the velocity component u in the longitudinal direction with the mean velocity V , Equation (12) becomes
φ t + a w 2 g V x = 0

2.2. Momentum Equations

In the quasi-2D model, for a pipe with circular cross-section and axisymmetric flow, the momentum equation expressed in cylindrical coordinates can be written as [33]:
u t + g H x + 1 ρ r r τ r = 0
where r = distance from the axis, and τ = shear stress. For details on the adopted turbulence model, the reader can refer to Pezzinga [33] and Santoro et al. [34].
In the 1D model, the momentum equation is:
V t + g H x + 2 τ 0 ρ r 0 = 0
where τ 0 = wall shear stress. Assuming a quasi-steady friction, the Darcy–Weisbach friction factor is computed using the Poiseuille formula for Reynolds number values less than 2000, by the Colebrook–White formula for Reynolds number values greater than 4000, and by an expression connecting the previous ranges, representing the laminar–turbulent transition [34].
The use of both 1D and 2D approaches is explained as follows: the 1D steady friction model is used to calibrate the parameters of the genetic algorithm and to indicate the space of Kelvin–Voigt parameters with a small computational effort, whereas the quasi-2D model is used to properly take into account unsteady friction.

2.3. Method of Characteristics (MOC)

The method of characteristics applied, respectively, to Equations (12) and (14) for quasi-2D model, and to Equations (13) and (15) for 1D model, leads to [31]:
d φ d t ± a g d u d t ± a H φ x ± a ρ g r r τ r = 0
d φ d t ± a g d V d t ± a H φ x ± 2 a τ 0 ρ g r 0 = 0
These equations are valid on the characteristic lines
d x d t = ± a
and can be resolved by discretizing the pipe and computing the variables in time at a number of sections, being the spatial step Δx and the temporal step Δ t = Δ x / a .

2.4. Numerical Scheme

The adopted numerical scheme is defined as Z-mirror scheme, due to the shape of the characteristic line coupled with the lines along which the H φ / x derivative is calculated (Figure 1). When the equation along the positive characteristic line is solved, all terms are computed on the segment AP, apart from the term containing the derivative of H φ with respect to x , which is computed on the segment AM in the predictor step ( p + ) and on the segment EP in the corrector step ( c + ), respectively. When the equation along the negative characteristic line is solved, all terms are computed on the segment BP, apart from the term containing the derivative of H φ with respect to x , which is computed on the segment MB in the predictor step ( p ) and on the segment PF ( c ) in the corrector step, respectively. Segments EP, AP, and AM form a “Z”, while segments PF, BP, and MB form a “Z” as reflected in a mirror. For these reasons, the scheme is defined as Z-mirror scheme, and the associated model is called MOC-Z.
In the predictor step, Equation (16) is solved as
φ i p φ i 1 n 1 Δ t + a g u i , j p u i 1 , j n 1 Δ t + a H i n 1 φ i n 1 H i 1 n 1 + φ i 1 n 1 Δ x + 2 π a ρ g r j + 1 τ j + 1 p + r j τ j p + Δ A = 0
φ i p φ i + 1 n 1 Δ t a g u i , j p u i + 1 , j n 1 Δ t a H i + 1 n 1 φ i + 1 n 1 H i n 1 + φ i n 1 Δ x 2 π a ρ g r j + 1 τ j + 1 p r j τ j p Δ A = 0
where indices i , j , and n refer, respectively, to directions x , r , and time t . The size of the mesh in radial direction is assumed to be of constant area Δ A .
In the corrector, step the corresponding set of equations is
φ i c φ i 1 n 1 Δ t + a g u i , j c u i 1 , j n 1 Δ t + a H i p φ i p H i 1 p + φ i 1 p Δ x + 2 π a ρ g r j + 1 τ j + 1 c + r j τ j c + Δ A = 0
φ i c φ i + 1 n 1 Δ t a g u i , j c u i + 1 , j n 1 Δ t a H i + 1 p φ i + 1 p H i p + φ i p Δ x 2 π a ρ g r j + 1 τ j + 1 c r j τ j c Δ A = 0
In both steps, for the evaluation of the shear stress, an implicit scheme is adopted [31]. At each step, velocity components u in quasi-2D models can be obtained by subtracting the negative characteristic equation from the positive one, with no need to know the “new” piezometric head nor the “new” auxiliary variable φ , as they cancel out. Then, the variable φ is computed by adding Equations (19) and (20) (predictor step) or Equations (21) and (22) (corrector step). An analogous scheme is adopted for the 1D form of the equations.

2.5. Micro-Genetic Algorithm

The calibration of the material parameters is carried out by a micro-genetic algorithm, already used for the calibration of model parameters in transient cavitating flow and described by Pezzinga and Santoro [32]. The number of parameters to be calibrated is 1 for the E model ( E ), 2 for the KV model ( E and θ ), 3 for the GKV1 model ( E i , E 1 , and θ 1 ), 5 for the GKV2 model ( E i , E 1 , θ 1 , E 2 , and θ 2 ), and 7 for the GKV3 model ( E i , E 1 , θ 1 , E 2 , θ 2 , E 3 , and θ 3 ).
A sensitivity analysis on the population size is performed with the 1D MOC-Z models, for KV, GKV1, GKV2, and GKV3 models, with population N P ranging between 5 and 10; for each value of N P , the number of generation N G is chosen so as to obtain a number of evaluations N V as the minimum value ≥ 1000; the fitness is evaluated through the following mean absolute error (MAE) function
M A E = i = 1 N H c i H m i N
where H c i and H m i are the computed and measured head, respectively, and N is the number of experimental values. A twelve-bit binary coding for all the parameters is used (giving 212 = 4096 possible values), apart from the instantaneous modulus of elasticity, for which a ten-bit binary coding is used (giving 210 = 1024 possible values).

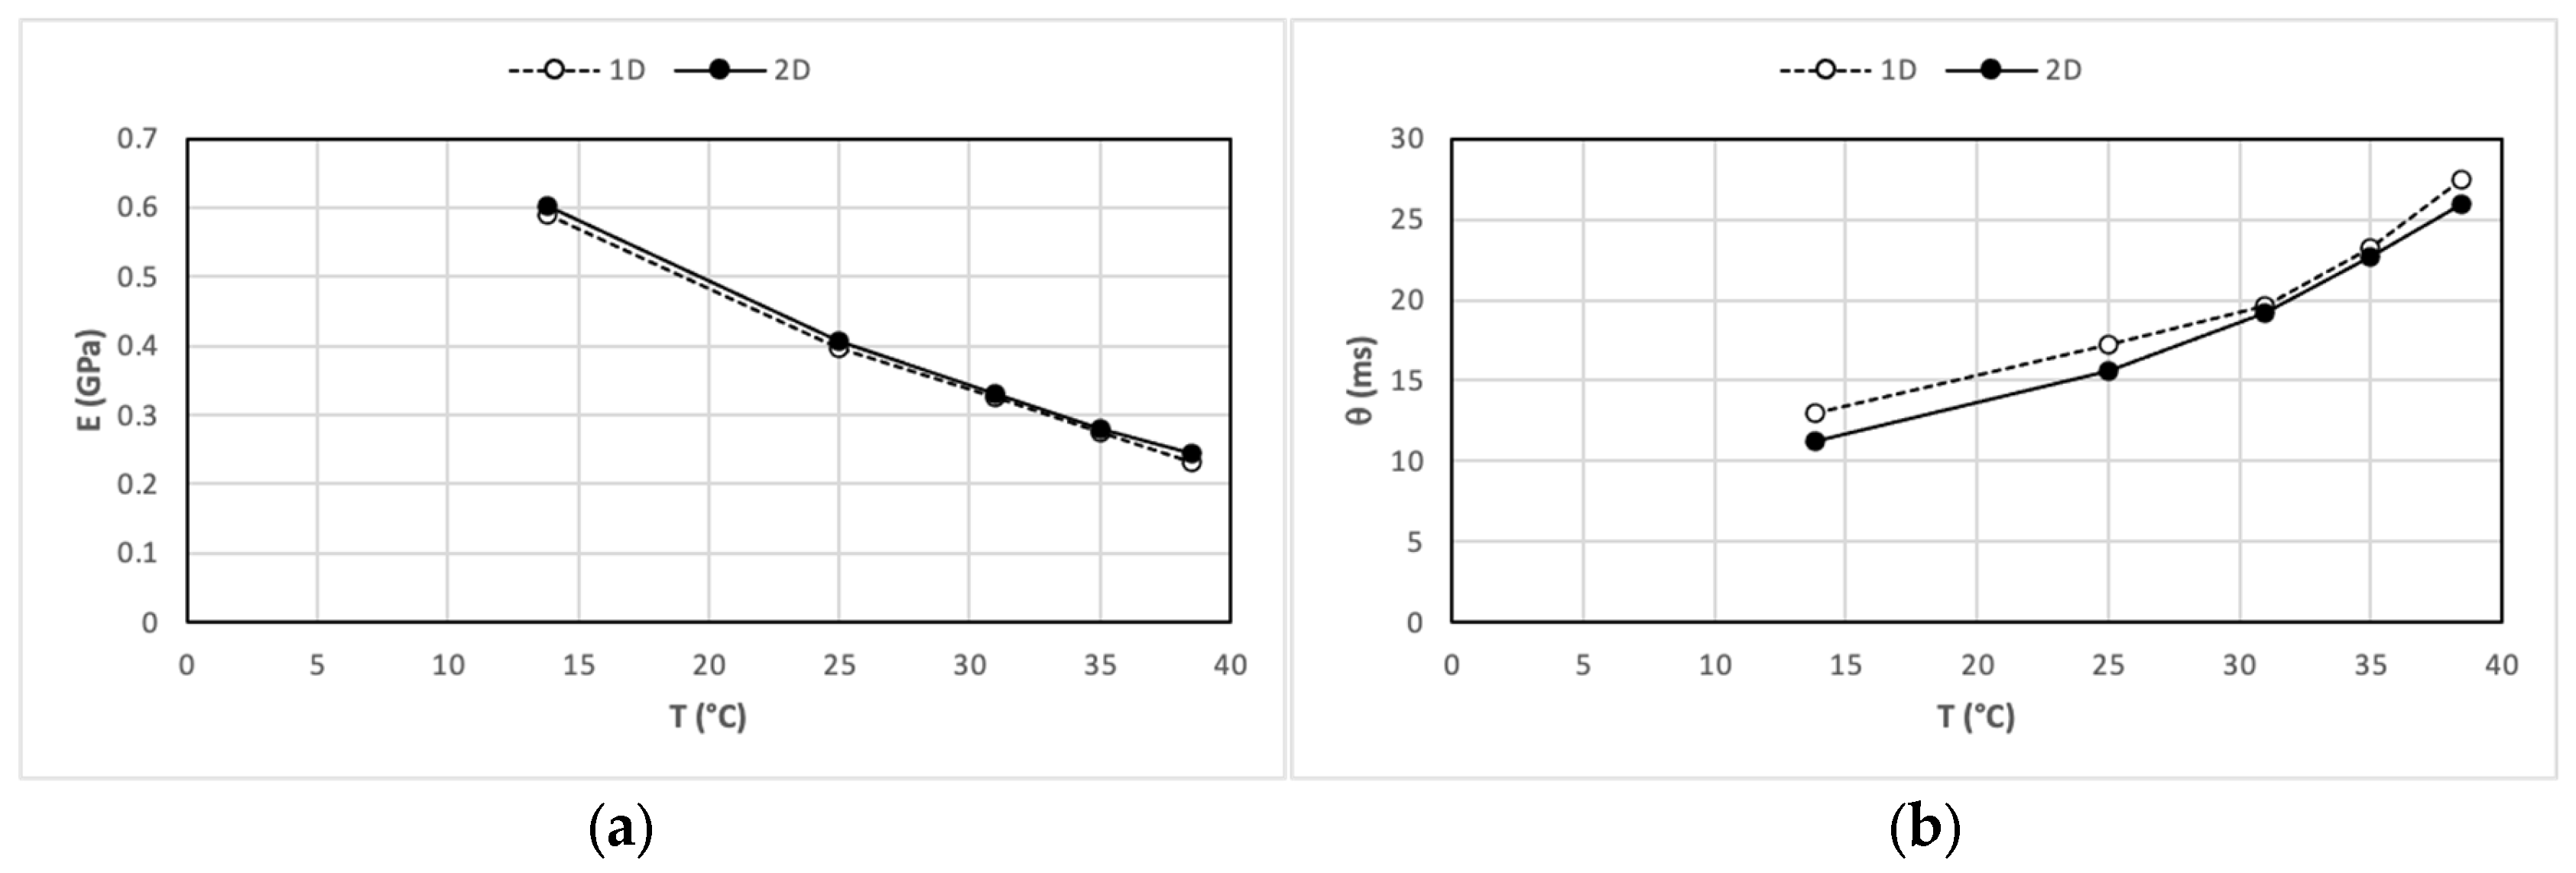
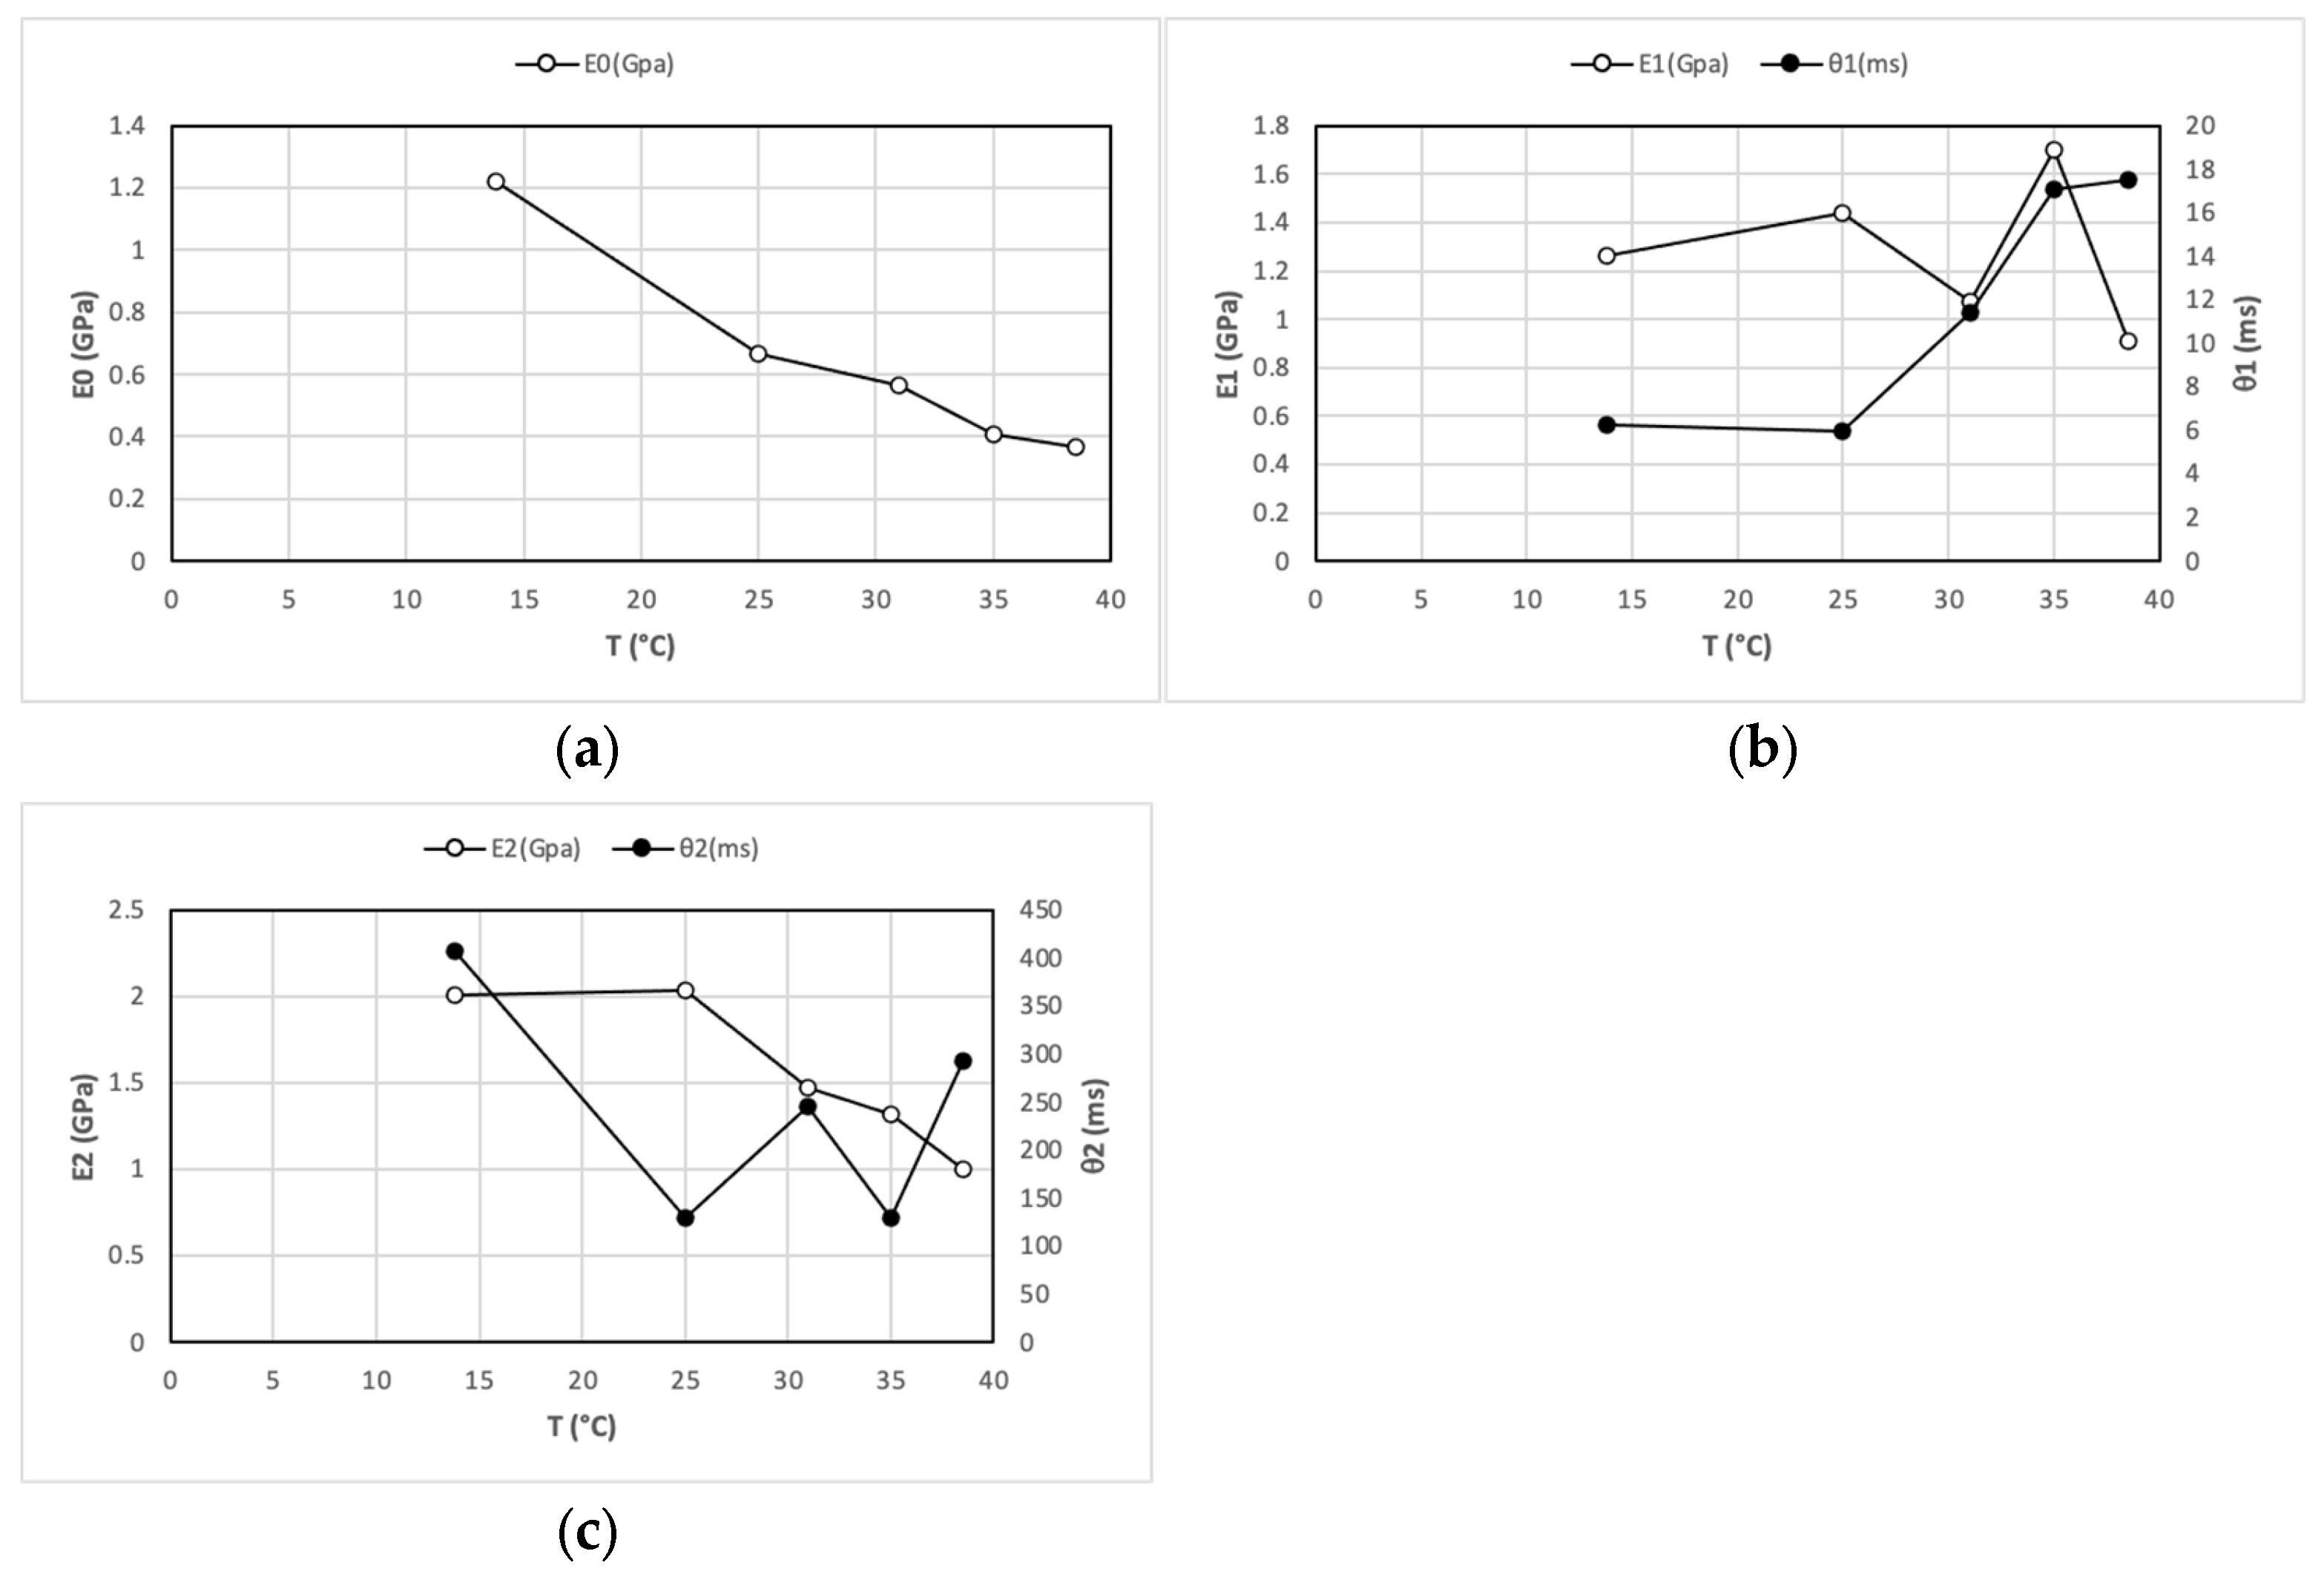
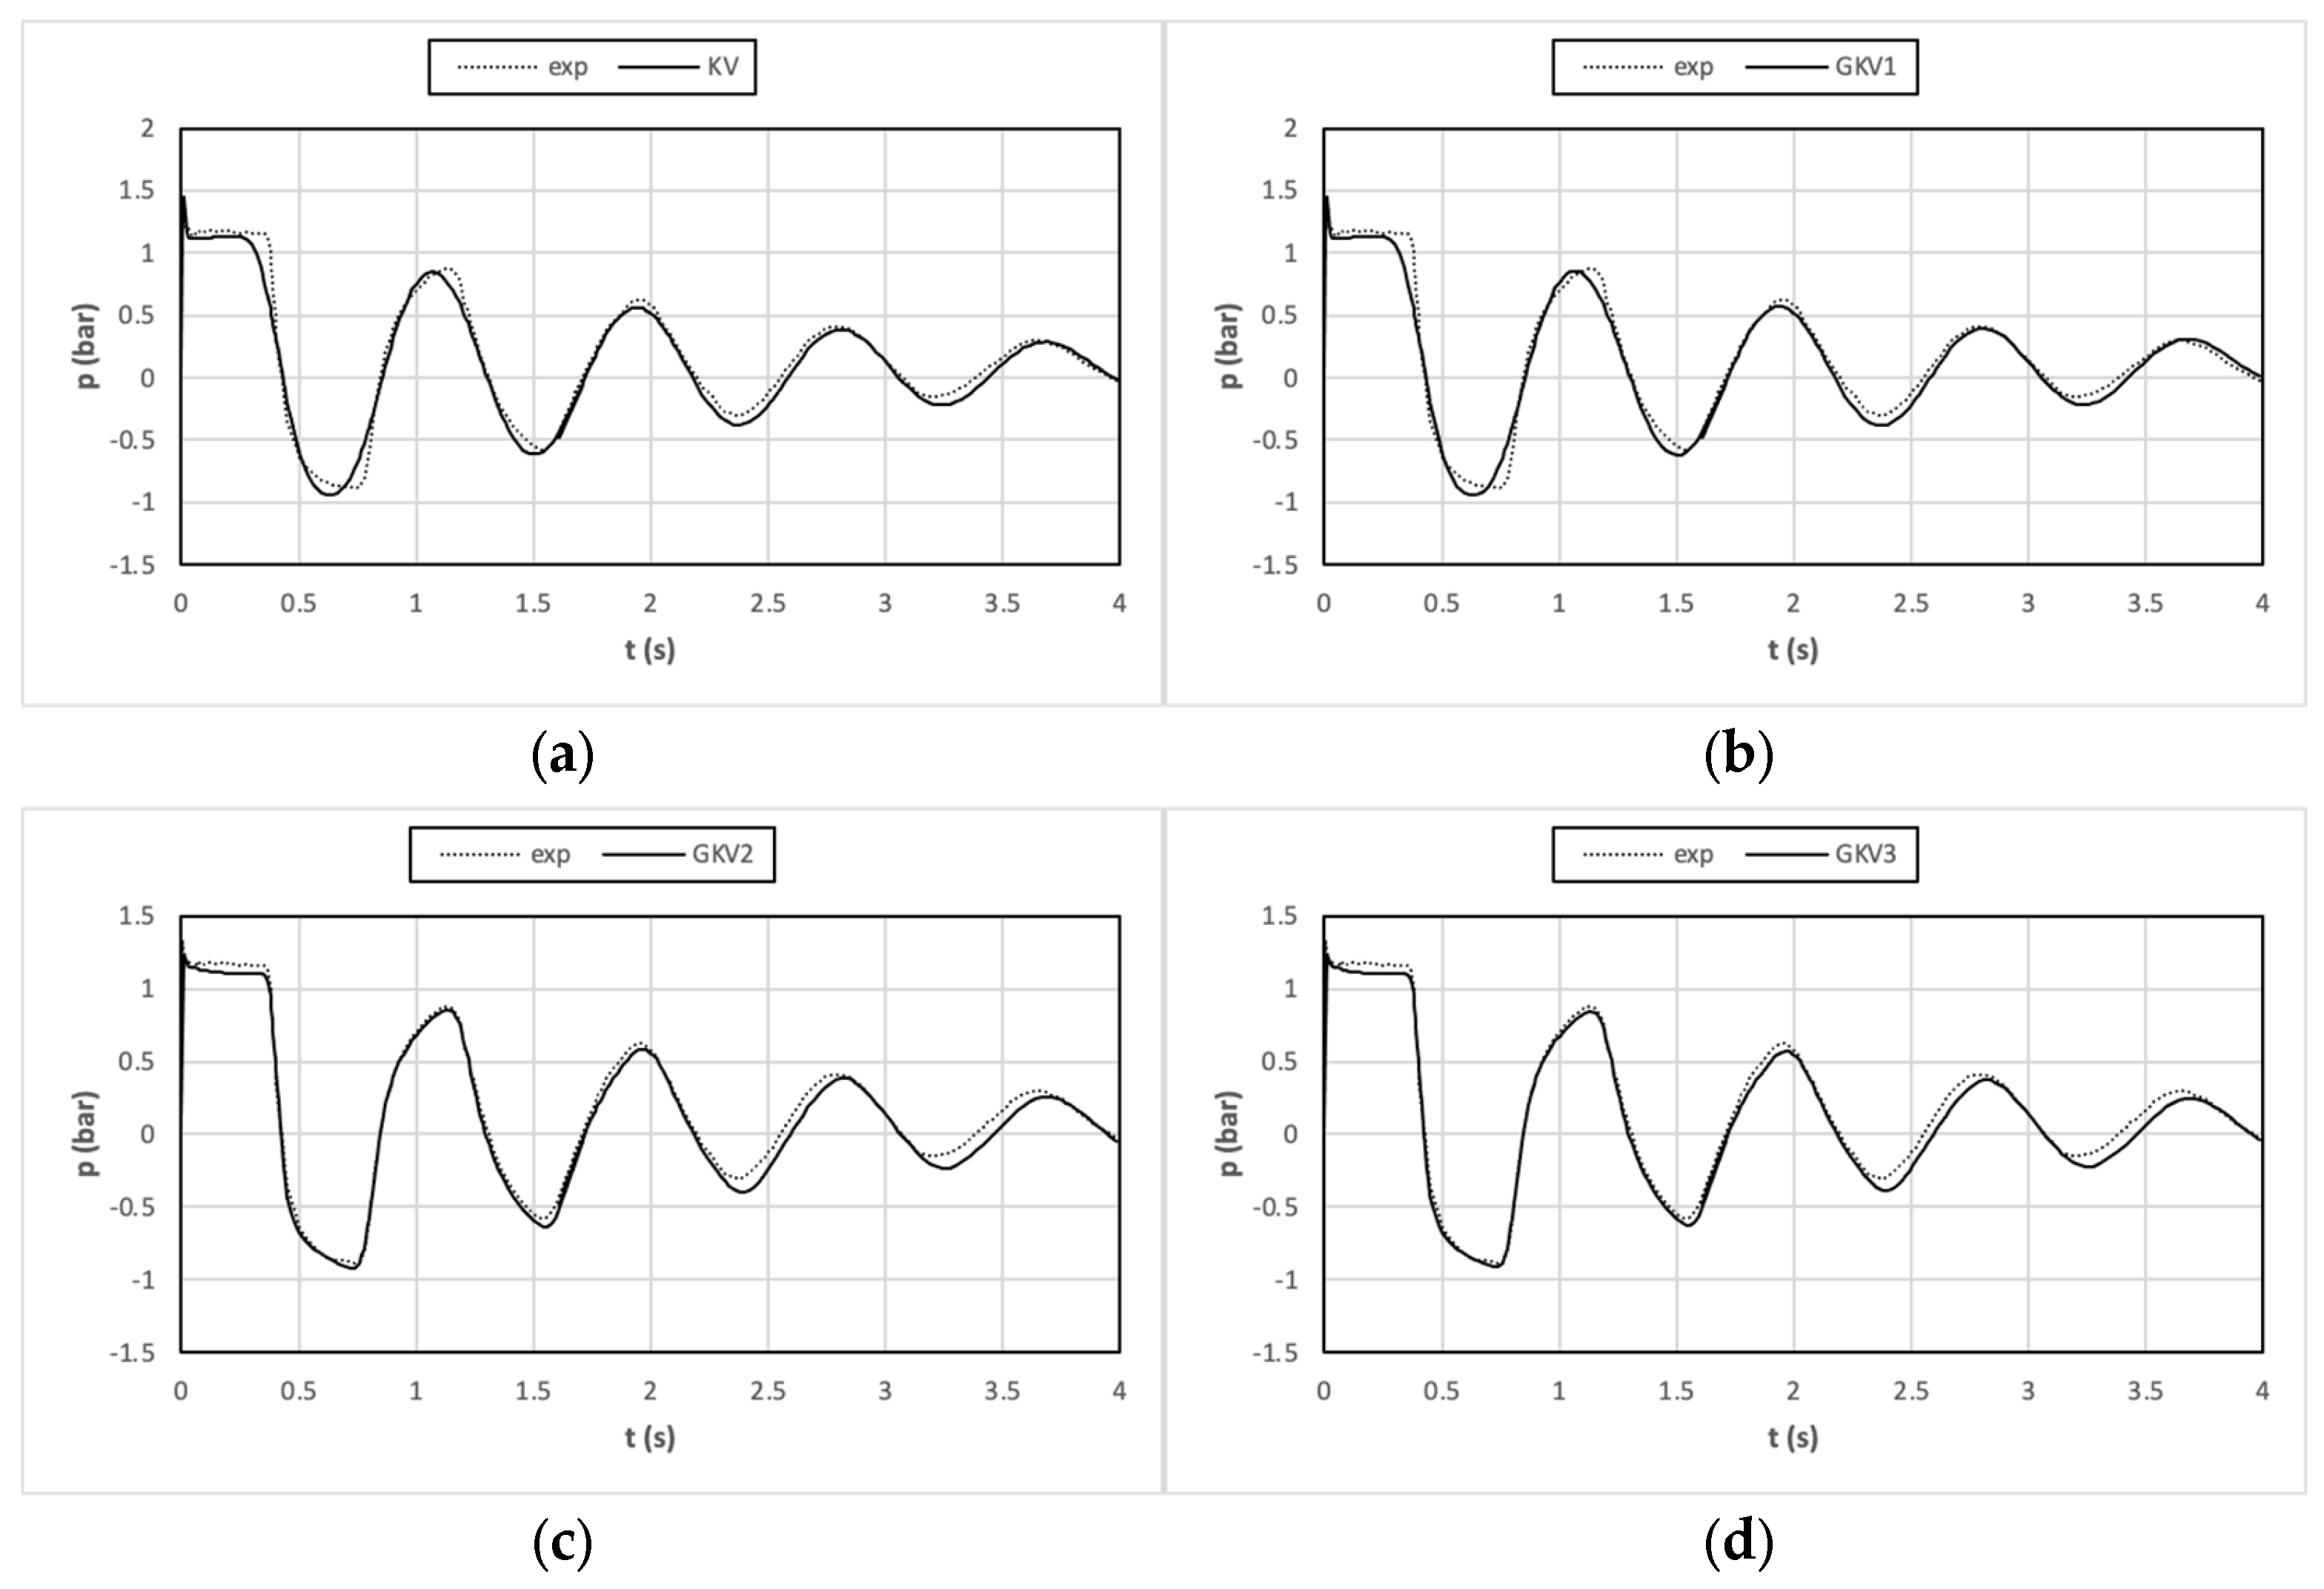
3. Analysis of Results

The experimental data from Güney [1] are taken into account. The experimental installation is composed of a horizontal gravity pipeline made of LDPE, with a constant pressure reservoir at the upstream end and a piston valve at the downstream end. The pipe length is L = 43.1 m, the inner diameter D = 0.0416 m, and the wall thickness s = 0.0042 m. Güney performed 11 experiments, for five different water temperatures. For each temperature, two experiments were carried out, i.e., with and without cavitation. Experiments without cavitation were denoted with an odd number, and those with cavitation with an even number. In Test 11, the same conditions as Test 9 were considered. Only the tests without cavitation were taken into account from 1 to 9, for which the temperature, the initial velocity, and the upstream reservoir head are reported in Table 1.
Güney provided a semi-analytical method for the calibration of the viscoelastic parameters, finding their values for a GKV model with three elements (seven parameters), but the Kelvin–Voigt parameters were calibrated via micro-GA in order to compare Kelvin–Voigt models of different complexity. In the examined cases, for simplicity, the constraint parameter λ was assumed equal to 1.
Due to much higher computational time needed for quasi-2D models, the practical rule is used to orient the search of the parameters of the micro-GA via a sensitivity analysis carried out using 1D models and to use these parameters for quasi-2D models. Based on previous sensitivity analysis on the influence of the computational grid on the results [10], the calculations are carried out with a number of longitudinal steps N x = 100 and of radial steps N r = 50, obtaining a good compromise between accuracy of the results and calculation time.
In order to detect the best N P for parameters’ calibration, a proper parameter Δ MAE is computed in the following way: for each test, MAE values are computed for all values of N P , the lowest (best) MAE is identified and differences between each MAE, and the best MAE are computed; then, for each value of N P , absolute values of such differences for all tests are summed up. All the latter summations (as many as the number of N P values) are finally added obtaining Δ MAE. The results are presented in Figure 2a, where the obtained Δ MAE is reported as a function of the population size N P , respectively, for the 1D KV, GKV1, GKV2, and GKV3 models. In Figure 2b, the number of evaluations N E needed for reaching the best solution is reported. On the basis of such results, the quasi-2D models parameters are calibrated with N P = 5.
The modulus of elasticity and retardation time of the KV model calibrated using 1D and quasi-2D models are compared, respectively, in Figure 3a,b as a function of temperature. It can be noted that the flow model significantly influences only the calibrated values of the retardation time due to the different evaluations of friction. Using the quasi-steady 1D model, part of the dissipation due to friction is incorrectly attributed to viscoelasticity.
The increase in temperature induces an increase in deformability and then a decrease in the modulus of elasticity, with a reduction in maximum and minimum oscillations and an increase in the oscillation period [1].
The parameters calibrated in the quasi-2D flow model for the GKV1, GKV2, and GKV3 models are reported, respectively, in Figure 4, Figure 5 and Figure 6 as a function of temperature. In each figure, the first graph (a) shows the instantaneous modulus of elasticity, while the subsequent ones show the modulus of elasticity and the retardation time (on an auxiliary axis) of each element. It can be noted from Figure 4 that in the examined cases, the values of the modulus of elasticity and of the retardation time of the GKV1 model are practically the same as those of the KV model, and the instantaneous deformation seems unimportant. The instantaneous modulus of elasticity varies in an irregular way.
The variation in the instantaneous modulus of elasticity becomes more regular for GKV2 and GKV3 models, as can be seen, respectively, in Figure 5a and Figure 6a; in addition, the analysis of the other calibrated parameters for GKV2 and GKV3 models, respectively, reported in Figure 5 and Figure 6 shows that the viscoelastic parameters vary generally in an irregular way.
The pressure versus time history obtained via the KV, GKV1, GKV2, and GKV3 models is compared with the experimental data for Test 3 in Figure 7. The analysis of the performance of the models shows that, quite obviously, the models perform better for greater numbers of parameters. In particular, the GKV2 and GKV3 models better reproduce the pressure–time history in the first period (about 1.3 s). But, in the examined cases, the GKV1 model’s results are not different than those of the KV model. Analogous comparisons are obtained for the other tests.
This is the reason that researchers propose the use of GKV models with a high number of KV elements. Nevertheless, if one considers the improvement introduced by the consideration of the viscoelastic behaviour with respect to the elastic model, the different viscoelastic models show similar performances. A synthetic comparison between the performance of the different viscoelastic models and of the elastic model is presented in Figure 8, where the values of MAE are reported for all the models and for all the experimental tests taken into account.

4. Procedure for the Characterization of the Viscoelastic Parameters

Despite the fact that a greater number of viscoelastic parameters obviously improves the performance of the model in reproducing the experimental results, the analysis of results shows that the viscoelastic parameters vary generally in an irregular way, apart from for the KV model. This result confirms previous analysis carried out for additional polymeric pipe [14] and entirely polymeric pipe [10], where the retardation time was related to the oscillation period. A simple investigation of the relationship between the retardation time and the oscillation period is made by considering the data analysed here. The results are summarized in Figure 9, where the calibrated values of the retardation time for the KV model are reported as a function of the oscillation period, together with a power law regression function with an exponent very close to 2. Previous analyses [10,14] were limited to linear regressions, but power law regressions are more general and they can give better results, including linear regression as a particular case. A possible direct dependence of the retardation time from the temperature, other than the indirect one due to dependence of the retardation time on the period and of the period on the temperature, is considered here, in order to explain the obtained approximately quadratic function, different from the approximately linear ones previously obtained, but the available data do not allow us to confirm such a hypothesis.
The results obtained here, together with the previously obtained results, allow one to define a relatively simple procedure for the characterization of the viscoelastic parameters of the KV model. The modulus of elasticity can be evaluated from the oscillation period T P . The dimensionless oscillation period is introduced and defined as
t P = T P a L
this is trivially t P = 4 for the whole polymeric pipeline. Then, the equivalent wave speed can be obtained and, in turn, the equivalent modulus of elasticity.
For additional polymeric pipe, the dimensionless oscillation period can be obtained by the relation [12]
2 π t P tan 2 π t P = k
with
k = A L a d 2 W d a 2
being A the cross-sectional area of the main pipe, L its length, a its wave speed, W d the volume of the additional polymeric pipe, and a d its equivalent wave speed. The wave speed of the main pipe a can be obtained both by theory and by experimental data if the additional pipe is excluded.
Experimental tests can be carried out to evaluate the oscillation period and, from it, the equivalent wave speed and the equivalent modulus of elasticity. Furthermore, the calibrated retardation time can be related to the oscillation period with a power law regression. The parameters of the power law, together with the equivalent modulus of elasticity, completely characterize the material behaviour as far as a KV model is concerned. Please notice that a 1D unsteady friction model [35] can be used, reducing the calculation time, in place of a quasi-2D model.
A manufacturer of polymeric pipes should, thus, provide not only the equivalent modulus of elasticity but also the parameters of the power law relating retardation time to oscillation period. A professional could use this information for the viscoelastic model of a polymeric pipe, detailing the retardation time for the specific installation, evaluating the oscillation period using Equation (24) for entirely polymeric pipe or Equation (25) for polymeric additional pipe, respectively.

5. Conclusions

The characterization of the viscoelastic parameters of polymeric pipes is made by calibration with micro-GA. The reproduction of experimental data taken from the literature is used to compare a KV model and three GKV models with 1, 2, or 3 KV elements, respectively. It is confirmed that the greater the number of KV elements is, the better the agreement with experimental data. Yet, when it comes to an improvement in the material behaviour representation with respect to an elastic model, all the considered viscoelastic models present very close results; furthermore, the greater the number of KV elements, the more irregular the variation in the calibrated parameters with temperature. However, for the KV model, it has only one KV element without the elastic element representing the instantaneous deformation, the elastic modulus and the retardation time, depending on temperature fairly regularly. Furthermore, the relation between retardation time and oscillation period, previously put into evidence for both entirely polymeric pipe and additional polymeric pipe, is confirmed. A power law regression function is used with very good agreement to express the relationship between retardation time and oscillation period.
On the basis of the obtained results, a relatively simple procedure is proposed for the characterization of the viscoelastic parameters for a KV model. This procedure should be used by the polymeric pipe manufacturer to provide the elastic modulus and the parameters of the power law regression between retardation time and oscillation period. The professional could use these data for the viscoelastic model of a particular pipe, detailing the data needed to obtain the oscillation period.
On the other hand, the dependence of the elastic modulus on temperature should also be taken into account, as shown by the Güney [1] data considered here and its long-term evolution [14]. At this stage, no conclusion can be made on the possible long-term modification of the relationship between retardation time and oscillation period [14].
The problem of finding relationships between the retardation time and the oscillation period for more complex models is open. The proposed procedure can be considered as a first step to this end.

Funding

This research received no external funding.

Data Availability Statement

The numerical results generated during the study are available from the author upon request.

Acknowledgments

The author thanks Kamil Urbanowicz for providing the Güney experimental data in digital format.

Conflicts of Interest

The authors declare no conflict of interest.

References

  1. Güney, M. Contribution à l’Étude du Phénomène de Coup de Bélier en Conduite Viscoélastique. Ph.D. Thesis, Université Claude Bernard—Lyon I, Villeurbanne, France, 1977. (In French). [Google Scholar]
  2. Ferry, J.D. Viscoelastic Properties of Polymers; John Wiley and Sons: Chichester, UK, 1980. [Google Scholar]
  3. Gally, M.; Güney, M.; Rieutord, E. An investigation of pressure transients in viscoelastic pipes. J. Fluids Eng. 1979, 101, 495–499. [Google Scholar] [CrossRef]
  4. Rieutord, E.; Blanchard, A. Écoulement non permanent en conduite viscoelastique—Coup de bélier. J. Hydraul. Res. 1979, 17, 217–229. (In French) [Google Scholar] [CrossRef]
  5. Franke, P.G.; Seyler, F. Computation of unsteady pipe flow with respect to visco-elastic material properties. J. Hydraul. Res. 1983, 21, 345–353. [Google Scholar] [CrossRef]
  6. Covas, D.; Stoianov, I.; Mano, J.F.; Ramos, H.; Graham, N.; Maksimovic, C. The dynamic effect of pipe-wall viscoelasticity in hydraulic transients. Part I: Experimental analysis and creep haracterization. J. Hydraul. Res. 2004, 42, 516–530. [Google Scholar] [CrossRef]
  7. Covas, D.; Stoianov, I.; Mano, J.F.; Ramos, H.; Graham, N.; Maksimovic, C. The dynamic effect of pipe-wall viscoelasticity in hydraulic transients. Part II—Model development, calibration and verification. J. Hydraul. Res. 2005, 43, 56–70. [Google Scholar] [CrossRef]
  8. Meniconi, S.; Brunone, B.; Ferrante, M.; Massari, C. Transient hydrodynamics of in-line valves in viscoelastic pressurised pipes. Long period analysis. Exp. Fluids 2012, 53, 265–275. [Google Scholar] [CrossRef]
  9. Meniconi, S.; Brunone, B.; Ferrante, M. Water hammer pressure waves at cross-section changes in series in viscoelastic pipes. J. Fluids Struct. 2012, 33, 44–58. [Google Scholar] [CrossRef]
  10. Pezzinga, G.; Brunone, B.; Meniconi, S. Relevance of pipe period on Kelvin-Voigt viscoelastic parameters: 1D and 2D inverse transient analysis. J. Hydraul. Eng. 2016, 142, 04016063. [Google Scholar] [CrossRef]
  11. Ghilardi, P.; Paoletti, A. Additional viscoelastic pipes as pressure surges suppressors. In Proceedings of the 5th International Conference on Pressure Surges, Hannover, Germany, 22–24 September 1986; BHRA: Cranfield, UK, 1986; pp. 113–121. [Google Scholar]
  12. Pezzinga, G.; Scandura, P. Unsteady Flow in Installation with Polymeric Additional Pipe. J. Hydraul. Eng. 1995, 121, 802–811. [Google Scholar] [CrossRef]
  13. Pezzinga, G. Unsteady Flow in Hydraulic Networks with Polymeric Additional Pipe. J. Hydraul. Eng. 2002, 128, 238–244. [Google Scholar] [CrossRef]
  14. Pezzinga, G. Evaluation of time evolution of mechanical parameters of polymeric pipes by unsteady flow runs. J. Hydraul. Eng. 2014, 140, 04014057. [Google Scholar] [CrossRef]
  15. Triki, A. Water-hammer control in pressurized-pipe flow using a branched polymeric penstock. J. Pipeline Syst. Eng. Pract. 2017, 8, 04017024. [Google Scholar] [CrossRef]
  16. Duan, H.F.; Ghidaoui, M.; Lee, P.J.; Tung, Y.K. Unsteady friction and visco-elasticity in pipe fluid transients. J. Hydraul. Res. 2010, 48, 354–362. [Google Scholar] [CrossRef]
  17. Duan, H.F.; Ghidaoui, M.; Lee, P.J.; Tung, Y.K. Energy analysis of viscoelasticity effects in pipe fluid transients. J. Appl. Mech. 2010, 77, 044503. [Google Scholar] [CrossRef]
  18. Ferrante, M.; Capponi, C. Viscoelastic models for the simulation of transients in polymeric pipes. J. Hydraul. Res. 2017, 55, 599–612. [Google Scholar] [CrossRef]
  19. Soares, A.K.; Covas, D.I.; Reis, L.F. Analysis of PVC pipe-wall viscoelasticity during water hammer. J. Hydraul. Eng. 2008, 134, 1389–1394. [Google Scholar] [CrossRef]
  20. Keramat, A.; Haghighi, A. Straightforward transient-based approach for the creep function determination in viscoelastic pipes. J. Hydraul. Eng. 2014, 140, 04014058. [Google Scholar] [CrossRef]
  21. Weinerowska-Bords, K. Alternative approach to convolution term of viscoelasticity in equations of unsteady pipe flow. J. Fluids Eng. 2015, 137, 054501. [Google Scholar] [CrossRef]
  22. Yao, E.; Kember, G.; Hansen, D. Water hammer analysis and parameter estimation in polymer pipes with weak strain-rate feedback. J. Eng. Mech. 2016, 142, 04016052. [Google Scholar] [CrossRef]
  23. Bertaglia, G.; Ioriatti, M.; Valiani, A.; Dumbser, M.; Caleffi, V. Numerical methods for hydraulic transients in visco-elastic pipes. J. Fluids Struct. 2018, 81, 230–254. [Google Scholar] [CrossRef] [Green Version]
  24. Weinerowska-Bords, K. Viscoelastic Model of Waterhammer in Single Pipeline—Problems and Questions. Arch. Hydro-Eng. Environ. Mech. 2006, 53, 331–351. [Google Scholar]
  25. Krishnakumar, K. Micro-Genetic Algorithms for Stationary and Non-Stationary Function Optimization. Proc. SPIE Intell. Control. Adapt. Syst. 1990, 1196, 289–296. [Google Scholar]
  26. Carroll, D.L. Genetic algorithms and optimizing chemical oxygen-iodine lasers. Dev. Theor. Appl. Mech. 1996, 18, 411–424. [Google Scholar]
  27. Sun, Q.; Zhang, Z.; Wu, Y.; Xu, Y.; Liang, H. Numerical analysis of transient pressure damping in viscoelastic pipes at different water temperatures. Materials 2022, 15, 4904. [Google Scholar] [CrossRef]
  28. Hadj-Taïeb, L.; Hadj-Taïeb, E. Numerical simulation of transient flows in viscoelastic pipes with vapour cavitation. Int. J. Modell. Simul. 2009, 29, 206–213. [Google Scholar] [CrossRef]
  29. Urbanowicz, K.; Firkowski, M. Extended Bubble Cavitation Model to predict water hammer in viscoelastic pipelines. J. Phys. Conf. Ser. 2018, 1101, 012046. [Google Scholar] [CrossRef] [Green Version]
  30. Mousavifard, M. Turbulence parameters during transient cavitation flow in viscoelastic pipe. J. Hydraul. Eng. 2022, 148, 04022004. [Google Scholar] [CrossRef]
  31. Pezzinga, G.; Santoro, V.C. Shock-Capturing Characteristics Models for Transient Cavitating Pipe Flow. J. Hydraul. Eng. 2020, 146, 04020075. [Google Scholar] [CrossRef]
  32. Pezzinga, G.; Santoro, V.C. MOC-Z Models for Transient Gaseous Cavitation in Pipe Flow. J. Hydraul. Eng. 2020, 146, 04020076. [Google Scholar] [CrossRef]
  33. Pezzinga, G. Quasi-2D Model for Unsteady Flow in Pipe Networks. J. Hydraul. Eng. 1999, 125, 676–685. [Google Scholar] [CrossRef]
  34. Santoro, V.C.; Crimì, A.; Pezzinga, G. Developments and Limits of Discrete Vapor Cavity Models of Transient Cavitating Pipe Flow: 1D and 2D Flow Numerical Analysis. J. Hydraul. Eng. 2018, 144, 04018047. [Google Scholar] [CrossRef]
  35. Ghidaoui, M.S.; Zhao, M.; McInnis, D.A.; Axworthy, D.H. A review of water hammer theory and practice. Appl. Mech. Rev. 2005, 58, 49–76. [Google Scholar] [CrossRef] [Green Version]
Figure 1. Lines for numerical resolution with the Z-mirror scheme.
Modelling 04 00016 g001
Figure 2. Δ MAE values (a) and number of evaluations N E for reaching the best solution (b) as function of N P for the 1D model.
Modelling 04 00016 g002
Figure 3. Comparison between calibrated parameters for 1D and quasi-2D KV model: (a) modulus of elasticity; (b) retardation time.
Modelling 04 00016 g003
Figure 4. Calibrated parameters for GKV1 model: (a) instantaneous modulus of elasticity; (b) modulus of elasticity and retardation time (on auxiliary axis) of the KV element.
Modelling 04 00016 g004
Figure 5. Calibrated parameters for GKV2 model: (a) instantaneous modulus of elasticity; (b) modulus of elasticity and retardation time (on auxiliary axis) of the 1st KV element; (c) modulus of elasticity and retardation time (on auxiliary axis) of the 2nd KV element.
Modelling 04 00016 g005
Figure 6. Calibrated parameters for GKV3 model: (a) instantaneous modulus of elasticity; (b) modulus of elasticity and retardation time (on auxiliary axis) of the 1st KV element; (c) modulus of elasticity and retardation time (on auxiliary axis) of the 2nd KV element; (d) modulus of elasticity and retardation time (on auxiliary axis) of the 3rd KV element.
Modelling 04 00016 g006aModelling 04 00016 g006b
Figure 7. Comparison between numerical and experimental pressure for Test 3: (a) KV model, (b) GKV1 model, (c) GKV2 model, and (d) GKV3 model.
Modelling 04 00016 g007
Figure 8. Comparison between MAE values for E, KV, GKV1, GKV2, and GKV3 models.
Modelling 04 00016 g008
Figure 9. Retardation time as a function of the oscillation period.
Modelling 04 00016 g009
Table 1. Physical parameters of the Güney [1] experiments without cavitation.
Test T (°C) V 0 (m/s) H s (m)
113.80.490.47
325.00.550.54
531.00.570.55
735.00.550.53
938.50.560.53
Disclaimer/Publisher’s Note: The statements, opinions and data contained in all publications are solely those of the individual author(s) and contributor(s) and not of MDPI and/or the editor(s). MDPI and/or the editor(s) disclaim responsibility for any injury to people or property resulting from any ideas, methods, instructions or products referred to in the content.

