1. Introduction
The transportation sector faces three widely accepted beliefs that shape the need for change. First, the sector’s heavy reliance on fossil fuels is unsustainable due to the depletion of non-renewable resources and the link between carbon dioxide emissions and climate change. Second, transitioning away from fossil fuels is limited by the current state of technology. Third, the existing global infrastructure is ill-prepared to accommodate significant changes in the transportation sector, particularly the shift towards electric passenger vehicles.
Technology forecasting, in conjunction with modelling, can provide insight into the technology sector’s evolution to being more sustainable. The desired end states for various components of the transportation sector are generally understood. For instance, electric vehicles powered by renewable energy sources are expected to dominate the passenger vehicle market. However, achieving this transition necessitates substantial advancements in battery technology and investments in the electricity grid.
This paper introduces a comprehensive model that provides a detailed estimation of the annual carbon footprint for each market within the transportation sector. The primary objective of this model is to equip policymakers and analysts with a valuable tool for understanding the potential implications of different policies, especially those involving investments in new technologies and infrastructure, on sustainability goals. The paper begins by assessing the current state of the transportation sector and proceeds to outline the anticipated sustainable end state for each market. Subsequently, a comprehensive technology roadmap is presented, highlighting the key technologies and infrastructure modifications required to achieve these envisioned end states. The model developed based on this roadmap calculates the annual carbon footprint for each transportation market, offering valuable insights into the technological and infrastructure prerequisites necessary to accomplish the overarching sustainability objective of achieving carbon neutrality by 2070.
2. Materials and Methods
2.1. Background
Given the global importance of climate change, there are a number of studies that seek to model the carbon footprint of the transportation sector. Indeed, many international organizations have set out to develop such models to help drive their policy recommendations. For example, the International Energy Agency (IEA) and Intergovernmental Panel on Climate Change (IPCC) are renowned for their comprehensive reports on energy and climate change, which often include in-depth analysis of transportation-related emissions [
1,
2]. The International Transport Forum (ITF), World Resources Institute (WRI), and International Council on Clean Transportation (ICCT) are additional institutions that have conducted modeling and research on transportation emissions and carbon footprints [
3,
4,
5].
These modeling efforts typically involve analyzing different modes of transportation, including cars, trucks, ships, and aviation, to estimate their carbon emissions throughout their life cycles. They consider factors such as fuel efficiency, technology advancements, and policy measures to assess environmental impacts. Additionally, the Center for Sustainable Systems at the University of Michigan specializes in life cycle assessment research, including the carbon footprints of various transportation modes and technologies [
6]. These modeling efforts contribute valuable insights into the carbon footprint of the transportation sector and help inform policy decisions and sustainability strategies.
These organizations are trusted sources that conduct rigorous research and modeling efforts. However, their primary objective is to communicate the outcomes of their analyses and provide actionable recommendations rather than delving into the technicalities of their models. While they do provide insights into the methodologies used in their research, they do not extensively discuss the details of their underlying models.
This paper sets out to provide a straightforward model for assessing the change in carbon footprint of the transportation sector leveraging the immersion of new technologies. The goal of such a model is to support technology roadmapping efforts and provide researchers and policymakers with a tool for understanding the trade-offs between different technologies or the impact that new technologies could potentially have on the global carbon footprint. While such models exist for specific applications, such as hydrogen [
7], renewable electricity [
8], and carbon capture and sequestration [
9], no such model was found for understanding the holistic transportation industry. Given the interconnected nature of the transportation market, such a market would inherently be useful.
2.2. Methodology
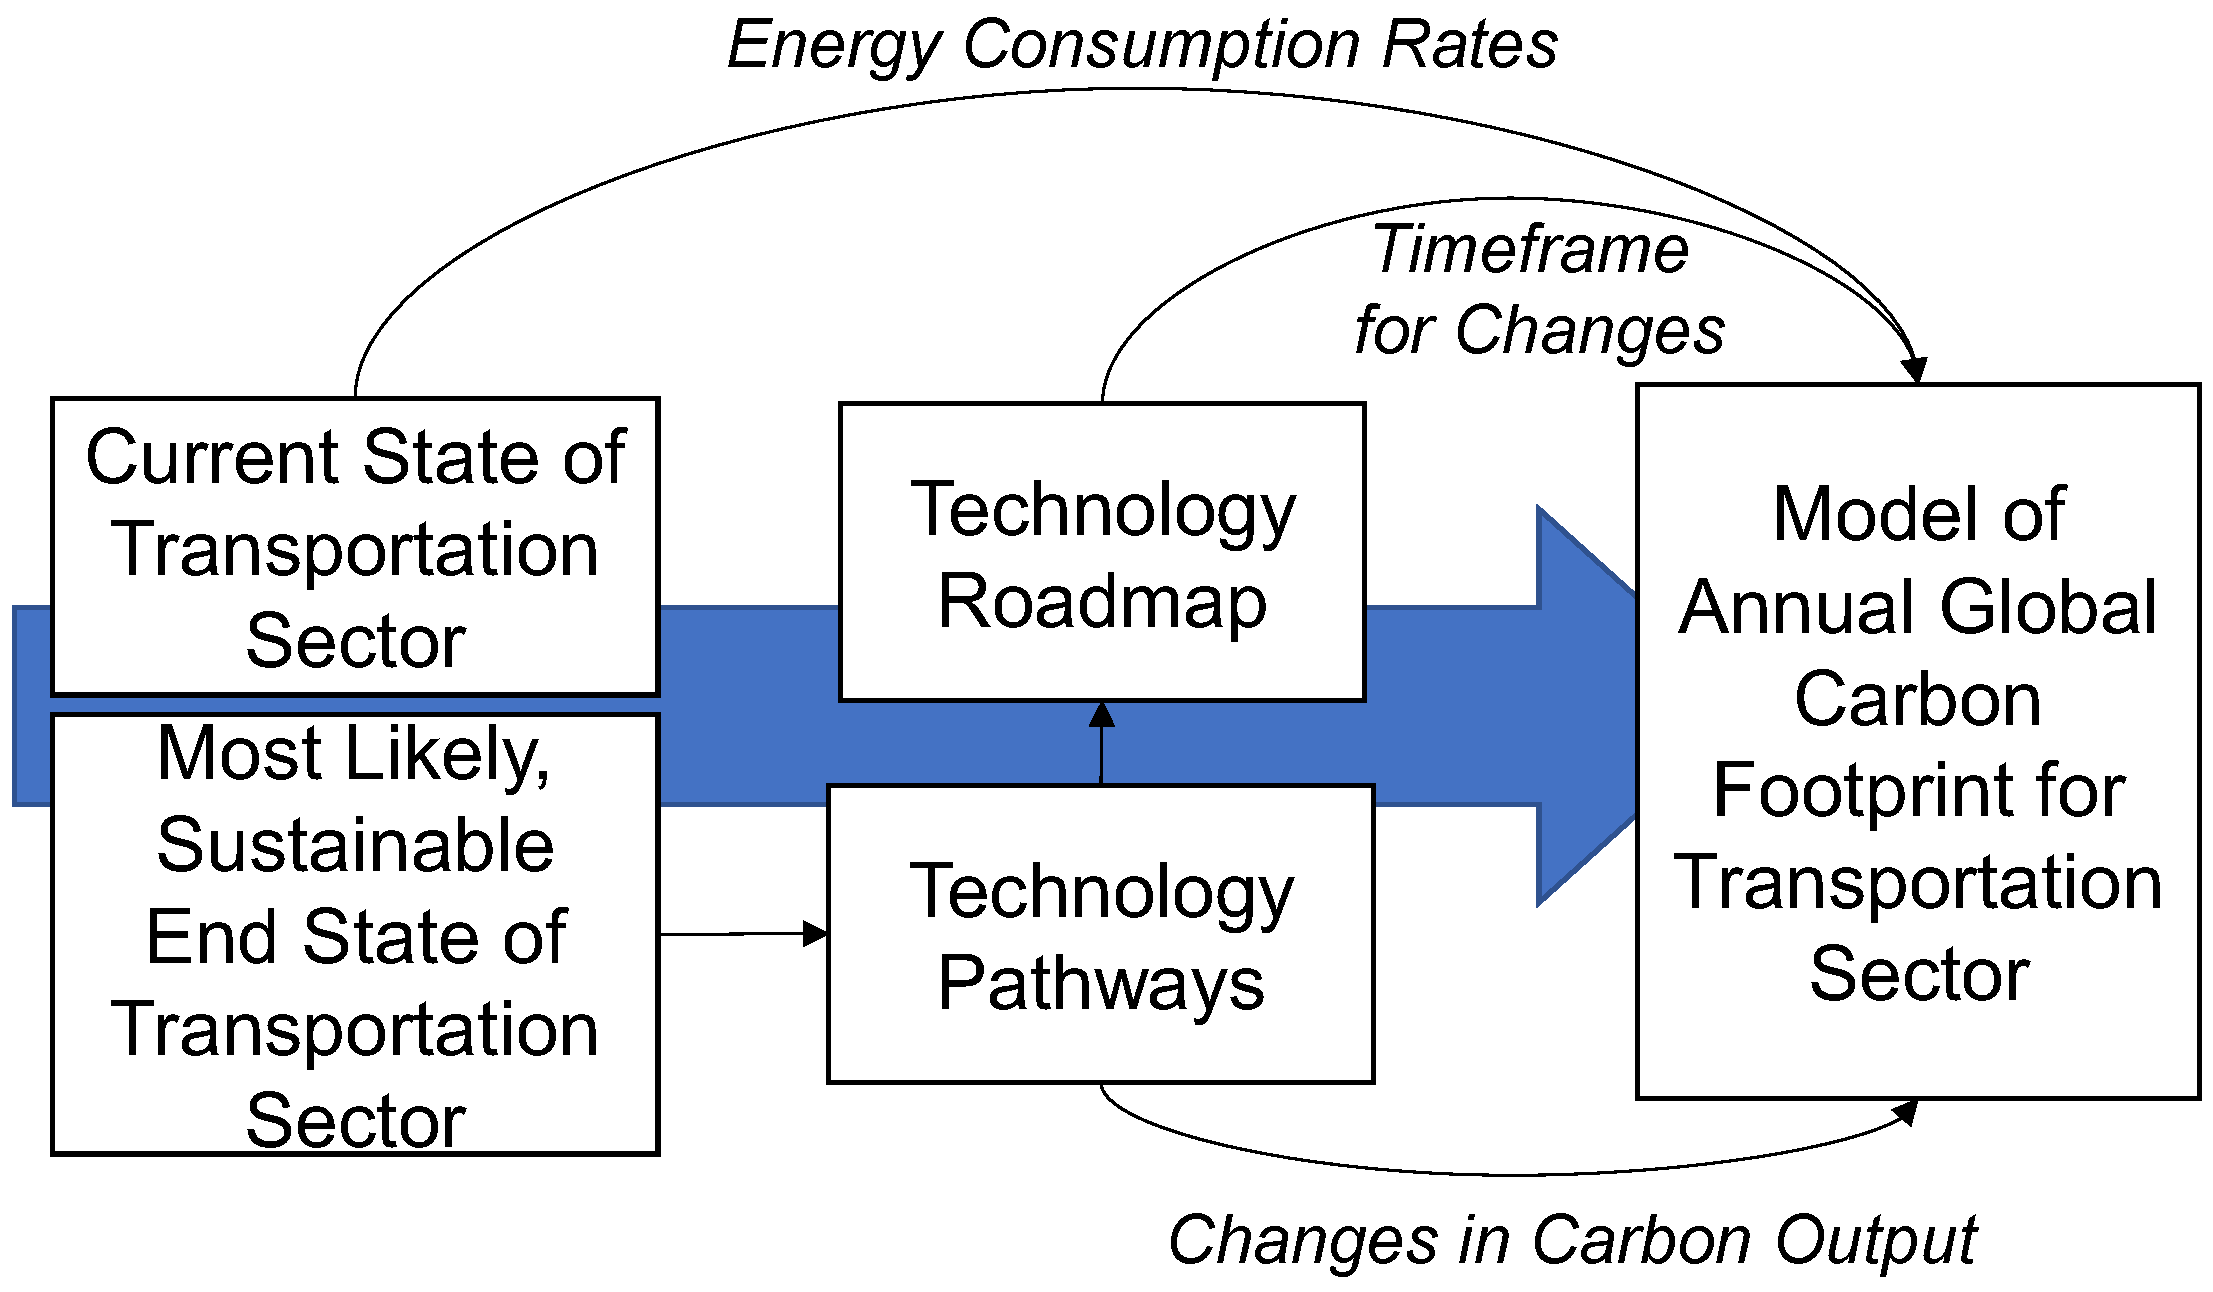
The methodology employed in this paper follows a standardized approach for technology forecasting, as depicted in
Figure 1. This approach entails several key steps. First, the current state of the transportation sector is assessed, along with the identification of the most probable and sustainable end state. To achieve this, the transportation sector is disaggregated into its major markets, including personal automobiles, commercial trucking, aircraft, watercraft, and trains. The end state represents the point at which each market within the transportation sector is carbon neutral. While multiple potential end states exist for each market, the most likely scenario is determined based on existing sustainability initiatives.
Once the most likely end states are defined, a gap analysis is conducted to identify the technologies that require further development and maturation. These technologies then contribute to the formulation of a roadmap, which predicts the timeline for the availability of each technology.
The primary objective of this analysis is to model the annual global carbon footprint based on the advancements in these technologies. The current state of the transportation sector provides the baseline energy demand, which is expected to scale in accordance with global population growth. Additionally, it provides the baseline annual global carbon footprint resulting from the utilization of modern technologies. The technology gap analysis offers insights into the potential reduction in carbon production rates, while the roadmap outlines the projected timeframe for the realization of these improvements.
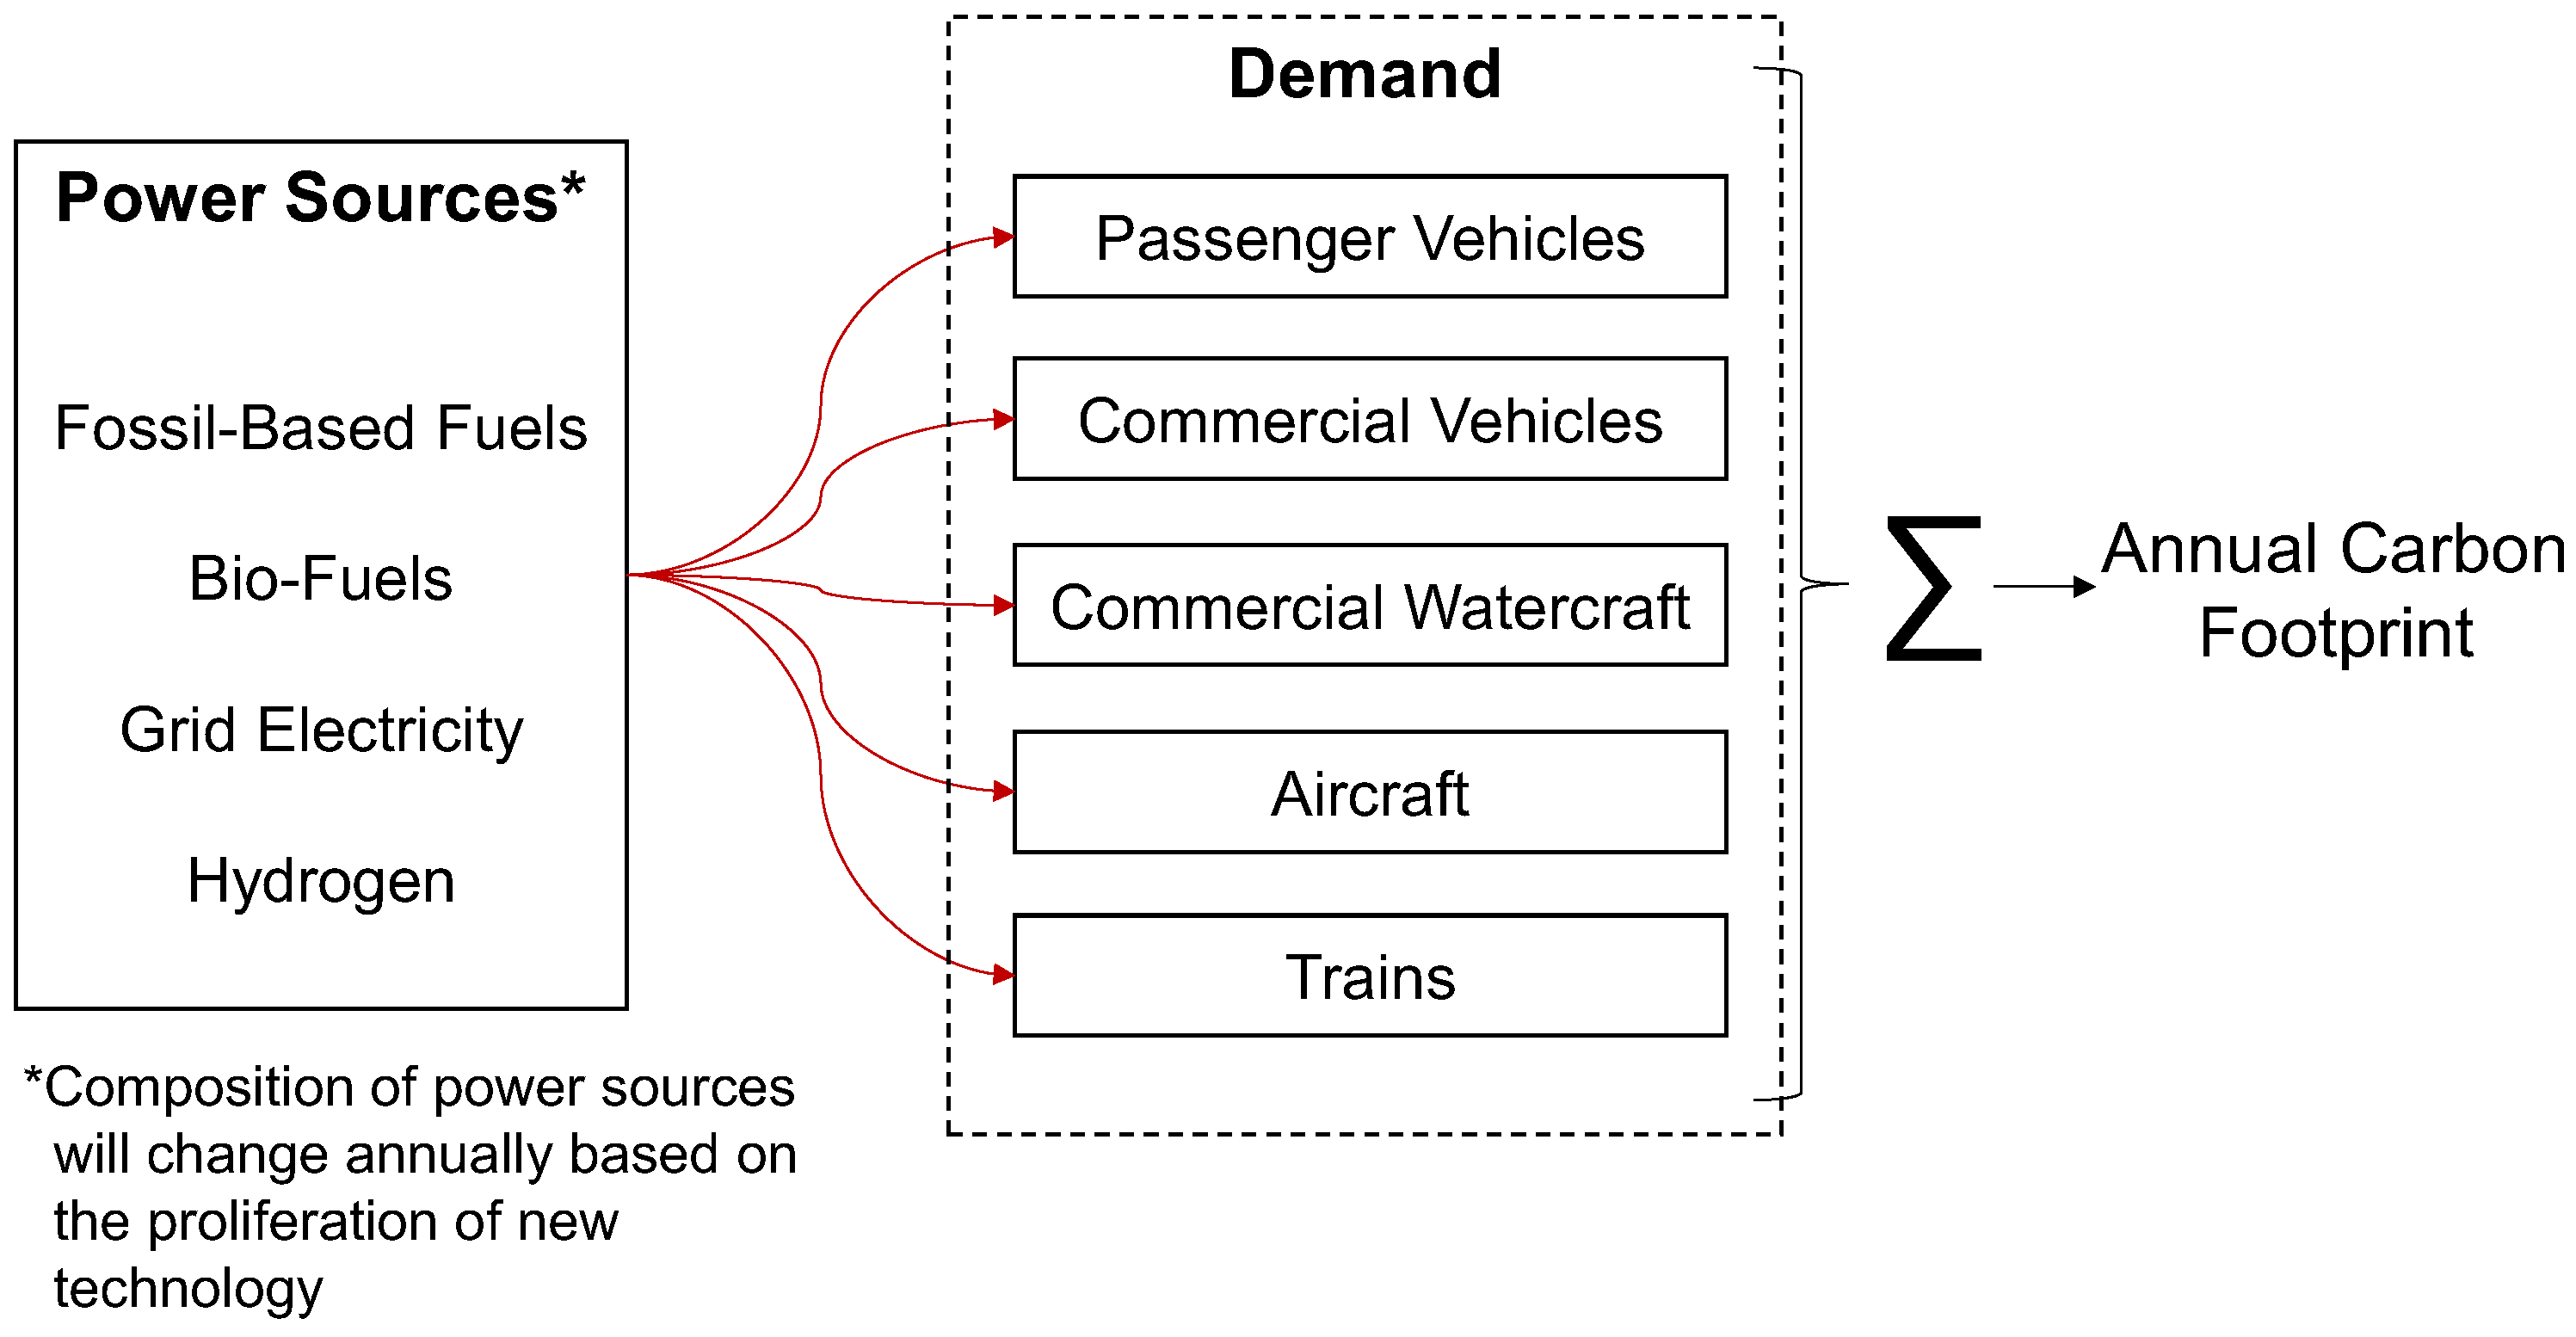
2.3. Model Architecture
Figure 2 provides an overview of the model utilized to assess the carbon footprint of the transportation industry. The model comprises two main components: the supply portion, which focuses on power sources, and the demand portion, which addresses each specific transportation market.
For a given year, the model approximates the demand for a given market based off the global population, such that the demand in each market scales with the global population. With the energy demand established for each year, the power sources for each market must be identified. Once the power source is identified and the demand is known, the annual carbon footprint can be calculated.
For instance, in 2045, the total number of cars on the road will have scaled up by 1 percent annually from 2020 based on population growth. Market projections would give that approximately half of the passenger vehicle market consists of electric vehicles (EVs) drawing electricity from the grid, while the other half will rely on a combination of biofuels and fossil-based fuels. By considering these power sources in conjunction with the state of the electricity grid (i.e., the blend of renewables, fossil fuels, and the extent of carbon capture and sequestration), the carbon footprint can be calculated. The carbon footprints of each market are then aggregated to determine the total carbon footprint for the transportation sector.
3. State of Current Transportation Sector
The transportation sector consists of several markets, including passenger vehicles, long-range commercial vehicles (e.g., cargo trucks, buses), trains, maritime vehicles, and airplanes. Each market has its own set of requirements for its power sources. For example, passenger vehicles primarily use gasoline engines, commercial vehicles tend to use diesel engines, and airplanes use gas turbines running on jet fuel.
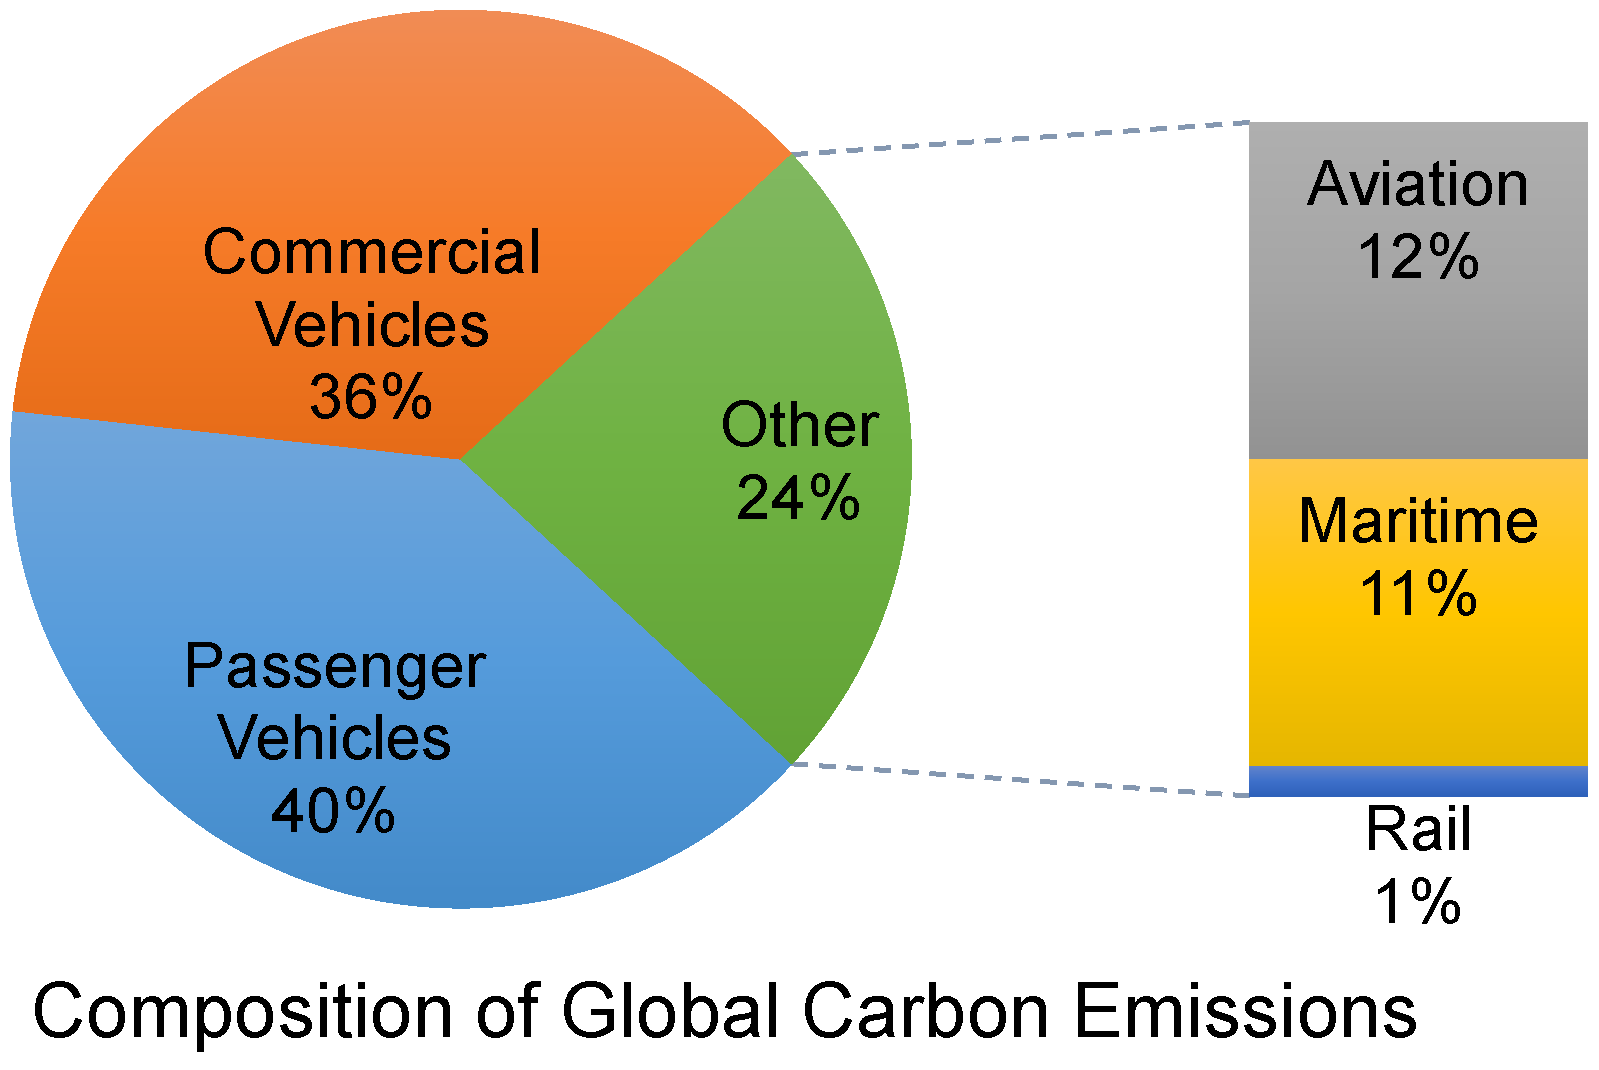
Figure 3 provides a breakdown of the energy usage by each sector based on data compiled by the International Energy Agency (IEA) [
10]. The IEA is a highly regarded resource for monitoring global energy trends. The largest market is passenger vehicles, powered by oil-derived gasoline and diesel fuel. This market has been the primary target of new sustainability initiatives, including recent plans to ban internal combustion engines in several countries. Although the other markets all contribute to carbon emissions, they have historically had looser environmental restrictions [
11]. However, to achieve carbon neutrality, the other markets must be considered along with passenger vehicles.
3.1. Energy Usage by Sector
As of 2021, there are over 1 billion passenger vehicles and 400 million commercial vehicles on the road [
12], consuming approximately 100 million barrels of oil per day [
13]. Over 99.7 percent of these vehicles are powered by an internal combustion engine burning carbon-based fuels, namely gasoline or diesel. These engines have been used for over a century in ground vehicles; as such, they have evolved to have increased efficiency and reduced emissions. The remaining 0.3 percent of ground vehicles consist of 4.8 million EVs [
14] and less than 10,000 hydrogen-powered vehicles [
15].
Although most of the energy from the transportation sector is used by cars and trucks, a substantial amount is used by aircraft, watercraft, and trains. Indeed,
Figure 3 shows that 12 percent of carbon dioxide emissions come from commercial aircraft, while an additional 11 percent comes from commercial watercraft. Trains constitute approximately one percent of the transportation sector’s carbon footprint.
Larger commercial aircraft use jet fuel in their gas-turbine engines. Jet fuel is similar in properties to diesel fuel and primarily derived from petroleum. Meanwhile, most commercial watercraft rely on large diesel engines. Indeed, some of the largest diesel engines in the world are used for maritime applications, and the maritime industry uses almost as much fuel as the airline industry. Trains are naturally more efficient than other transportation mechanisms due to their reduced drag and low rolling resistance. Most trains are powered by diesel engines. However, approximately a third of all trains globally are powered directly through electricity, such that the train takes electricity from overhead lines or powered rails and uses it to drive the motors.
3.2. Global Initiatives
Given issues with climate change, countries around the world have taken measures to be more sustainable. One of the first pushes was in the passenger vehicle market, where countries have required more efficient and cleaner vehicles [
16]. A parallel initiative is biofuels, which are derived from biological material instead of oil. Biofuels are an attractive option because they can potentially be carbon neutral since the source material absorbs carbon dioxide as part of photosynthesis. Currently, gasoline in the United States typically includes 10 percent ethanol, while gasoline in Brazil can include upwards to 27 percent ethanol [
17]. Several other countries including Germany, Indonesia, France, and China, are growing their biofuel industry, especially for biodiesel [
18].
The past five years have seen the rise of EVs at an unprecedented rate, especially in the United States and China. This growth was supported by both the environmental movement and government subsidies. However, it is worth noting that the 2.3 million new EVs sold in 2019 only constituted 2.5 percent of new car sales from that year [
19]. The larger growth of EVs will likely be hindered by infrastructure issues, especially since most countries do not have the electric grid to support this shift [
20].
Several countries have also attempted to move larger commercial vehicles away from diesel fuel. For example, India has pushed many of its diesel trucks and buses to use natural gas, resulting in these vehicles releasing 20 percent less carbon [
21]. Other countries are considering hydrogen fuel cells as a solution. The use of hydrogen, produced efficiently using renewable fuels, can result in substantial savings. More recently, several countries have invested heavily in hybrid-electric and all-electric trucks. The United States and several other countries are pushing for the use of battery-powered trucks for short haul applications, such as urban deliveries.
The aviation and maritime industries are moving towards biofuels to meet sustainability objectives, given the size and cost of batteries. The International Air Transport Association is attempting to push for the adoption of biofuels, aiming for biofuels to constitute two percent of aviation fuel by 2025 [
22]. The primary issue with aviation biofuel is that it is considerably more expensive than traditional jet fuel [
23]. The maritime industry is similarly looking to leverage biofuels to reduce their carbon footprint. The International Maritime Organization has pushed for a reduction in the maritime carbon footprint by 50 percent by 2050, with a focus on biodiesel [
24].
Meanwhile, trains are naturally moving away from diesel to electric power. As existing diesel train systems reach the end of their life cycle, countries are replacing them with electric trains that can move faster and cost less to operate and maintain [
25]. However, the small size of the carbon footprint associated with the rail industry makes it overall less critical for overhaul.
4. Forecast of New Technologies
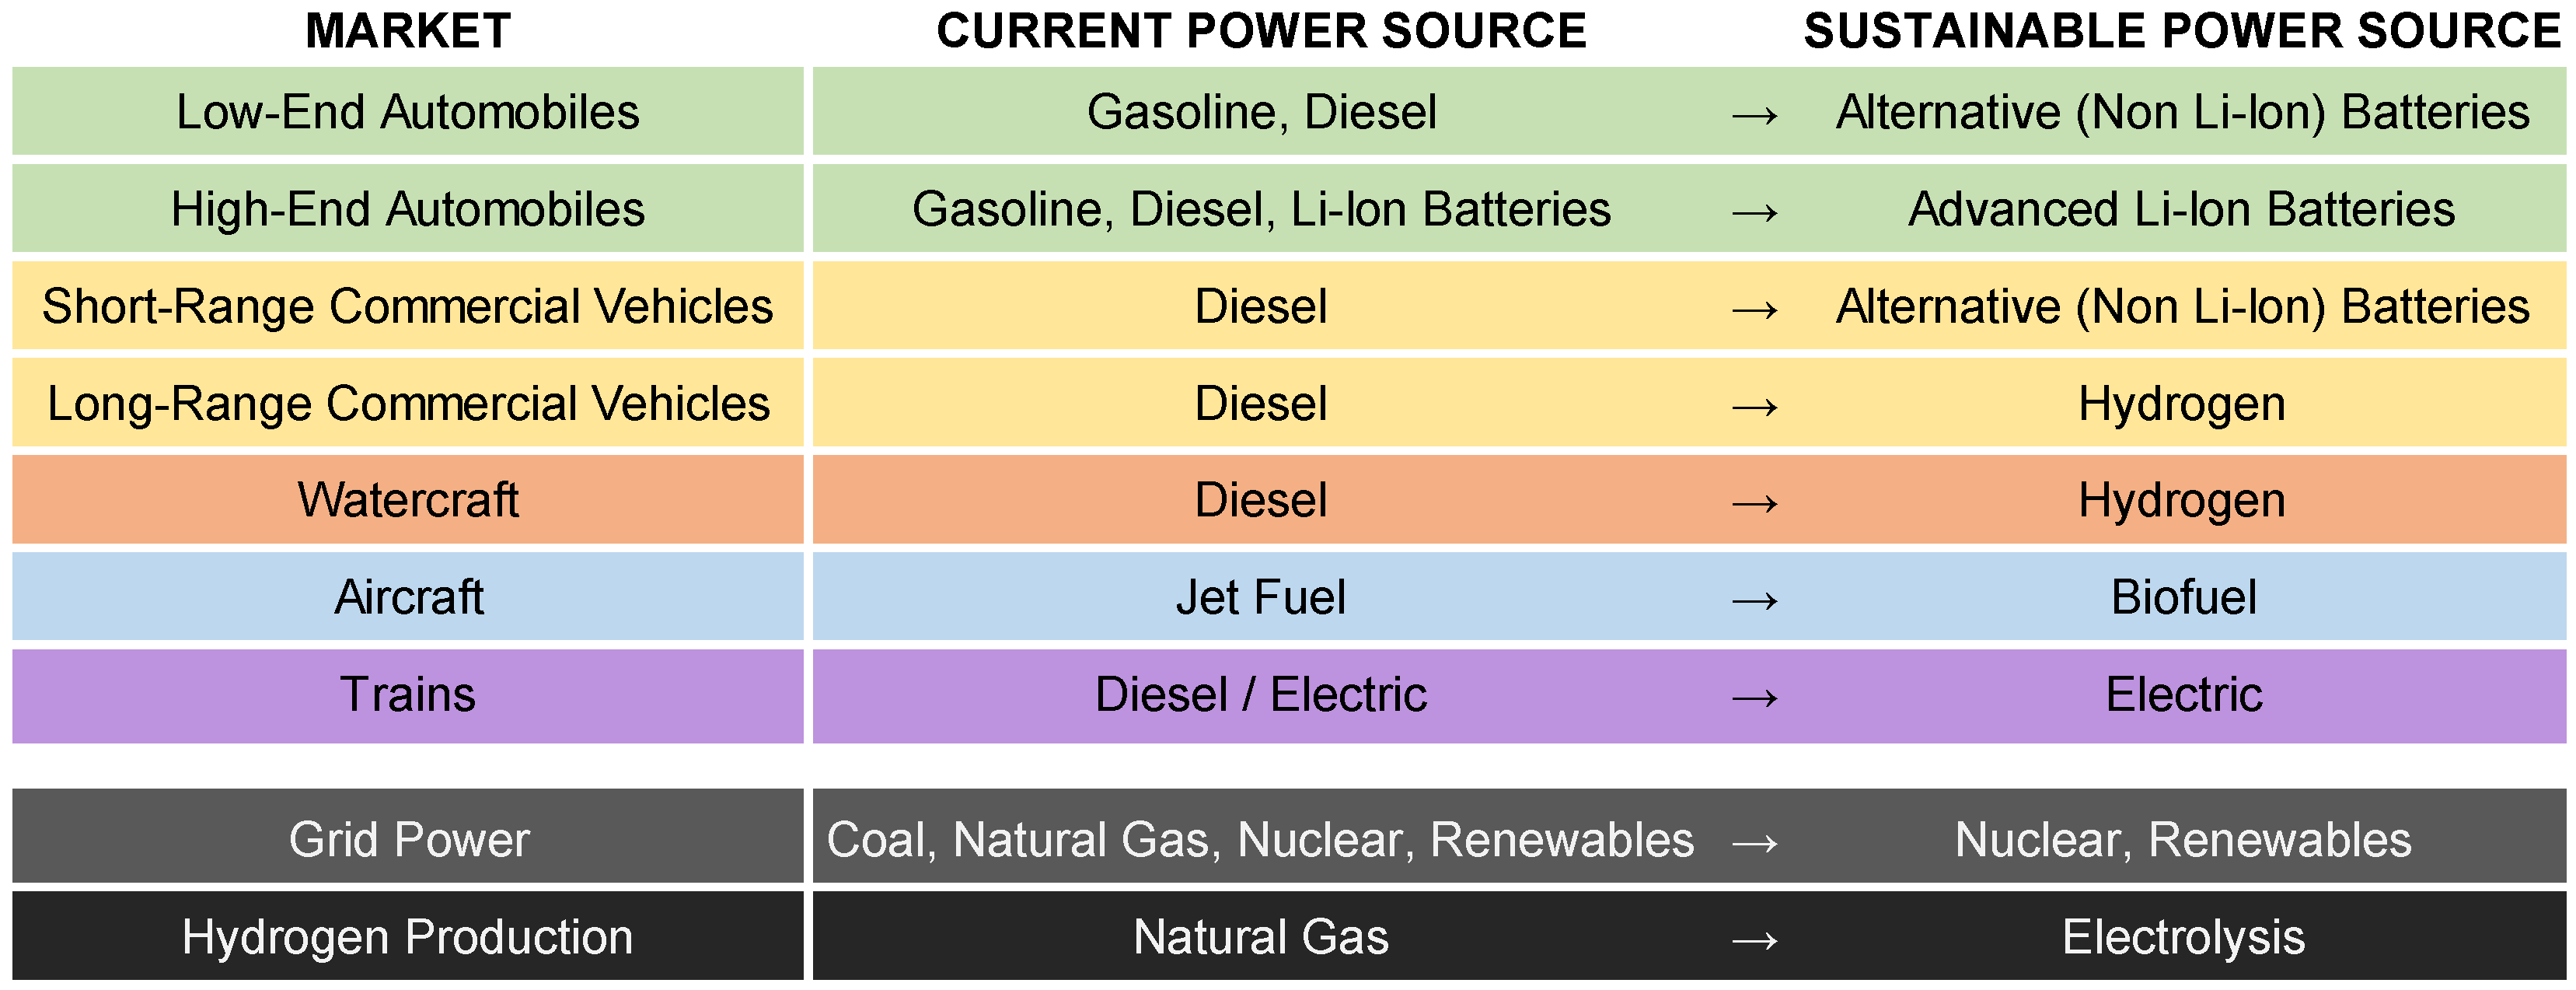
4.1. End State
Figure 4 provides the mapping in each transportation market from the current state to a sustainable end state, defined as having no carbon footprint. Given the future transportation sector’s strong reliance on grid power and hydrogen, both of these items are also addressed in
Figure 4. The future of the transportation sector is indeed eclectic, requiring a number of different technologies to provide a cost-effective, sustainable alternative to carbon-based fuels. The technologies associated with the end state are discussed in the following sections.
It is worth noting that a major driver of these shifts is cost. Indeed, long-term sustainable power sources must be at least cost competitive with current solutions. For example, the high cost of biofuels has limited its use in many applications. Furthermore, the increasing price and scarcity of lithium will limit its main-stream usage in the battery packs of future automobiles.
4.2. Required Advancements for Reaching End State
4.2.1. Battery Technology
Over the long term, EVs are projected to supplant traditional internal combustion engines in passenger vehicles. The critical technology underlying EVs is their batteries. Despite lithium-ion batteries being an improvement over older battery technologies, the batteries are still the limiting factor to market saturation for EVs. Lithium-ion battery cost is a significant issue, as they result in EVs being more expensive than traditional vehicles. While some of this money is recouped through reduced operational cost, studies indicate that total lifecycle costs for EVs can be up to 60% higher than conventional vehicles [
26]. This cost challenge is compounded by the decreasing supply of lithium, a limited resource with rising demand expected to double by 2024 [
27]. Additionally, lithium-ion batteries face technical challenges, notably concerning their durability [
28].
Solid electrolytes in lithium-ion batteries are more compact, have a higher energy density, and offer better safety performance than traditional lithium-ion batteries. Current research has successfully produced solid-state lithium-ion batteries in lab environments, and ongoing efforts aim to develop industrial-scale production techniques [
29]. However, due to the cost of lithium, these battery packs remain expensive and will be primarily used in luxury and high-performance vehicles.
Given limited lithium supplies, a new battery chemistry will be required for cheaper, main-stream electric vehicles. A number of promising replacements are in development, with one of the more promising replacements being magnesium. Magnesium is eight times more abundant than lithium in the Earth’s crust, making it approximately one-third the cost [
30]. Manufacturing processes for magnesium-ion batteries are less energy-intensive and generate fewer toxins compared to lithium-ion batteries [
31]. Consequently, magnesium-ion battery packs can be significantly cheaper, enabling the expansion of the electric vehicle market and reducing the need for government subsidies [
32]. As such, they can be used for lower cost passenger vehicles and short-range delivery vehicles.
Significant research is underway for both magnesium-ion and solid-state lithium-ion batteries. However, battery development takes a substantial amount of time and requires significant capital investment. For example, current Li-ion batteries were first invented in 1973; however, they were not commercialized until 1991 [
33]. Given the current state of solid-state lithium-ion batteries and magnesium-ion batteries, both could potentially be used in commercial products by 2035 [
34].
4.2.2. Hydrogen
Figure 4 shows that long-range commercial vehicles and commercial watercraft will likely move from fossil fuels to hydrogen. This is due to batteries still limiting the range of vehicles, especially for applications involving carrying heavy loads over long distances, such as commercial trucks and watercraft. These issues become amplified when looking at transportation through a range of environments, such as cold weather, where batteries have degraded performance. For these applications, hydrogen would be an ideal energy source due to its energy density; 1 kg of hydrogen along with a 5 kg fuel cell would provide the equivalent energy to 230 kg of lithium-ion batteries. Moreover, for watercraft, there is the additional benefit that the primary ingredient for hydrogen is water, which is readily available at most ports.
The production of hydrogen is not challenging and is well understood. Currently, hydrogen is produced through the partial combustion of methane; however, the long-term approach would be for the hydrogen to be produced from electrolysis, which is only sustainable if the requisite electricity is provided by renewable sources [
35].
The larger issue for this use of hydrogen is hydrogen storage. Vehicles are space- and weight-constrained and require a safe fuel storage system. Meanwhile, hydrogen is fundamentally chemically unstable, and voluminous. Current hydrogen-fueled systems use compressed hydrogen tanks, which are voluminous and incur safety concerns [
36]. While a slight improvement in volume, liquid hydrogen storage is expensive. Given the limitations of compressed and liquid storage mechanisms, significant research has gone into storing hydrogen chemically in metal hydrides. In this case, hydrogen bonds to a matrix of metal hydrides; when heated up, the hydrogen is released. Metal hydrides can achieve high energy density, with the most promising hydride being aluminum-based [
37]. There have been advancements with improving the kinetics of metal hydrides using catalysis, specifically with different transition metals such as palladium [
38].
Given that hydrogen will be produced from electrolysis of water from renewable energy sources, the cost will be substantially lower than gasoline or diesel once the energy storage issue is resolved. Projections suggest that hydrogen storage issues will be resolved, likely through metal hydride, by 2040 [
39]. However, the adoption of hydrogen will be slow, especially for commercial ground vehicles, since the necessary infrastructure must be put in place to support hydrogen production and distribution [
39].
4.2.3. Biofuels
For aviation applications, batteries are too heavy, and hydrogen is too voluminous and volatile. As such, the aircraft industry will heavily leverage biofuels in the future [
23]. Biofuels are renewable liquid fuels made from plant-based organic matter, offering benefits such as reduced greenhouse gas emissions and increased resource sustainability [
40]. Traditionally, biofuels are manufactured from organic feedstocks composed of edible plants, such as sugarcane, beetroot, wheat, corn, rapeseed, sunflower, soybean, and palm. However, high production costs and potential food security concerns limit their usage.
While current biofuels are made from edible crops, second-generation biofuels use non-edible plants and agricultural waste to avoid competition with food supply and reduce costs. Next-generation biofuels include lignocellulosic ethanol, biomass-to-liquid diesel, and sustainable aviation fuel (SAF). These biofuels have better fuel quality and carbon balance than current biofuels [
41,
42]. Switchgrass is being explored as a cost-effective biomass source for the production of these biofuels. Longer term, algae is an appealing source for the production of biofuels, including SAF, due to its high crop yields; however, it currently requires significant water and nutrient inputs [
43]. Ongoing research aims to develop sustainable algae agriculture [
44].
Biofuels will initially provide some replacement for petroleum-based fuels across the different transportation sectors. However, with the establishment of renewable energy sources, biofuels will simply be too expensive for passenger vehicles compared to cheap, renewable power from the grid. Regardless, biofuels will play a critical role in the production of SAF, allowing the aviation market to achieve sustainability. As biofuels continue to evolve, they will steadily replace jet fuel for aviation applications, with the end goal of completely replacing oil-based fuel by 2050 [
45].
4.2.4. Renewable Power Sources for Grid Power
Although the electric grid is currently separate from the transportation sector, there will be an increasing degree of overlap as the transportation sector incorporates electric and hydrogen-fueled vehicles. Furthermore, trains will be powered directly from electricity provided by the grid.
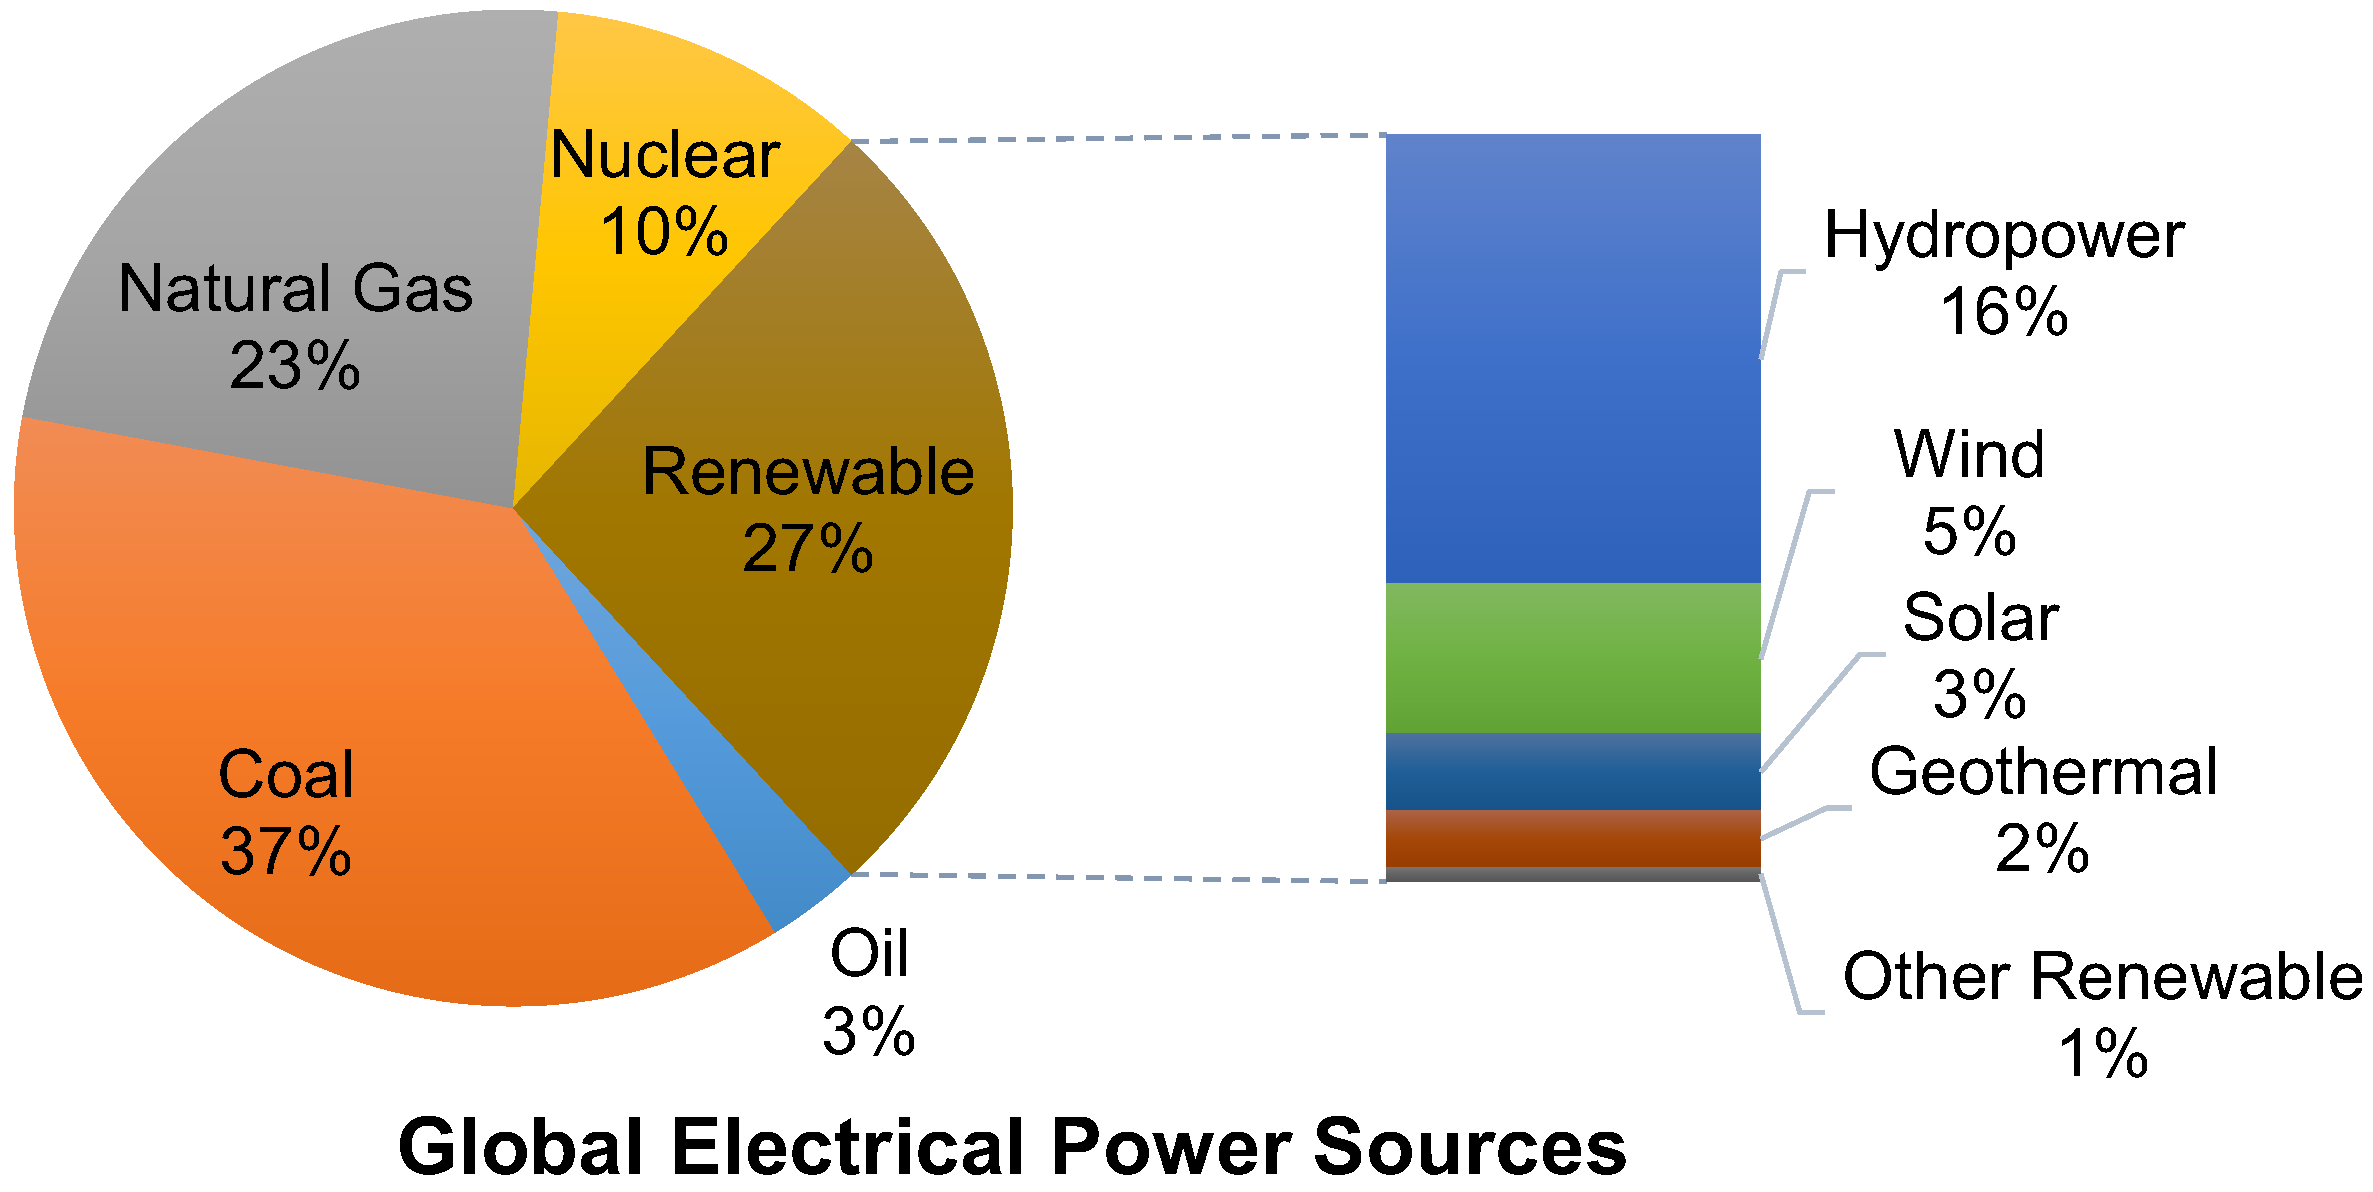
Figure 5 displays the sources of energy globally for electricity based on data provided by British Petroleum [
46]. This study by British Petroleum is cited in academic reviews and international reports. Oil, coal, and natural gas provide 63 percent of the world’s electricity. Additionally, nuclear power provides another 10 percent. Only 27 percent of the current global grid is based on renewable power, with the bulk of it coming from hydroelectric power.
Since 63 percent of the world’s electrical power comes from the burning of fossil fuels, electric cars are simply transferring the carbon emissions from the tailpipe to a power plant. Although large-scale power plants operate at a higher efficiency than an internal combustion engine, there are losses in transforming and distributing the electricity in addition to losses when charging the batteries. A recent study performed in India found that without substantial infrastructure upgrades, the emissions from electric vehicles would increase the overall carbon emissions over traditional vehicles [
47].
Long term, there will be a need for renewable energy to provide the bulk of electricity. Hydropower, which currently accounts for 16 percent of the world’s electricity, has the potential to play a much larger role in future grids, since only a small portion of the world’s rivers are used for generating power. However, there are issues with the cost and environmental ramifications associated with building hydroelectric plants. Moreover, solar and wind power are producing an increasing amount of electricity globally. Wind has increased at a steady rate, adding 70–100 GW of capacity annually. Meanwhile, solar has seen exponential growth since 2006, now holding a similar market share to wind. New breakthroughs in chemistry have allowed for efficient and durable solar panels [
48].
While there are definite challenges in overhauling electric grids globally, a study by the International Renewable Energy Agency found that a 7.7 percent annual increase in renewable energy globally would allow for the world to meet the goals of the Paris Agreement. While this value is aggressive, in 2022, the annual increase in renewable energy was 9.6 percent [
49].
4.2.5. Carbon Capture and Sequestration
The primary issue with fossil fuels for electric generation has been related to their greenhouse gas footprint [
46]. Most of the carbon dioxide from the combustion of fossil fuels is released into the atmosphere, with a small portion being captured through carbon capture and sequestration (CCS) processes. Between 2009 and 2014, approximately 1 billion USD were spent per year on CCS technology [
50]. The CCS process typically requires pumping the carbon dioxide into geological storage areas that are 2–3 km deep. Currently, there are 21 large scale carbon capture facilities in operation, with another 45 under development.
CCS is not more widely used due to its cost, incurring a large capital cost and a 20 percent increase in cost per unit energy. Although hydroelectric power is cheaper than coal power even without CCS, with proper investment, coal and natural gas power with CCS can be a cost-competitive alternative to wind and solar power. This would require a substantial upfront investment, although this cost will decrease as more facilities include CCS. A secondary benefit from the development of CCS is that this infrastructure will support the development of the production of biofuels and hydrogen as discussed in the previous section.
The International Energy Agency (IEA) has highlighted the need for CCS to meet sustainability goals, indicating that new and refurbished power plants will need to start including CCS in order to meet the Paris Agreement objectives. Major countries, including the United States and China, have expressed their intent to include CCS in new and upgraded coal and natural gas power plants from 2030 onwards [
51]. Eventually, the growth of renewable energy sources will result in the decommissioning of fossil-fuel-based power plants, ending the need for CCS.
4.3. Roadmap
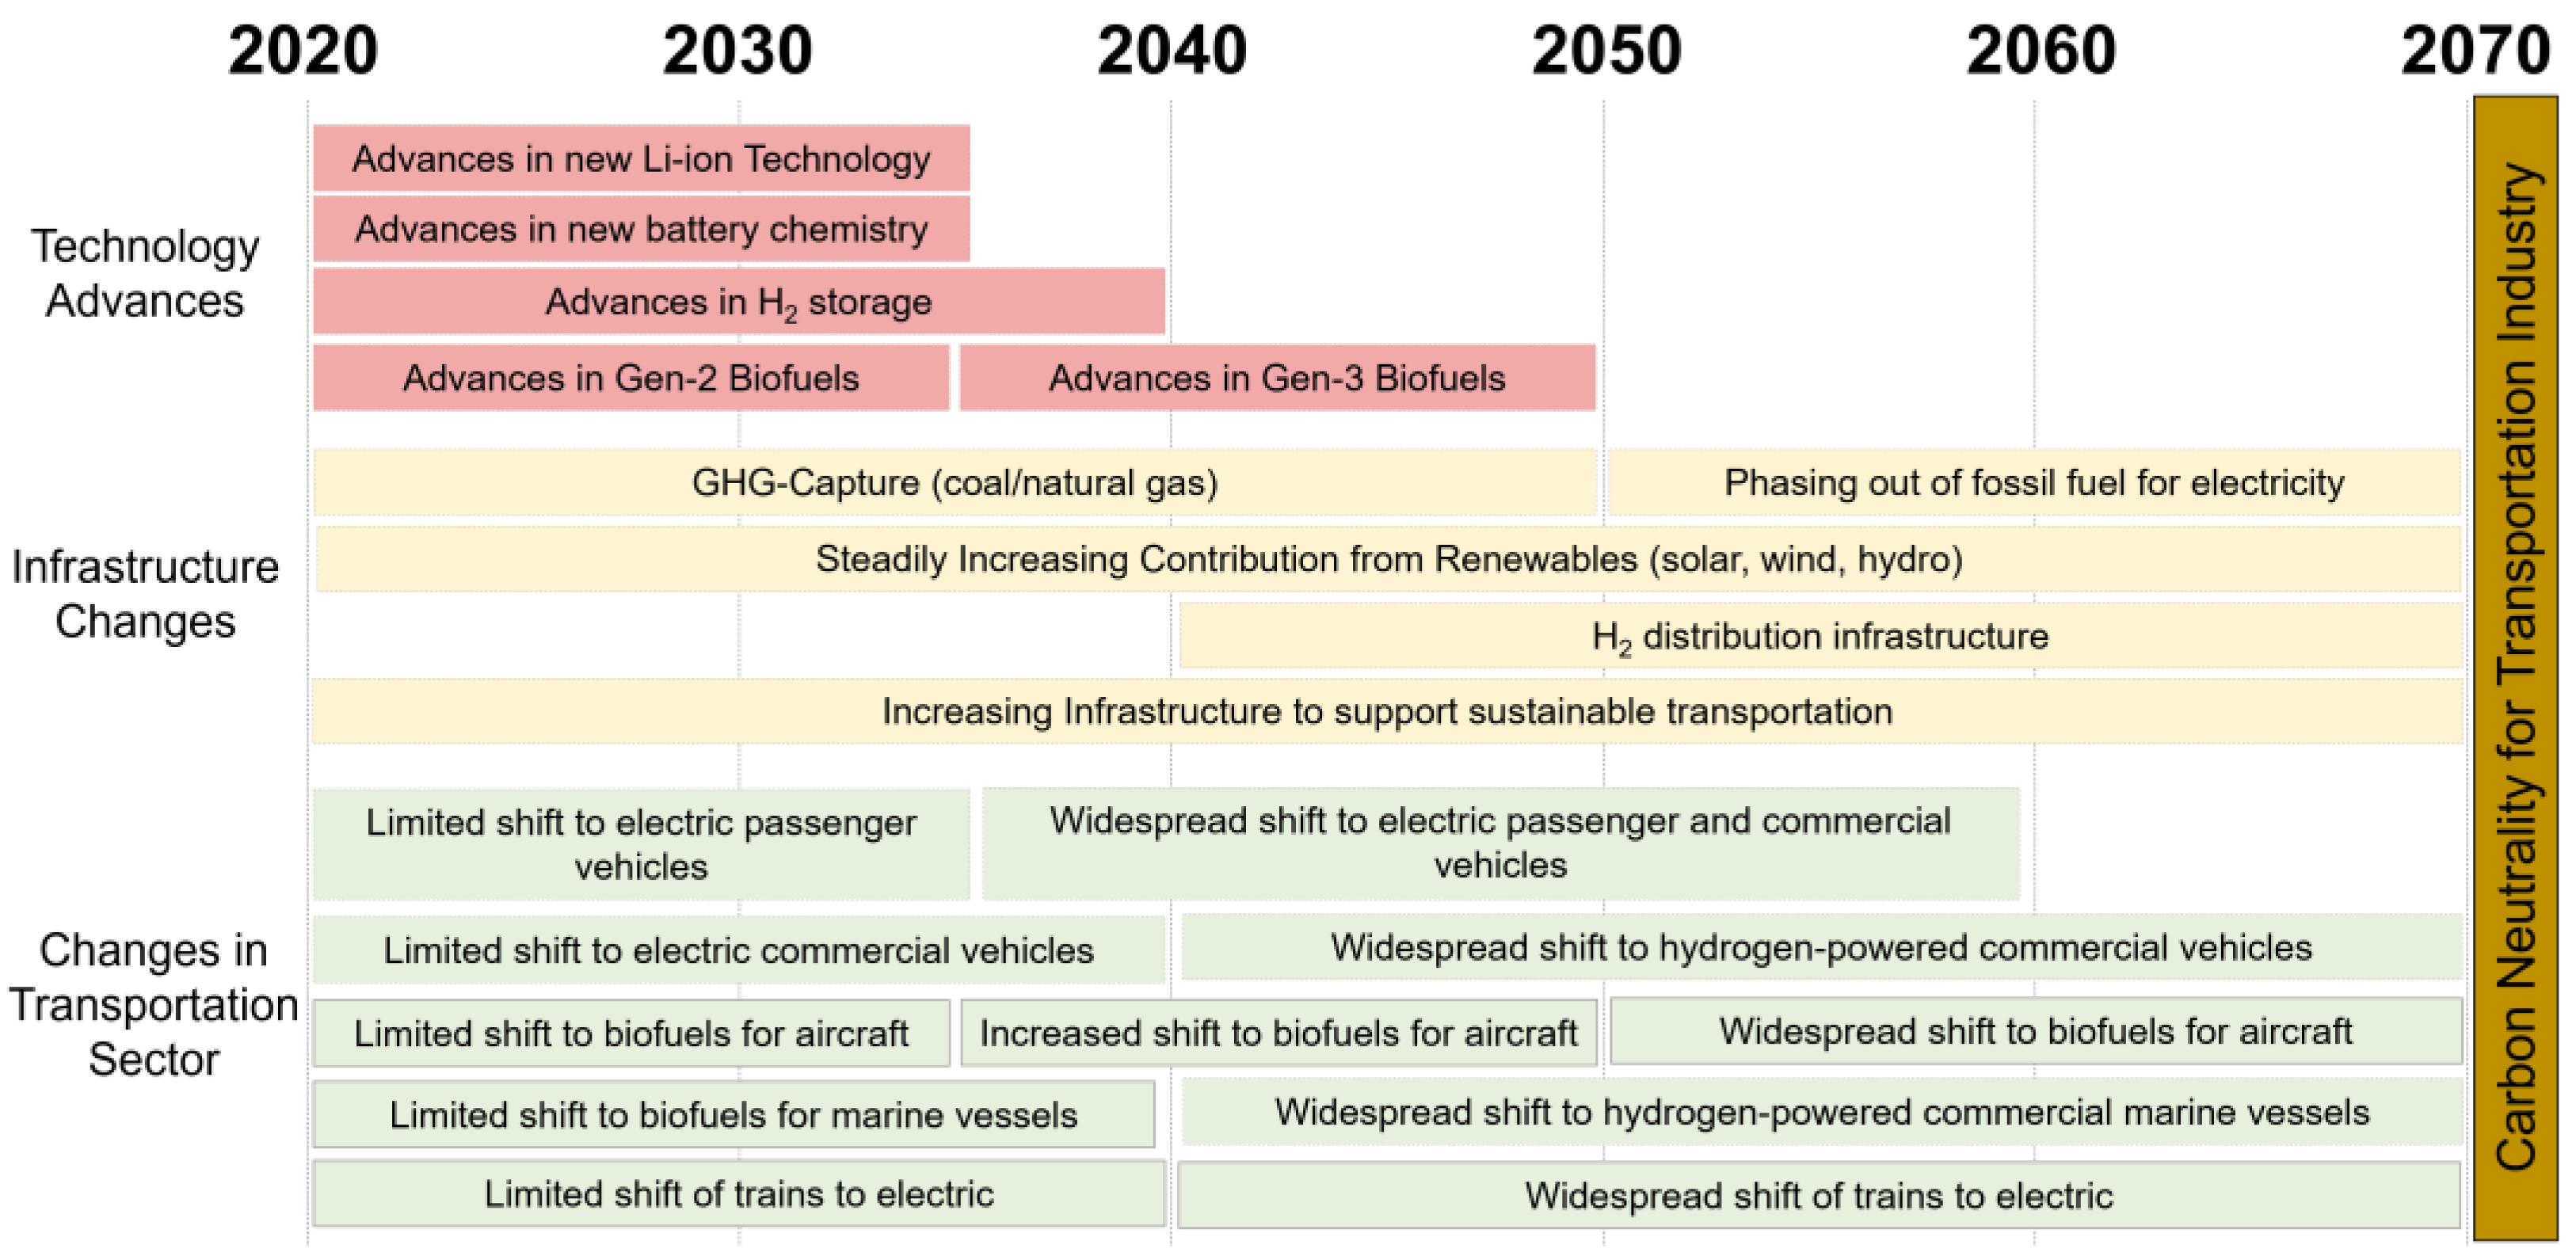
Figure 6 shows the synchronization of technology and infrastructure changes to the changes in the transportation sector discussed in the previous section. As new technologies are being developed in batteries and biofuels, incremental improvements are achieved at current rates. However, once the appropriate new technologies become commercially viable (e.g., economical batteries in 2035), the markets will heavily shift to use the new technology.
For the passenger vehicle market, the commercialization of new advanced lithium-ion batteries will allow for electric vehicles to fully supplant fossil-fuel powered automobiles. There will also be a substantial increase in commercial vehicles. Similarly, once hydrogen storage systems are commercially viable, the commercial vehicle market will similarly adopt this energy source. Meanwhile, the aviation industry will continue to adopt biofuels, although its usage will remain cost prohibitive until next-generation biofuels become available. As biofuels advance, their cost will decrease and their usage by the aviation community will increase. Biofuels will also offset some diesel fuel from the marine industry as well. While commercial ground and marine vehicles will leverage advances in battery technology and biofuels, a major shift will occur when hydrogen storage systems are commercialized. Meanwhile, trains will increasingly leverage running directly off grid power.
With these advances comes an increased loading on the grid. Renewable grid electricity will continue to grow; however, to meet the increased demands in the mid-term, CCS will be required. However, CCS will eventually be phased out as renewable energy becomes able to produce all of the necessary electricity required by the transportation industry.
5. Model
5.1. Model Design and Setup
A model was developed to determine the global amount of carbon emitted by the transportation industry, in line with the technology roadmap presented in the previous section. The algorithm underlying the model is as follows:
Determine the current annual global energy consumption related to each sector of the transportation sector.
Determine the current amount of carbon emissions per unit of energy consumed for each sector.
Scale the annual energy required per sector with the global population, which is assumed to be increasing at a rate of one percent each year.
Determine the current composition of the grid in terms of coal, natural gas, nuclear, and renewable.
Calculate the annual carbon produced from passenger automobiles by determining the following:
The percentage of passenger automobiles that are using internal combustion engines.
The percentage of passenger automobiles that use battery electric propulsion.
The carbon produced from vehicles with internal combustion engines based off improvements in engine technology and use of biofuels, accounting for both new and old cars.
The carbon produced from the grid to recharge batteries.
Calculate the annual carbon produced from commercial ground vehicles by determining the following:
The percentage of commercial vehicles that are using internal combustion engines.
The percentage of commercial vehicles that are using hydrogen fuel cells.
The percentage of commercial vehicles that use battery electric propulsion.
The carbon produced from vehicles with internal combustion engines based off improvements in engine technology and use of biofuels.
The carbon produced from the hydrogen production for fuel-cell vehicles.
The carbon produced from the grid to provide electricity for electrolysis to produce the hydrogen for fuel-cell vehicles.
The carbon produced from the grid to recharge batteries.
Determine the annual carbon produced from aircraft by determining:
The percentages of aircraft fuel that are biofuel and traditional jet fuel.
The carbon produced from the burning of traditional jet fuel.
The carbon produced from the burning of biofuel.
Determine the annual carbon produced from marine vehicles by determining:
The percentages of marine fuel that are biofuel, hydrogen, and diesel.
The carbon produced from the burning of traditional diesel.
The carbon produced from the burning of biofuel.
The carbon produced for the hydrogen production based off the state of the grid.
Determine the annual carbon produced from trains by determining:
The percentages of trains that are electric and diesel.
The carbon produced from the burning of traditional diesel.
The carbon produced to provide electricity to trains.
Sum the annual carbon production from the different industries.
5.2. Model Assumptions
Similar to any predictive model, this model incorporates a number of assumptions. The largest assumption is that the roadmap shown in
Figure 5 actually comes to fruition and all technology and infrastructure modifications occur. Moreover, the model makes the following assumptions to quantitatively analyze the change in carbon emissions:
Global population will scale by approximately one percent per year [
52].
The average passenger vehicle is kept for approximately 11 years, implying that in a given year, approximately nine percent of vehicles are replaced [
53].
The average large commercial vehicle is kept for approximately 15 years, implying that in a given year, approximately 6.7 percent of large commercial vehicles are replaced [
54].
New passenger and commercial vehicles with internal combustion engines will increase in efficiency through engine and vehicle modifications at a rate of two percent per year [
16].
Electric vehicle sales will continue to follow current sales trajectories, offsetting a portion of the passenger automobile and commercial vehicle markets. However, with the development of alternative batteries to replace traditional Li-ion, many countries will ban new car sales with ICEs, resulting in electric vehicles dominating new vehicle sales for the passenger vehicle market.
Some commercial vehicles will transition over to being electric, especially those in cities. However, the bulk of the market will transition over to hydrogen as the infrastructure becomes available. This adoption will be slower than the transition to electric vehicles due to infrastructure needs.
Aircraft and watercraft will be able to transition to using biofuels with no change to vehicles.
Watercraft will require significant overhaul to transition to hydrogen, resulting in this change occurring over significant time [
39].
Diesel-powered trains will be replaced with electric trains at a rate of three percent per year [
55].
Electricity demand will continue to scale with the additional population and be able to account for the increased demand from electric vehicles.
Hydro, solar, and wind power will continue to grow following current trends at seven percent per year [
49].
Coal and natural gas will cover the difference between demand and renewable supply. However, an increasing amount of coal and natural gas facilities will use CCS with the growth rate of CCS facilities being two percent by year [
51].
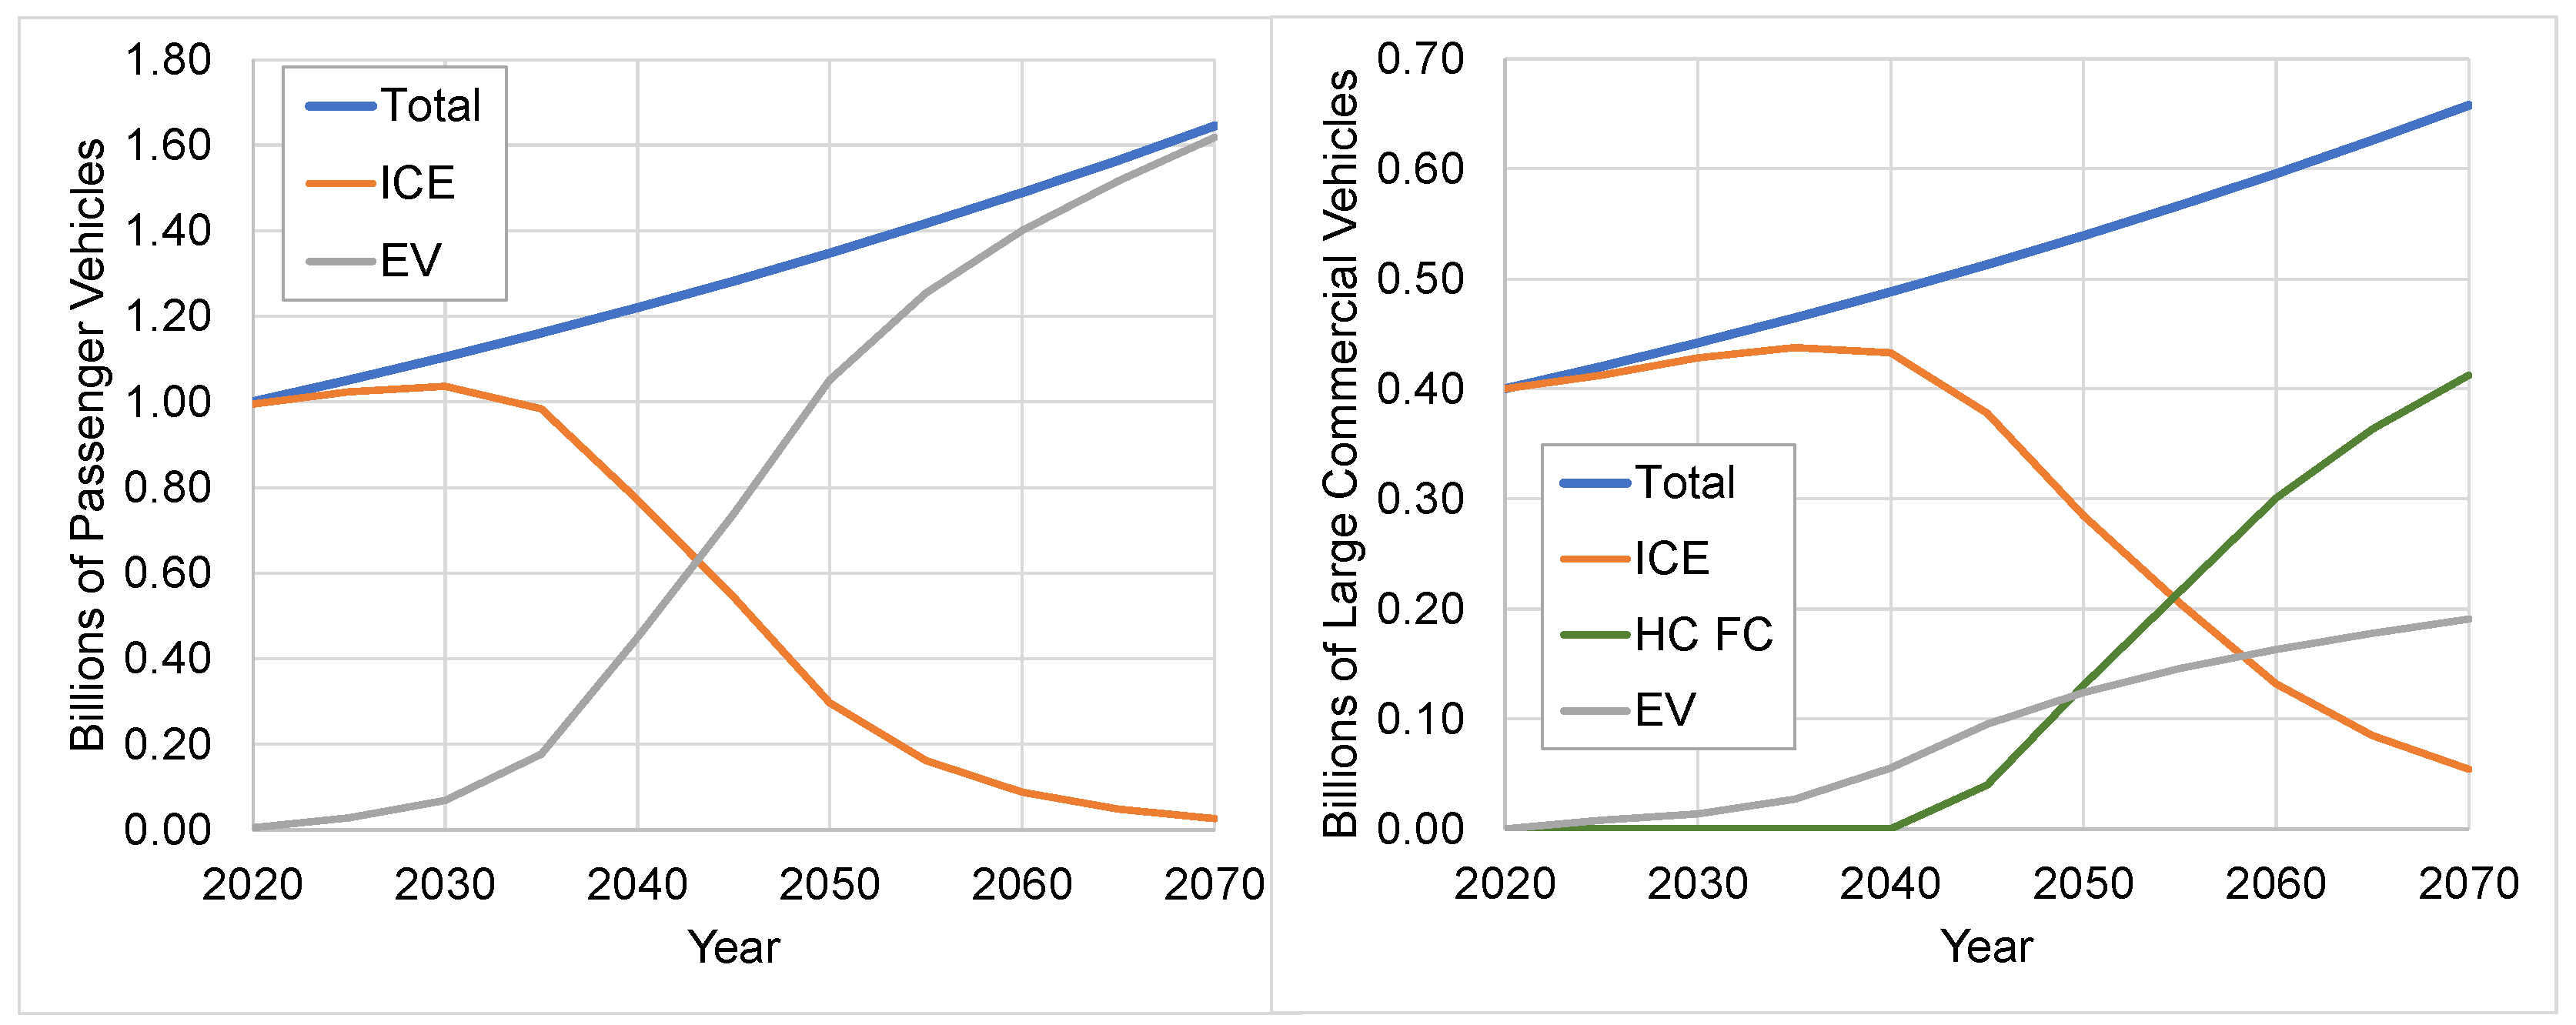
Underlying the model’s calculation for the contribution from passenger vehicles is the percentage of vehicles that are electric versus those with traditional engines. The model assumes that a certain number of cars are traded out each year, and that a percentage of the new cars are electric, as shown in
Figure 7. The percentage of new cars being electric is based on the state of the technology, with virtually every new car becoming electric once alternative battery chemistries, likely magnesium-ion, become available. The commercial vehicle will follow a similar trend, with some of the vehicles being replaced with battery-powered vehicles, especially for short-haul applications. However, this is limited to approximately 30 percent of the market. The remaining portion will transition over to hydrogen fuel cells as they become available, as shown in
Figure 7.
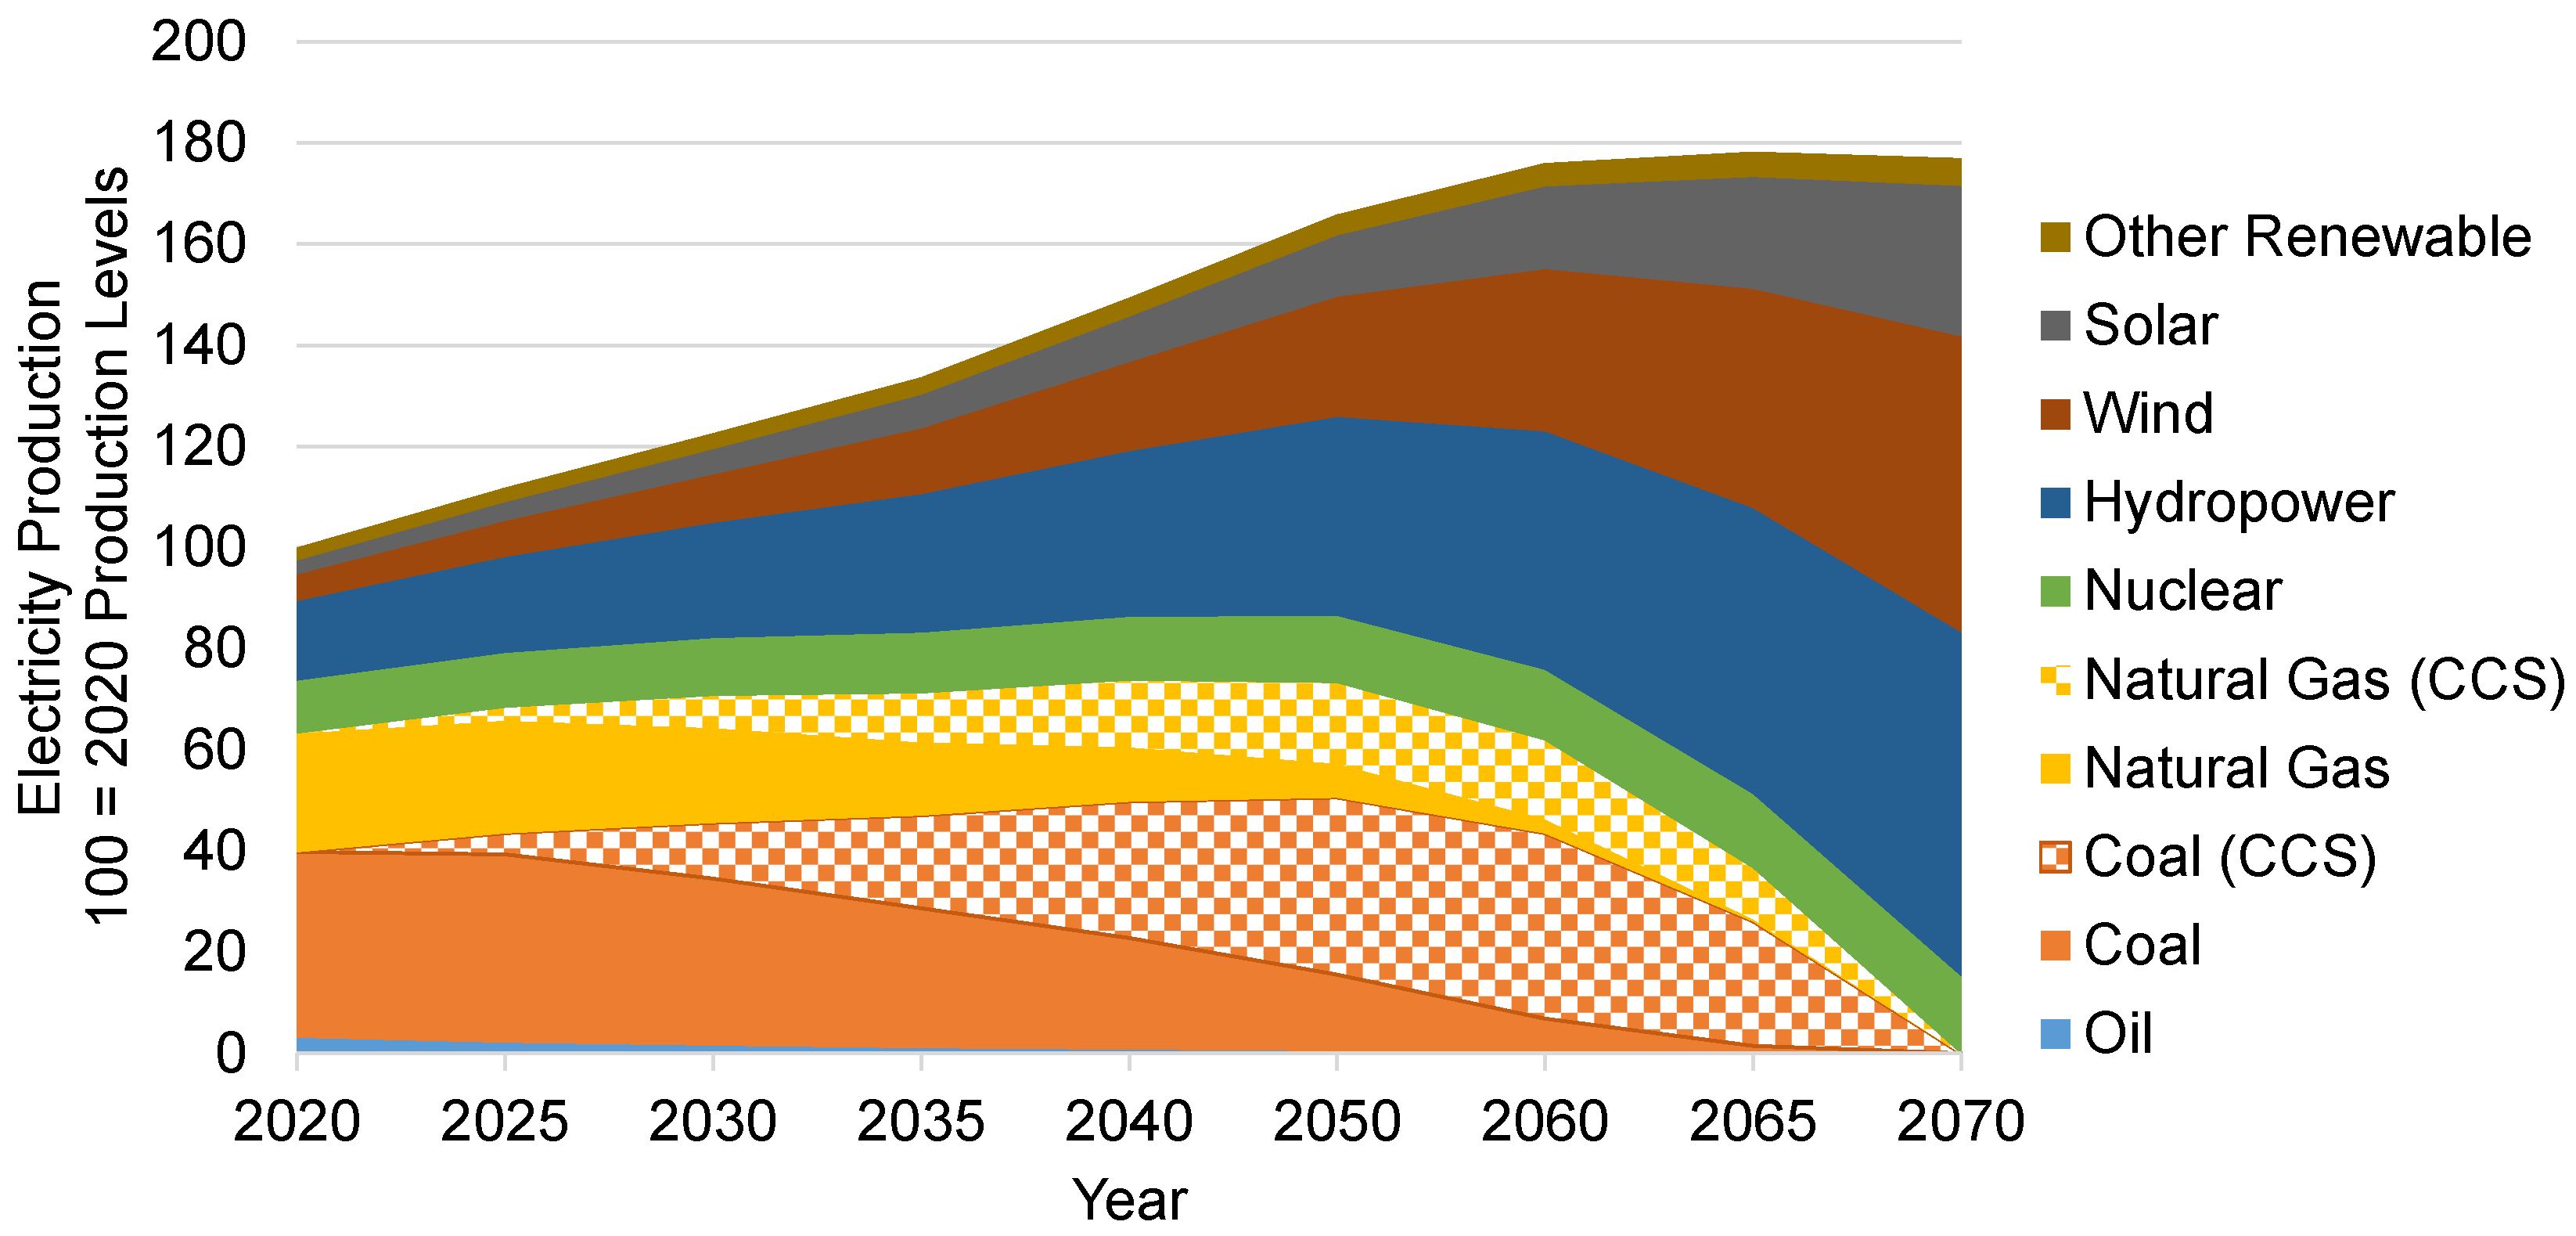
Since the electric vehicles are being recharged from the grid and hydrogen is being electrolyzed via grid electricity, the sources of grid energy must also be modeled.
Figure 8 shows the energy sources for grid electricity based on the technology roadmap and the aforementioned assumptions made for this model.
The aviation and maritime sectors will see an increased usage of biofuels, with the biofuels eventually fully supplanting oil-based fuels. Additionally, the maritime sector will transition over to hydrogen once the appropriate infrastructure is in place. The biofuel infrastructure that will be in place for the aviation industry would also allow for a carbon-neutral source for older vehicles and boats. Meanwhile, the model assumes the gradual phasing out of diesel trains for electric trains.
5.3. Model Results
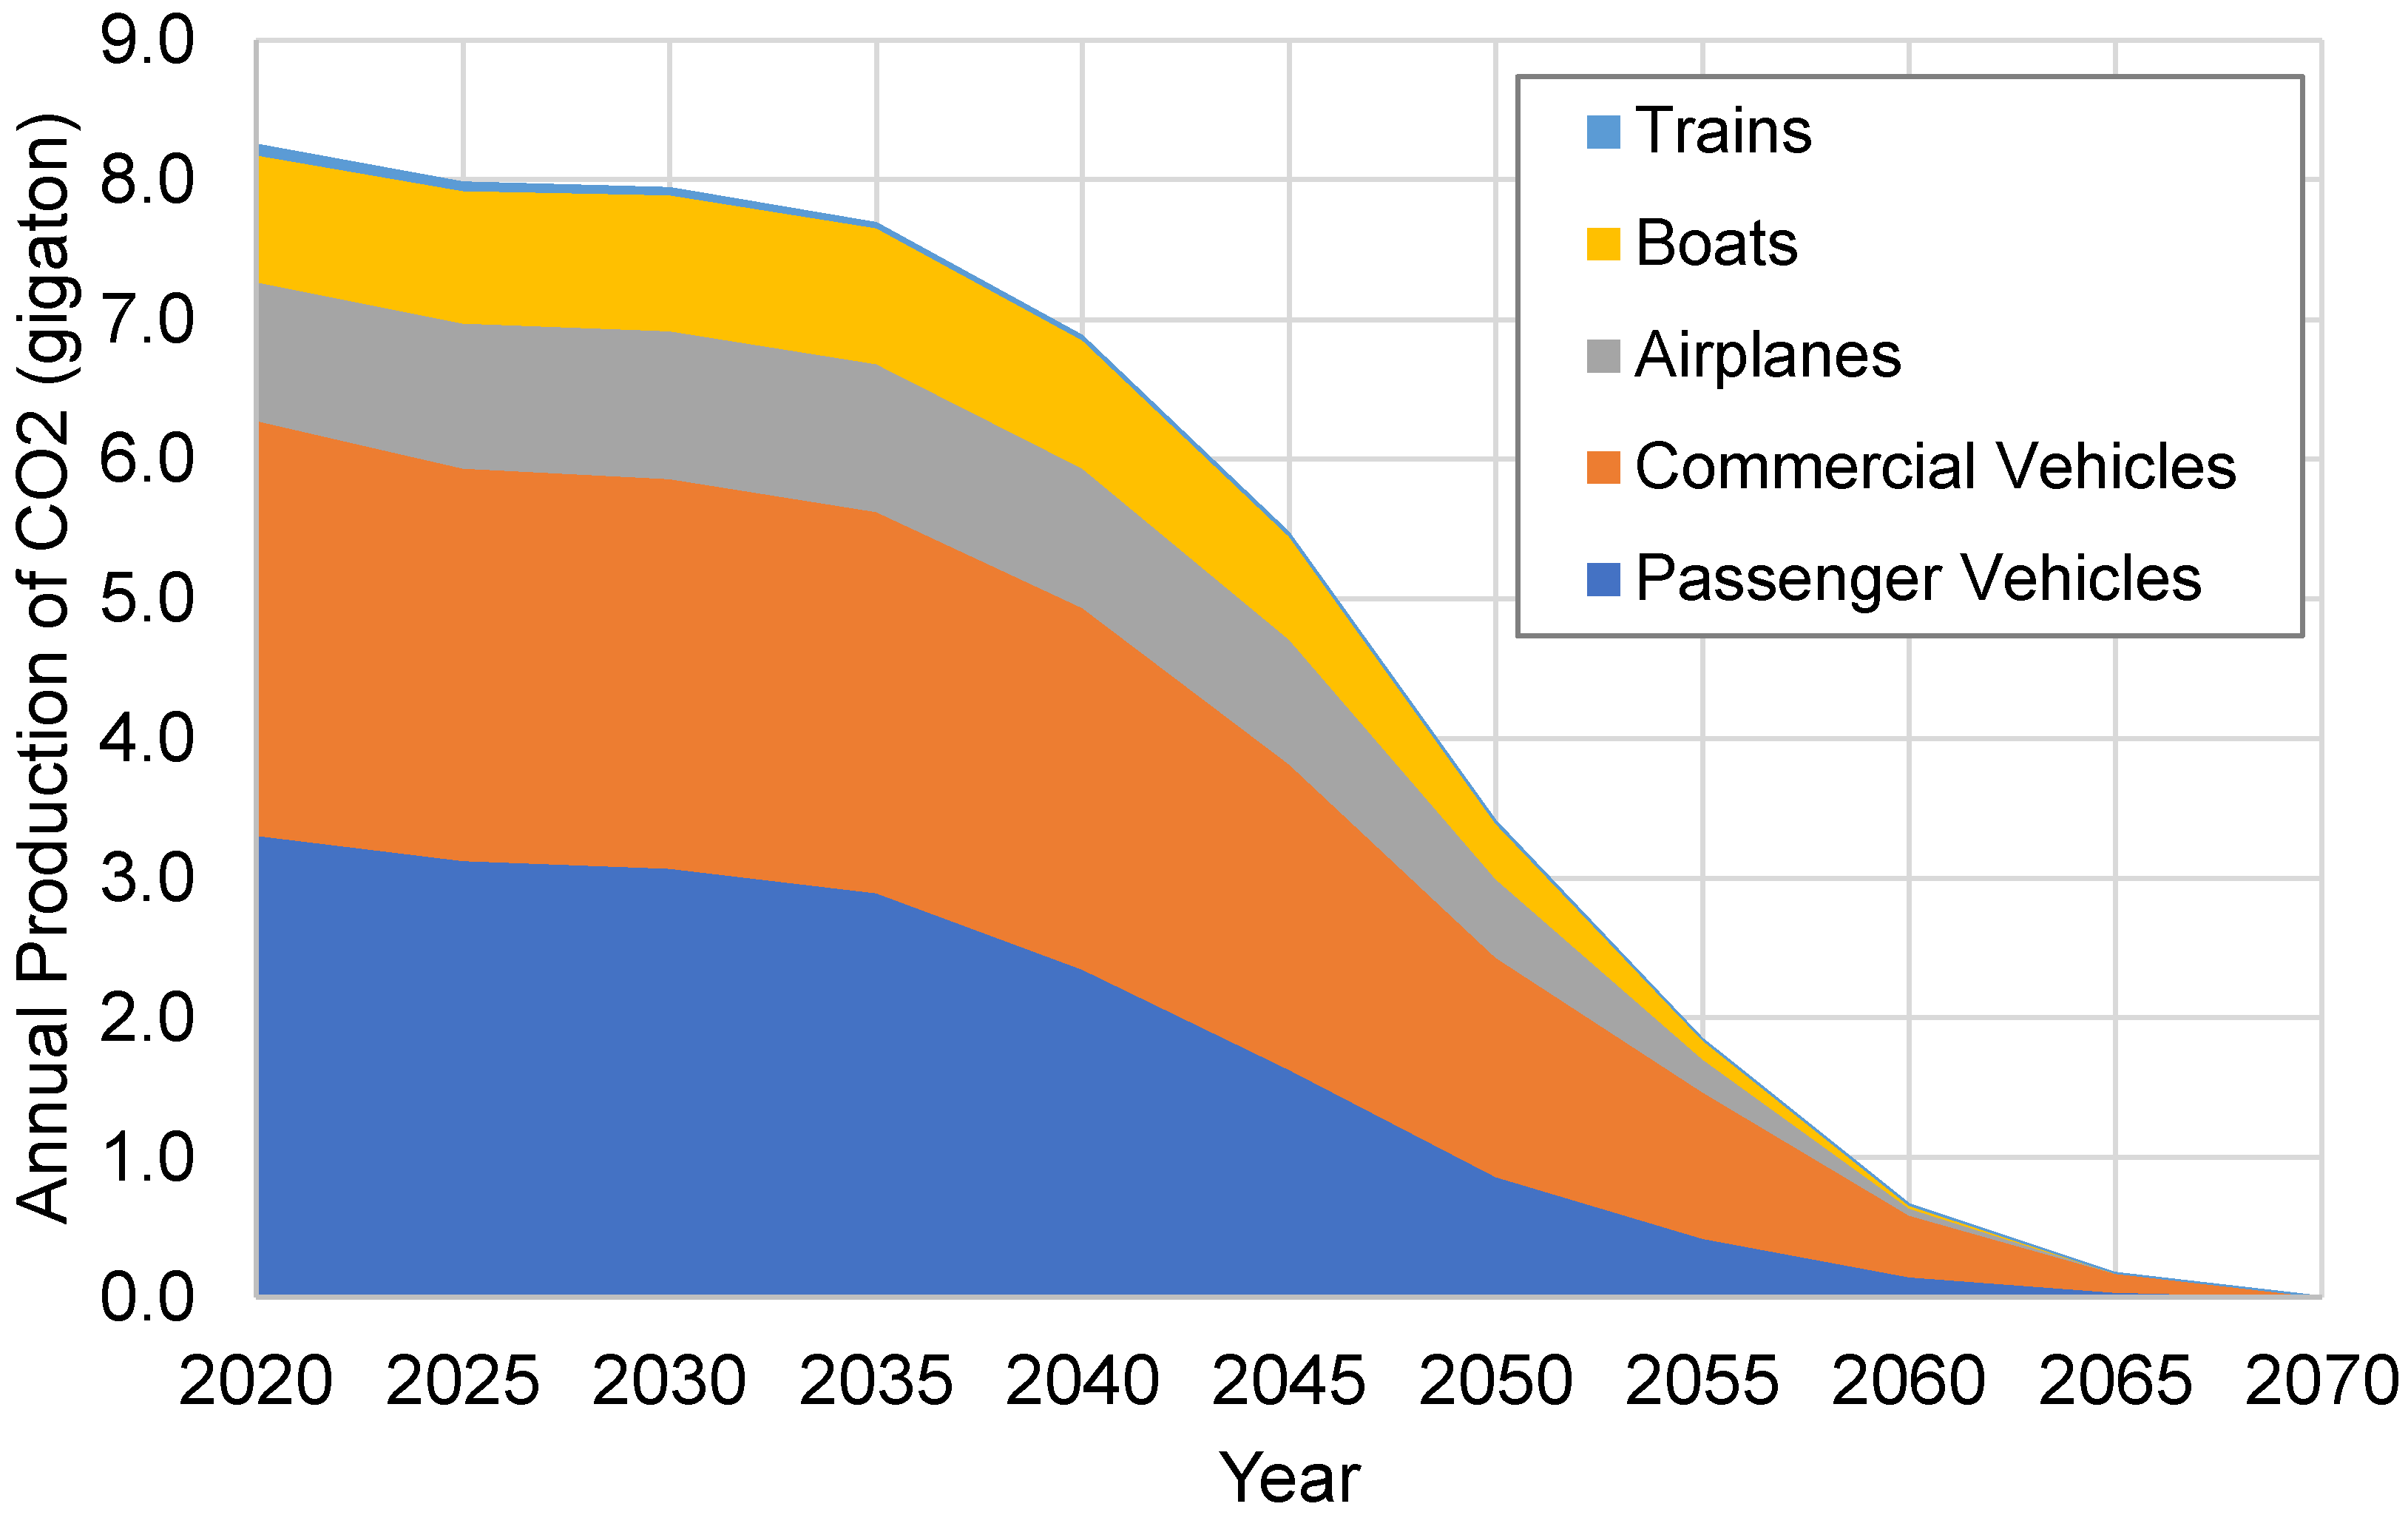
Figure 9 plots the projected amount of carbon produced from the transportation sector per year from 2020 to 2070 for each sector. Despite an increase in demand and transportation usage of one percent per year, advancements in technology are able to reduce the overall carbon emissions to a negligible amount by 2070.
The model found that between 2020 and 2035, there is a gradual reduction in the amount of CO2 produced from the transportation sector. The improvements in technology counteract the increased demand. However, in 2035, the introduction of Mg-ion batteries, coupled with updates to the electricity grid, result in a reduction in carbon emitted from passenger vehicles. Going out to 2070, as all cars transition to electric, the CO2 emissions eventually go to zero. Additionally, the development of sustainable aviation fuels will allow the aviation industry to achieve carbon neutrality by 2050. In 2040, commercial vehicles and boats will begin transitioning to hydrogen, allowing for these markets to achieve carbon neutrality by 2070.
6. Model Analysis and Results
6.1. Key Takeaways from the Model
The model found that with wide-sweeping improvements to the grid and advancements in several key technologies, carbon neutrality can be achieved by 2070 for the transportation sector. While these new technologies are key to eventually replacing fossil-fuel powered vehicles, a larger issue is the state of the grid. Without increased investment in renewable, nuclear, and CCS grid power, advancements in technology will be insufficient for meeting sustainability goals.
While renewable power sources, including solar, wind, and hydroelectric, will continue to develop and replace traditional coal-power plants, CCS offers the opportunity to create clean electricity to support the near-term transition to electric vehicles. Near-term investments in CCS for both coal and natural gas power plants would provide for a large overall reduction in the carbon output from the transportation sector.
The model also found that a large impact can be realized early on through investment in biofuels. Indeed, biofuels have the potential to create a large impact across all five transportation sectors. While not a long-term solution for the ground vehicle market, increased developments in biofuels are key to sustainability in the aviation market.
Overall, the technology roadmap in this analysis found that the future of the transportation sector is somewhat eclectic, consisting of a number of key technologies. This provides a certain amount of risk-mitigation to the industry, should a technology not come to fruition. For example, if hydrogen storage issues are not solved, commercial truckers and maritime applications can use a combination of battery technology and biofuels.
6.2. Application of Model to Support Decisions
The outputs from the model indicate that carbon neutrality is achieved by 2070 for the transportation sector. In the process, a total of 224 gigatons of CO
2 are emitted. This is only the case if the technology roadmap in
Figure 6 comes to fruition. The true value of such a model is that it provides insight into the impact of changes in the technology roadmap. The technology roadmap is based on availability dates and advancement rates from the literature. Regardless, there is substantial uncertainty on these values. For example, the battery, hydrogen, and biofuel availability dates are somewhat ambitious and likely will not be available on the predicted timeline.
Table 1 displays the impact of each of these technologies not being commercially available for another 10 years. For example, alternative battery technology would be available in 2045, as opposed to 2035.
As expected, the total amount of carbon produced substantially increases, especially with delays in battery and biofuel technology. However, in all cases, carbon neutrality could still be reached by 2070. This is likely because the model indicates that the primary source of carbon from 2050 onwards is from the grid production of electricity and hydrogen for passenger and commercial vehicles. As such, the roadmapping effort indicates that grid updates are likely being outpaced by other technologies. Regardless, delaying the new technologies does substantially increase the cumulative amount of CO2 emitted.
Table 2 provides the impact of accelerating and decelerating the growth rate for renewable grid sources and CCS. The baseline model assumed a growth rate of seven percent for renewable energy sources for the grid, including hydro, wind, and solar power. When the value changes to six percent, carbon neutrality is not achieved until 2090. Similarly, when the value shifts to eight percent, carbon neutrality can be achieved by 2060. As expected, the shorter timeline is associated with a substantially lower cumulative CO
2 footprint. The results indicate that modest increases in renewable energy can result in substantial reductions in global CO
2 emissions.
The other key investment is CCS. The current model assumes an annual two percent increase in coal and natural gas facilities with CCS, whether they are renovated or new facilities.
Table 2 indicates the change that can occur if the value is decreased to one percent or increased to three percent. These values indicate that the impact is quite substantial of reducing or increasing the number of CCS facilities, especially since these facilities help address the carbon footprint in the near- and mid-range when the annual carbon production is the highest.
As such, this model indicates that policies addressing upgrading the grid to increase renewable energies and incorporate CCS are more important towards reaching sustainability goals than investing in new technologies. Delays in the commercialization of new technologies would be less substantial than delays in updating the electric grid.
6.3. Cost and Policy Considerations
Achieving carbon neutrality will not be possible without relevant and supportive policies. Indeed, across the world, countries need to commit to sustainability. Many countries have made commitments to the Paris Accords and the general global trend indicates that countries are adopting sustainable practices. However, for the model to come to fruition, countries must invest in new technologies and updates to the electricity grid.
Many of the changes indicated in this study are driven by market demands. Indeed, renewable energy is generally cheaper than coal, so it makes logical sense that coal will eventually be phased out by renewables [
2]. Similarly, electric vehicles, over their lifetime, with the proper supporting grid and cheaper battery packs, will save consumers money while also providing sustainability benefits. However, many of these benefits are realized in time and require a substantial upfront cost. This upfront cost can be recouped over time with reduced operational costs.
Furthermore, the study identified that governments should invest in better developing new battery chemistries, means for hydrogen storage, and advanced biofuels. They would also need to help industries develop the infrastructure necessary to manufacture and produce these items, crossing the “valley of death”. These technologies will pay dividends in the long term.
Equally important, countries need to continue to invest in their power grids and move towards increased renewable energy. However, wind, hydro, and solar power will take substantial time to meet the increasing power demands. As such, fossil-fuel-based power plants, especially coal and natural gas, will maintain relevancy for decades. As such, countries need to invest in CCS technology. Investment into CCS technology allows for sustainability goals to be met while also providing for risk mitigation in the event that renewable sources cannot continue their current development timelines.
It is important to note that the current model indicates that at the current renewable energy growth rates and projected technology availability dates, sustainability can be reached by 2070 for the transportation sector. However, as shown in the previous section, increased investments, especially in the grid, can result in sustainability being achieved sooner.
6.4. Comparison to Other Studies
Numerous international organizations, think tanks, and research groups are actively examining the sustainability challenges associated with the transportation industry, as discussed in
Section 2.1. The findings of this study align with those of previous research, which emphasize the critical role of grid upgrades in achieving carbon neutrality.
The primary difference between this study and those studies is that this study goes outwards to 2070, while many of the other studies stop in 2050 to align with the Paris Accords. This study predicted that by 2050, the carbon footprint will be reduced by 60 percent; meanwhile, other studies predict a much larger reduction. The other studies predict the aviation and marine industries as having reduced their carbon emissions by half by 2050 from the inclusion of biofuels [
1,
2,
3,
4]; this model found similar results. However, many of the studies predict a much larger reduction in carbon footprint for ground vehicles [
1,
2,
3,
4]. This is in large part due to more aggressive annual increases in renewable energy and CCS than what was used in this study [
1]. Furthermore, this study over predicts the population growth rate, resulting in a higher demand for transportation energy.
While this study included the role of key technologies, several of the other studies assumed that the technology will be available [
2,
4]. This exclusion is well in line with the results from this study, which found that these technologies can have significant slippage but have minimal impact on the timeline.
Additionally, the other studies indicate the importance of CCS towards meeting sustainability goals, noting an initial increase in fossil-fuel-based power plants for providing electricity for an increasing number of electric vehicles. Similarly, these numbers found that in time, many of these facilities can be shut down as the grid is able to use more renewables [
2,
4,
5].
6.5. Limitations of Model
This study aimed to develop a straightforward model for analyzing the carbon footprint of the transportation sector, encompassing passenger automobiles, commercial ground vehicles, aircraft, boats, and trains. The model utilizes a technology roadmap to determine the availability of new technologies and incorporates their impact on each transportation sector. However, the simplicity of the model also entails certain limitations.
First, the study relies on a considerable number of assumptions, outlined in
Section 5.2, based on the existing research and literature. Nevertheless, these assumptions carry a degree of uncertainty.
Furthermore, the model does not consider changes in demand beyond those associated with population growth. Factors such as the implementation of high-speed train networks or government policies such as congestion taxes can significantly influence the transportation demand.
Additionally, while the study briefly addresses the cost aspects of these technologies, it does not conduct an in-depth comparison of cost differences between them. For instance, the assumption that third-generation biofuels will be cost-competitive or cheaper than kerosene or diesel could benefit from a more detailed analysis to gain insights into market shares. Similarly, the roadmaps qualitatively explore the raw material sector. For example, magnesium-ion is much more sustainable than lithium-ion; however, the model does not capture all of the complex interactions between the transportation sector and the raw material sector.
The primary limitation of this study lies in treating global energy users as a homogeneous group, disregarding significant disparities between countries. Some countries exhibit stronger commitments to sustainability than others, and the transition to a more sustainable planet will have varying impacts, positive or negative, on different countries. However, the underlying methodology presented in this paper can be applied to an individual country as opposed to the entire world.
7. Conclusions and Future Work
This study presented a simplistic model for estimating the carbon footprint of the transportation sector as it progresses towards carbon neutrality. The model can readily be reconstructed by other users to analyze the impact that different policy decisions can have on the global transportation market’s move to sustainability.
Underlying this model is a technology roadmap that includes the different technologies and infrastructure improvements necessary for achieving carbon neutrality. The technologies included advances in batteries, hydrogen storage, and biofuels. Meanwhile, the infrastructure upgrades focused primarily on upgrading the electric grid to provide the necessary electricity to recharge batteries and produce hydrogen for future vehicles.
The model indicates that carbon neutrality can be achieved by 2070 following this roadmap. The model further found that this target can still be achieved even if the technological advancements fall behind schedule. However, any slippage in updating the grid to incorporate renewables and CCS will result in carbon neutrality being achieved at a later date, resulting in a large net increase in cumulative carbon emissions.
This study will continue to evolve and account for new technologies that may potentially impact the technology roadmap to sustainability. Future versions of this model will include aspects not considered in this study, including the interplay between the different markets, government policies tied to energy demand, and variations between different countries.


