Article

Improving Mobile Game Performance with Basic Optimization Techniques in Unity

by
Georgios Koulaxidis
* and
Stelios Xinogalos
*
Department of Applied Informatics, University of Macedonia, GR-54636 Thessaloniki, Greece
*
Authors to whom correspondence should be addressed.
Modelling 2022, 3(2), 201-223; https://doi.org/10.3390/modelling3020014
Submission received: 20 January 2022 / Revised: 13 March 2022 / Accepted: 25 March 2022 / Published: 28 March 2022

Abstract

:
Creating video games can be a very complex process, which requires taking into account various hardware and software limitations. This process is even more complex for mobile games, which are limited to the resources that their platforms (mobile devices) offer in comparison to game consoles and personal computers. This restriction makes performance one of the top critical requirements, meaning that a videogame should be designed and developed more carefully. In order to reduce the resources that a game uses, there are optimization techniques that can be applied in different stages of the development. For the purposes of this article, we designed and developed a simple shooter videogame, intended for Android mobile devices. The game was developed with the Unity game engine and most of the models were designed with the 3D computer graphics software Blender. Two versions of the game were developed in order to study the differences in performance: one version that applies basic optimization techniques, such as low poly count for the models and the object pooling algorithm for the enemy’s spawn; and one where the aforementioned optimizations were not used. Even though the game is not large in scale, the optimized version achieves a better user experience and needs less resources in order to run smoothly. This means that in larger and more complex video games these optimizations could have a bigger impact on the performance of the final product. To measure how the techniques affected the two versions of the game, the values of frames per second, batches and triangles/polygons were taken under consideration and used as metrics for game performance in terms of CPU usage, rendering (GPU usage) and memory usage.

1. Introduction

With the evolution of technology, mobile devices like smartphones and tablets have acquired a particularly important place in society. In the field of the video game industry, they have succeeded in becoming the top platform on the market, due to their portability and the majority of affordable games that they offer [1]. Nowadays, mobile video games are one of the most popular ways of entertainment [2,3]. However, in order to achieve both portability and size restrictions, several compromises have to be made in terms of hardware components and software. This fact creates a significant difference in performance compared to a computer or a console. Despite the numerous videogames that exist and the popularity that they have achieved, game development is not an easy procedure, especially when the target platforms are mobile devices. Therefore, video games for those specific platforms should be designed and developed in such a way that makes proper use of the system resources and at the same time provides a smooth experience for the user.
The literature on various types of mobile games reports various challenges. Trisnadoly and Kreshna [4] in an end user survey of an educational mobile game reported problems in game performance and user satisfaction. The main problems that were recorded after a gap analysis in terms of game performance were: the file size of the game; the duration of installation; and delay between scenes. Xanthopoulos and Xinogalos in a review of location-based services for mobile games investigate the additional challenges imposed by the specific type of mobile games due to the need for determining the user’s location, as well as best practices for battery efficiency and game performance [5]. The additional challenges imposed by the need to determine the location of a user are: providers’ trade-offs in accuracy, speed and battery efficiency; constant re-estimation of the user’s location; and varying accuracy of location estimation from different sources. Chehimi et al. [6] benchmarked the available software and hardware back in 2006 for investigating challenges in the quality of graphics and the underlying effects on battery life for 3D mobile games and highlighted the need for standarization.
No matter what the specific type of a mobile game is, providing a smooth gameplay to the user without using too many system resources requires the application of optimization techniques. Optimization techniques can be applied in every aspect of a video game. For example, during model designing we should avoid adding details to a model by using a higher number of polygons, because this will increase the resources that a system needs in order to render it. In addition, adding these details through a texture is a way to make the rendering procedure less expensive [7]. Another aspect of optimization refers to the game mechanics; for example, efficiently recycling game objects, such as the opponents that need to be spawned and eliminated multiple times.
Choi et al. [8] in a contemporary study, proposed a scheme for optimizing energy efficiency (CPU and GPU usage) of mobile games, called System-level Energy-optimization for Game Applications (SEGA). The proposed scheme makes use of the following techniques: Lsync-aware GPU DVFS governor; adaptive capacity clamping; and on-demand touch boosting. Ng et al. [9] proposed an algorithm for optimization of collision detection between groups of objects in mobile shooting games. More specifically, the algorithm aims at an effective usage of memory in order to avoid lags or crashes. Kwon et al. [10] investigated the use of optimization techniques for dealing with the challenge of execution offloading for 3D video games. Their research resulted in a streaming-based execution offloading framework that deals with the data transfer cost of rendering and game state with the ultimate goal of a better user experience. Finally, Hasan et al. [11] present a study on character and mesh optimization for video games (computer and mobile games) based on reducing poly count and deleting parts that are not necessary for a mess.
This article aims to contribute to the research on optimization of mobile games performance by investigating basic optimization techniques for 3D mobile games. This is considered important since, nowadays, the stakeholders include people coming from various fields, as noted in [12]. For example, teachers and students design and implement mobile games for usage as learning aids for their classes or in the context of course/thesis projects, respectively. It is of vital importance to provide guidelines for applying basic optimization techniques that have a proven improvement in game performance and can be applied by people that are not experts in mobile game development. In line with this, in this article we investigate the following research question:
What is the impact of basic optimization techniques on 3D mobile game performance?
The basic optimization techniques investigated collectively include low poly models, merge vertices (as a means of achieving low poly models), textures and materials, occlusion culling and object pooling. These techniques aim to optimize the value of frames per second, batches and triangles/polygons in order to improve game performance in terms of CPU usage, rendering (GPU usage) and memory usage.
In order to investigate the research question of the study, the aforementioned optimization techniques were used for developing a 3D mobile game. Specifically, two versions of the same game were developed and compared, one that uses these techniques and one that does not. The experiment had three phases. Firstly, we compared the data on the lowest FPS at the beginning of the game. Then we captured two snapshots during runtime, one with the lowest FPS value and one from when the FPS value was close to 60, from a set of 900 frames. For each one of the two snapshots we compared the results between the two versions. The first two phases of the experiment took place on a personal computer and were compared based on how they affected CPU usage, rendering and memory. In the last phase the two versions were executed on a mobile phone and some moments during gameplay were compared for studying how they performed on a physical device.
The rest of the article is organized as follows. In Section 2 a brief description of the optimization techniques is provided. In Section 3 the methodology of the study is presented, while in Section 4 the two versions of the mobile game utilized in the study are analyzed. In Section 5 the results of the study are presented and in Section 6 some final conclusions are drawn.

2. Optimization Techniques

Before diving into optimization techniques, we should bear in mind that the mobile devices that are currently on market do not all have the same capabilities [7]. This results from the constant rising of technology and the emergence of more powerful systems. Furthermore, for older models, optimization techniques can prove to be demanding or meaningless because the device does not have enough processing power to meet the requirements of a modern video game [7]. Therefore, the developer should choose from the beginning the range of devices which s/he wants the game to run. This is also the case for studies on the effects of various optimization techniques, such as the ones summarized in the previous section, which always define the devices that were utilized in the experiments.

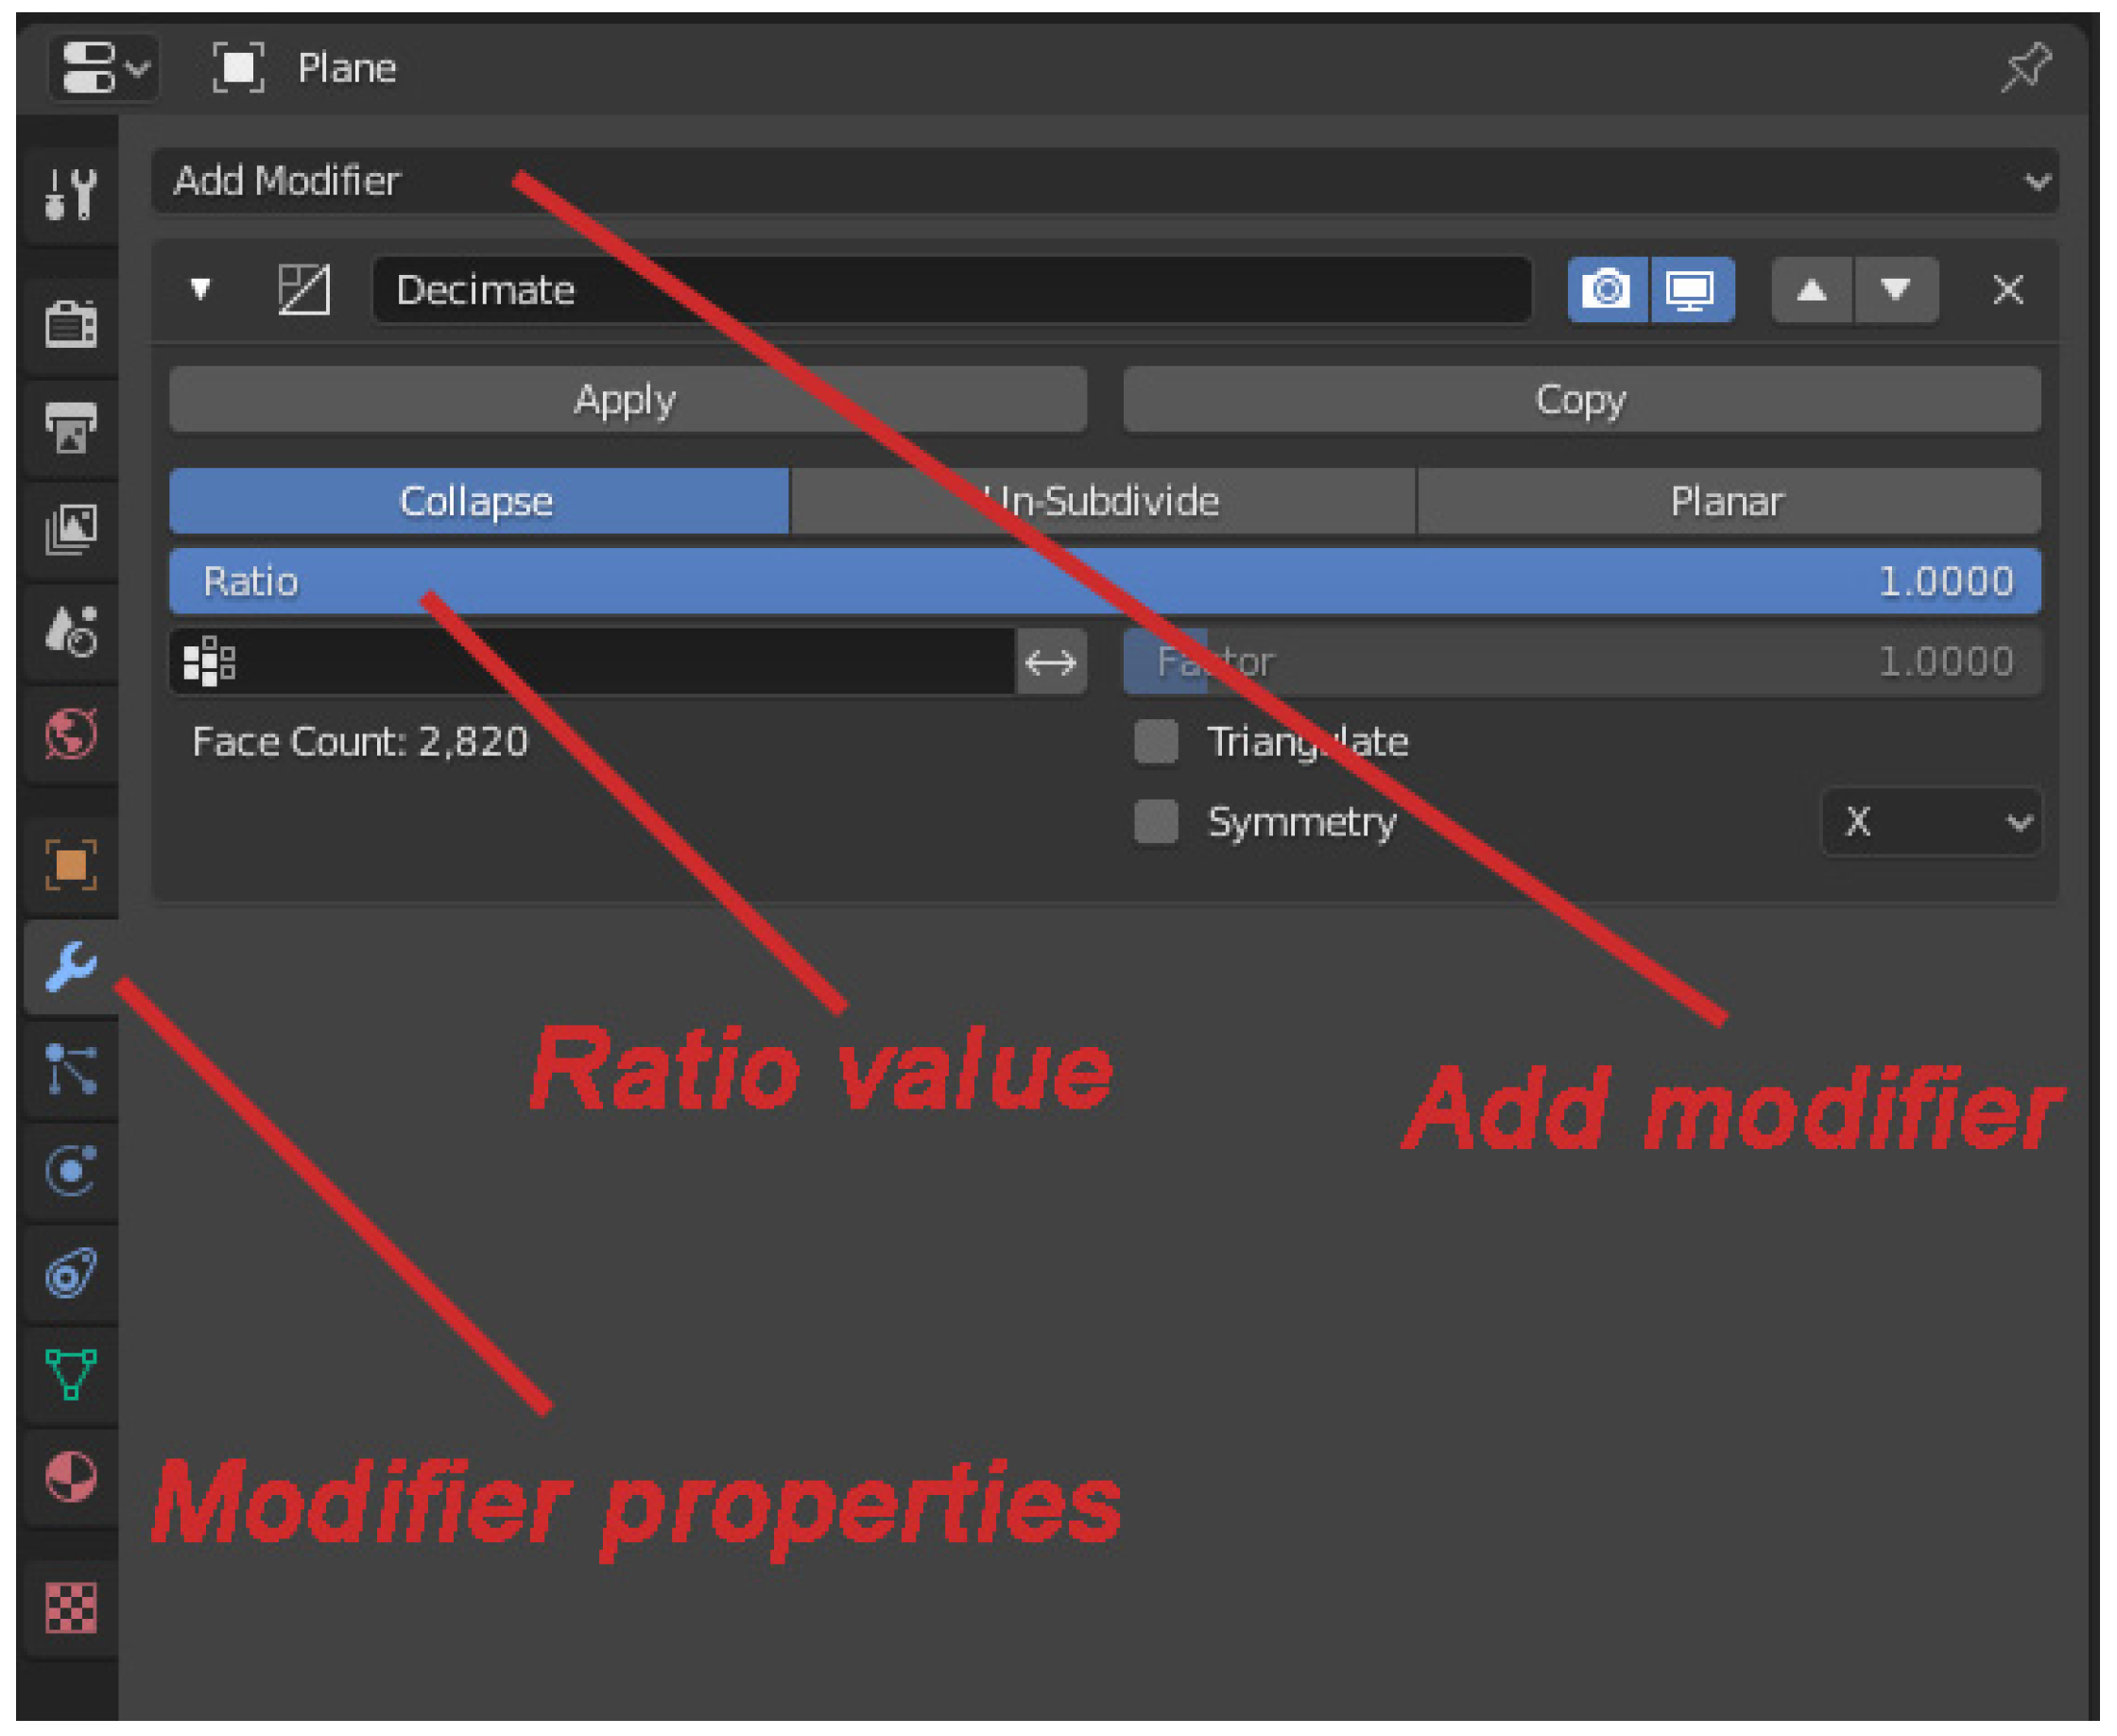
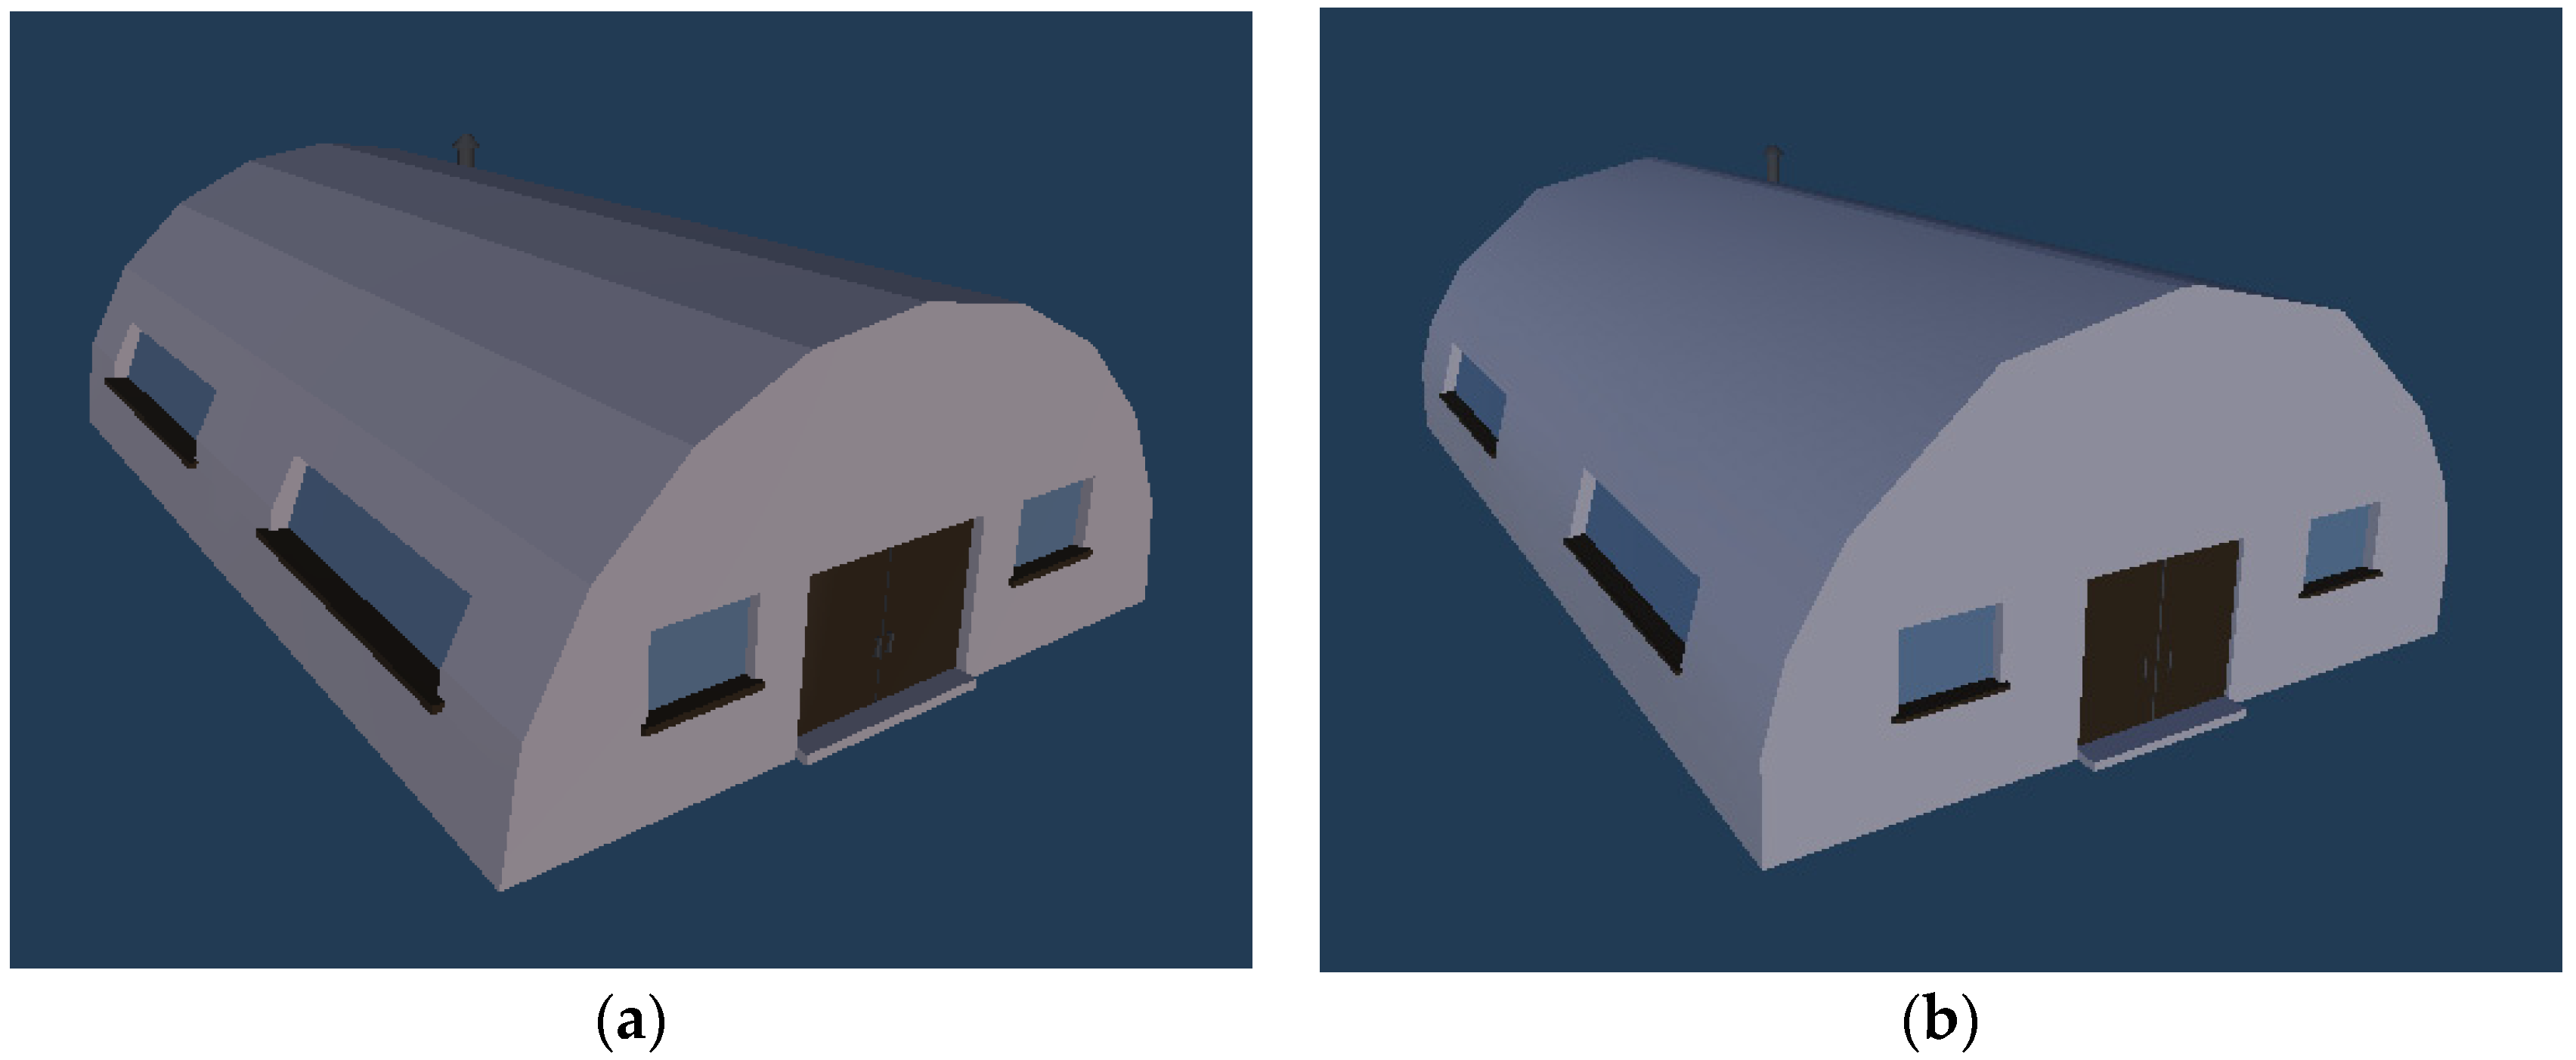
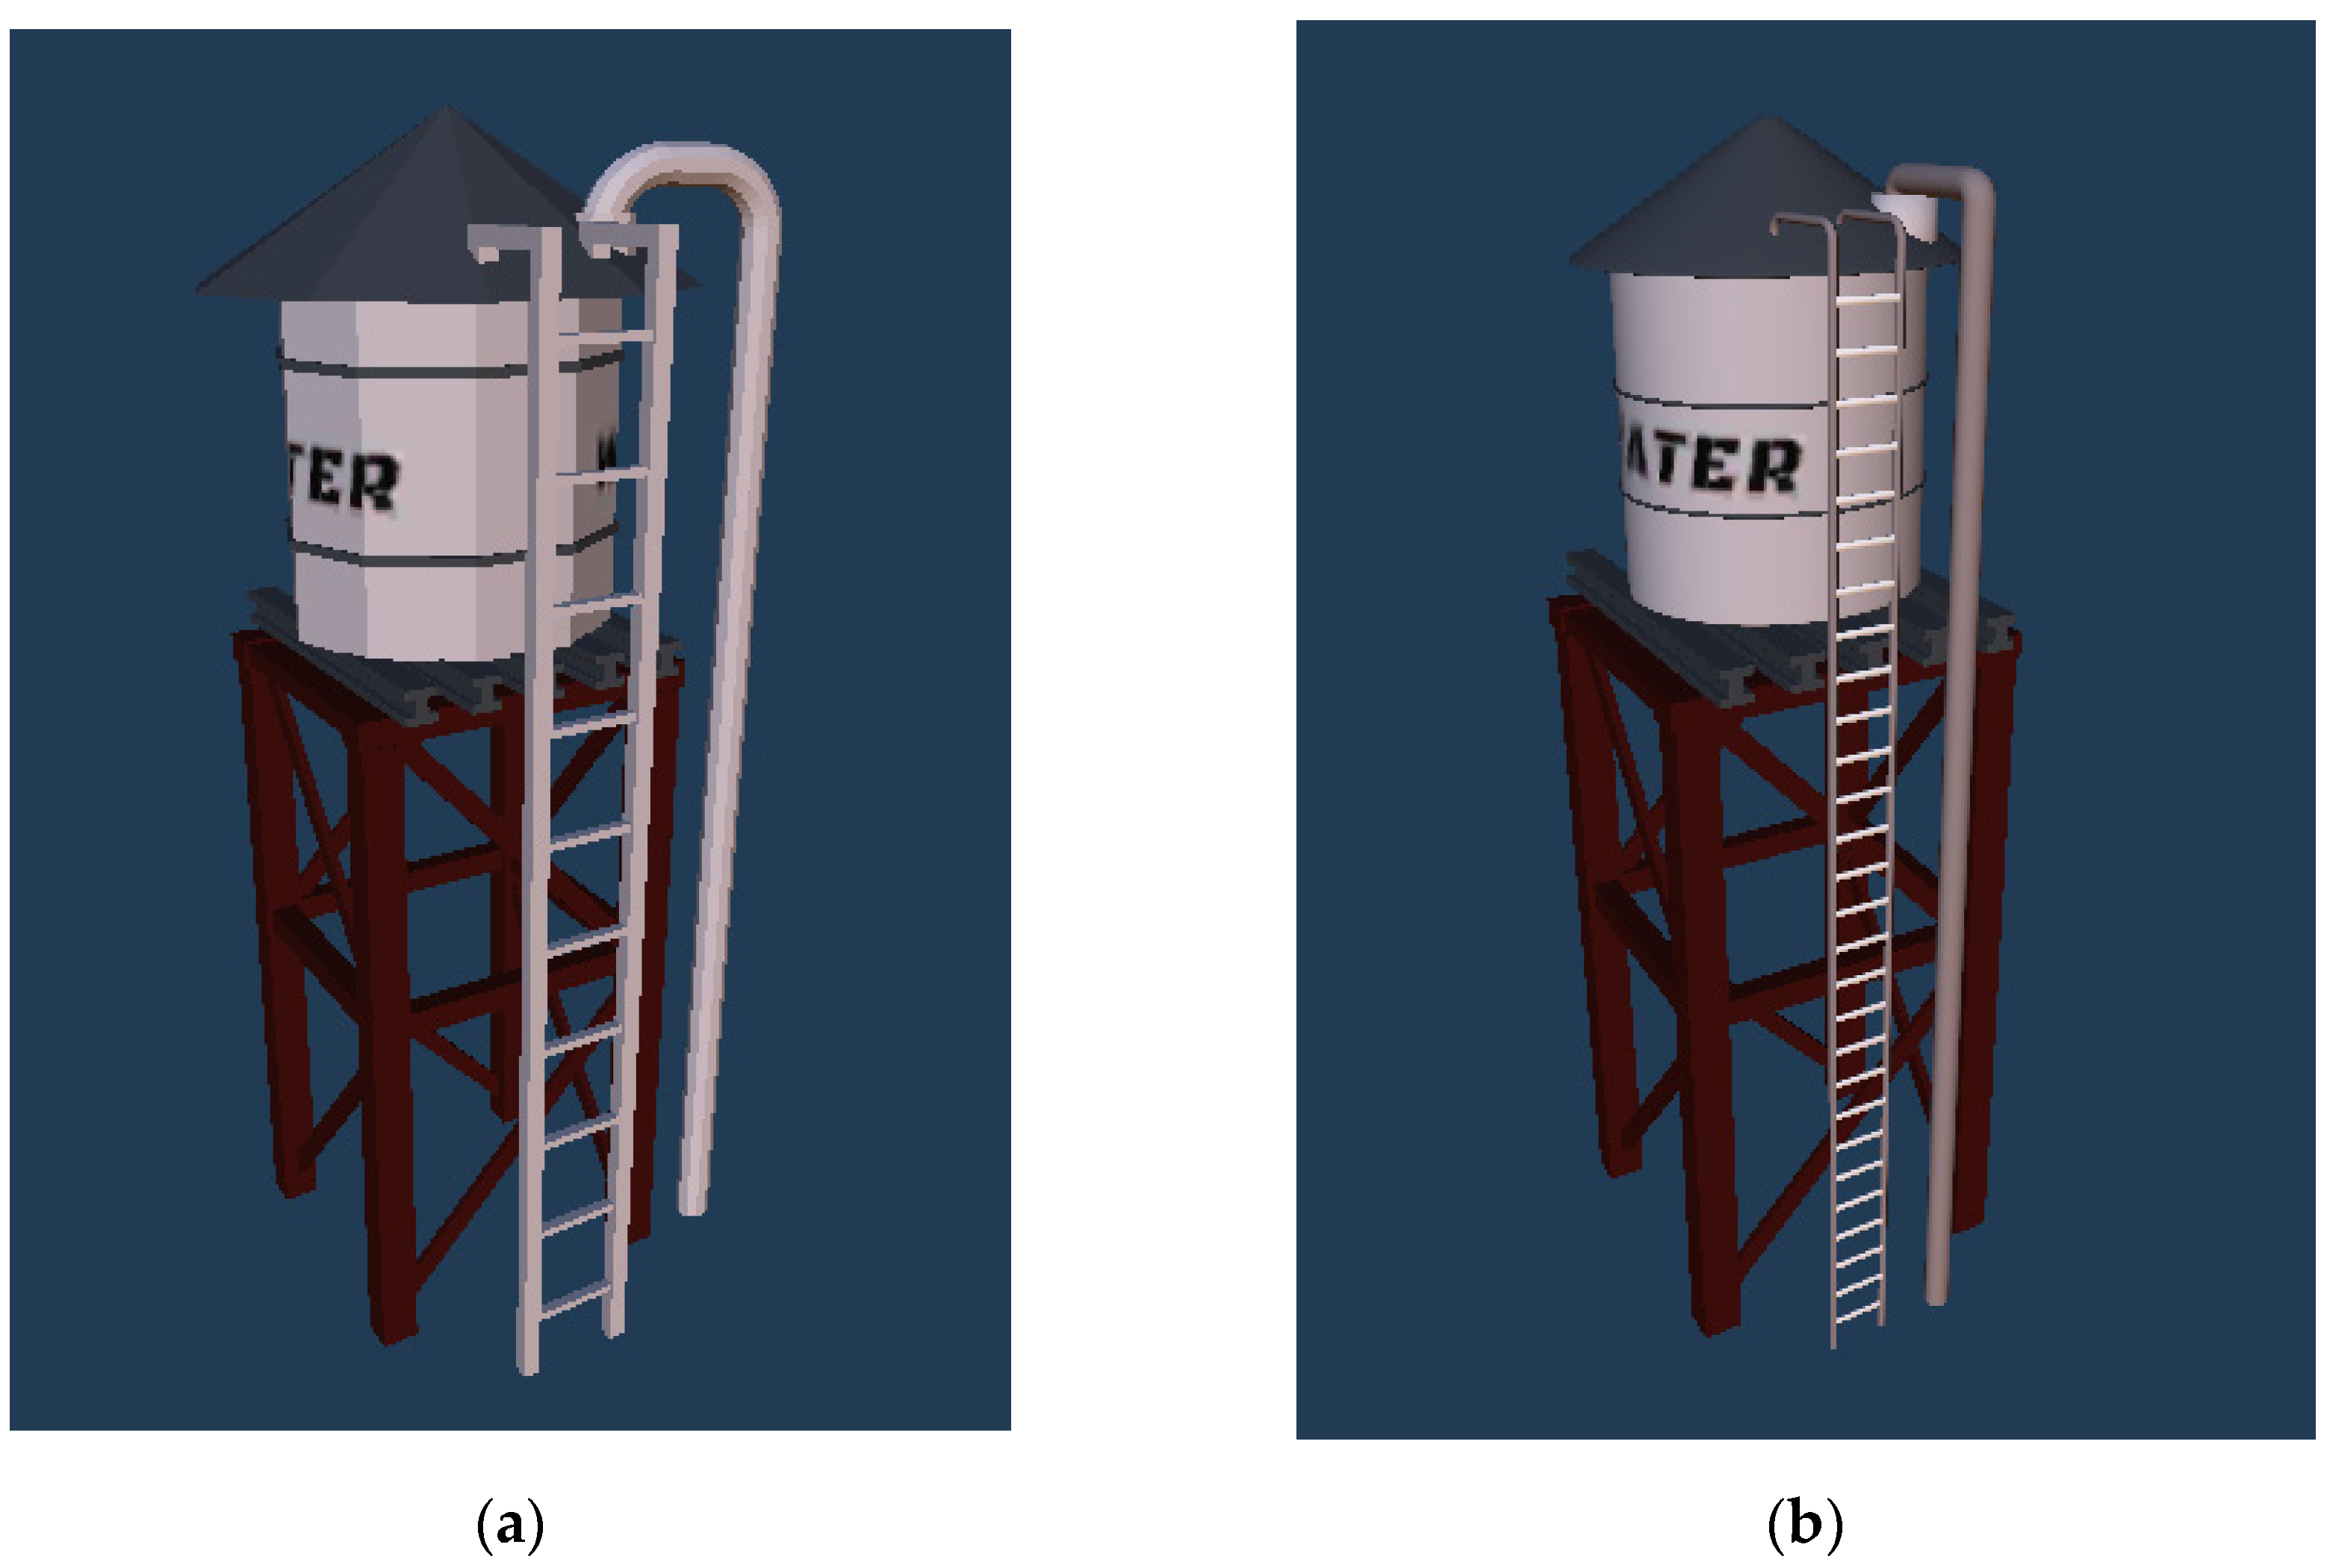
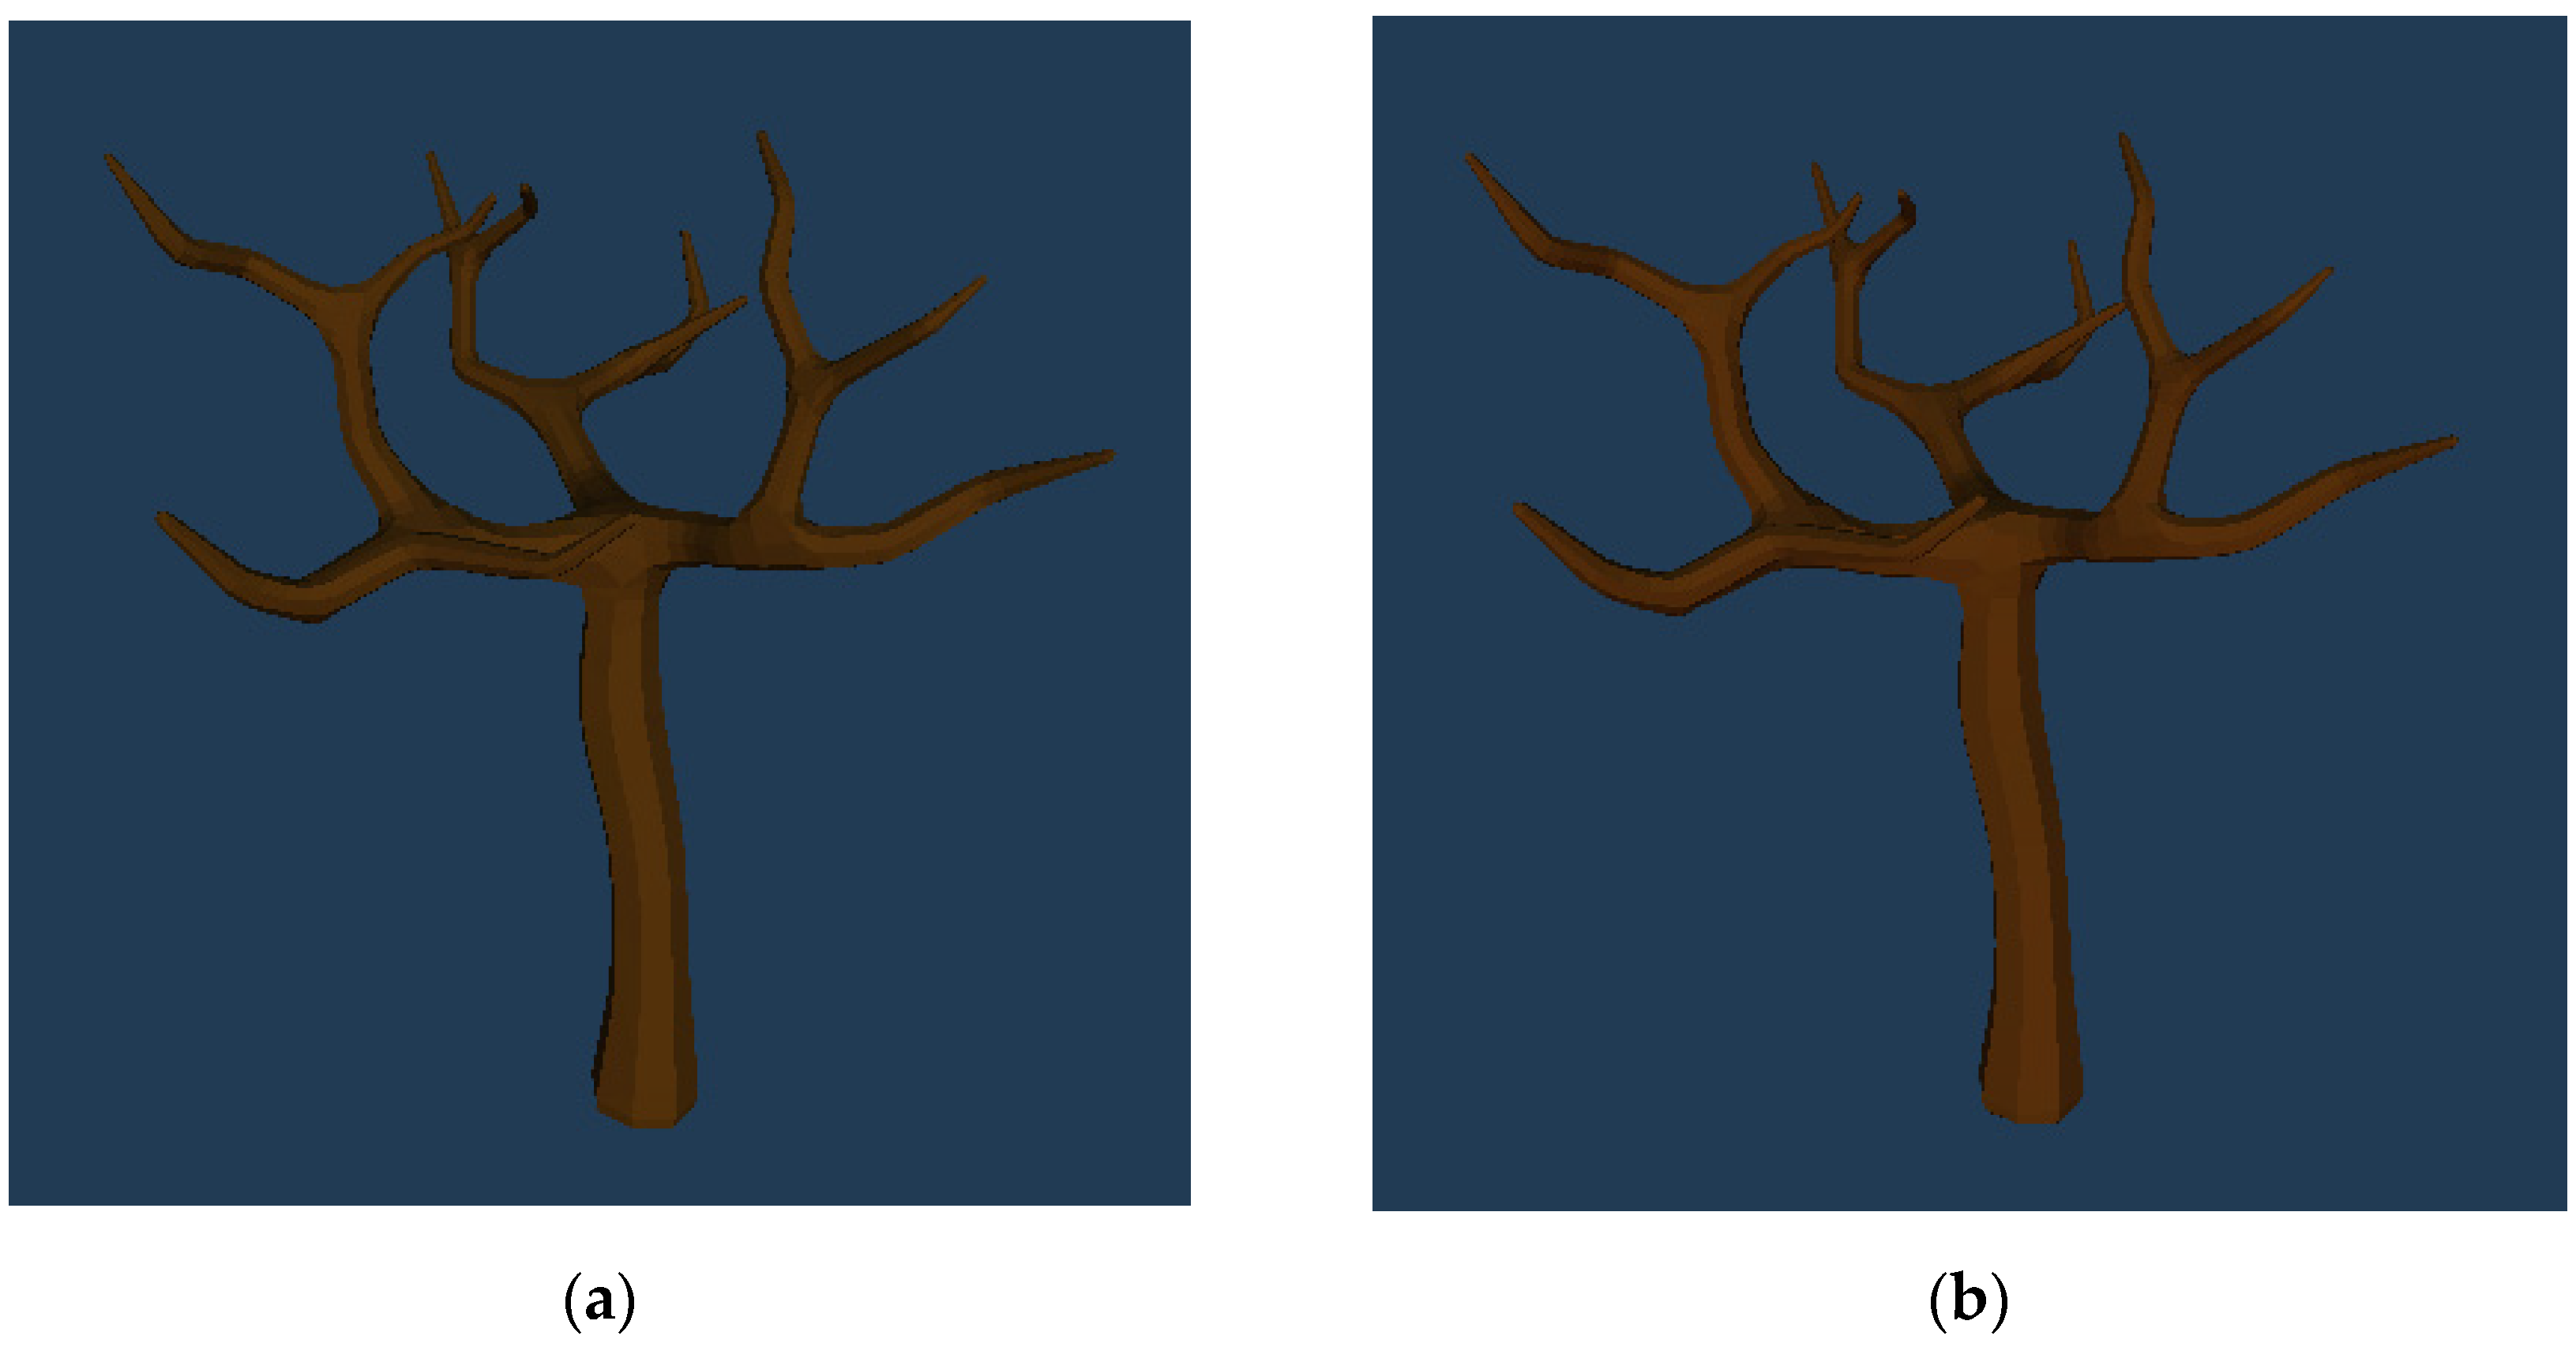
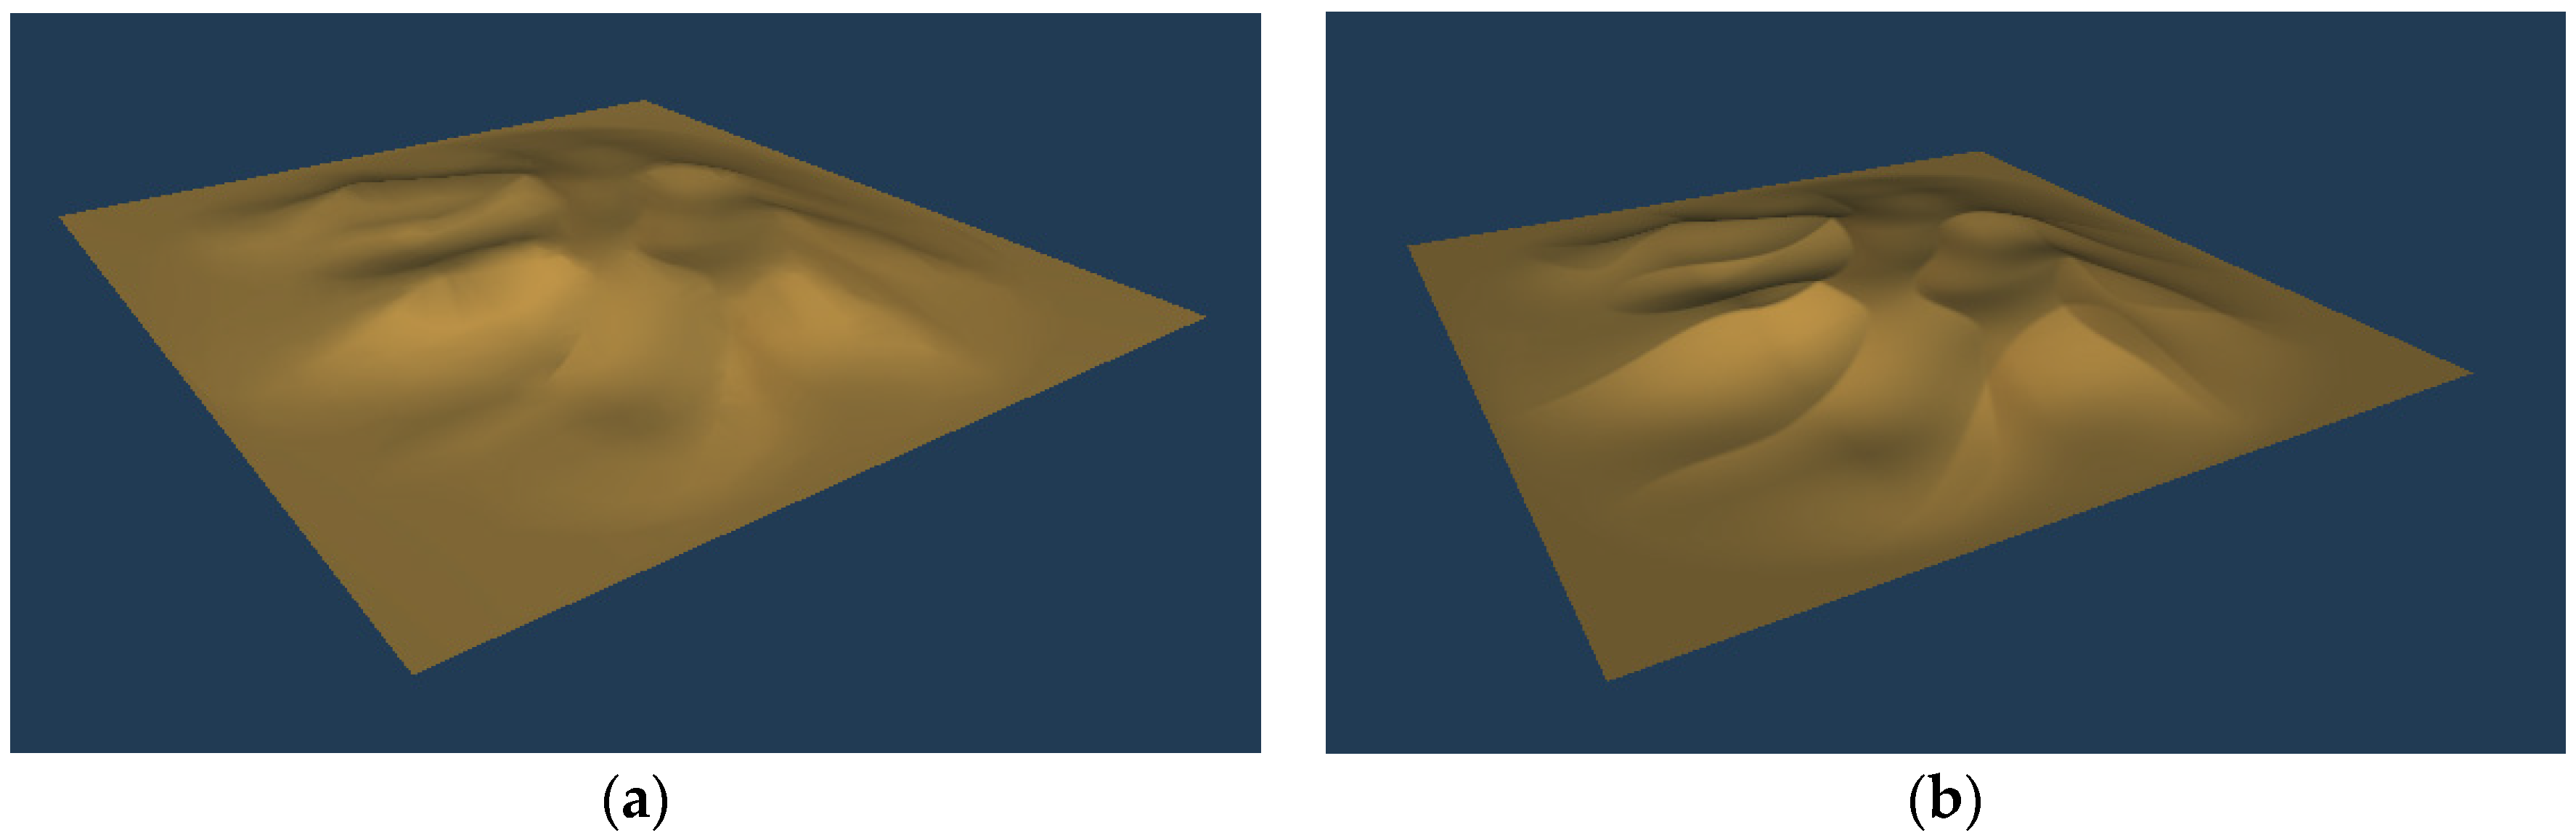
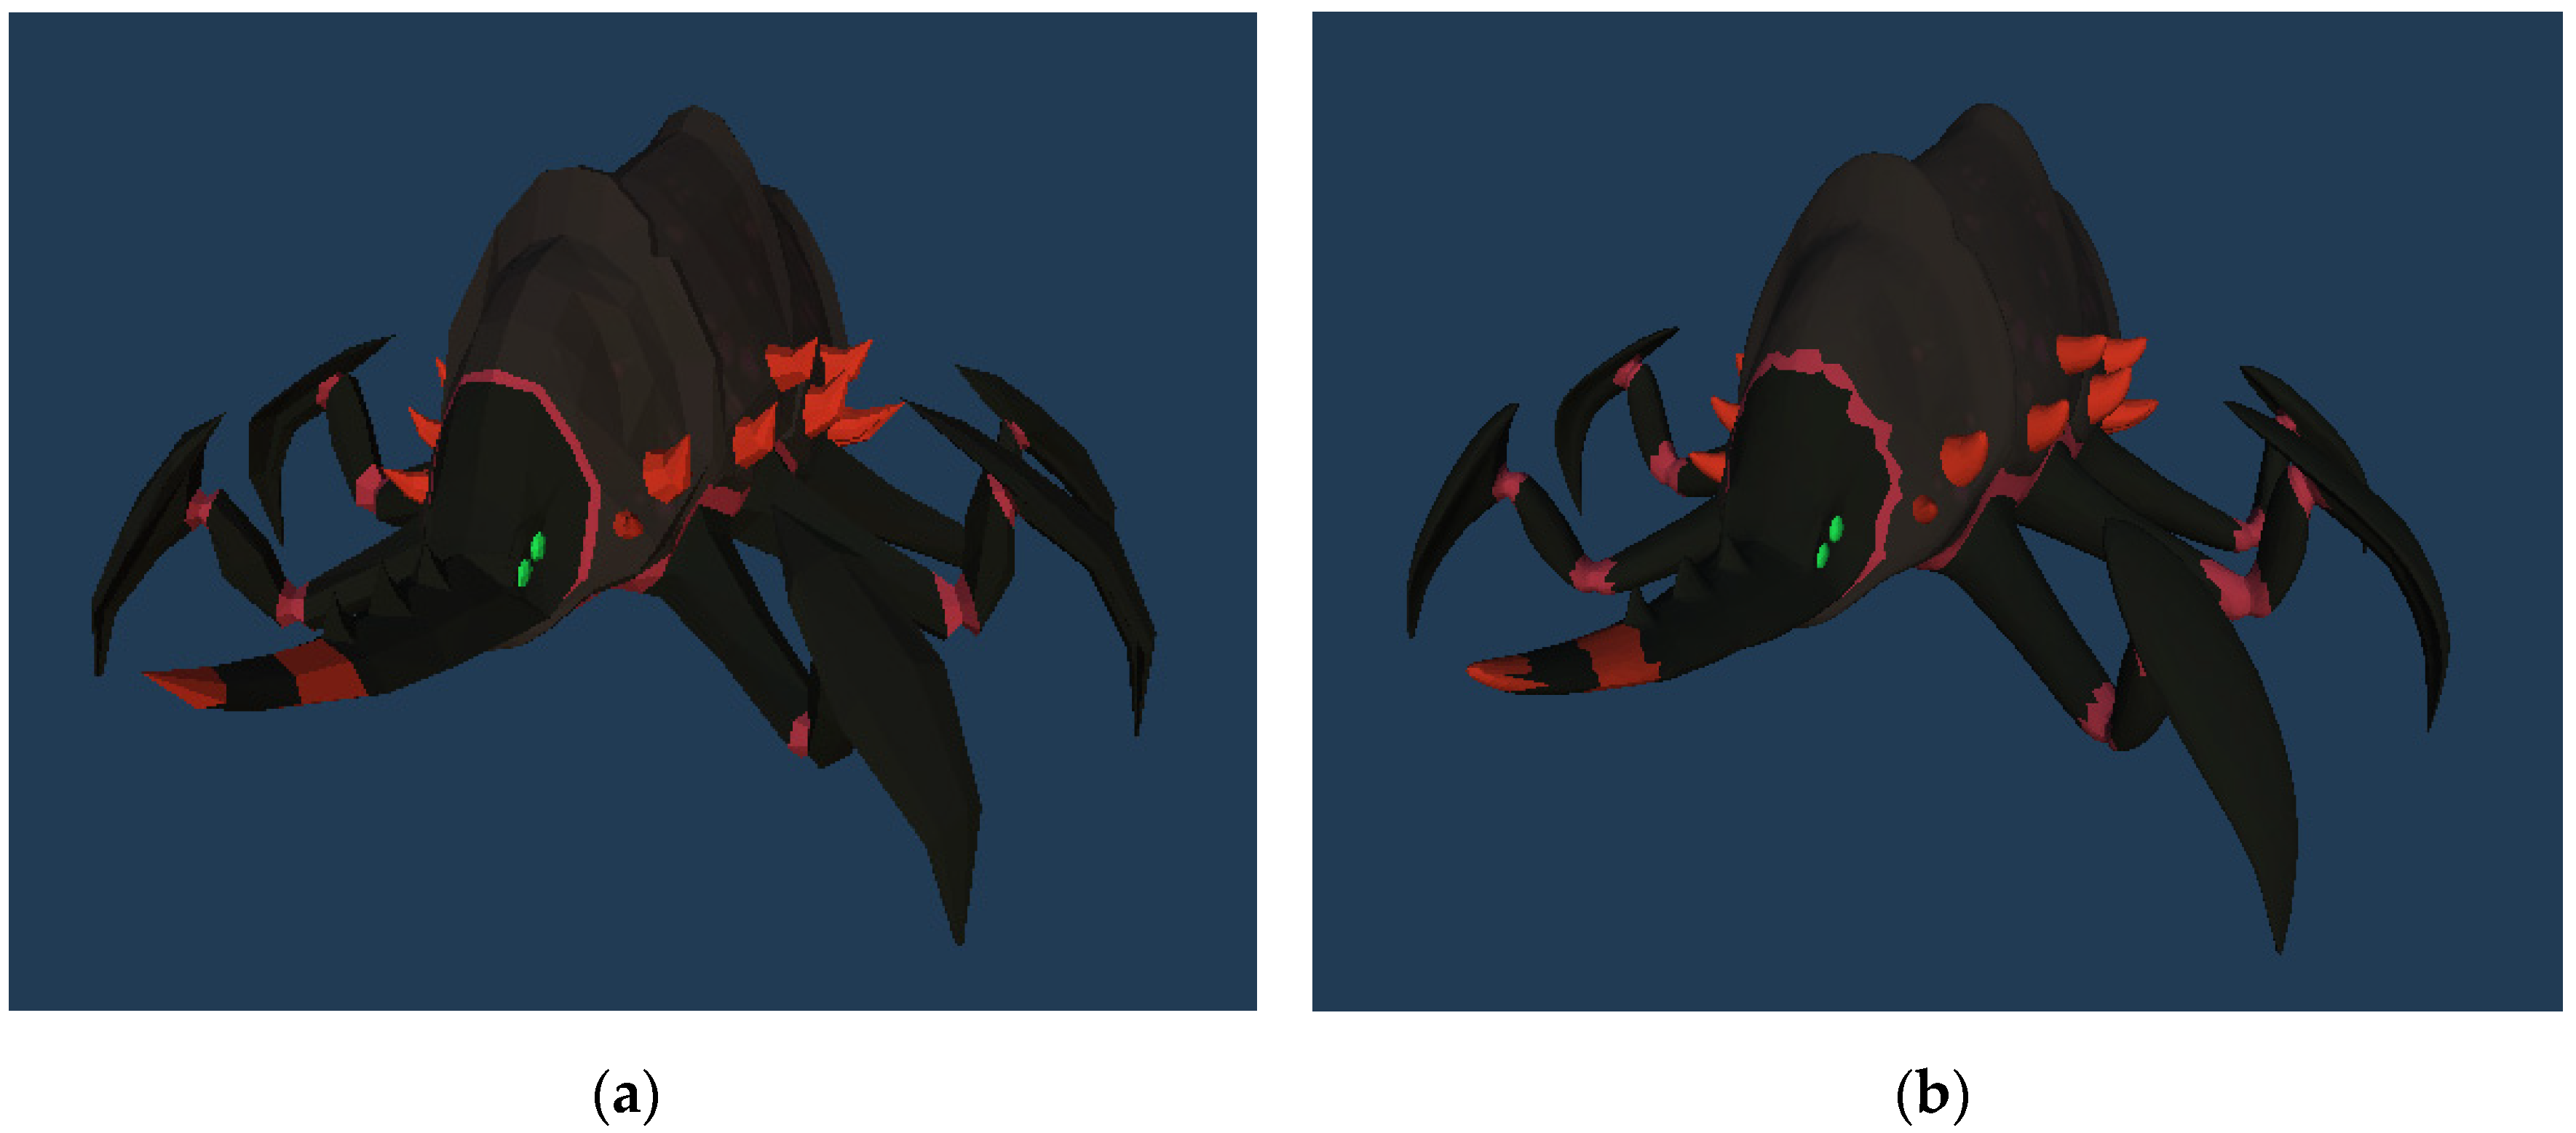
2.1. Low Poly Models
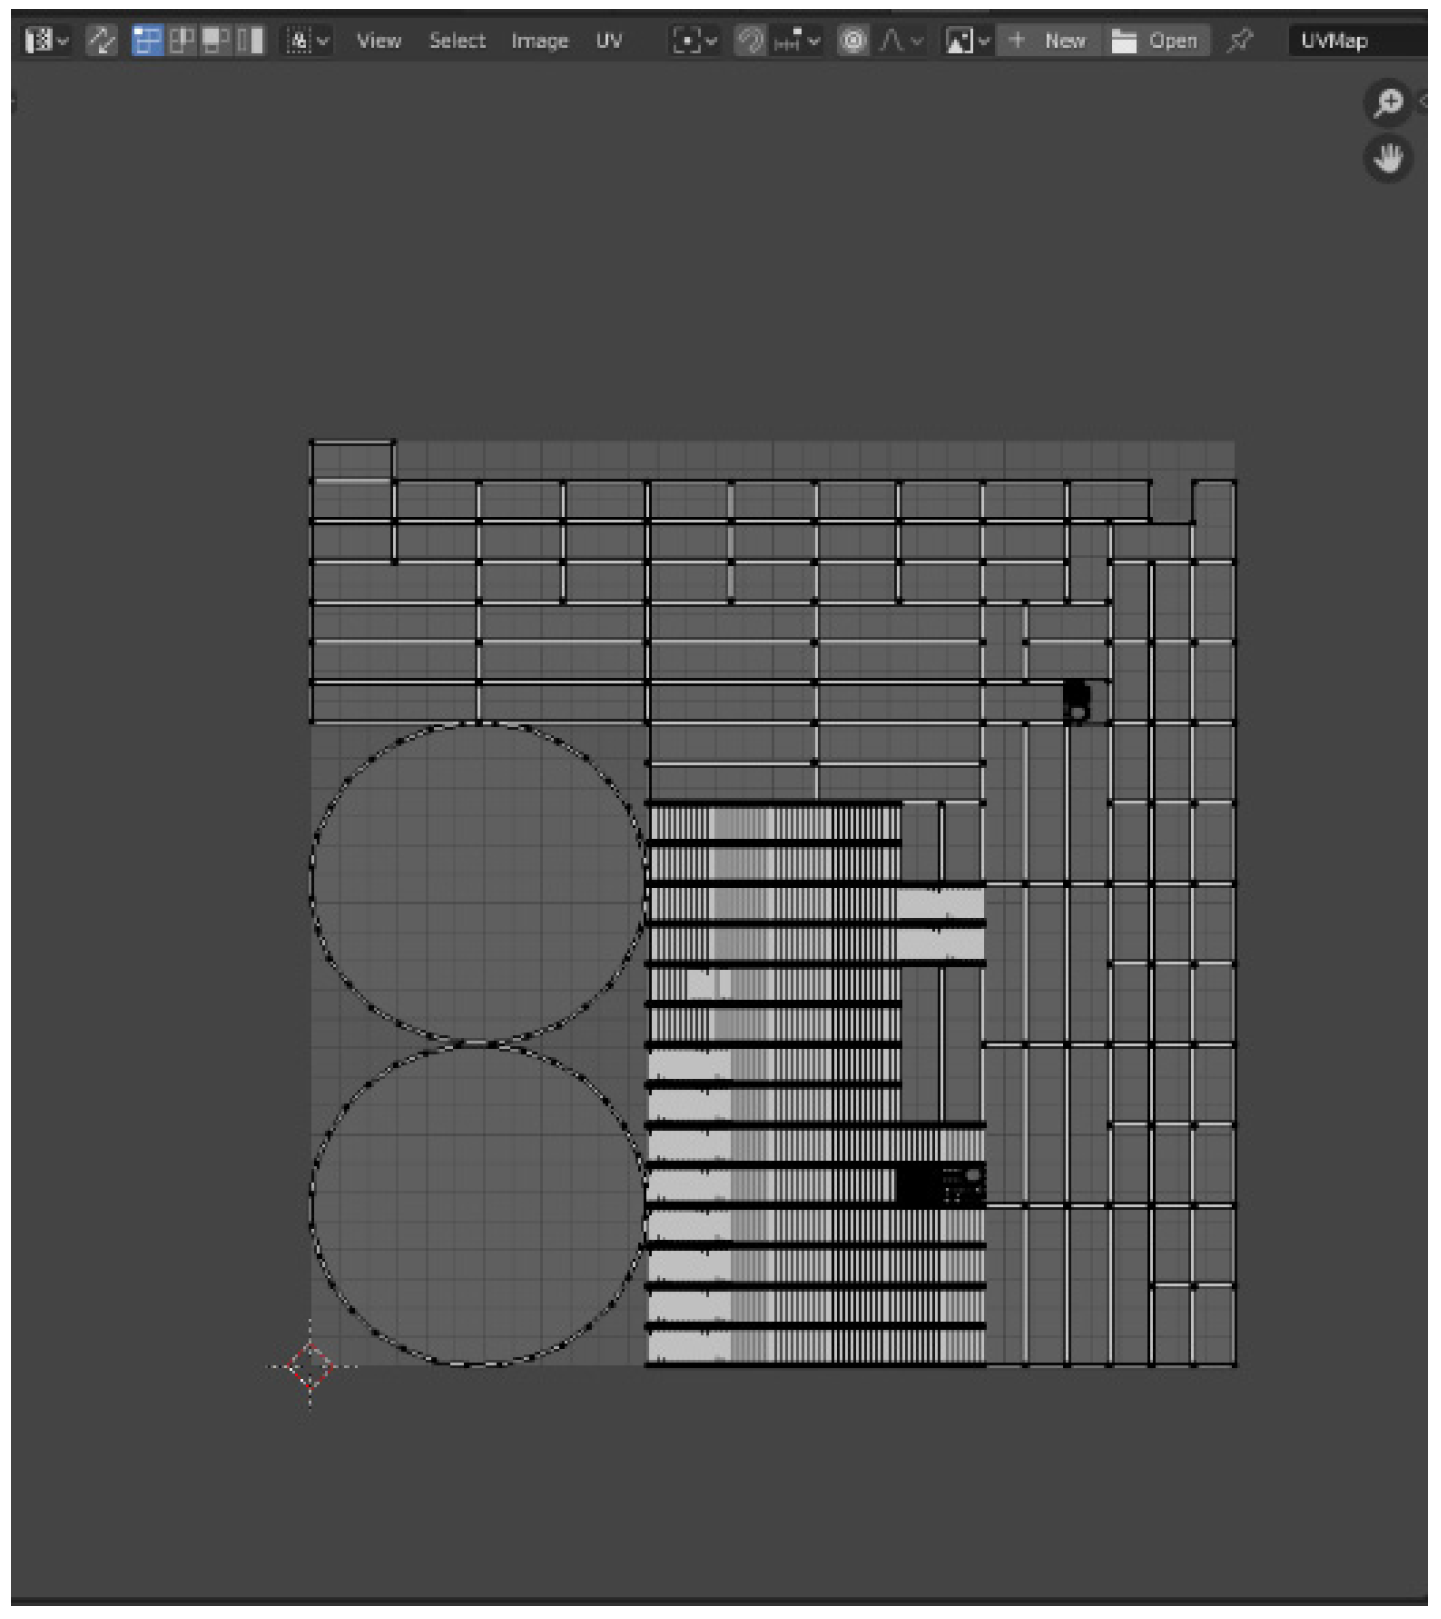
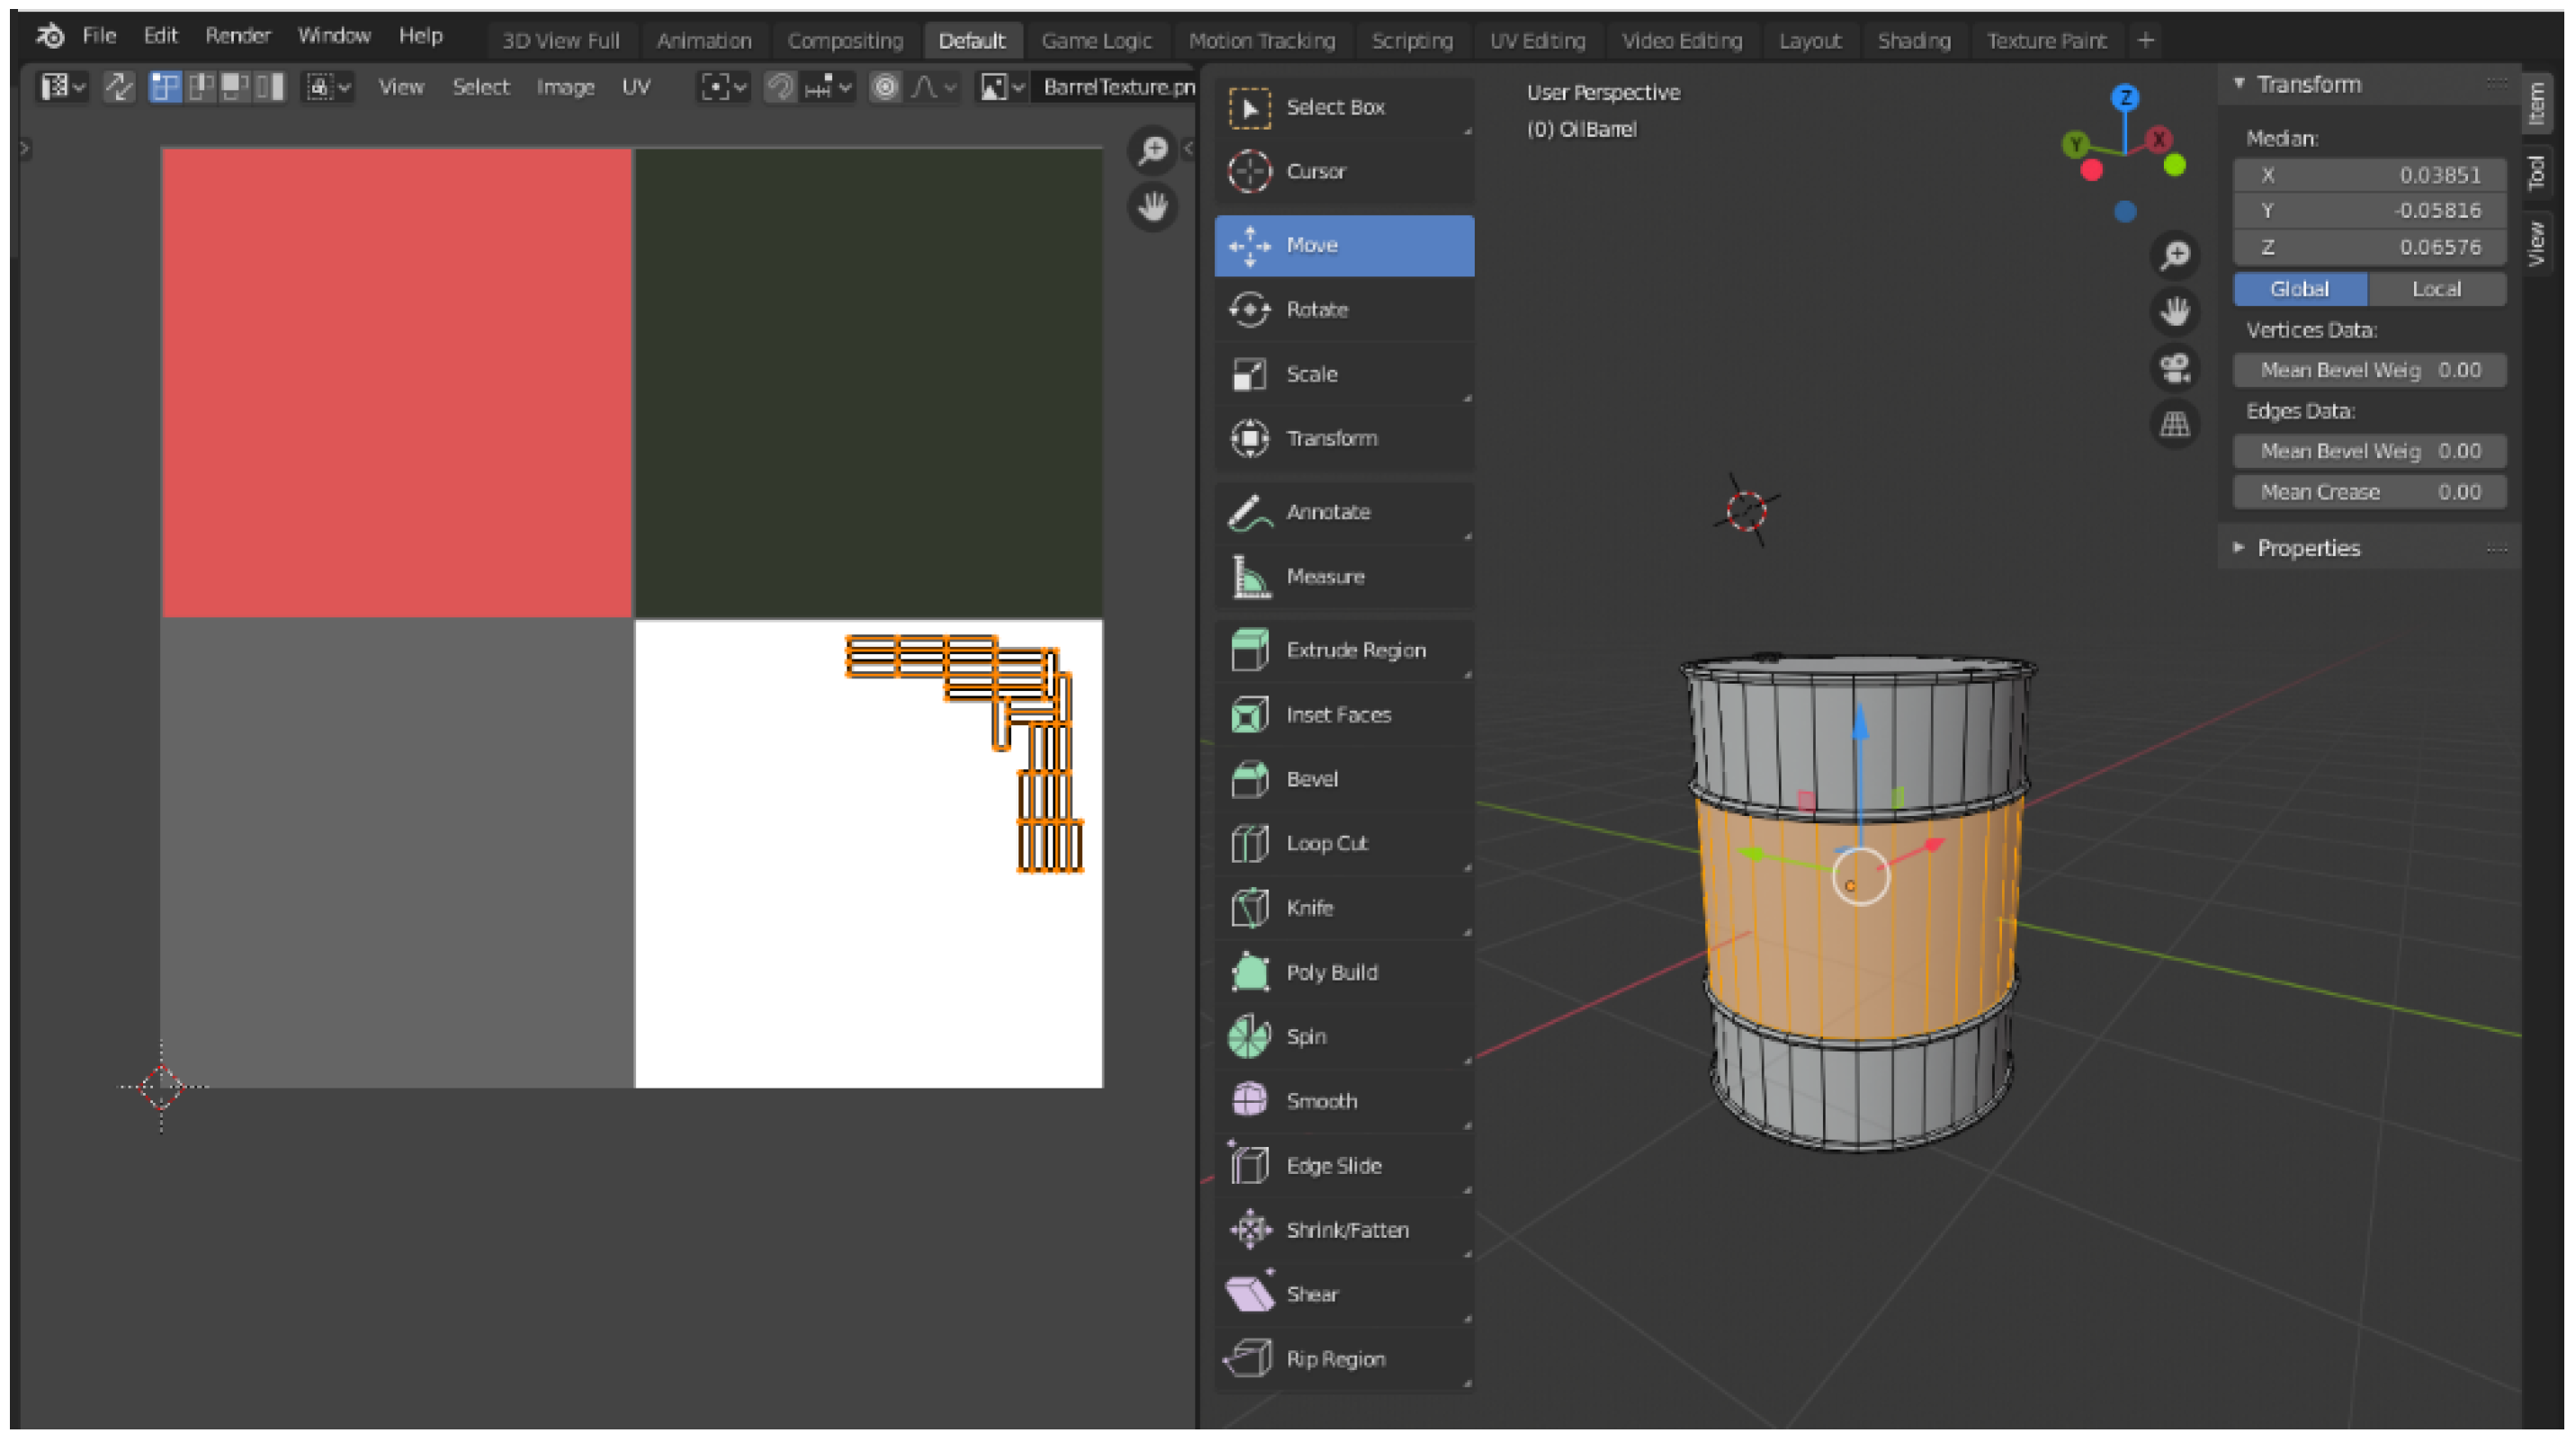
Every model which is used in game development consists of polygons. A higher number of polygons means that the assets are more realistic and have more details [13,14]. However, this can be quite expensive in resources, during rendering. In order for the rendering procedure to be accomplished, all the polygons that are needed to display the model have to be converted into triangles. This happens because GPUs can only render objects that consist of triangles [13]. Essentially, during game development, the models that will be used should consist of meshes with a low number of polygons, which are easier to draw on screen. The designer should use and combine simple shapes to create the objects s/he wants to incorporate into the video game. Then, using textures and shaders, more details can be added. Another thing to keep in mind that could affect performance is the number of models. Unity’s documentation (2017 edition), mentions that for mobile devices there will be a positive result if each mesh has a number of polygons between 300 and 1500 [14]. However, those numbers might be incorrect depending on the number of models that are inside a game scene; it could also be a factor that will make a game developer reduce or review the existing optimization techniques. Even though the best way to make a low poly model is to design it from the beginning, there are ways to achieve polygon reduction for an object. Blender, for example, has an option to reduce polygons for existing models. By adding the decimate modifier to an object, the model designer is able to reduce the number of faces through the value of the ratio which is available on the window of the modifier (Figure 1). It should be noted that the process of designing models with reduced polygons/triangles from the beginning is more efficient than reducing them to an existing one. This happens because a small ratio value for the decimate modifier could corrupt the final object.

2.2. Merge Vertices

A similar technique with the decimate modifier is ‘merge by distance’. This tool provides the possibility of simplifying a mesh, by joining the selected vertices which are close to the distance given by the user [15]. During model designing there are many times when one face of an object can end up on top of another one. For example, during copying and pasting, the user may forget to delete the old model, and as a result the new one will come and cover the old without the designer realizing it. In the final model this can have particularly negative effects, such as not applying the texture properly or altering this specific element. The ‘merge by distance’ option, with a value of 0 for the distance, provides the possibility of dealing with duplicates in the selected vertices. For values greater than 0 in the distance, long-distance combinations occur and this gives a result similar to the decimate modifier.

2.3. Textures and Materials

Colors can have a critical impact in gameplay, as they can add liveliness and realism to a scene or not. To apply color on objects in Unity, information about the texture and color must be provided in order to draw on its surface. Meshes are used to describe the shape of an object, while materials are used to describe the surface. The materials contain information on colors and textures, as well as references to Unity shaders [16]. For the game that is going to be presented in this article we used color pallets, which is an excellent solution for storing colors when we want to save resources. In order to achieve this technique, there are some requirements. Initially, the UV map of the model should be generated through Blender (Figure 2).
The next step is to create the color pallet. Each model can have a unique pallet or there could be one pallet for the entire game. The first option is more flexible in case there is a need to change the color of a model later during development. Creation of color pallets could be accomplished through any image editing software. After creating the pallet, we load it on Blender and the final step is to choose and align the faces to the desired color on the pallet (Figure 3). At the end of this process the model is exported and loaded into Unity. Along with the model (a) .png file of the color pallet has to be imported as well. To use the texture, a material is required on which the created image will be rendered, while the material can be assigned later to the model with the colors occupying the side defined in Blender.

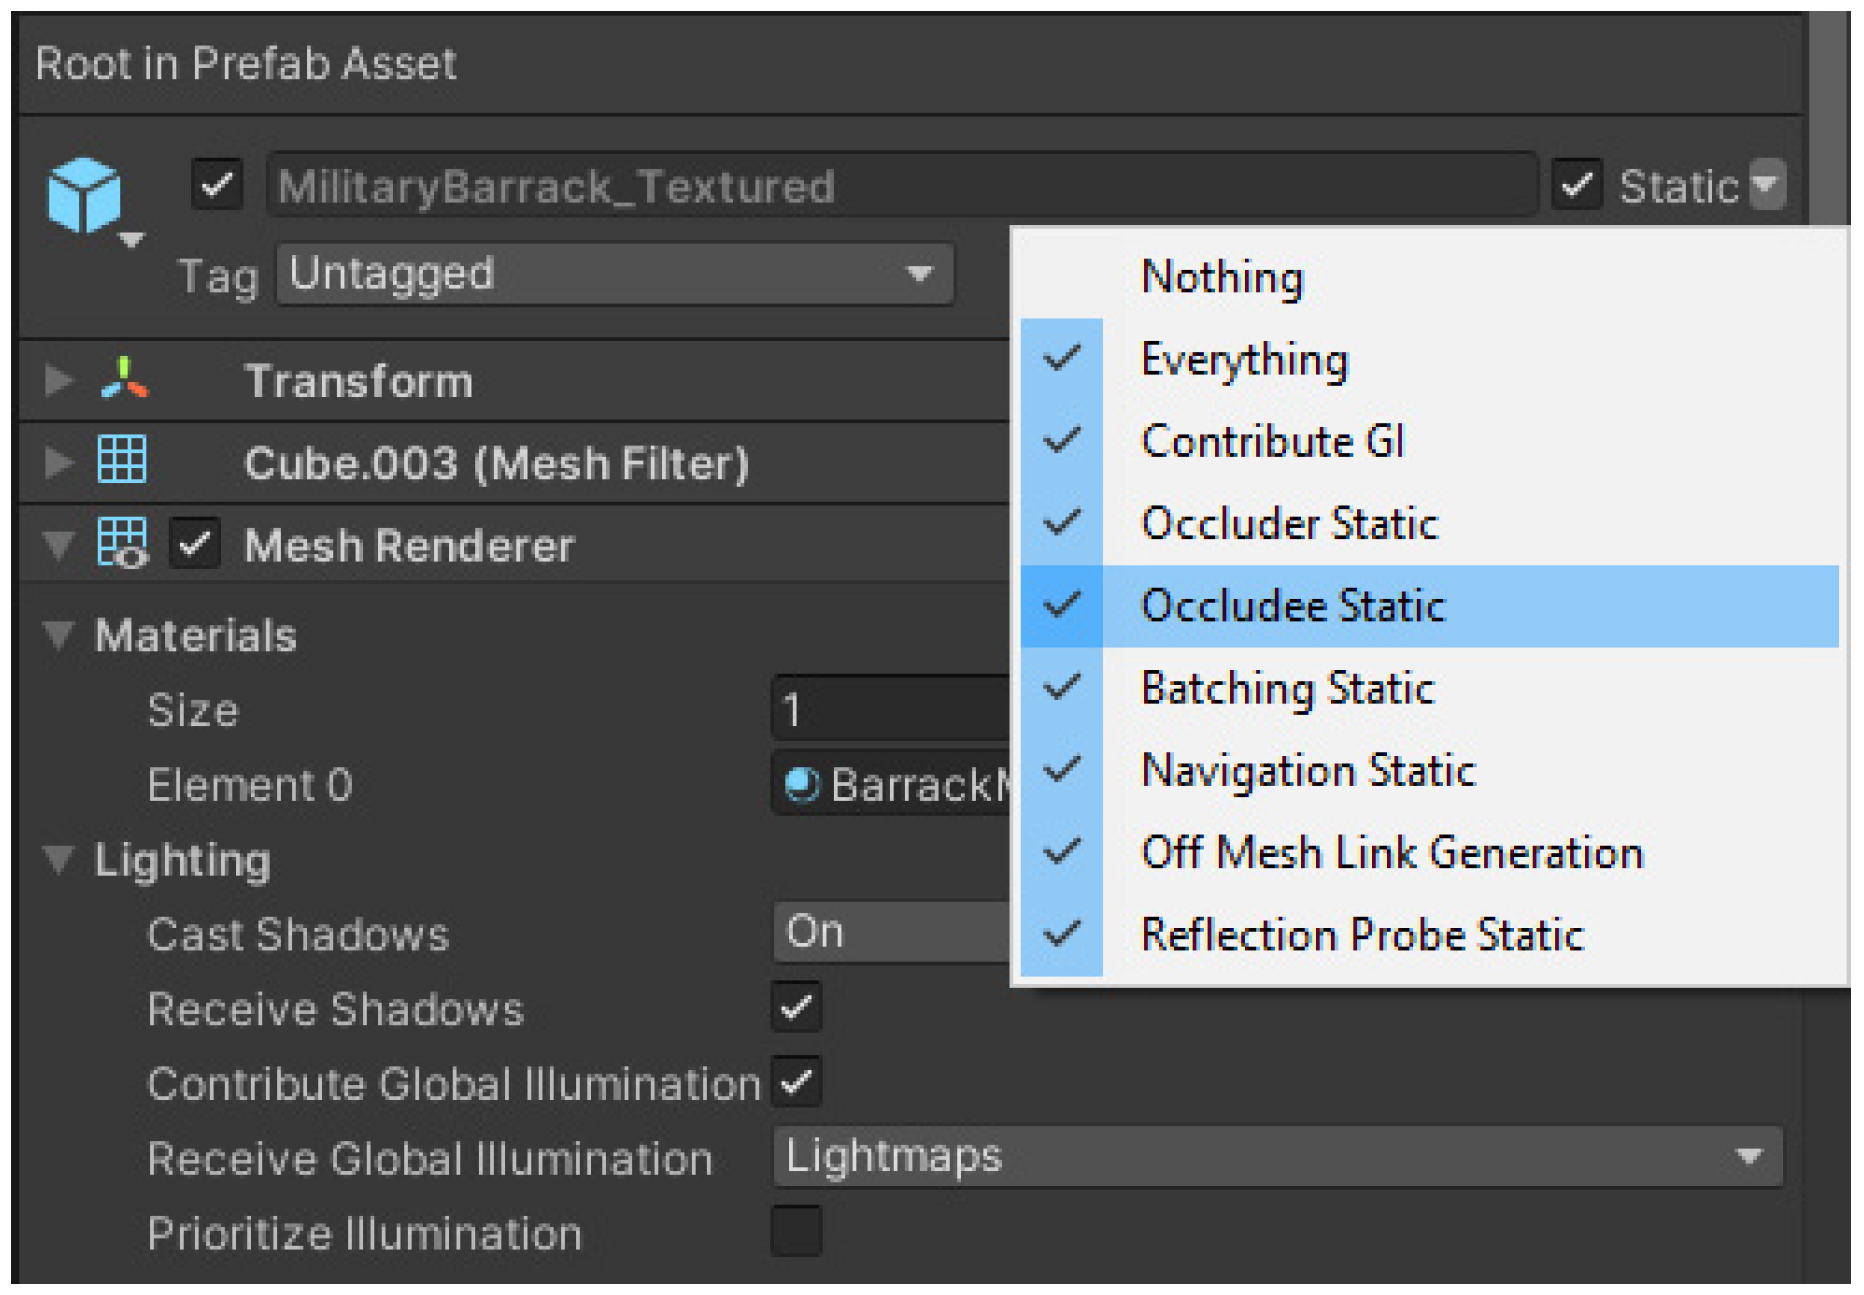
2.4. Occlusion Culling

From the beginning, the camera in Unity draws every object that it can find inside its angle of view, even those which are hidden behind obstacles. Designing the assets for a scene is quite an expensive process and there is no point in doing it for parts that are not visible to the player [17,18]. Getting rid of this issue and saving some resources can be achieved through occlusion culling. ‘Baking’ the scene using occlusion data will lead Unity to ignore parts on the scene that are getting covered by other objects, like a wall [17]. This solution results in the reduction of the geometry which is designed per frame and consequently allows a partial increase in the performance. In order for an object to be baked as occlusion data it must first be classified as occluder static or occludee static (Figure 4). This can be done from the static option list for each game object. As for the dynamic objects inside a scene, they are capable of acting as an occluder during the execution of the game, but not as an occludee. To include dynamic game objects in the occlusion culling action, the dynamic occlusion option must be enabled in each renderer component for all the assets [18].

2.5. Object Pooling

Deleting and creating objects is a basic element for every game. For example, the enemies tend to be removed from the game scene after their elimination. This procedure applies for many other objects in game which “disappear” when they complete their purpose. To create and delete objects in Unity we use the functions instantiate (…) and destroy (…), respectively. With the continuous use of these two functions the garbage collector is being activated more often. The garbage collector is responsible for freeing memory space from objects that reserved it when they were created and they have to be removed because they are not needed any more [19]. If these assets are large in number and have a high number of polygons, during removal they could increase the CPU usage and the problem of heap fragmentation could occur [20]. One way to deal with this problem is to use object polling. In this process a multitude of instances of each object, which are required to be regularly displayed and deleted from the game, are created and integrated into a data structure, such as a list. Then if there is a need to use an item, the first available in the structure is activated on the scene. After fulfilling its purpose, it is deactivated and becomes available for use again. In that way there is a specific number of GameObjects and their operation is recycled without the functions instantiate (…) and destroy (…) being used multiple times. Furthermore, because the objects have already been created and they exist on the scene, deactivated, the render needs fewer resources [20]. One of the problems that someone may encounter with this method is that the game will try to activate more items than those that are available in the structure. Therefore, the total number must be chosen correctly so that there are not too many items or fewer than the game needs. Several ways for implementing the object pooling technique are available.

3. Methodology of the Study

For the purposes of the study, a simple video game intended for Android mobile devices was designed and developed. The game was developed with the Unity game engine and most of the models were designed with the 3D computer graphics software Blender. Two versions of the game were developed in order to study the differences in performance: one version that applies basic optimization techniques, like the ones briefly reviewed in Section 2; and one where the aforementioned optimizations were not used. The two versions of the game are presented in Section 4.
The two versions of the game were then compared in terms of their performance. Data recording during game initialization and game play took place on a computer with a remote connection to a mobile phone and with the profiler showing the last 900 frames. The following measurements were made: performance was investigated at the beginning of the game where all the objects are loaded; and during gameplay where the main character constantly eliminates opponents; finally, the FPS count during gameplay on the mobile phone was investigated.
For the comparison between the two versions of the game, the following metrics were used for measuring and evaluating performance [21]:
  • Frames per second (FPS);
  • Batches;
  • Triangles/polygons.
Improvements to their values were expected to result in better game performance in CPU usage, rendering and memory. In the following paragraphs the aforementioned metrics, as well as the tools utilized for keeping track of them, are briefly described.

3.1. Frames per Second (FPS)

Frames per second (FPS) refers to the number of images that are updated every second on the screen. Each image represents a frame [22]. The fast image projection gives the illusion of movement to the human eye. Thus, the larger the number of frames or images projection per second, the smoother the movement is [21].
1000/target FPS = time per frame (ms)
FPS is one of the most common metrics for evaluating the performance of video games, because it affects the end user’s game performance as well [23]. A low number of frames means that it is quite difficult for someone to play the game, while a higher number means that a game runs smoothly. In other words, the rate at which the frames are rendered can impact the player’s performance affecting the overall experience. In order to calculate the FPS for a game we need to know the processing and displaying capabilities of a system along with the corresponding requirements of a game. These insights about frame rate can guide players to purchase new hardware, and even affect the development on new hardware [24]. This specific metric can be seen in Unity via the profiling tool, but also Blender makes references to FPS when an animation is created.

3.2. Batches

Any object that the user wants to be visible on the scene of his/her game is sent by Unity to the GPU in order to design it, using the selected graphics API for each platform [25]. This action is known as draw call [25]. Draw calls should be applied in every object that is used for game purposes in order to give it the appropriate vertices, shaders, textures and more. However, in cases where there are a high number of models, these calls can put a lot of strain on the GPU, especially on mobile devices. The solution to this problem is given through reducing the batches [26]. More specifically, models that have the same materials can be combined in a batch in order to be rendered together [25]. As a result it is possible to minimize runtime memory consumption, along with CPU and GPU workloads [26]. Essentially, batches are a way to find out and fix any abuse of the aforementioned modeling materials.

3.3. Triangles/Polygons

Each model used for game development purposes consists of triangles/polygons. The greater the number of polygons we encounter in an object, the more realistically it is represented [13,14]. However, a fairly realistic model with many polygons requires greater processing power from the GPU and CPU in order for it to be displayed. There are also bigger requirements in the field of memory usage for a complicated model mesh. So, one way to optimize a video game model is to use as few polygons as possible to represent it [11]. A proper reduction of polygons/triangles, as mentioned in [11], can lead to less usage in computing resources, which are required to display the models, without losing their quality. Furthermore, because GPUs can only render triangles [13], it is necessary for all the polygons of a model to be converted into triangles in order for the render process to be accomplished.

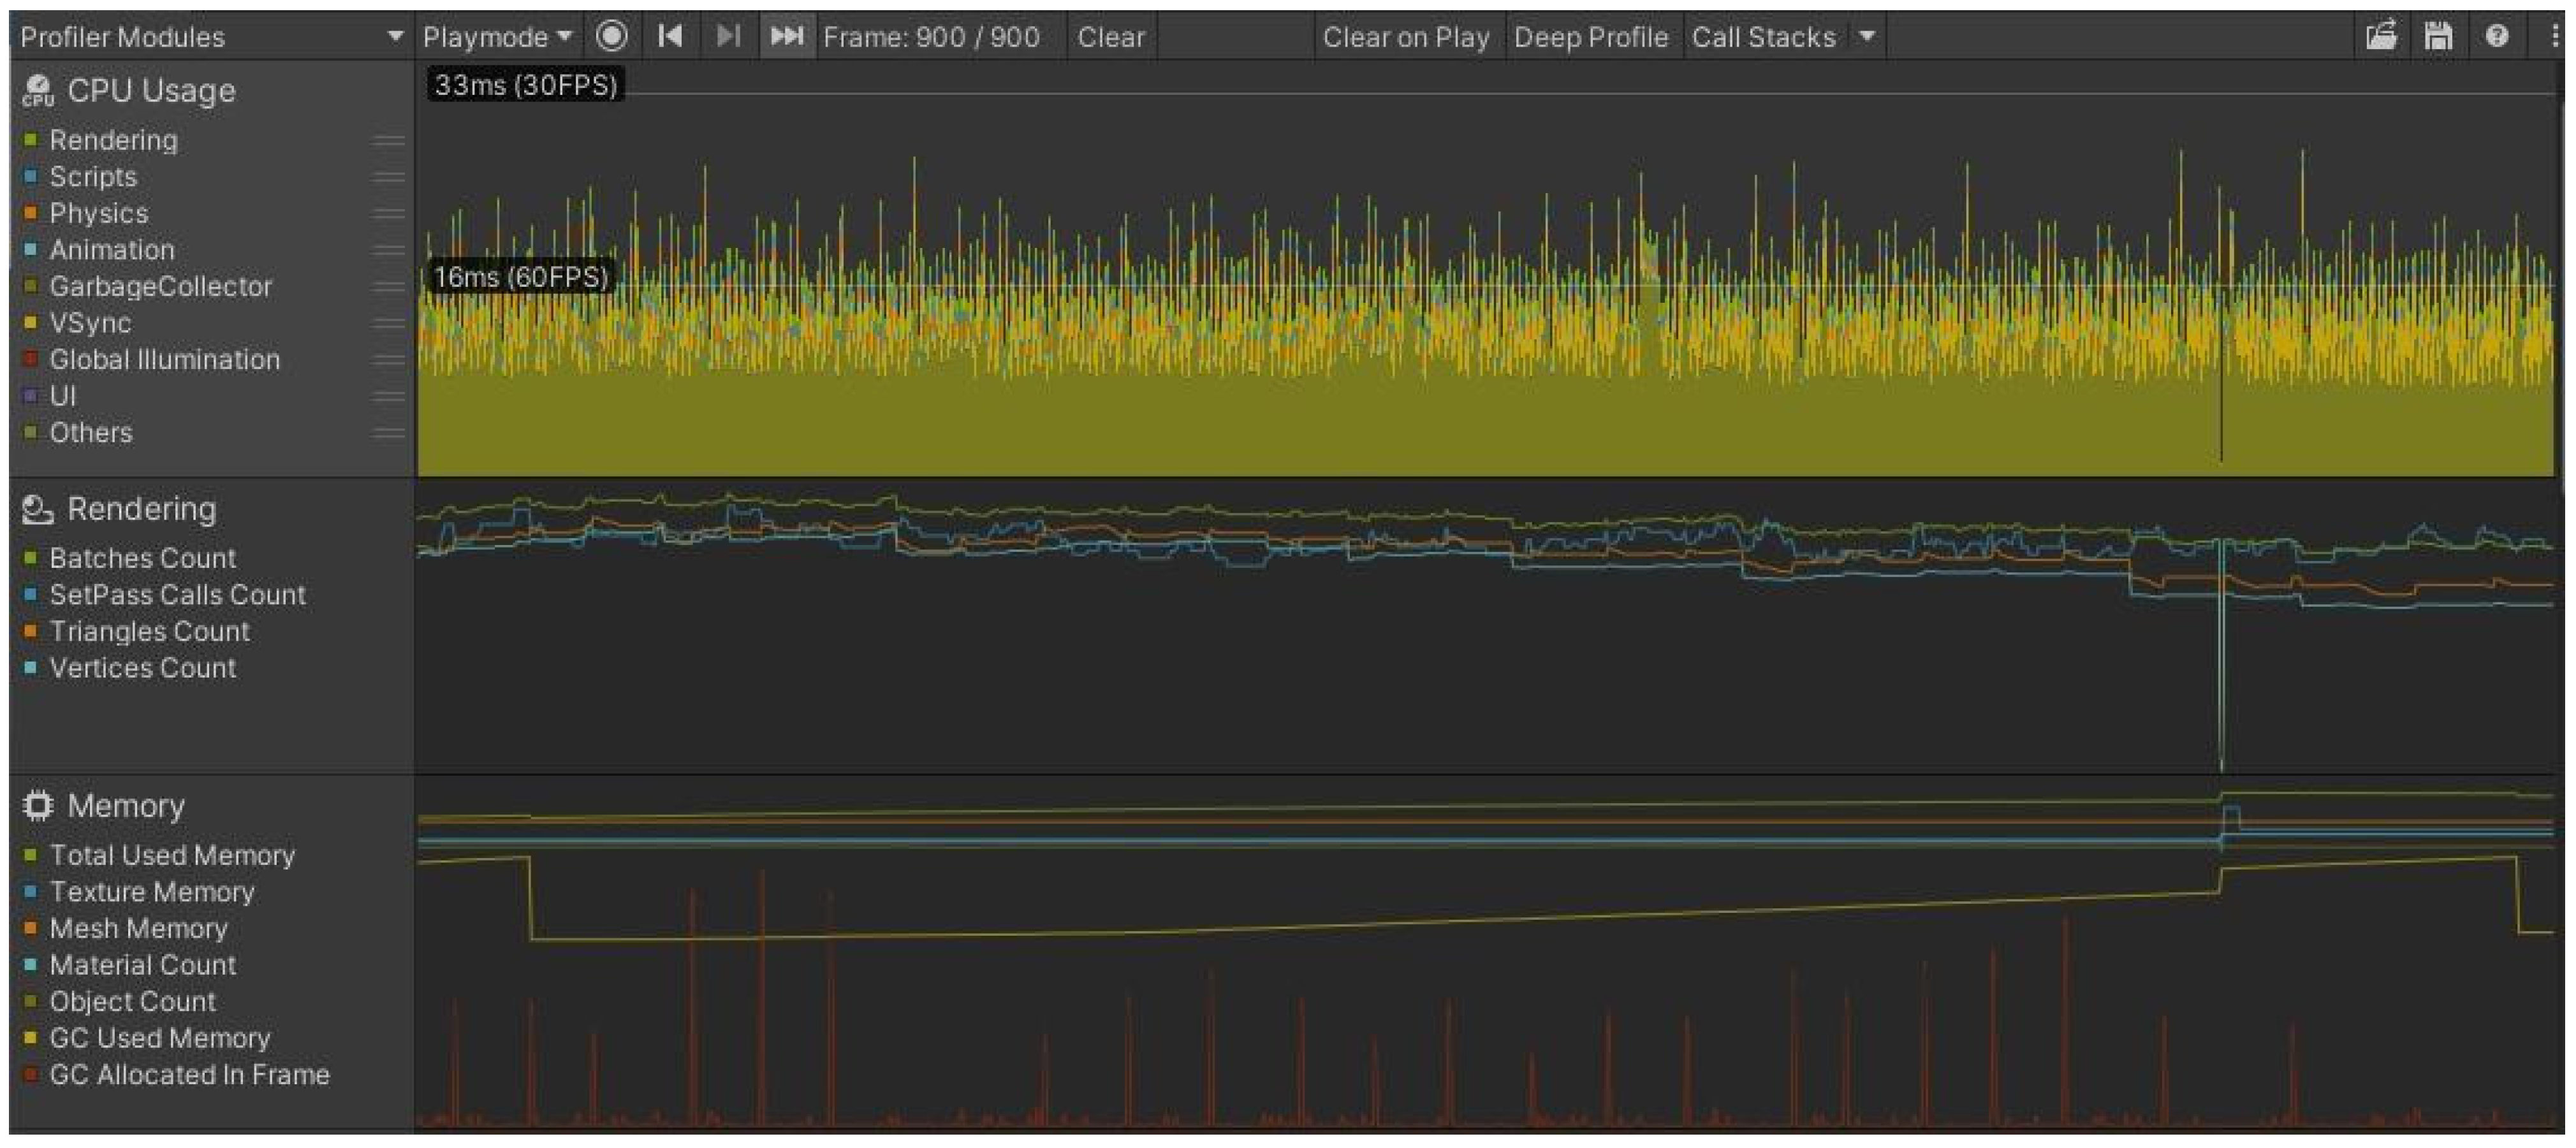
3.4. Profiling Tools

It is important for a game developer to have knowledge of the resources’ requirements by each of the video game functions. Profiling tools allow an in-depth look at issues related to the performance of the video game, such as the percentage of memory occupied, CPU or GPU usage by every process and much more [27]. This action could help a developer identify with more ease the parts with the highest cost in resources and take the appropriate actions to reduce it. For this article, the main tool used was the profiler that is already embedded in Unity. Unity Profiler is a quite good tool to start the process of monitoring and evaluating the performance of a game [27]. The second tool, which is actually a script, was used to count the FPS during gameplay. Even though the profiler has this kind of functionality, it can only monitor the game running on the computer. So, the measurement of the game’s FPS, on mobile devices, is being done via a script that calculates frames per second over an interval.

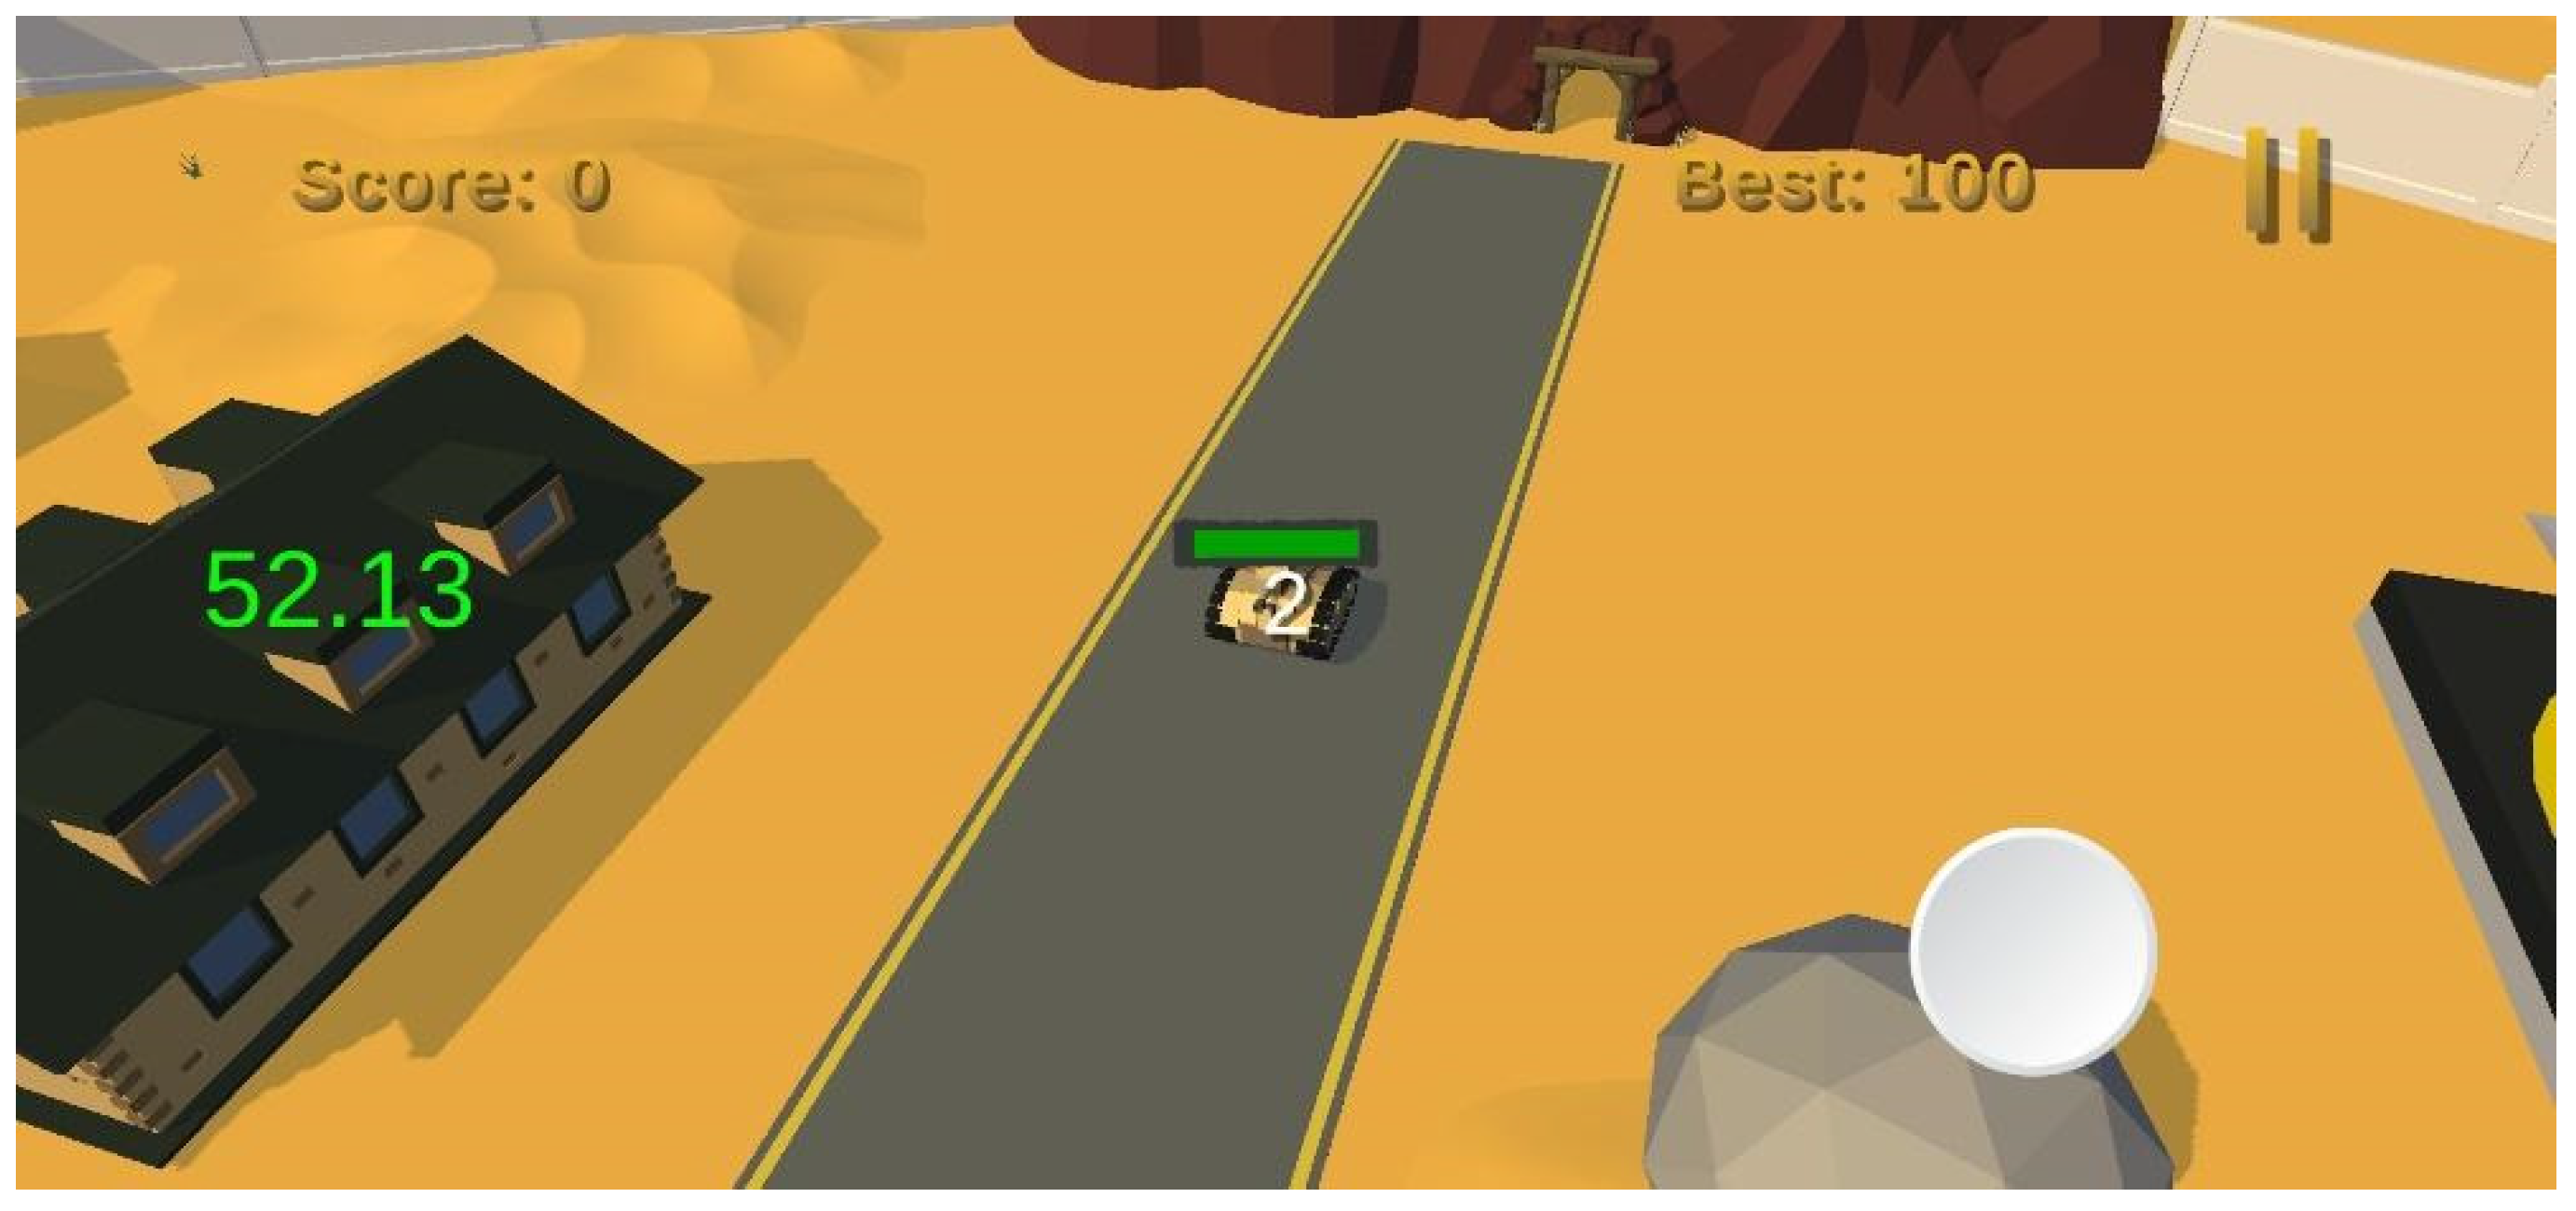
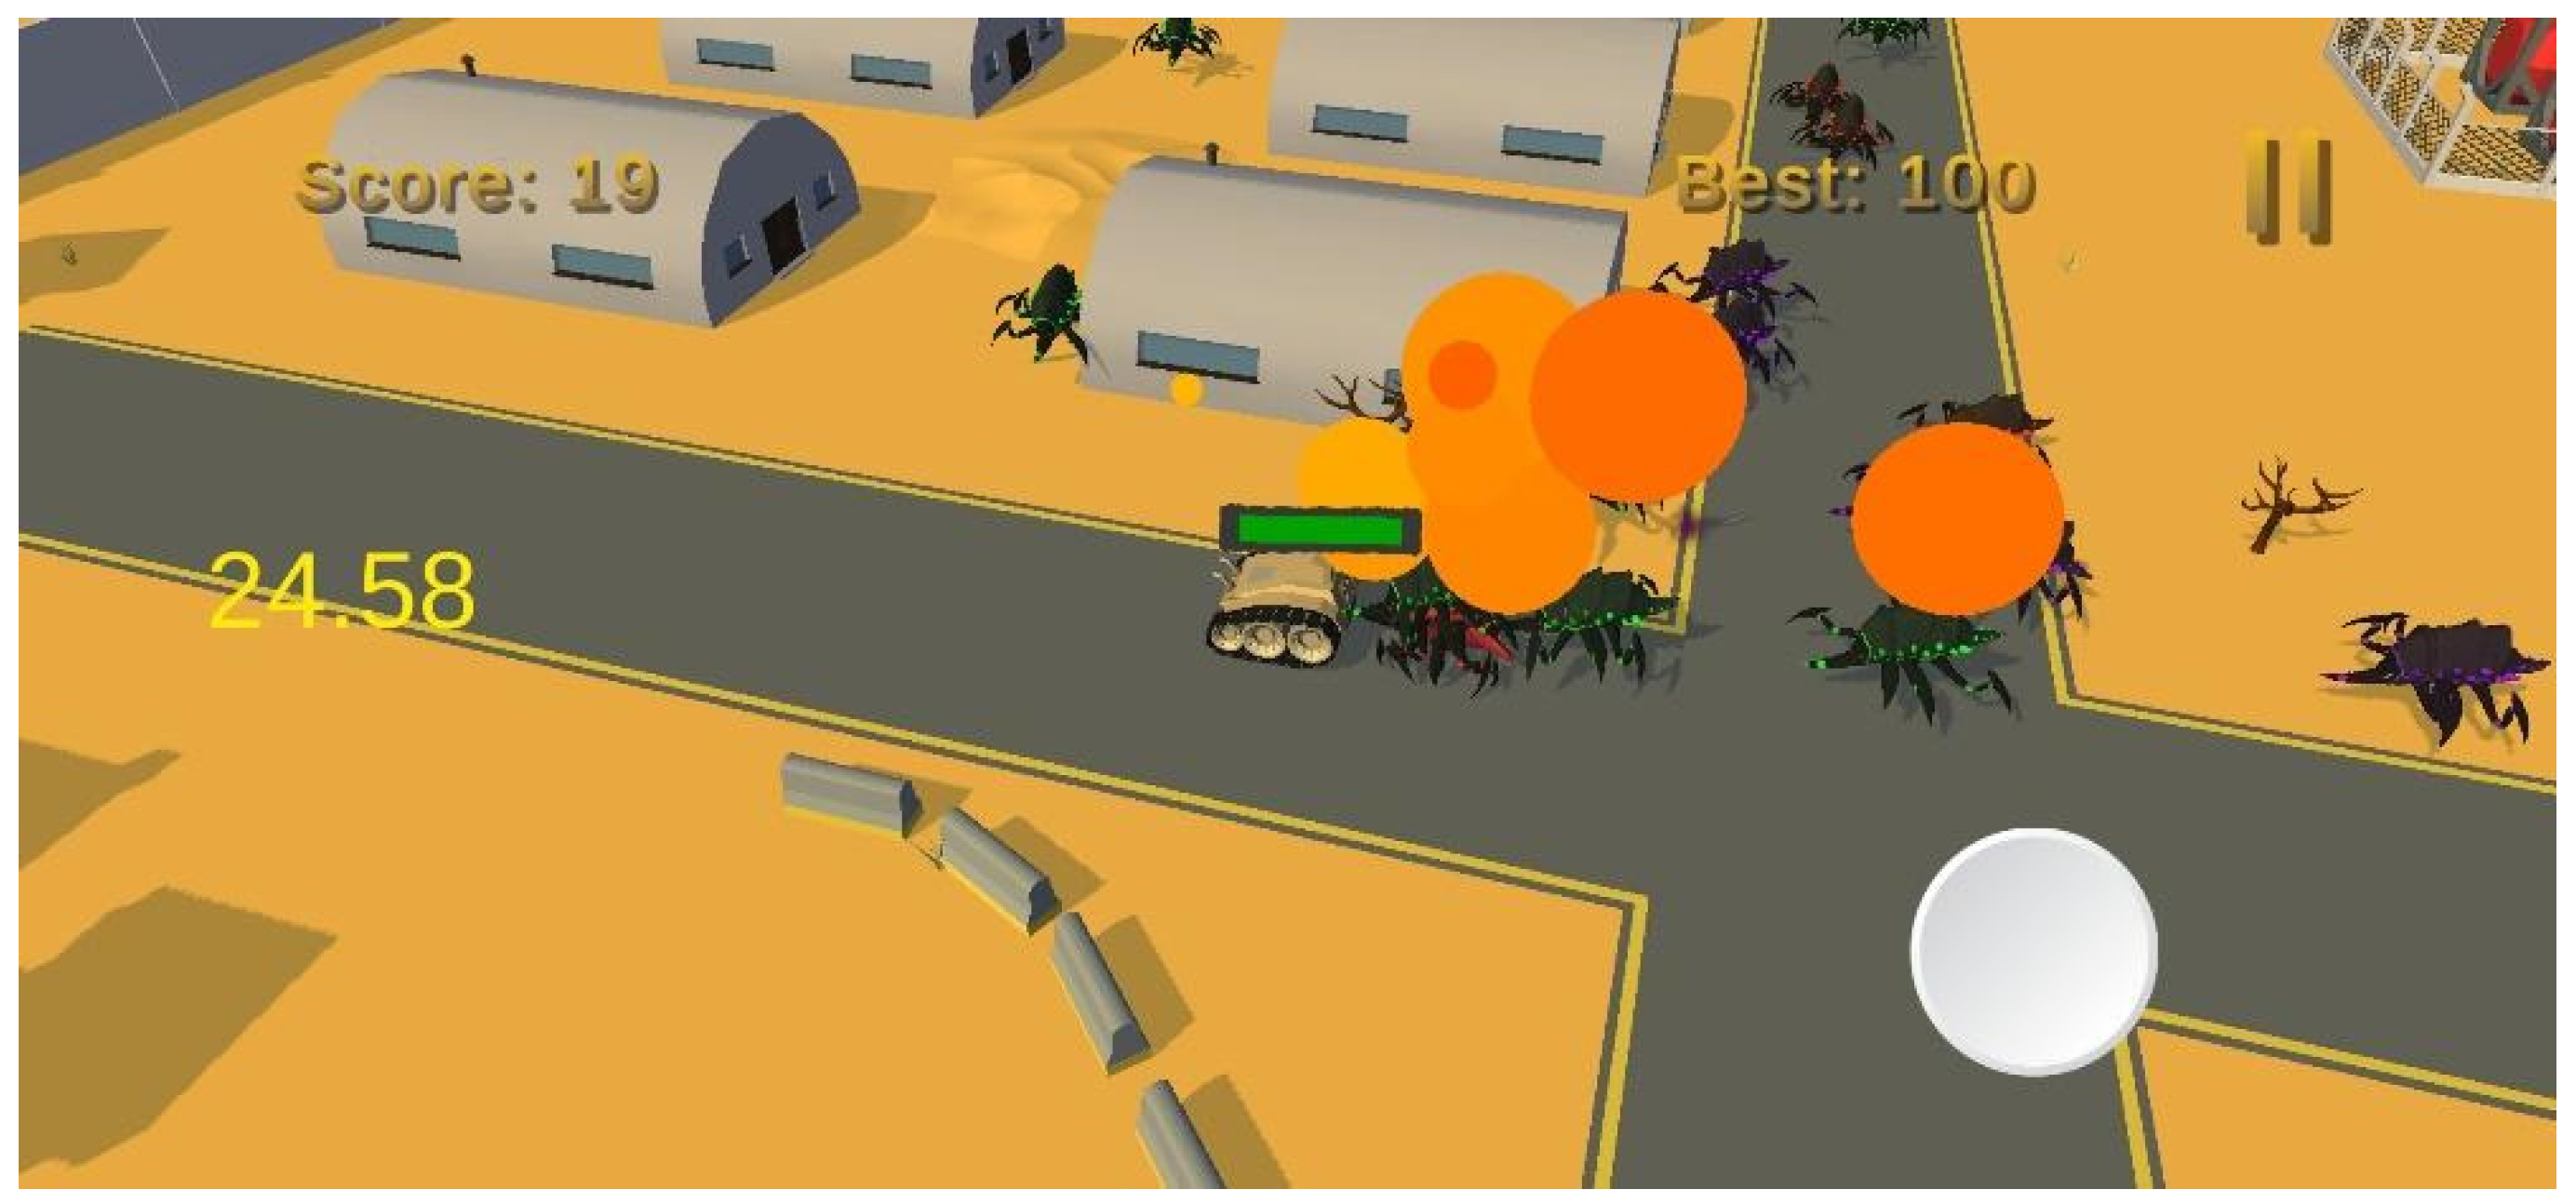
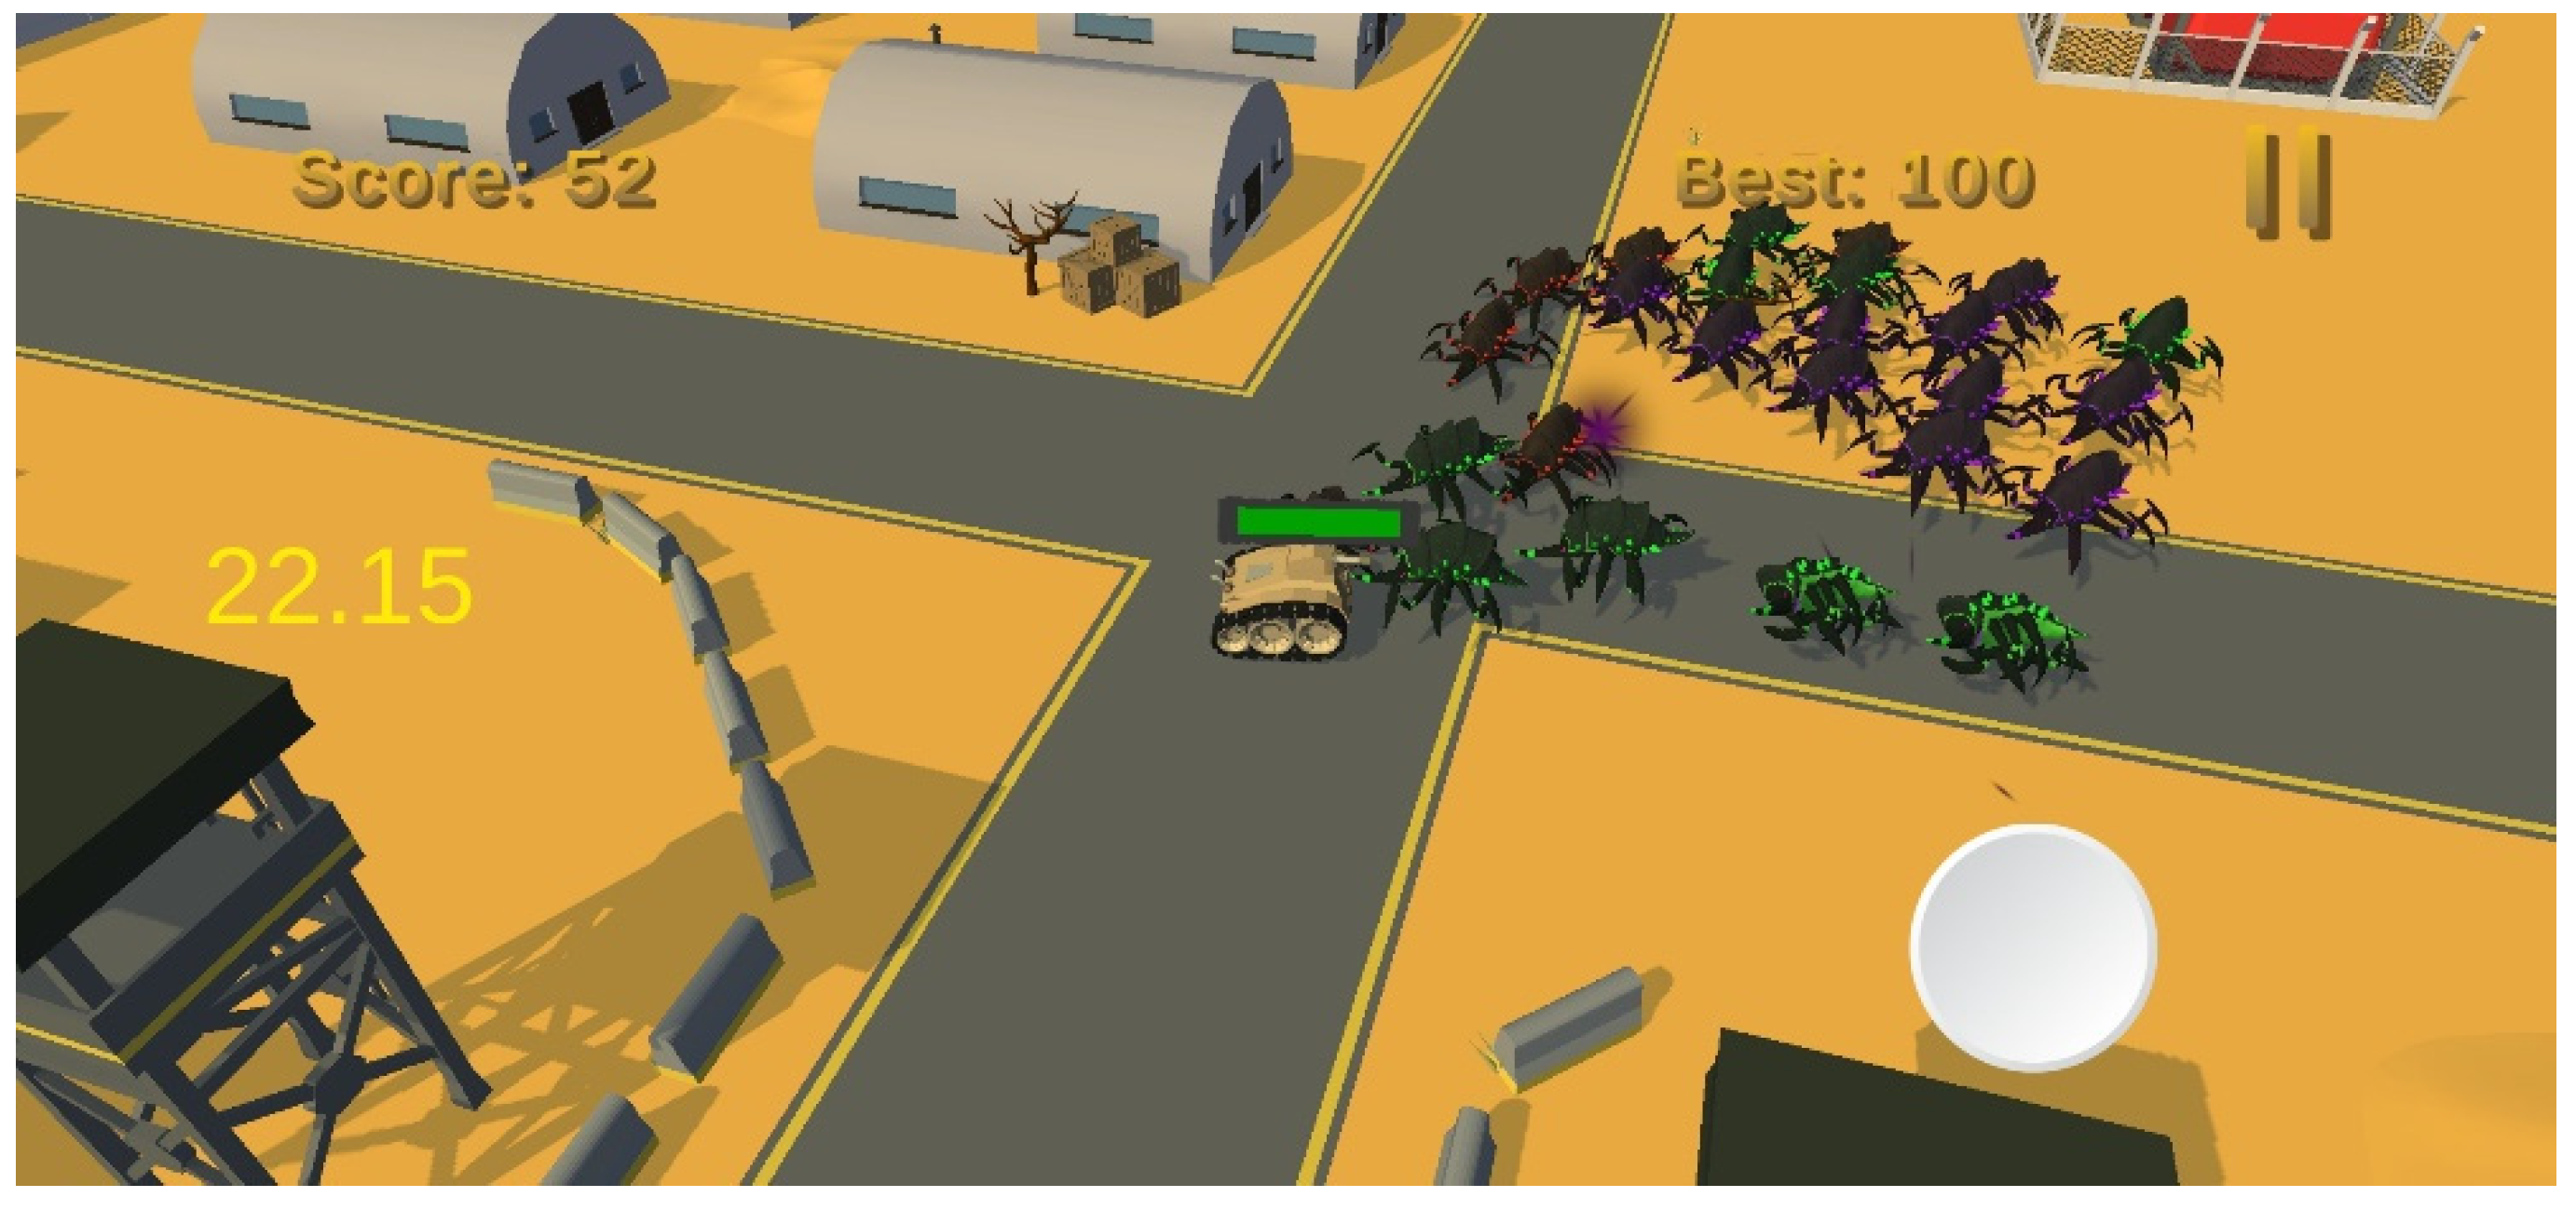
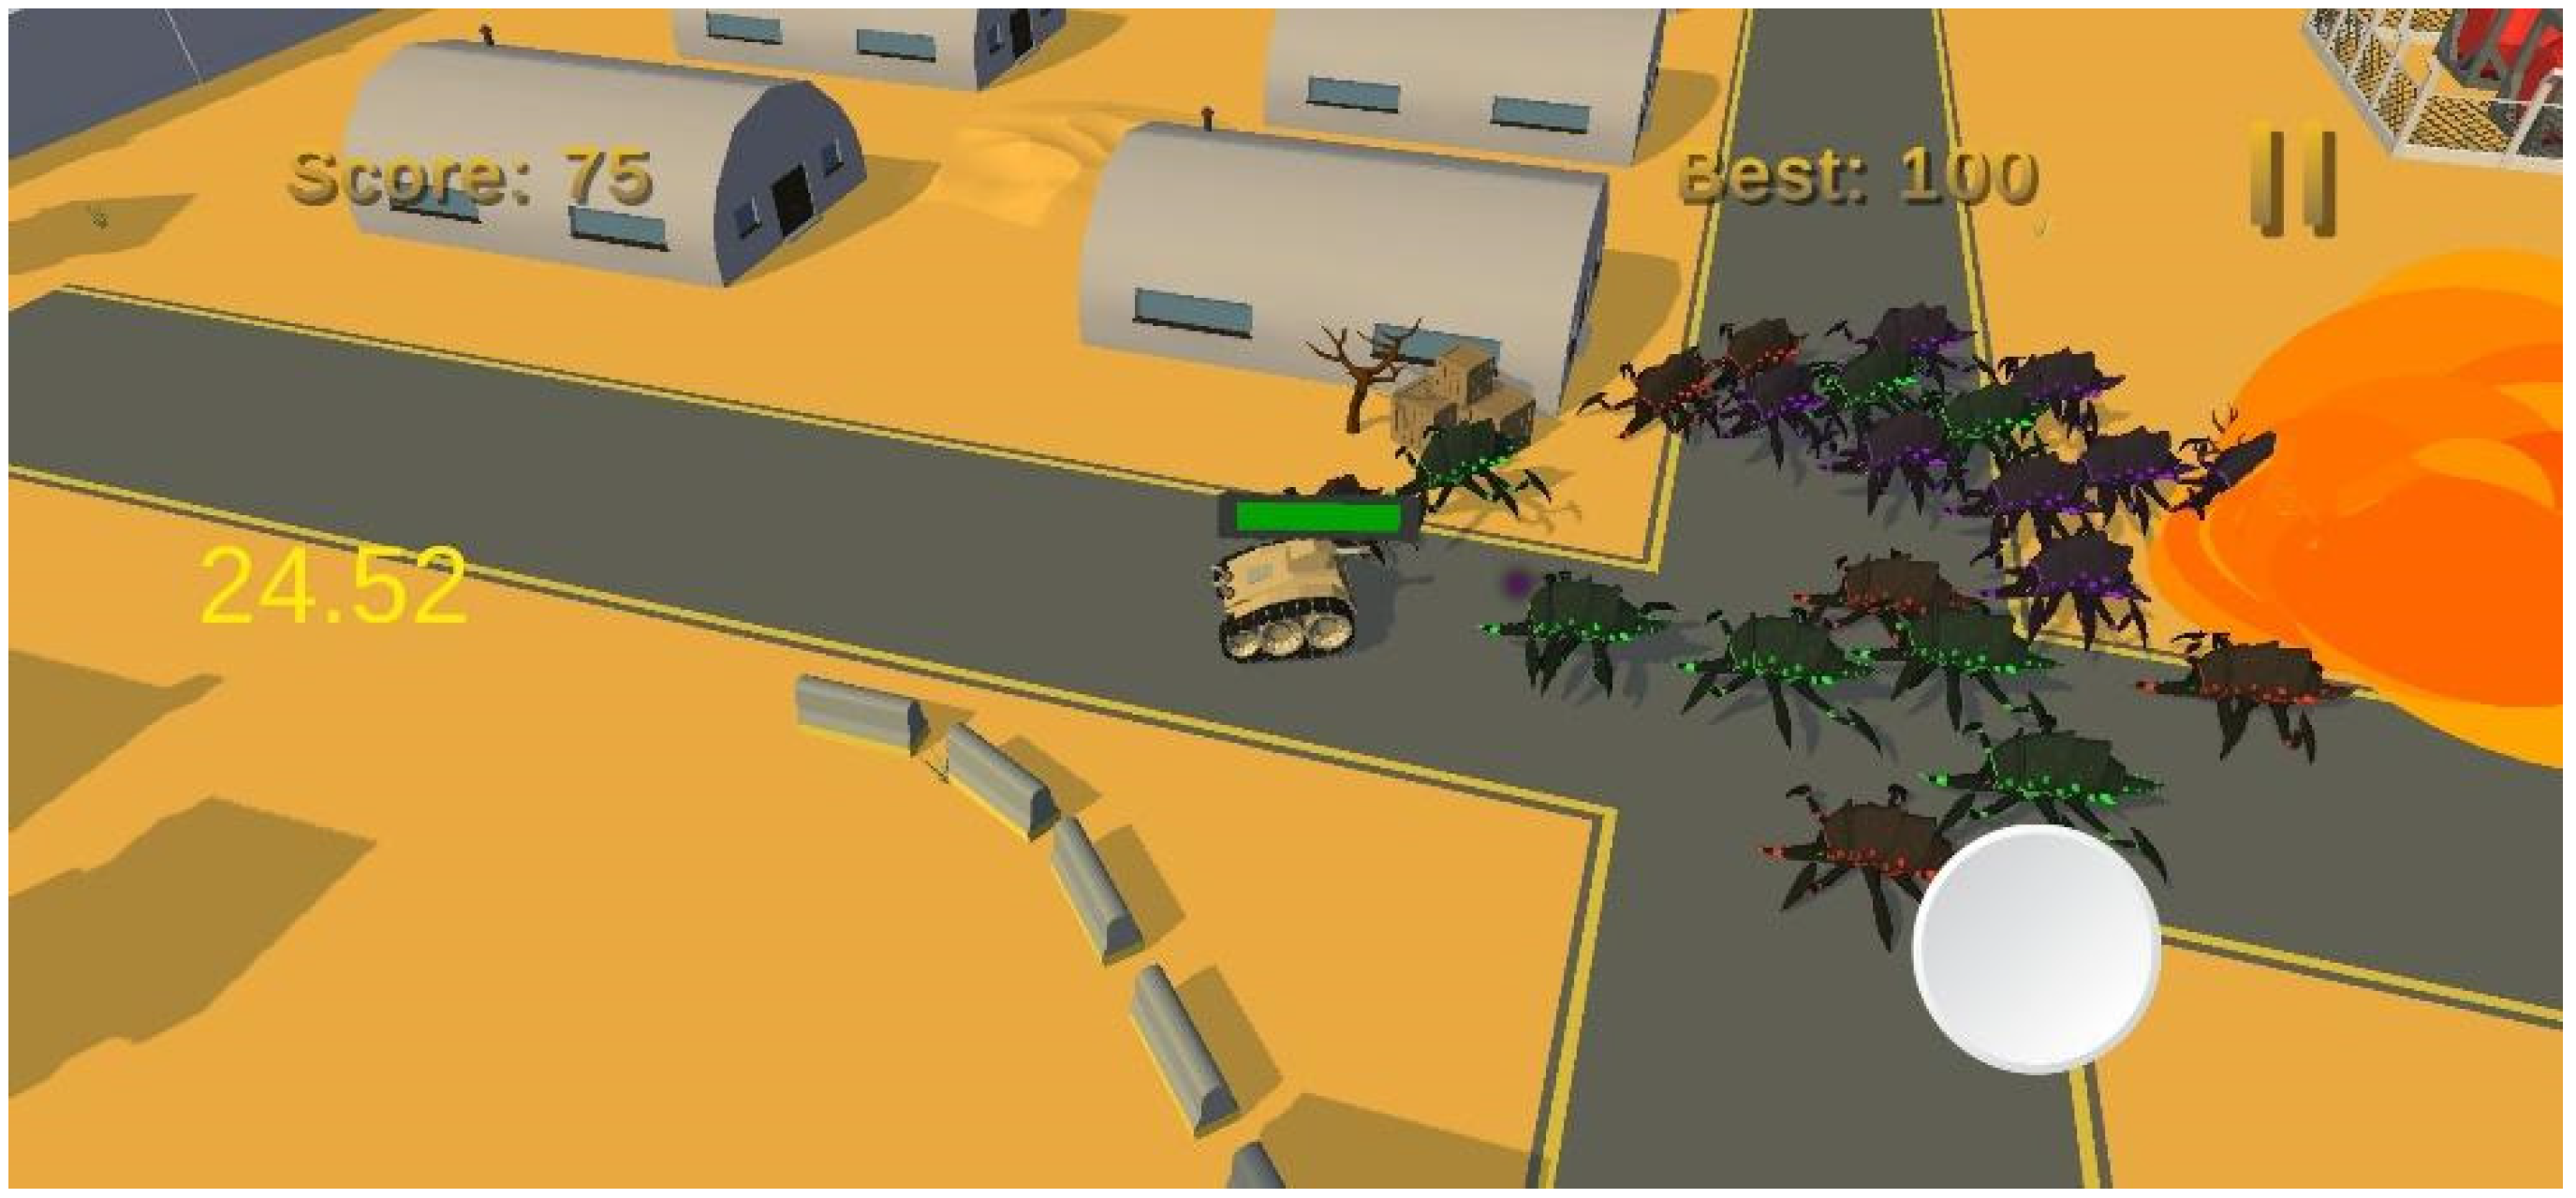
4. The Two Versions of the Game

For this experiment two versions of the same game were developed. One uses optimization techniques, and the other does not. The main purpose of this comparison was to show how much of a difference some simple techniques could make to a game, especially when it is created for mobile devices. First, there should be a more in-depth look at those techniques.
In the non-optimized version, we used static objects that have the problem of faces inside faces, such as the barracks presented in Figure 5. During the first design, some faces of the barrack model tended not to be visible to the player. The way to produce most of the low poly models was by connecting simple shapes with one another. As a result, there might be cases where faces from one object hide inside another. This increases the poly count, and Unity has to render them, even though they are not visible. It might also create strange effects. For example, if two identical static objects were placed at the same position, Unity would try to render them both, but this is going to create a strange and unwanted behavior because each object will try to cover the other.
The next difference has to do with the usage of occlusion culling. For this technique, in the optimized version the occlusion culling was enabled and all the static objects were marked as occluder or occludee static, so Unity would not render the whole map but only the part inside the camera view.
The next two actions that were taken to improve performance were those that had the biggest impact. In the non-optimized version, some of the assets inside the scene had a high polygon count. The barracks, the water tower, the trees and sand piles were some of the static objects that had a large number of polygons. In the non-static models, the enemies were those that were not low poly. The differences in triangle count between the two versions can be seen in Table 1.
But how does this triangle reduction affect the game models in terms of appearance? In Figure 5, Figure 6, Figure 7 and Figure 8 the models for the two versions are presented. The assets are extracted from Unity, which means that they are the ones the player is able to see during gameplay.
As for the non-static objects, we have the enemies which fall into 3 types. Since their model is the same and the only different thing is their texture, there is only one example of an enemy presented in Figure 9.
The last technique that separated the two versions was object pooling. The non-optimized version did not use it. So, it created and deleted the enemies every time via the functions instantiate() and destroy().

5. Results

Before presenting the performance results for the two versions of the game, a few words about the experiment environment should be mentioned. The total number of enemies which could be on the map simultaneously was 100 and they appeared every half a second. Data recording took place on a computer with a remote connection to a mobile phone and with the profiler showing the last 900 frames. Those two factors need to be mentioned, because they affected the data on the profiler. The measurements are divided into three parts. Initially, there is the performance calculated at the beginning of the game where all the objects were loaded. Then, there is a recording from gameplay where the main character constantly eliminated opponents. Finally, the FPS count during gameplay on the mobile phone is presented. For the comparisons, emphasis is on CPU usage, the rendering process and memory.

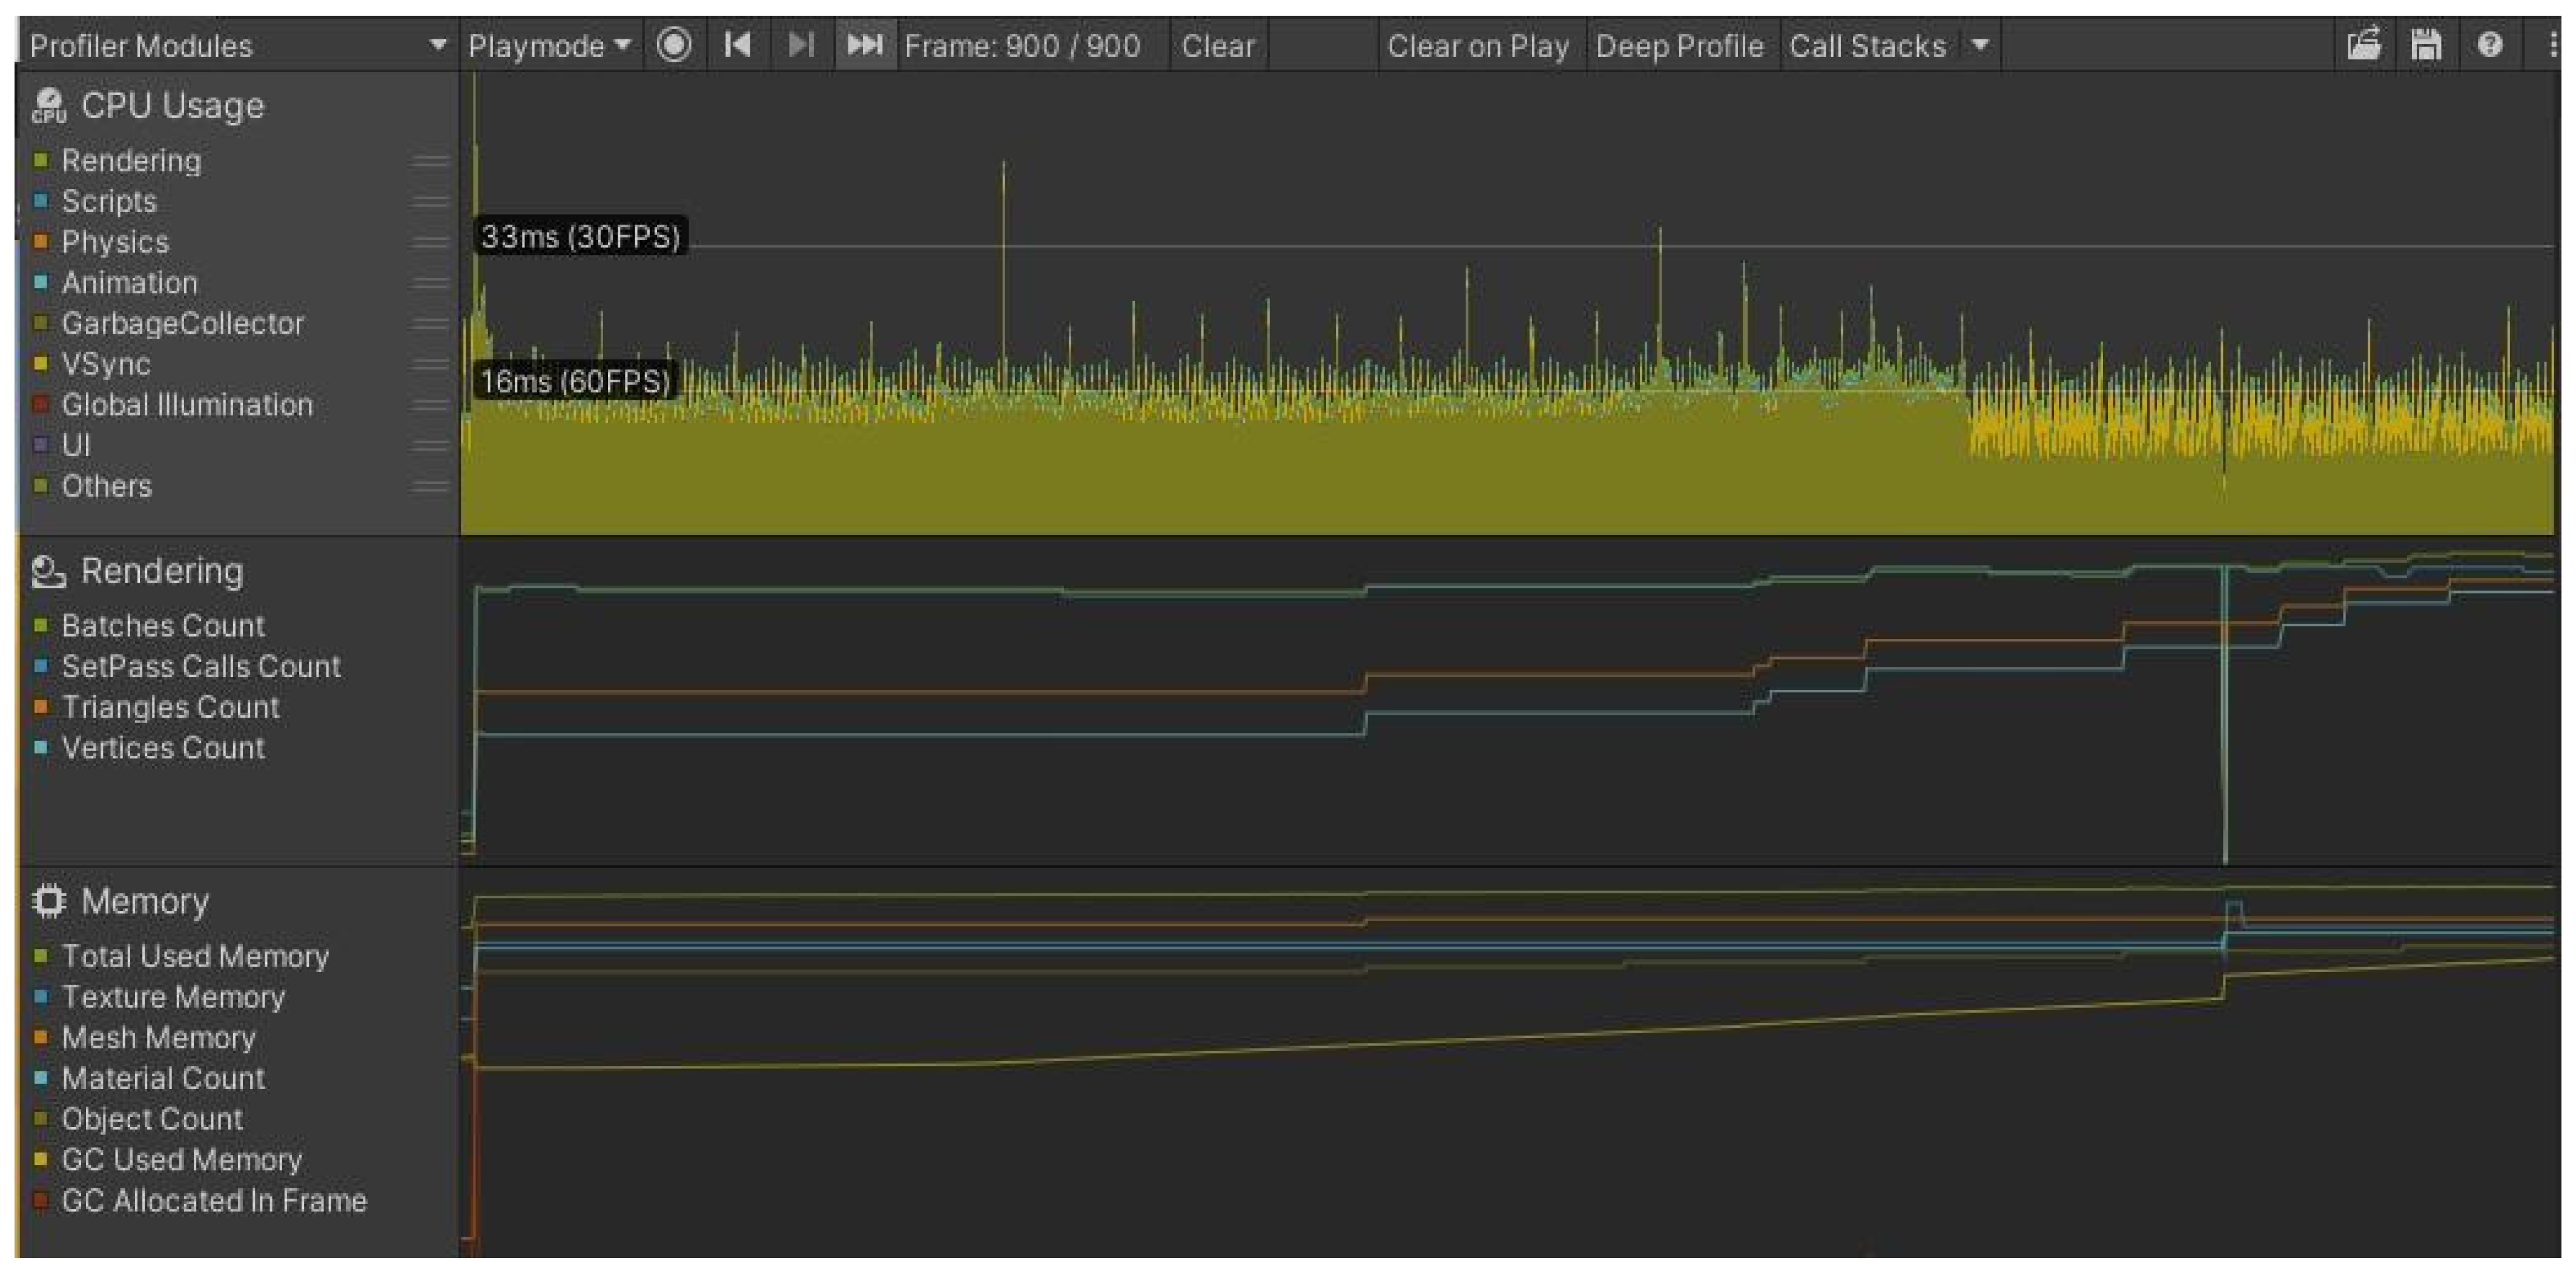
5.1. Loading Results on a Personal Computer

5.1.1. Loading Results CPU Usage

For the first 900 frames from the beginning of the game the profiler produced the results presented in Figure 10 for the non-optimized version. The particularly large spike seen at the beginning constitutes the transfer between the menu scene to the main game and the loading of all objects. The graph shows some deviations from 30 FPS, which is justified by the start of the algorithm for the production of the opponents. However, without the graph from the optimized version it is hard to make assumptions.
In Figure 11 the results from the first 900 frames from the optimized version of the game are presented. At first glance, the CPU usage graph contains a large spike when switching scenes, similar to that of the non-optimized version. However, every other spike that forms after this point does not fall below 30 FPS; but what happens with the other components (rendering and memory) in the two versions? To answer this question, the profiler data are presented.

5.1.2. Loading Results on Rendering

Table 2 contains rendering data recorded on the big spike during the start of the game. The table refers to both versions.
The first variable was set pass calls, which is the number of times Unity has to switch between shaders for the different objects that exist in a scene, and is determined by the materials and their complexity [28]. The optimized version seemed to have 49 of these calls while the non-optimized version had 57. The next variable was draw calls, which are the requests to the GPU to display an object [25]. If there are two objects with two different materials, then the GPU will tilt twice to display them. The values appeared to be 109 and 103 for the non-optimized and the optimized versions, respectively. Exactly the same values were found for batches. The next value refers to the total number of triangles that were loaded in this specific frame. For the optimized version there were 175.4 k triangles, while for the non-optimized one there were 734.8 k. Vertices for the non-optimized version reached up to 656.4 k and for the optimized version 307.3 k. Those two last variables had such a difference because for the non-optimized version of the game, the models were quite expensive in terms of resources. The variable used textures refers to the amount of textures Unity uses per frame [28]. The used textures for the optimized version were 13 with size 3.3 MB and for the non-optimized 25 with size 3.4 MB. Next, there is render texture, which has to do with the number of textures that are rendered per frame [28]. As shown in Table 2, even though the non-optimized version had a higher number of rendered textures, they had smaller memory size in comparison with those of the optimized version. Moving on, the render texture changes suggest the number of times Unity sends one or multiple textures to render per frame [28]; again the value for the optimized version was smaller than for the non-optimized. Used buffers is the total number of GPU buffers. More specifically, it includes vertex, index and compute buffers, components that are needed in order for the rendering procedure to be accomplished [28]. For this variable there is one of the big differences between the two versions. In the optimized version, there were 470 buffers with a total size of 22.2 MB, while in the non-optimized there were 2013 buffers with a size of 38.3 MB. The vertex and index buffer upload in frame define the amount of geometry that is being sent from CPU to GPU in a frame. Their difference is that vertex buffer upload represents vertex/normal/texccord data and the other, triangle indices data [28]. For both vertex and index buffer upload the optimized version had better results in terms of number and size. Lastly, there are shadow casters, which include the number of shadows that game objects produce [28].

5.1.3. Loading Results on Memory

Regarding memory, results for the two versions are presented in Table 3.
Firstly, there is the total used memory, which is the total value of memory that Unity uses and tracks [29]. For the optimized version the value was 0.63 GB while for the non-optimized it was up to 0.82 GB. The total reserved memory used in Unity relates to tracking purposes and pool allocations [29]. The difference between the two versions was exactly 1.0 MB with the non-optimized version having the best value. Then, there is the GC used memory and GC reserved memory, which represent the used heap size and the total heap size that manage code uses and those parts of memory produce garbage that are collected [29]. Next, there is the Gfx used memory and Gfx reserved memory, which represent the amount of memory that the driver uses on textures, render targets, Shaders and mesh data [29]. Furthermore, audio used and audio reserved show the estimated memory usage for the audio system [29]. Respectively, the video used and video reserved memory show the usage for the video system. There is also the profiler used and reserved memory, which shows memory that the profiler consumes and reserves from the system [29]. Finally, there is the system used memory, which is the memory that is used by the system in order to run the game. However, the memory profiler does not track all memory usage in the system [29]. From the comparison of the variables total used, total reserved and system used memory, the two versions of the game were not very far from each other. It should be noted that the profiler variable was ignored because in real life scenarios it will not affect the game. However, for the variables asset, game object, scene object and object count, values were a lot higher for the optimized than the non-optimized version. This is because the optimized version used the object pooling algorithm for the opponents. Basically, all the enemies (100 in total) were being created and disabled at the start of the game. So, they were still counted as game objects in the scene. If the same number of objects was being spawned for the non-optimized version, there would be an even greater difference between them in terms of memory.

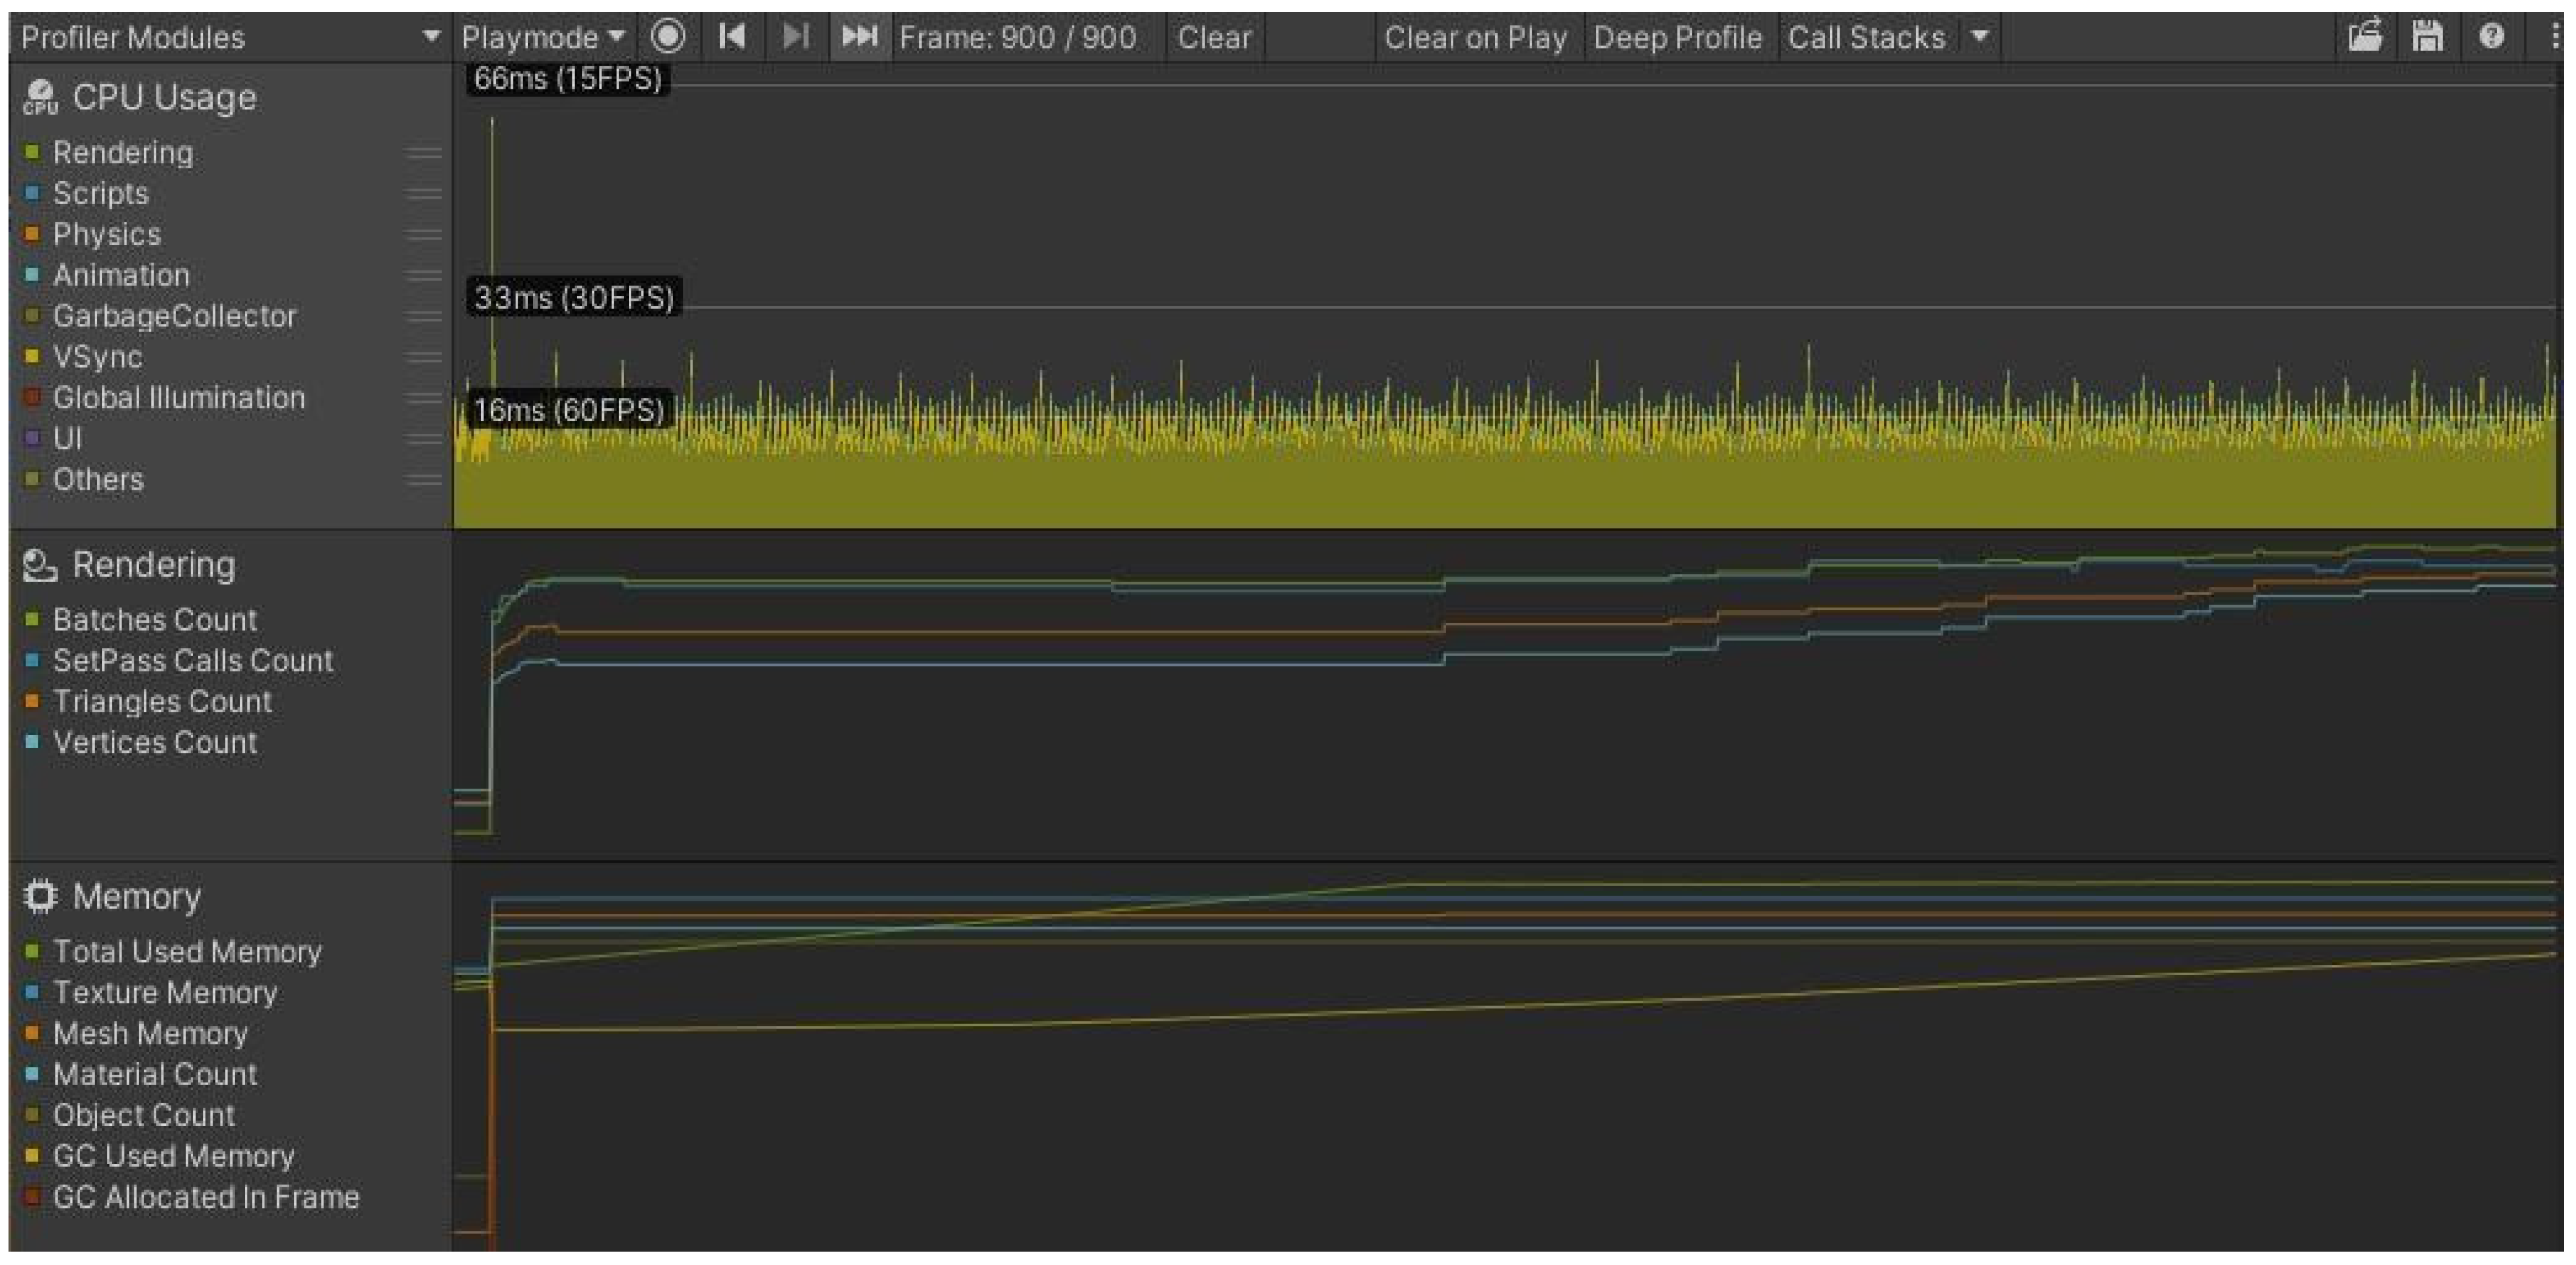
5.2. Gameplay Results on a Personal Computer

The next phase of the experiment refers to the performance of the game, which in production is required to be as smooth as possible for the best user experience. In this case, the main character of the game moved within the predefined map, destroying enemies, while new ones were constantly created. New enemies were created every half a second from specific points on the map. Moving on, the profiler graphs in Figure 12 show the components usage in the non-optimized version.
From the CPU usage diagram, we can see that there were spikes that reached close to the limit of 30 FPS and one that exceeded it. However, no comparison can be made yet. One more observation that can be made is that in the memory diagram, the GC allocation (red line in the memory diagram) was quite often seen. In Figure 13, a track about the state of the optimized version of the game is captured.
In the specific frames that represent the diagram of the CPU usage, there were smaller spikes in comparison to the non-optimized version and none touched the limit of 30 FPS. Furthermore, the line for the GC allocation had fewer spikes in the optimized version. In order to continue, more data from rendering and memory usage processes should be presented. For both rendering and memory usage there will be two frames under consideration: the first is the one that hit the lowest FPS, and the other is one that was close to 60 FPS.

5.2.1. Rendering Data

From the data presented in Figure 12 and Figure 13 we extracted for both game versions a snapshot with the lowest FPS and one with an FPS value close to 60. The differences between the two versions for the gameplay moment with the lowest FPS value are presented in Table 4, and those for the frame with a value of FPS close to 60 are presented in Table 5.
In Table 4, the rendering data that refer to the snapshot with the lowest FPS value for both game versions are presented. According to Table 4, it is obvious that in the optimized version there was a smaller number of set pass calls, draw calls and batches, which means that there was a slightly better grouping of objects. So, fewer resources were needed for displaying the objects because they were being drawn as one object. The variable triangles and vertices differ significantly between the two versions and that is because the models in the non-optimized version had more details and were a bit more realistic, which costs more resources in order to be drawn. Dynamic batching variables seemed to have lower values for the non-optimized version, and the reason behind that could be that in the optimized version there were more types of different objects being rendered. The next difference that appears has to do with used textures; in the optimized version their value was 18 with a size of 3.4 MB, while in the non-optimized version their value was 30 with a size of 4.7 MB. The variables render textures and render textures changes did not have much of a difference between the two versions, while the size of the render textures in memory was the same. A particular gap was observed in used buffer values where the optimized version had 5213 buffers with a size of 37.2 MB, while the non-optimized version had 12,542 buffers with a size of 95.4 MB. The values for vertex and index buffer upload were quite close in both cases. Lastly, in the optimized version shadows for some objects had been disabled because they did not offer any difference to the final game. That is one reason that can explain the difference for shadow casters, while another one is that there were fewer dynamic objects visible in the scene in the optimized version than in the non-optimized.
Table 5, as already mentioned, summarizes data collected for a frame with approximately 60 FPS. Most of the variables tended to follow the same pattern as those from Table 4. Those are set pass calls, draw calls and batches, which in the optimized version had slightly better results. The vertices and triangles continued to have a similar big gap between the two versions. The differentiation comes in the fields of dynamic batching, where with fewer draw calls and batches for the optimized version, more objects were sent to be drawn. A slight difference was recorded for shadow casters, which in the optimized version were 266 and in the non-optimized 262. This situation can be explained by the number of dynamic objects that existed in the scene and created shadows.

5.2.2. Memory Data

In this section, the results for the memory component of the part of the game that achieved the lowest FPS (Table 6) and the part with an FPS value close to 60 (Table 7) are presented.
Table 6 includes the data from memory usage, which represent the frame with the lowest FPS value reached by the game in the CPU diagram. According to Table 6, the total used memory for the optimized version was 0.93 MB, which is lower than the value for the non-optimized version. The GC usage went up to 19 MB for the optimized version. For this specific version, GC tends not to be called so often, but when it does it uses more memory. For the non-optimized version GC was 17.2 MB. The Gfx used memory showed a difference of 60.3 MB between the two versions with the non-optimized capturing most of it. Expensive models are one of the reasons that a game ends up with high Gfx used memory. Audio usage differed only by 0.1 MB, while for video the values were exactly the same. The memory being used for profiler purposes was 0.61 GB and 0.58 GB for the optimized and the non-optimized versions, respectively. However, this part of memory was captured only for monitoring purposes of the game and does not affect the final app. Similar results were obtained for the corresponding reserved variables. The total memory that the system needed in order to run the game (system used memory) for the optimized version was 1.81 GB, while for the non-optimized it was up to 1.98 GB. The rest of the variables refer to the number of game objects used from Unity. What is most interesting is the number of objects (game object count, scene object count and object count), which were particularly large for the optimized version. As already mentioned, the object pooling technique is responsible for this behavior. In more detail, the objects were created and disabled at the beginning. When there was a need for opponents, the game manager just made visible the number of enemies that it needed, without creating them from scratch and affecting the performance much. These actions explain their effect on the profiler and the reason why they did not consume much resources in the gameplay time.
The recording of memory data near the limit of 60 FPS is shown in Table 7. The tracks that accounted for the used and reserved memory were not very different from the results shown in Table 6. So, there was no difference in the relationship between the two versions. The same goes for the variables concerning the number of objects and their materials (textures, meshed, materials and animation clips). However, for the specific frame and especially for the optimized version, there were many memory allocations from GC but the memory size being allocated was smaller than that in the non-optimized version. Furthermore, it was the largest value for this variable among all the other recorded frames.

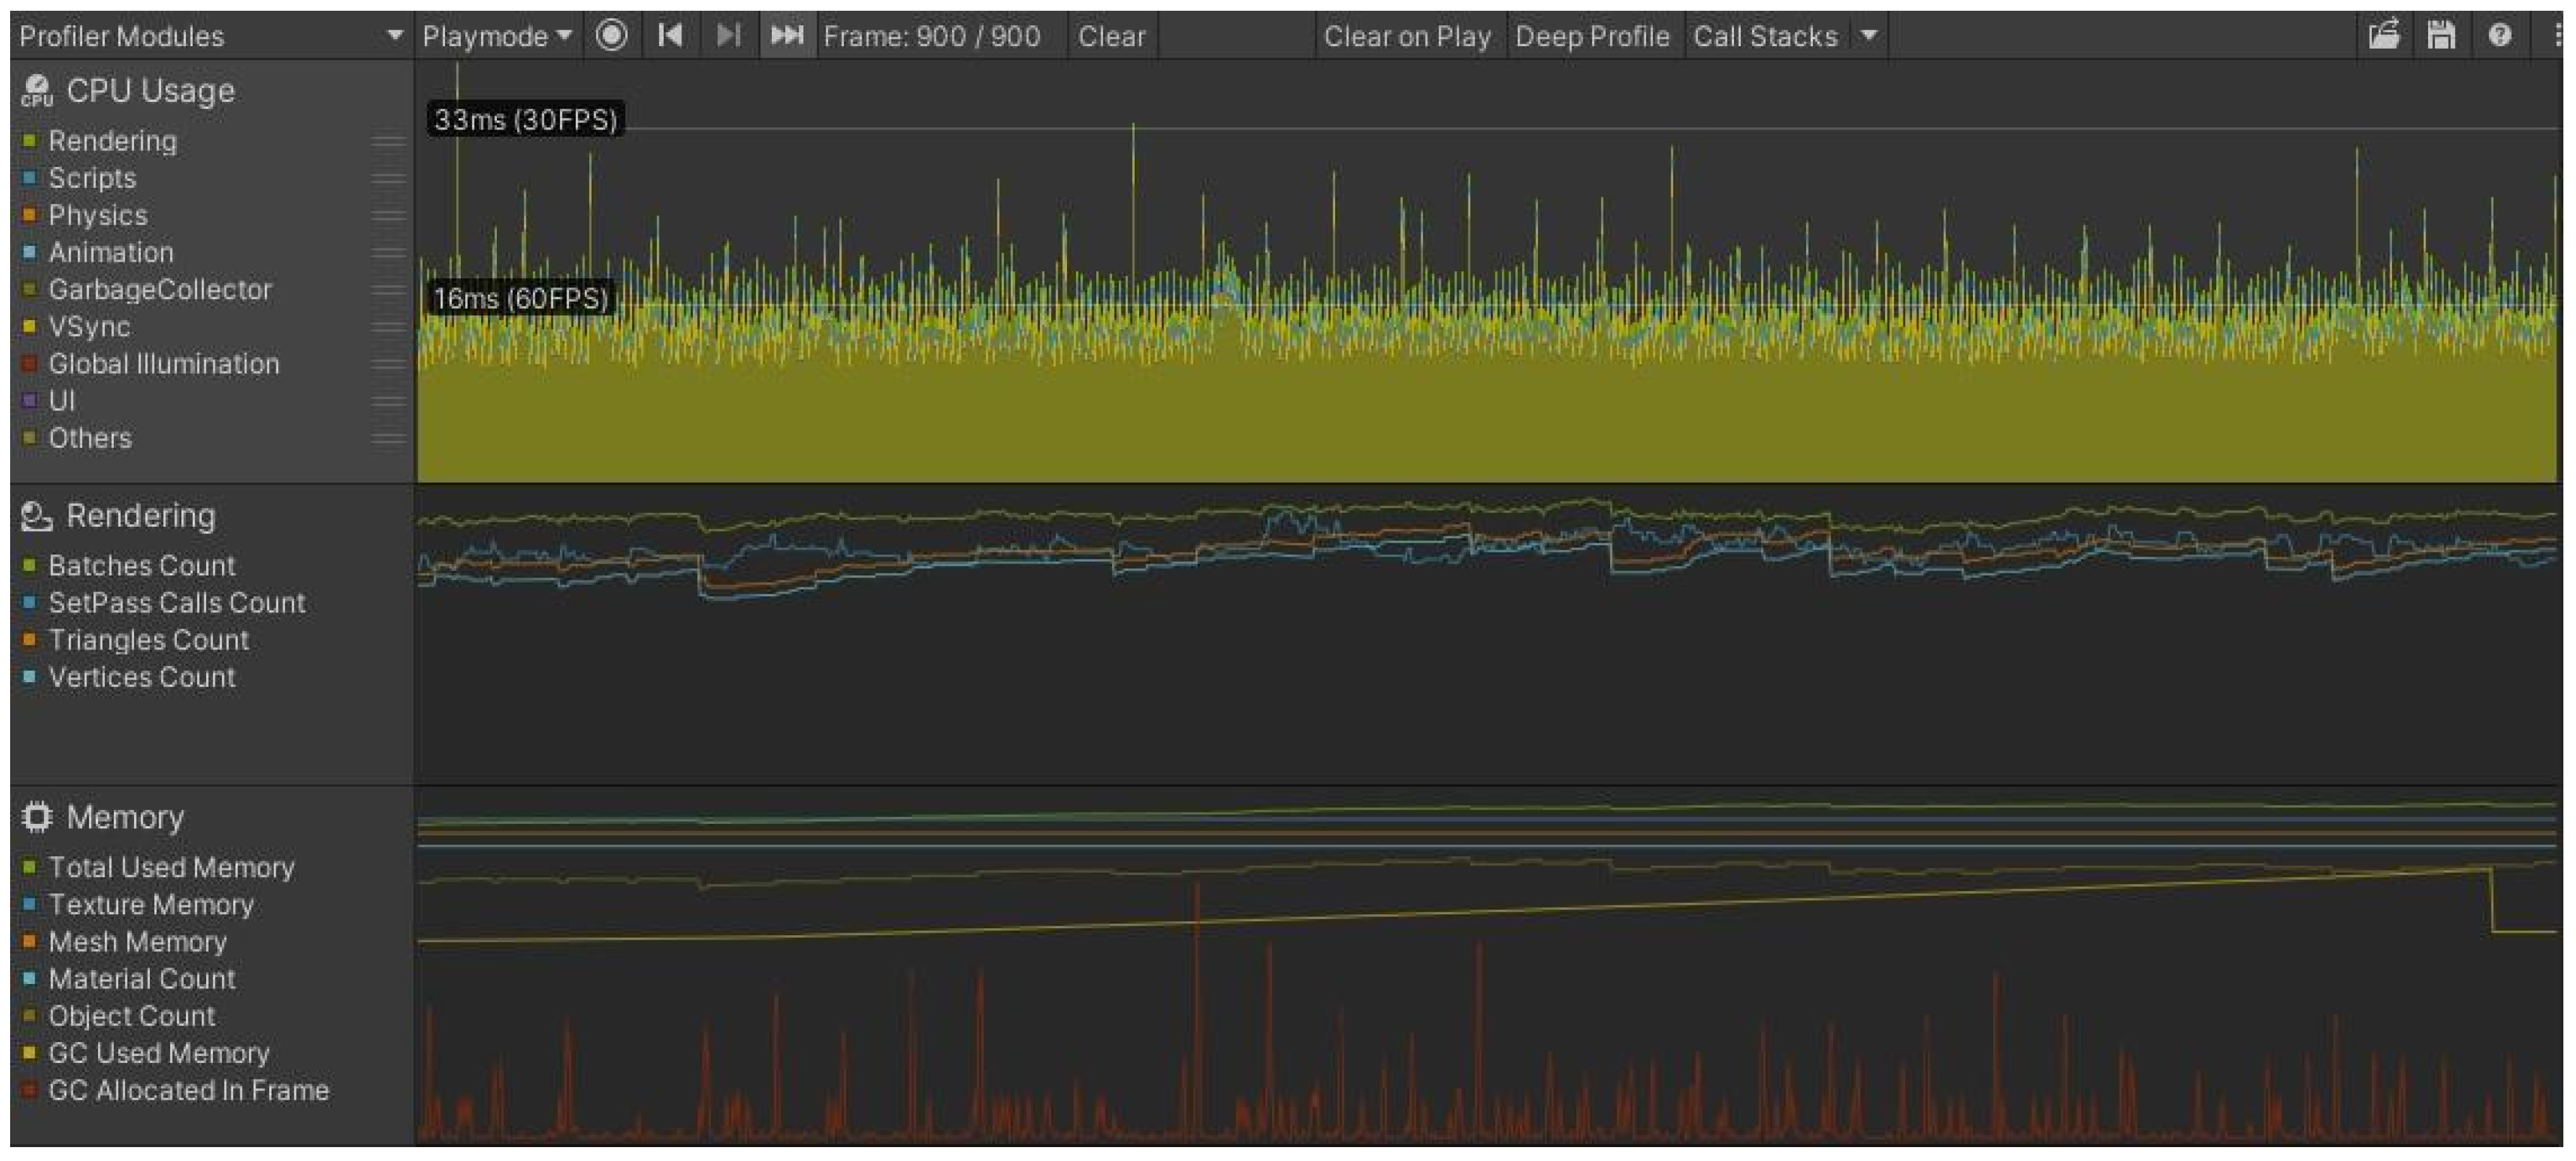
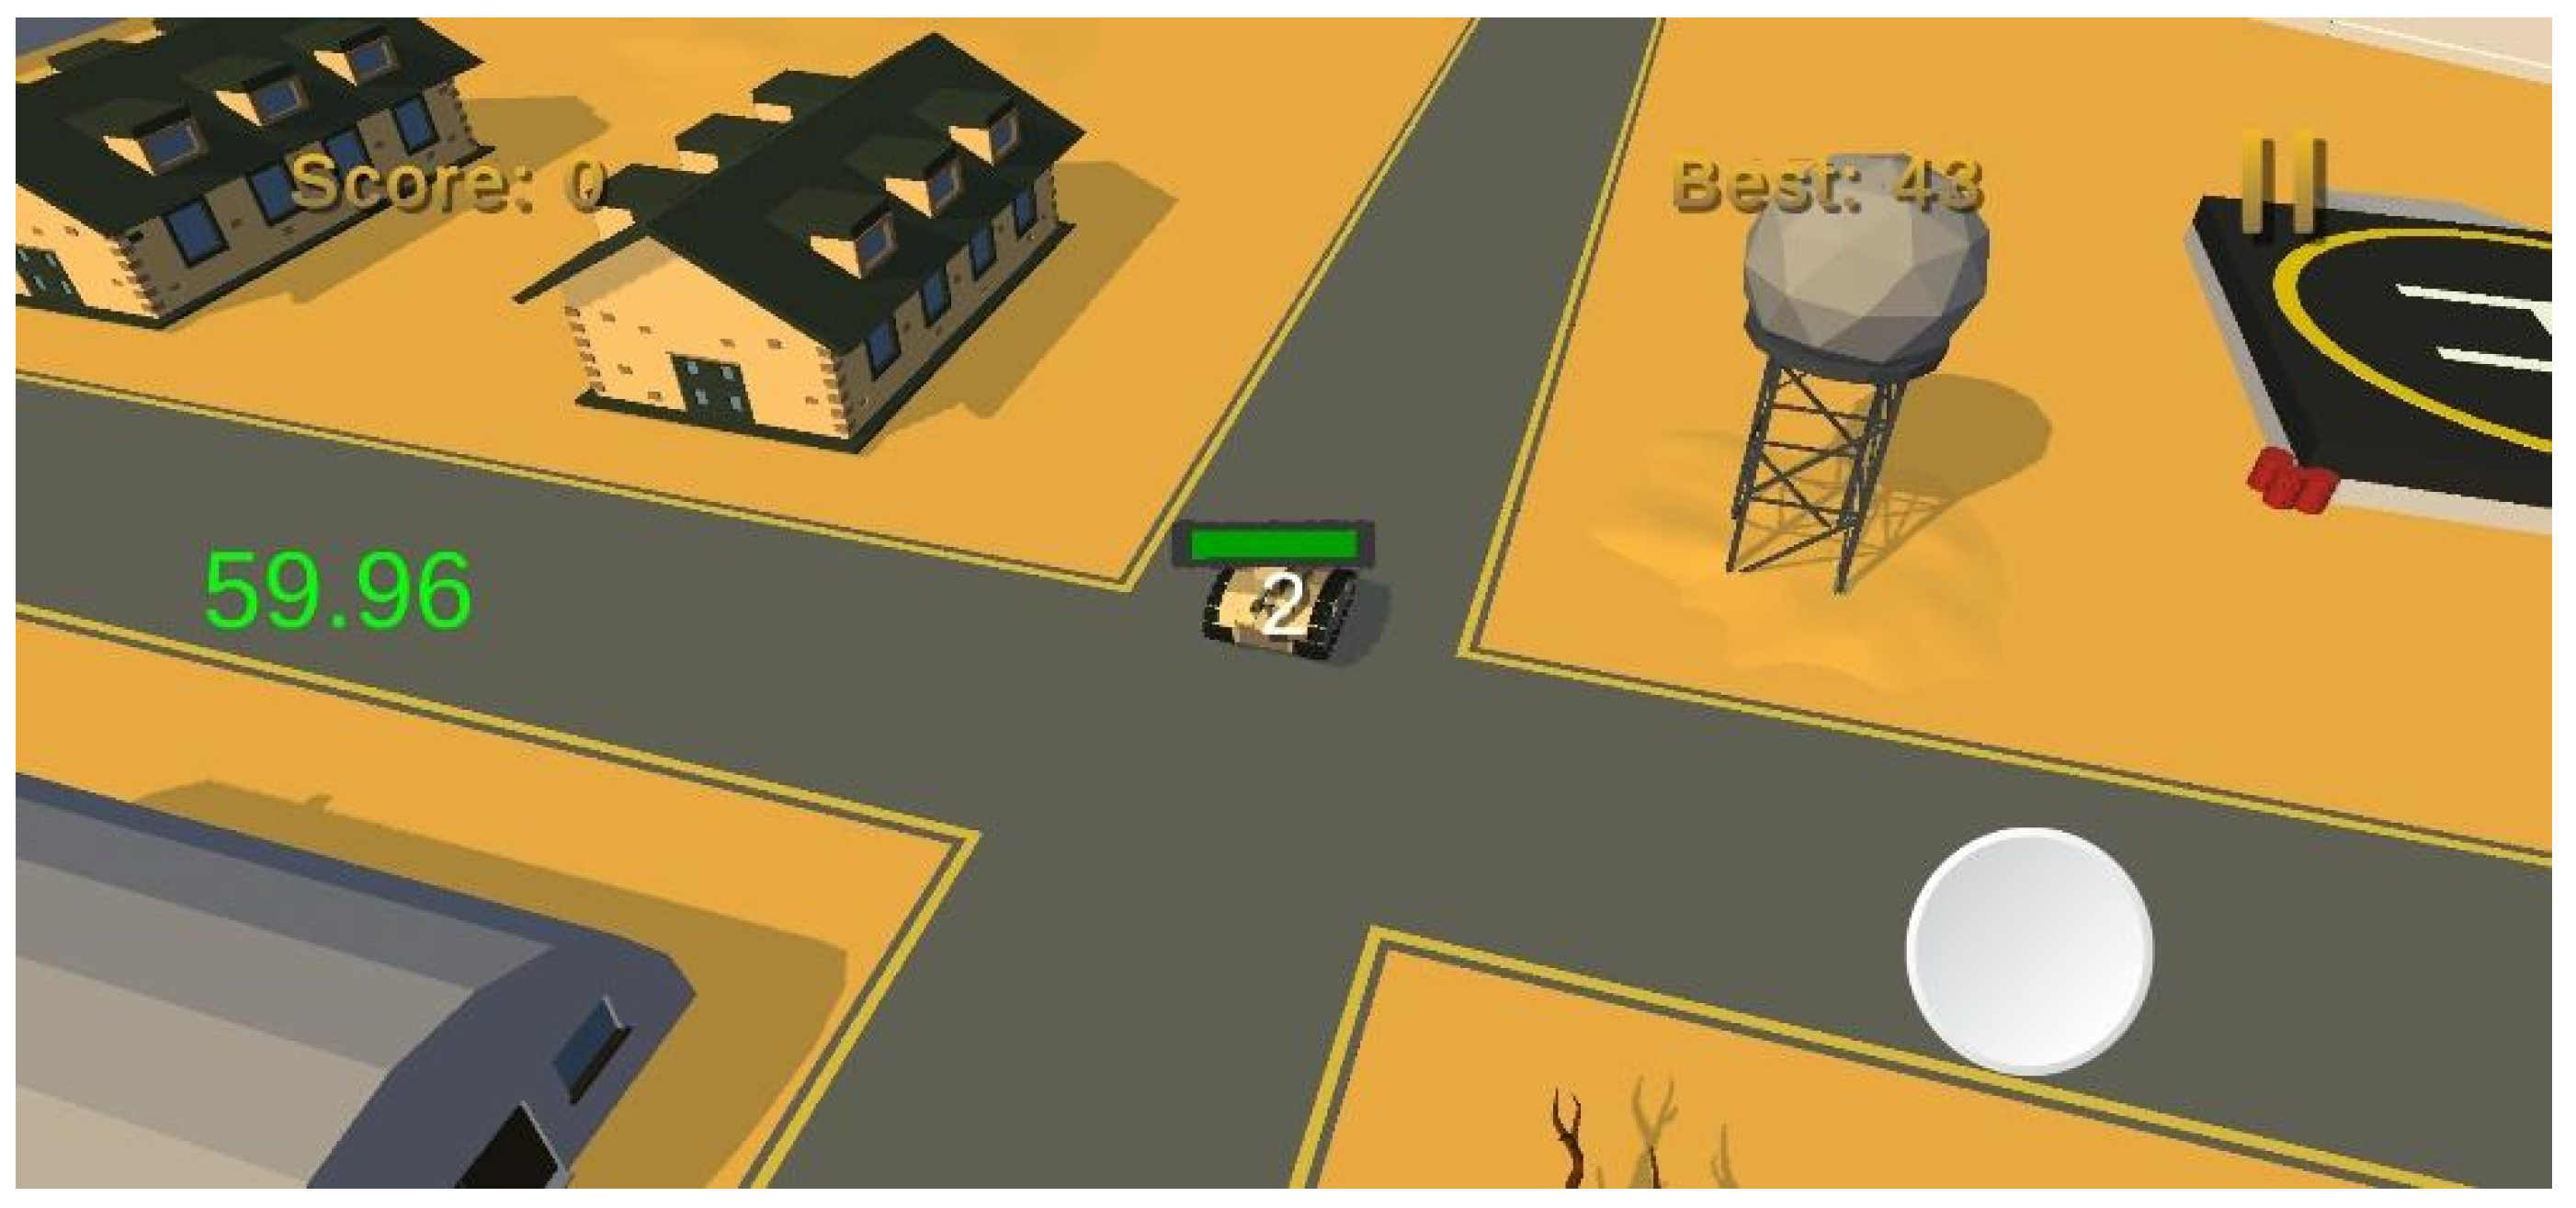
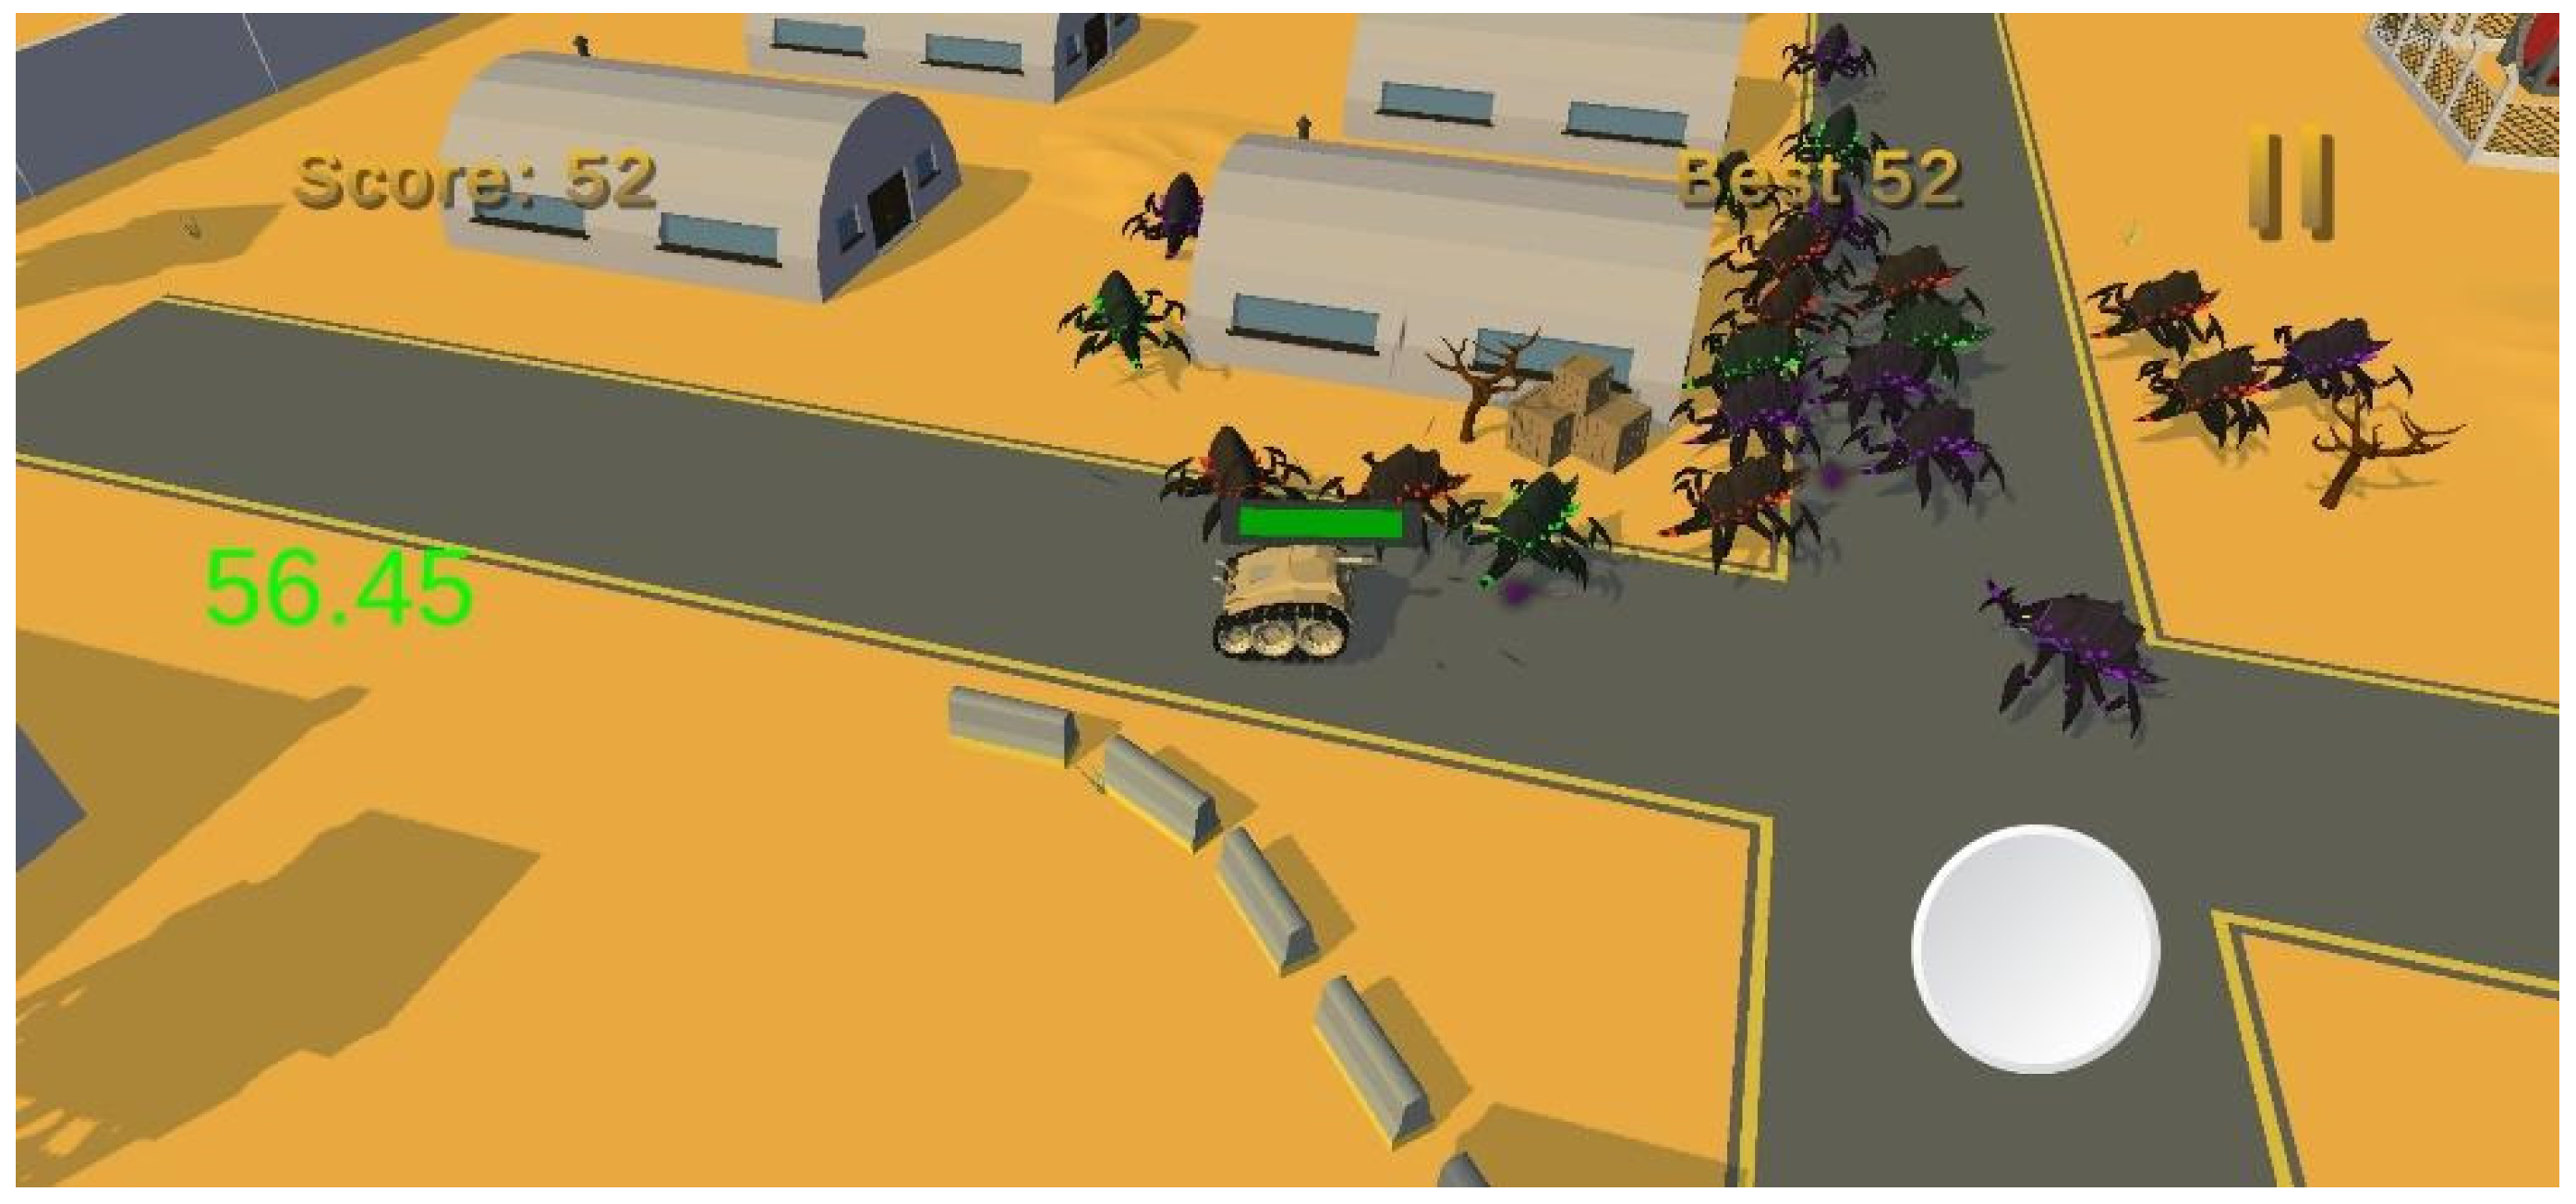
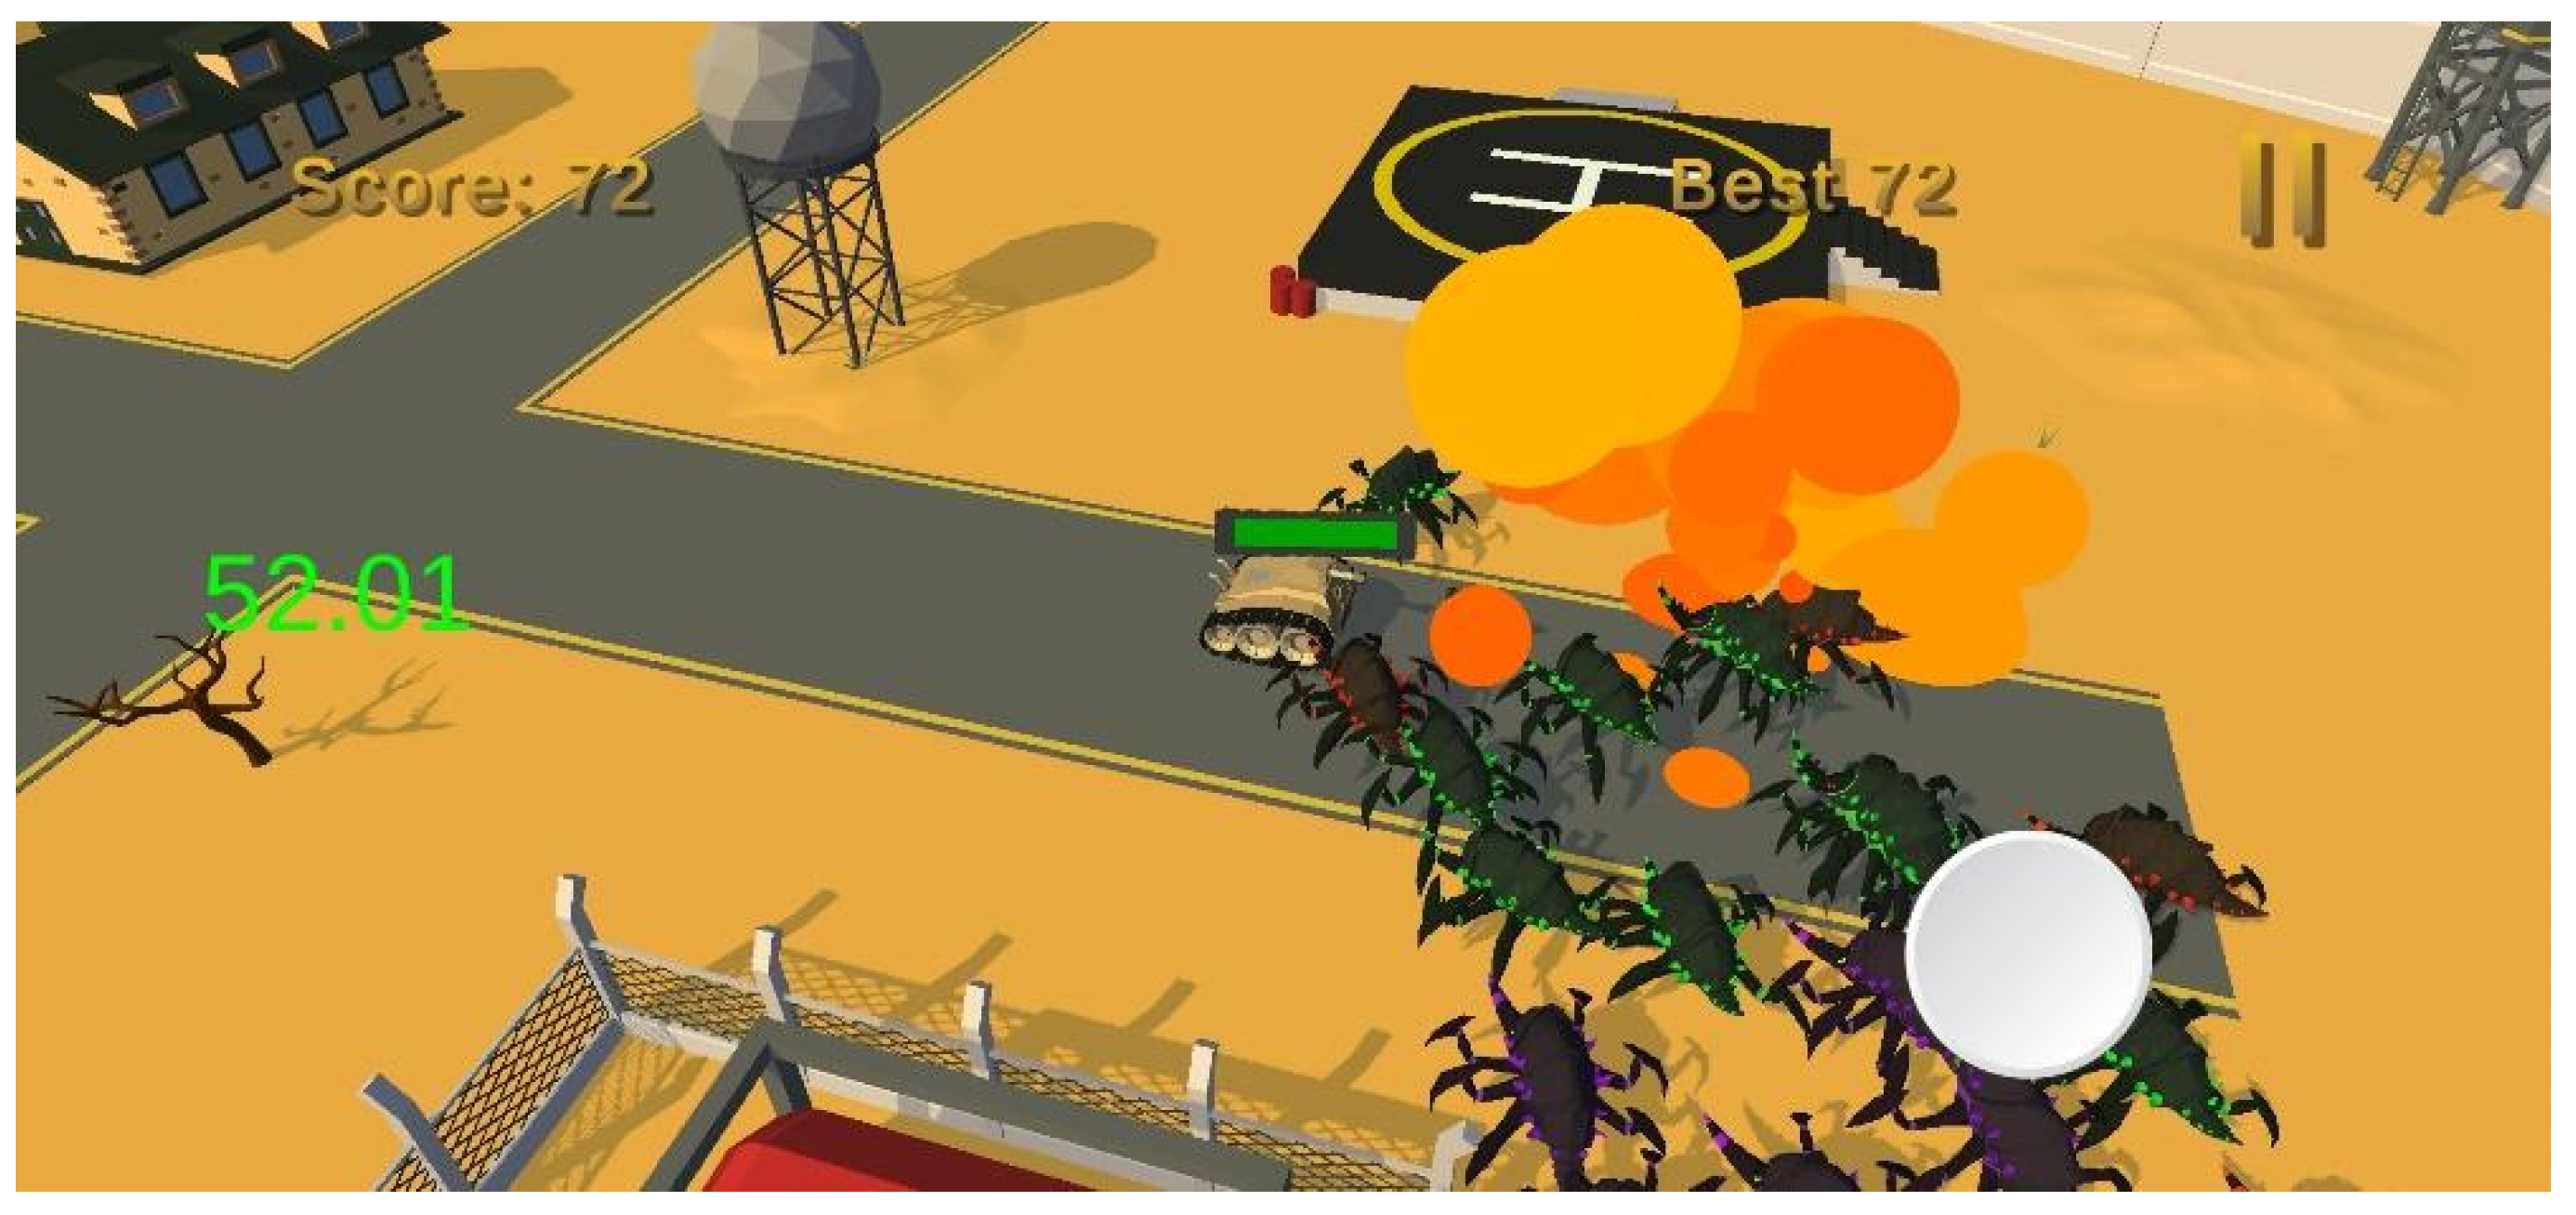
5.3. Gameplay on a Mobile Device

The analysis for the two versions of the game presented in Section 5.2 refers to a personal computer. Both the optimized and the non-optimized version did not cause any problem to the system, because it had quite a few resources compared to an Android mobile device. For the purposes of the experiment and in order to study an image of the game running under real conditions, a frame count was performed for the different versions on an Android device. The device that was used for the experiment was Xiaomi Mi Note 10 Lite and the specifications are presented in Table 8. The frame count was calculated via a script that is able to print the FPS on the screen. For the two versions of the game, representative snapshots from different parts of the game are presented along with the results.

5.3.1. Optimized Game on the Mobile Device

In Figure 14, a screenshot for the first seconds of beginning the optimized version of the game is presented, where most of the assets were finishing with loading.
In general, for the specific version the FPS value ranged between 50 and 60, regardless of the number of enemies and the various actions that can reduce performance on a system. Those actions are a high number of collisions between colliders, continuous creation and destruction of game objects, etc. As shown in Figure 14, the frames increased to 59.96 for the beginning of the game.
Figure 15 presents a screenshot of the game after some gameplay and the elimination of 52 enemies, with an FPS value of 56.45. At this point, if there was any interference with the smooth user experience it would have already made an appearance, but the optimization techniques imported inside the game were able to handle most of the issues that could have made the game unplayable. As anyone can see, there were plenty of opponents on the map that made collisions and tried to attack the main character. However, all these actions were not enough to change the smooth user experience.
A drop in the value of FPS was recorded after the extermination of 72 enemies, but even in this case it did not fall below the limit of 50 frames, as can be seen in Figure 16.

5.3.2. Non-Optimized Game on the Mobile Device

Figure 17 presents a snapshot for the beginning of the non-optimized game version with the lowest number of frames per second.
The FPS value for the specific case reached 52.13, which is quite reduced in comparison with the optimized version. From the early stages of the game, there was interference with the smooth user experience.
After 19 eliminations, the FPS value fell to 24.58 (Figure 18), which means that the game was not smooth any more. The FPS limits that can make a game playable or not are determined by the game type. Some games might be playable with 20–30 FPS, but for a game with a faster-paced gameplay it might have a negative effect on user reflexes. This is true, at least, for the newer games that are optimized for 60 FPS during release. So, for the non-optimized version the game could still be played but it did not offer the same experience as the optimized one. This situation continued for the duration of gameplay. After the elimination of 52 opponents, as shown in Figure 19, the frames were reduced even more and fell to a value of 22.15.
The differences between the two versions on a system with reduced resources were noticeable in contrast to the gameplay on the computer, where they seemed to be close. Lastly, in Figure 20 we can see that after 75 eliminations, the FPS value was 24.52.
The game in the non-optimized version came back to 50–60 FPS when there were a few or no enemies on the map.

6. Discussion and Conclusions

In this article, we investigated some basic optimization techniques which could be used during mobile game development with the aim of improving game performance in terms of CPU usage, rendering (GPU) and memory usage. The basic optimization techniques investigated collectively included low poly models, merge vertices, textures and materials, occlusion culling and object pooling. These techniques aim to optimize: the value of frames per second for achieving a smooth game experience; the number of triangles/polygons of the models; and the batches that are sent to the GPU for rendering. The low poly models, merge vertices and the creation of textures and materials in our study were accomplished with Blender. However, the same results could be accomplished by every 3D computer graphics software package [11]. Even though the Unity environment was used in our study, only one of the referenced techniques was described depending on it and that is occlusion culling. However, occlusion culling is a common technique offered in several game engines, such as Unreal Engine, Turbulenz, Sio2, Shiva, Ogre3D [12].
In order to investigate the impact of the aforementioned optimization techniques on game performance, two versions of a simple mobile game were implemented and comparatively analyzed. The one version used the referenced optimization techniques and the other did not, while both versions were tested in two different systems.
Initially, the two versions of the game were tested on a personal computer, where we recorded a snapshot with the lowest FPS value during the beginning of each game version. The results of the two versions were quite close, with the optimized version accomplishing better results for all the components (CPU usage, rendering and memory). At this point it must be stated that in the optimized version we used the object pooling algorithm and all the enemies were already on the scene, which explains the difference in the number of game objects. However, despite the multiple assets that existed on scene for the optimized version, it still had better performance [30].
The next phase of the study included a comparison between two in-game moments, for each version, where all the game mechanics were running (producing waves of enemies, attacking the player, the player is trying to eliminate enemies etc.). Two snapshots were extracted from the CPU usage diagram: one with the lowest FPS value from a set of 900 frames; and one where the FPS value was close to 60. Those two points were analyzed from the rendering and memory perspective. In terms of rendering, the optimized version gave slightly better results for most of the variables in both cases. In terms of memory usage, the non-optimized version used higher poly models, which means that the memory used during gameplay to store them was higher than that in the optimized version (Gfx memory). Furthermore, there were parts, like used audio and video, where values captured the same amount of memory for both versions. There were also parts such as GC that used less memory size for the non-optimized version than the optimized version, because there were fewer calls on GC to clear memory space. Overall, the optimized version made a better use of memory for both snapshots.
Lastly, we could not talk about mobile games without testing our game on an actual mobile device. This device was a Xiaomi Mi Note Lite 10 with the specifications mentioned in Table 8. For this part of the experiment, we compared the two versions during runtime. The differences in the FPS for the two versions were very clear in the mobile environment. From the beginning until the end of the game, the FPS for the optimized version ranged between the values of 50 and 60. This means that the user experience was smooth all the time. However, the non-optimized version could not keep up. The value of FPS when there was some action on the map was between 20 and 30, which caused the game to lag at some points.
In general, the optimization techniques that were investigated in the context of our study affected the performance in a positive way and were able to make the mobile game playable. Previous research on the field has investigated frame rate and resolutions [23], frame rate and player performance [24], character and mesh optimization in 3D games [11], optimization of collision detection in shooting games [9], execution offloading in 3D games [10], as well as optimization of energy consumption in mobile games [8]. Although several studies on optimization techniques in mobile games have been carried out, their results cannot be directly compared with the results of our study. In contrast with previous studies, we investigated the impact of a number of basic optimization techniques on a 3D mobile game collectively. These techniques are among the most well-known ones and are simple enough to be applied even by non-experts in the field of game development. The work presented can be utilized as a reference for applying the investigated optimization techniques in a straightforward manner, but also for replicating the study.
Future work could investigate the impact of each one of the examined optimization techniques on mobile game performance in isolation, while further optimization techniques could be investigated, such as code optimization and reducing unnecessary physics. Moreover, optimization of other critical performance areas could be investigated, such as [31]: loading speed; frame rate consistency; UI element loading; power consumption; thermal stress and so on.

Author Contributions

Conceptualization, G.K.; methodology, G.K.; software, G.K.; validation, G.K.; formal analysis, G.K.; investigation, G.K.; resources, G.K.; data curation, G.K.; writing—original draft preparation, G.K., S.X.; writing—review and editing, G.K., S.X.; visualization, G.K.; supervision, S.X.; project administration, G.K. All authors have read and agreed to the published version of the manuscript.

Funding

This research received no external funding.

Conflicts of Interest

The authors declare no conflict of interest.

References

  1. Chan, S. Mobile Game Revenue Finally Surpasses PC and Consoles Venture Beat. 2017. Available online: https://venturebeat.com/2017/07/13/mobile-game-revenue-finally-surpasses-pc-and-consoles/ (accessed on 17 January 2022).
  2. Chen, H.; Rong, W.; Ma, X.; Qu, Y.; Xiong, Z. An Extended Technology Acceptance Model for Mobile Social Gaming Service Popularity Analysis. Mob. Inf. Syst. 2017, 2017, 1–12. [Google Scholar] [CrossRef]
  3. Bhawar, P.; Ayer, N.; Sahasrabudhe, S. Methodology to create optimized 3D models using blender for Android devices. In Proceedings of the 2013 IEEE Fifth International Conference on Technology for Education (t4e 2013), Kharagpur, India, 18–20 December 2013; pp. 139–142. [Google Scholar]
  4. Trisnadoli, A.; Kreshna, J.A. Optimization of Educational Mobile Game Design ‘Ayo Wisata ke Riau’ based on User’s Perspective. IT J. Res. Dev. 2021, 6, 52–59. [Google Scholar] [CrossRef]
  5. Xanthopoulos, S.; Xinogalos, S. A review on location based services for mobile games. In Proceedings of the 20th Pan-Hellenic Conference on Informatics, Patras, Greece, 10–12 November 2016; pp. 1–6. [Google Scholar]
  6. Chehimi, F.; Coulton, P.; Edwards, R. Evolution of 3D mobile games development. Pers. Ubiquitous Comput. 2006, 12, 19–25. [Google Scholar] [CrossRef]
  7. Unity Technologies. Practical Guide to Optimization for Mobiles. 2020. Available online: https://docs.unity3d.com/2019.3/Documentation/Manual/MobileOptimizationPracticalGuide.html (accessed on 30 December 2021).
  8. Choi, Y.; Park, S.; Jeon, S.; Ha, R.; Cha, H. Optimizing Energy Consumption of Mobile Games. IEEE Trans. Mob. Comput. 2021. [Google Scholar] [CrossRef]
  9. Ng, K.W.; Yeap, Y.W.; Tan, Y.H.; Ghauth, K.I. Collision detection optimization on mobile device for shoot’em up game. In Proceedings of the 2012 International Conference on Computer & Information Science (ICCIS), Chongqing China, 17–19 August 2012; Volume 1, pp. 464–468. [Google Scholar]
  10. Kwon, D.; Yang, S.; Paek, Y.; Ko, K. Optimization techniques to enable execution offloading for 3D video games. Multimedia Tools Appl. 2016, 76, 11347–11360. [Google Scholar] [CrossRef]
  11. Hasan, R.; Chakraborti, S.; Hossain, Z.; Ahamed, T.; Abdul Hamid, M.; Mridha, M.F. Character and Mesh Optimization of Modern 3D Video Games. In Advances in Data and Information Sciences; Springer: Singapore, 2020; pp. 655–666. [Google Scholar]
  12. Christopoulou, Ε.; Xinogalos, S. Overview and Comparative Analysis of Game Engines for Desktop and Mobile Devices. Int. J. Serious Games 2017, 4, 21–36. [Google Scholar] [CrossRef] [Green Version]
  13. Deering, M.F. Sun Microsystems Inc. Estimating Graphics System Performance for Polygons. U.S. Patent 6,313, 838, 2021. [Google Scholar]
  14. Unity Technologies. Modeling Character for Optimal Performance. 2017. Available online: https://docs.unity3d.com/560/Documentation/Manual/ModelingOptimizedCharacters.html (accessed on 3 January 2021).
  15. Blender Documentation Team. Blender 2.80 Manua –Vertex Tools. Available online: https://docs.blender.org/manual/en/2.80/modeling/meshes/editing/vertices.html (accessed on 9 January 2021).
  16. One Wheel Studio. How to Use Color Palettes with Low Poly Models in Unity and Blender 2.8. 2019. Available online: https://www.youtube.com/watch?v=-9cuTjOBbiM&t=8s (accessed on 10 January 2021).
  17. Unity. 7 Ways to Optimize Your Unity Project with URP. 2020. Available online: https://www.youtube.com/watch?v=NFBr21V0zvU (accessed on 3 February 2021).
  18. 2020 Unity Technologies. Using Occlusion Culling with Dynamic GameObjects. 2018. Available online: https://docs.unity3d.com/Manual/occlusion-culling-dynamic-gameobjects.html (accessed on 3 February 2021).
  19. Wang, X. Game Design Patterns for CPU Performance Gain in Games. Bachelor Thesis, Faculty of Informatics, TU Wien, Vienna, Austria , 2016. [Google Scholar]
  20. Unity. Optimization tips for maximum performance–Part 1|Unite Now 2020. 2020. Available online: https://www.youtube.com/watch?v=ZRDHEqy2uPI (accessed on 20 December 2020).
  21. Unity. How to profile and optimize a game|Unite Now 2020. 13 July 2020. Available online: https://www.youtube.com/watch?v=epTPFamqkZo (accessed on 2 January 2021).
  22. Brunne, D. Frame Rate: A Beginner’s Guide TechSmith. Available online: https://www.techsmith.com/blog/frame-rate-beginners-guide/ (accessed on 3 January 2021).
  23. Claypool, M.; Claypool, K. Perspectives, frame rates and resolutions: it’s all in the game. In Proceedings of the 4th International Conference on Foundations of Digital Games, San Luis Obispo, CA, USA, 26–30 August 2009; pp. 42–49. [Google Scholar]
  24. Claypool, K.T.; Claypool, M. On frame rate and player performance in first person shooter games. Multimed. Syst. 2007, 13, 3–17. [Google Scholar] [CrossRef] [Green Version]
  25. Unity Technologies. Draw Call Batching. 2015. Available online: https://docs.unity3d.com/520/Documentation/Manual/DrawCallBatching.html (accessed on 3 January 2021).
  26. Zhang, A.; Chen, K.; Johan, H.; Erdt, M. High performance texture streaming and rendering of large textured 3d cities. In Proceedings of the 2020 International Conference on Cyberworlds (CW), 29 September–1 October 2020; pp. 17–24. [Google Scholar]
  27. Unity. Unite Europe 2016–Optimizing Mobile Applications. [Online video]. 13 July 2016. Available online: https://www.youtube.com/watch?v=j4YAY36xjwE&t=1446s&ab_channel=Unity (accessed on 2 January 2021).
  28. Unity Technologies. Rendering Profiler Module. 2021. Available online: https://docs.unity3d.com/2020.1/Documentation/Manual/ProfilerRendering.html (accessed on 10 December 2021).
  29. Unity Technologies. Memory Profiler Module. 2021. Available online: https://docs.unity3d.com/Manual/ProfilerMemory.html (accessed on 10 December 2021).
  30. Lehtola, A. Optimizing Unity Projects. Bachelor Thesis, Business Administration, Business Information Technology, Kajaanin Ammatikorkeakoulu University of Applied Sciences, Kajaani, Finland, 2018. [Google Scholar]
  31. Android Developer. Improve Your Game’s Performance. Available online: https://developer.android.com/games/optimize (accessed on 10 March 2022).
Figure 1. Menu panel on Blender for the decimate modifier.
Modelling 03 00014 g001
Figure 2. UV map example of a barrel.
Modelling 03 00014 g002
Figure 3. Selected faces on desired color inside the pallet.
Modelling 03 00014 g003
Figure 4. Set game object as occluder and occludee static.
Modelling 03 00014 g004
Figure 5. (a) Barrack model from the improved version of the game. (b) Barrack model from the non-improved version of the game.
Modelling 03 00014 g005
Figure 6. (a) Water tower model from the improved version of the game. (b) Water tower model from the non-improved version of the game.
Modelling 03 00014 g006
Figure 7. (a) Tree model from the improved version of the game. (b) Tree model from the non-improved version of the game.
Modelling 03 00014 g007
Figure 8. (a) Sand pile model from the improved version of the game. (b) Tree model from the non-improved version of the game.
Modelling 03 00014 g008
Figure 9. (a) Red enemy model from the improved version of the game. (b) Red enemy model from the non-improved version of the game.
Modelling 03 00014 g009
Figure 10. Profiler results for the beginning of the non-optimized version of the game.
Modelling 03 00014 g010
Figure 11. Profiler results for the beginning of the optimized version of the game.
Modelling 03 00014 g011
Figure 12. Profiler results for gameplay of the non-optimized version of the game.
Modelling 03 00014 g012
Figure 13. Profiler results for the gameplay of the optimized version of the game.
Modelling 03 00014 g013
Figure 14. Beginning of the optimized version of the game.
Modelling 03 00014 g014
Figure 15. Snapshot after the elimination of 52 enemies in the optimized version of the game.
Modelling 03 00014 g015
Figure 16. Snapshot after the elimination of 72 enemies in the optimized version of the game.
Modelling 03 00014 g016
Figure 17. Beginning of the non-optimized version of the game.
Modelling 03 00014 g017
Figure 18. Snapshot after the elimination of 19 enemies in the non-optimized version of the game.
Modelling 03 00014 g018
Figure 19. Snapshot after the elimination of 52 enemies in the non-optimized version of the game.
Modelling 03 00014 g019
Figure 20. Snapshot after the elimination of 75 enemies in the non-optimized version of the game.
Modelling 03 00014 g020
Table 1. Triangle count for some of the models in improved and non-improved versions of the game.
ModelImproved (Triangles)Non-Improved (Triangles)
Barrack8086584
Tree21905640
Water tank44006088
Sand2512130,050
Enemy329625,585
Table 2. Rendering data for both versions from the beginning frame in CPU usage diagram.
VariablesOptimized VersionNon-Optimized Version
SetPass Calls4957
Draw Calls103109
Batches103109
Triangles175.4 k734.8 k
Vertices307.3 k656.4 k
Used Textures13/3.3 MB25/3.4 MB
Render Textures12/103.5 MB13/93.7 MB
Render Textures Changes35
Used Buffer470/22.2 MB2013/38.3 MB
Vertex Buffer Upload in Frame128/20.6 MB140/32.6 MB
Index Buffer Upload in Frame114/1.3 MB126/3.2 MB
Shadow Casters8978
Table 3. Memory data for both versions from the beginning frame in the CPU usage diagram.
VariablesOptimized VersionNon-Optimized Version
Total Used Memory0.63 GB0.82 GB
GC Used15.4 MB14.4 MB
Gfx Used45.2 MB61.9 MB
Audio Used1.9 MB1.9 MB
Video Used264 B264 B
Profiler (Used)375.1 MB0.53 GB
Total Reserved Memory0.88 GB1.08 GB
GC Reserved32.8 MB23.7 MB
Gfx Reserved45.2 MB61.9 MB
Audio Reserved1.9 MB1.9 MB
Video Reserved264 B264 B
Profiler (Reserved)391.0 MB0.55 GB
System Used Memory1.51 GB1.68 GB
Textures834/154.1 MB808/146.2 MB
Meshes109/62.7 MB123/102.5 MB
Materials110/234.7 MB102/245.8 KB
Animation Clips29/5.5 MB35/8.5 MB
Asset Count59926456
Game Object Count5413450
Scene Object Count137611929
Object Count197538385
GC allocation in Frame6084/0.9 B3853/0.6 MB
Table 4. Rendering data from a gameplay snapshot with the lowest FPS in the CPU usage diagram.
VariablesOptimized VersionNon-Optimized Version
Set Pass Calls6065
Draw Calls227248
Batches224246
Triangles490.3 k3.5 M
Vertices1.0 M4.8 M
(Dynamic Batching)
Batched Draw Calls95
Batches63
Triangles23.1 k23.2 k
Vertices15.5 k15.7 k
(End Dynamic Batching)
Used Textures18/3.5 MB30/4.7 MB
Render Textures12/103.7 MB13/103.7 MB
Render Textures Changes23
Used Buffer5213/37.2 MB12542/95.4 MB
Vertex Buffer Upload in Frame5/367.7 KB5/374.1 KB
Index Buffer Upload in Frame3/135.2 KB4/135.6 KB
Shadow Casters253263
Table 5. Rendering data for a frame with approximately 60 FPS in the CPU usage diagram.
VariablesOptimized VersionNon-Optimized Version
Set Pass Calls6770
Draw Calls253260
Batches249253
Triangles574.7 k3.4 M
Vertices1.2 M4.8 M
(Dynamic Batching)
Batched Draw Calls1113
Batches76
Triangles41.5 k38.6 k
Vertices27.9 k26.1 k
(End Dynamic Batching)
Used Textures18/3.5 MB28/3.5 MB
Render Textures12/103.7 MB13/103.7 MB
Render Textures Changes23
Used Buffer4933/37.3 MB12522/93.3 MB
Vertex Buffer Upload in Frame5/367.7 KB5/374.1 KB
Index Buffer Upload in Frame5/0.6 MB4/0.6 MB
Shadow Casters266262
Table 6. Memory data for the frame with the lowest FPS in CPU usage diagram.
VariablesOptimized VersionNon-Optimized Version
Total Used Memory0.93 GB0.99 GB
GC Used19.0 MB17.2 MB
Gfx Used66.1 MB128.5 MB
Audio Used2.9 MB2.8 MB
Video Used264 B264 B
Profiler (Used)0.61 GB0.58 GB
Total Reserved Memory1.16 GB1.23 GB
GC Reserved24.6 MB24.4 MB
Gfx Reserved66.1 MB128.5 MB
Audio Reserved2.9 MB2.8 MB
Video Reserved264 B264 B
Profiler (Reserved)0.63 GB0.60 GB
System Used Memory1.81 GB1.98 GB
Textures878/166.3 MB922/175.1 MB
Meshes107/62.7 MB133/104.2 MB
Materials103/234.7 MB196/251.1 KB
Animation Clips29/5.5 MB35/8.5 MB
Asset Count59236464
Game Object Count54582097
Scene Object Count14,0065585
Object Count19,92912,049
GC Allocation in Frame9/506 B6/384 B
Table 7. Memory data from a frame close to 60 frames per second in the CPU usage diagram.
VariablesOptimized VersionNon-Optimized Version
Total Used Memory0.85 GB1.00 GB
GC Used16.4 MB17.7 MB
Gfx Used66.1 MB126.4 MB
Audio Used2.9 MB2.8 MB
Video Used264 B264 B
Profiler (Used)0.58 GB0.59 GB
Total Reserved Memory1.15 GB1.24 GB
GC Reserved24.6 MB24.4 MB
Gfx Reserved66.1 MB126.4 MB
Audio Reserved2.9 MB2.8 MB
Video Reserved264 B264 B
Profiler (Reserved)0.61 GB0.62 GB
System Used Memory1.80 GB1.99 GB
Textures878/166.3 MB922/175.1 MB
Meshes107/62.7 MB133/104.2 MB
Materials103/234.7 MB106/251.1 KB
Animation Clips29/5.5 MB35/8.5 MB
Asset Count59236464
Game Object Count54652105
Scene Object Count140325629
Object Count1995512093
GC allocation in Frame199/57.3 KB7/424 KB
Table 8. Mobile device specifications.
Xiaomi Mi Note 10 Lite Specifications
CPUQualcomm SDM730 Snapdragon Octa-core MAX 2.2 GHz
RAM6 GB
Storage64 GB
Display6.47 inches
BatterLi-Po 5260 mAh
Publisher’s Note: MDPI stays neutral with regard to jurisdictional claims in published maps and institutional affiliations.

