A Comparative Study on the Efficiency of Reliability Methods for the Probabilistic Analysis of Local Scour at a Bridge Pier in Clay-Sand-Mixed Sediments

 ,
,  , and
, and 
Abstract
:1. Introduction
2. Materials and Methods
2.1. Scour Depth Prediction Models
2.1.1. Deterministic Scour Depth Prediction Model
2.1.2. Probabilistic Scour Depth Prediction Model
2.2. Review of the Simulation Methods for the Reliability Analysis
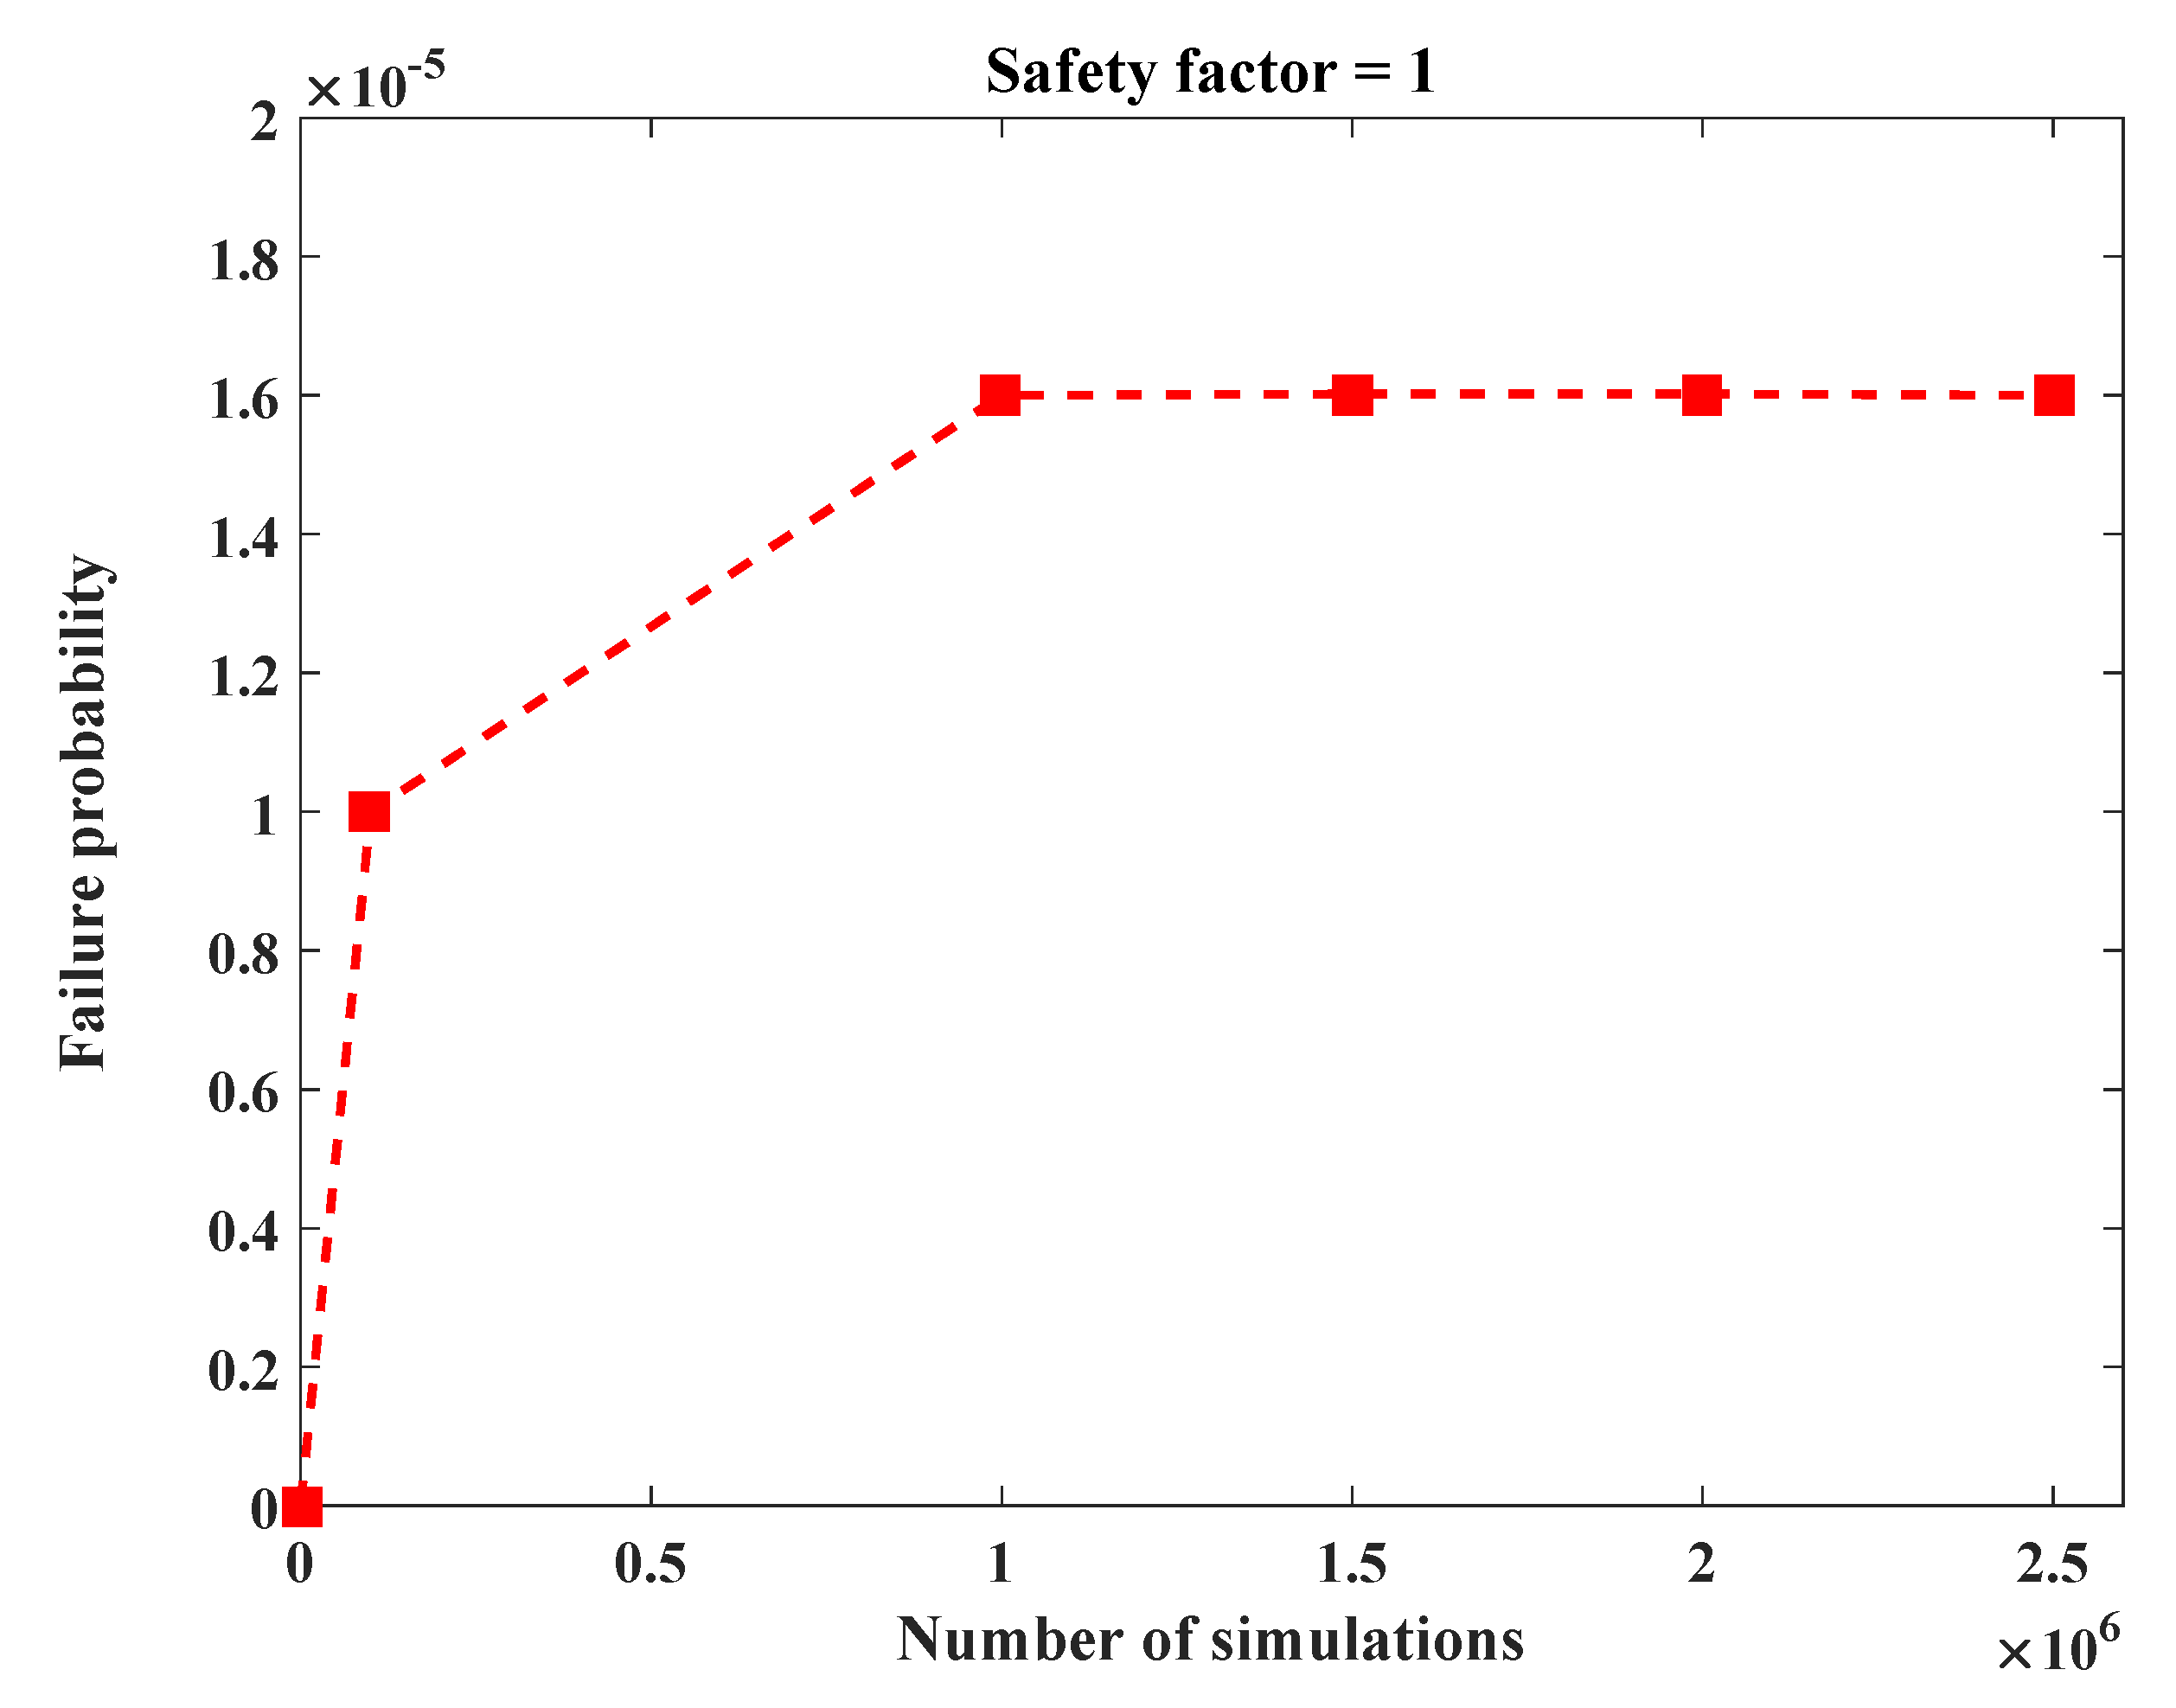
2.2.1. Monte Carlo Simulation (MCS)
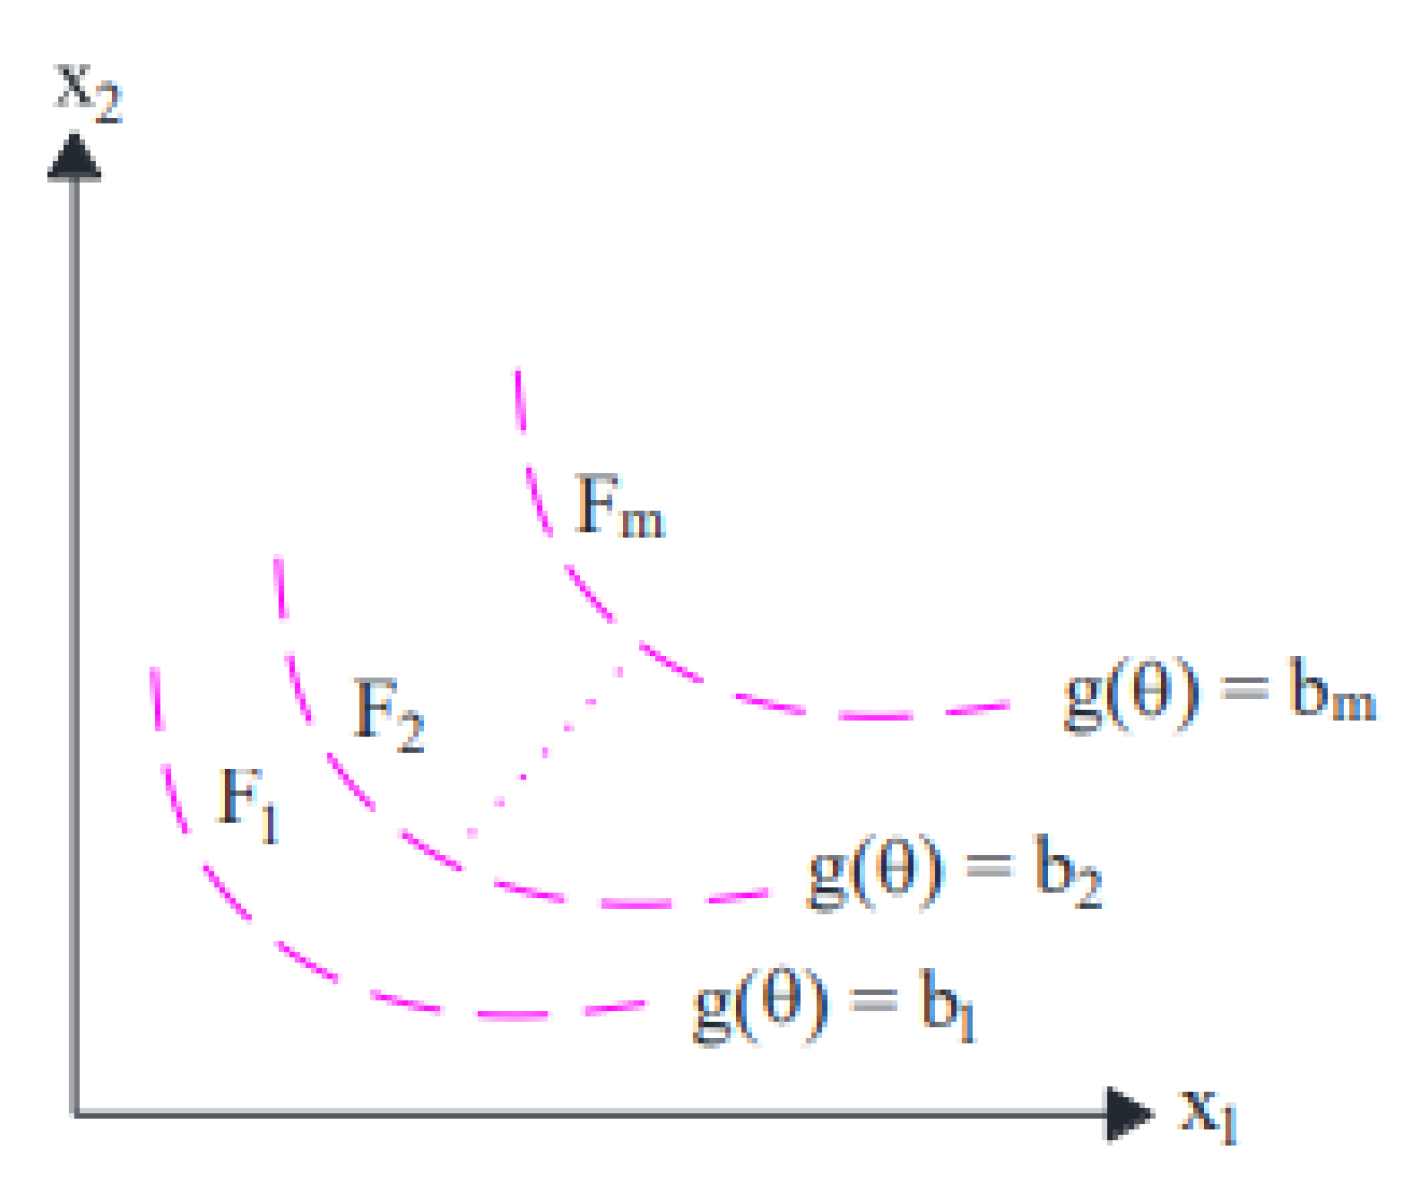
2.2.2. Importance Sampling (IS)
2.2.3. Subset Simulation (SS)
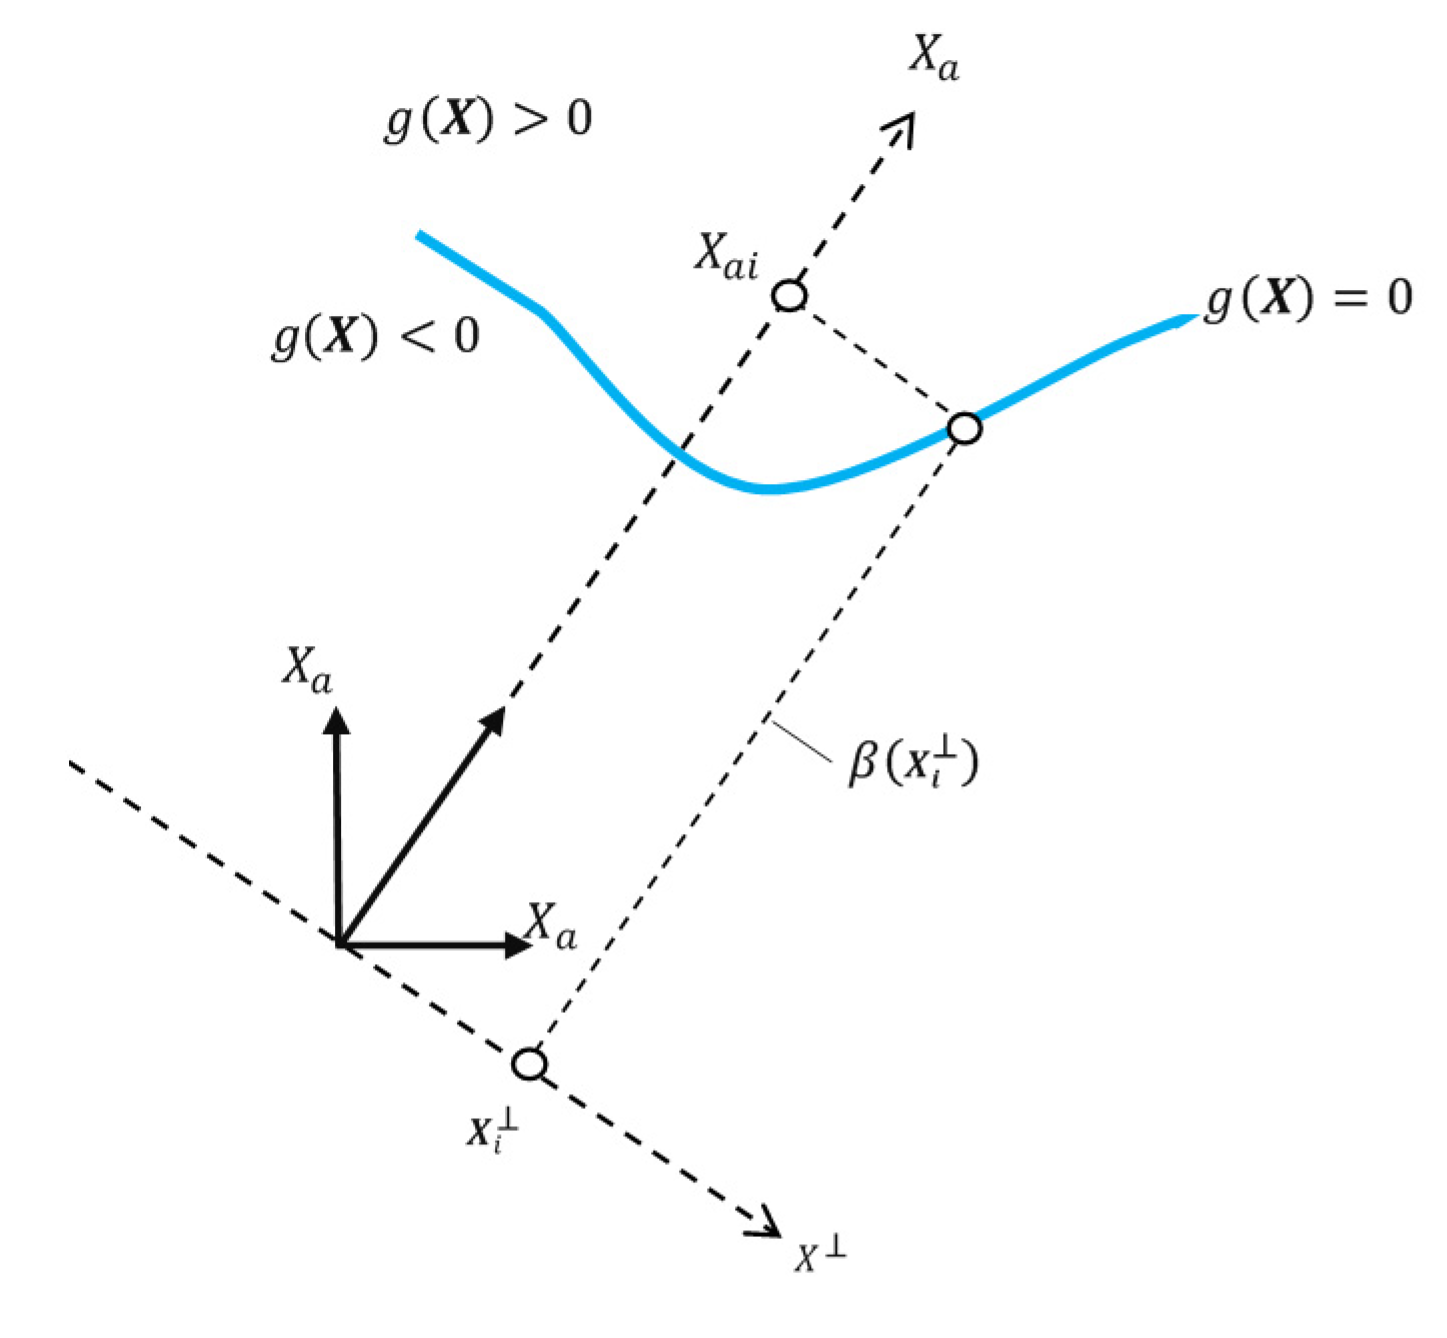
2.2.4. Line Sampling (LS)
2.2.5. Directional Sampling (DS)
3. Implementation, Results, and Discussions
3.1. Case Study
3.2. Reliability Methods Performance
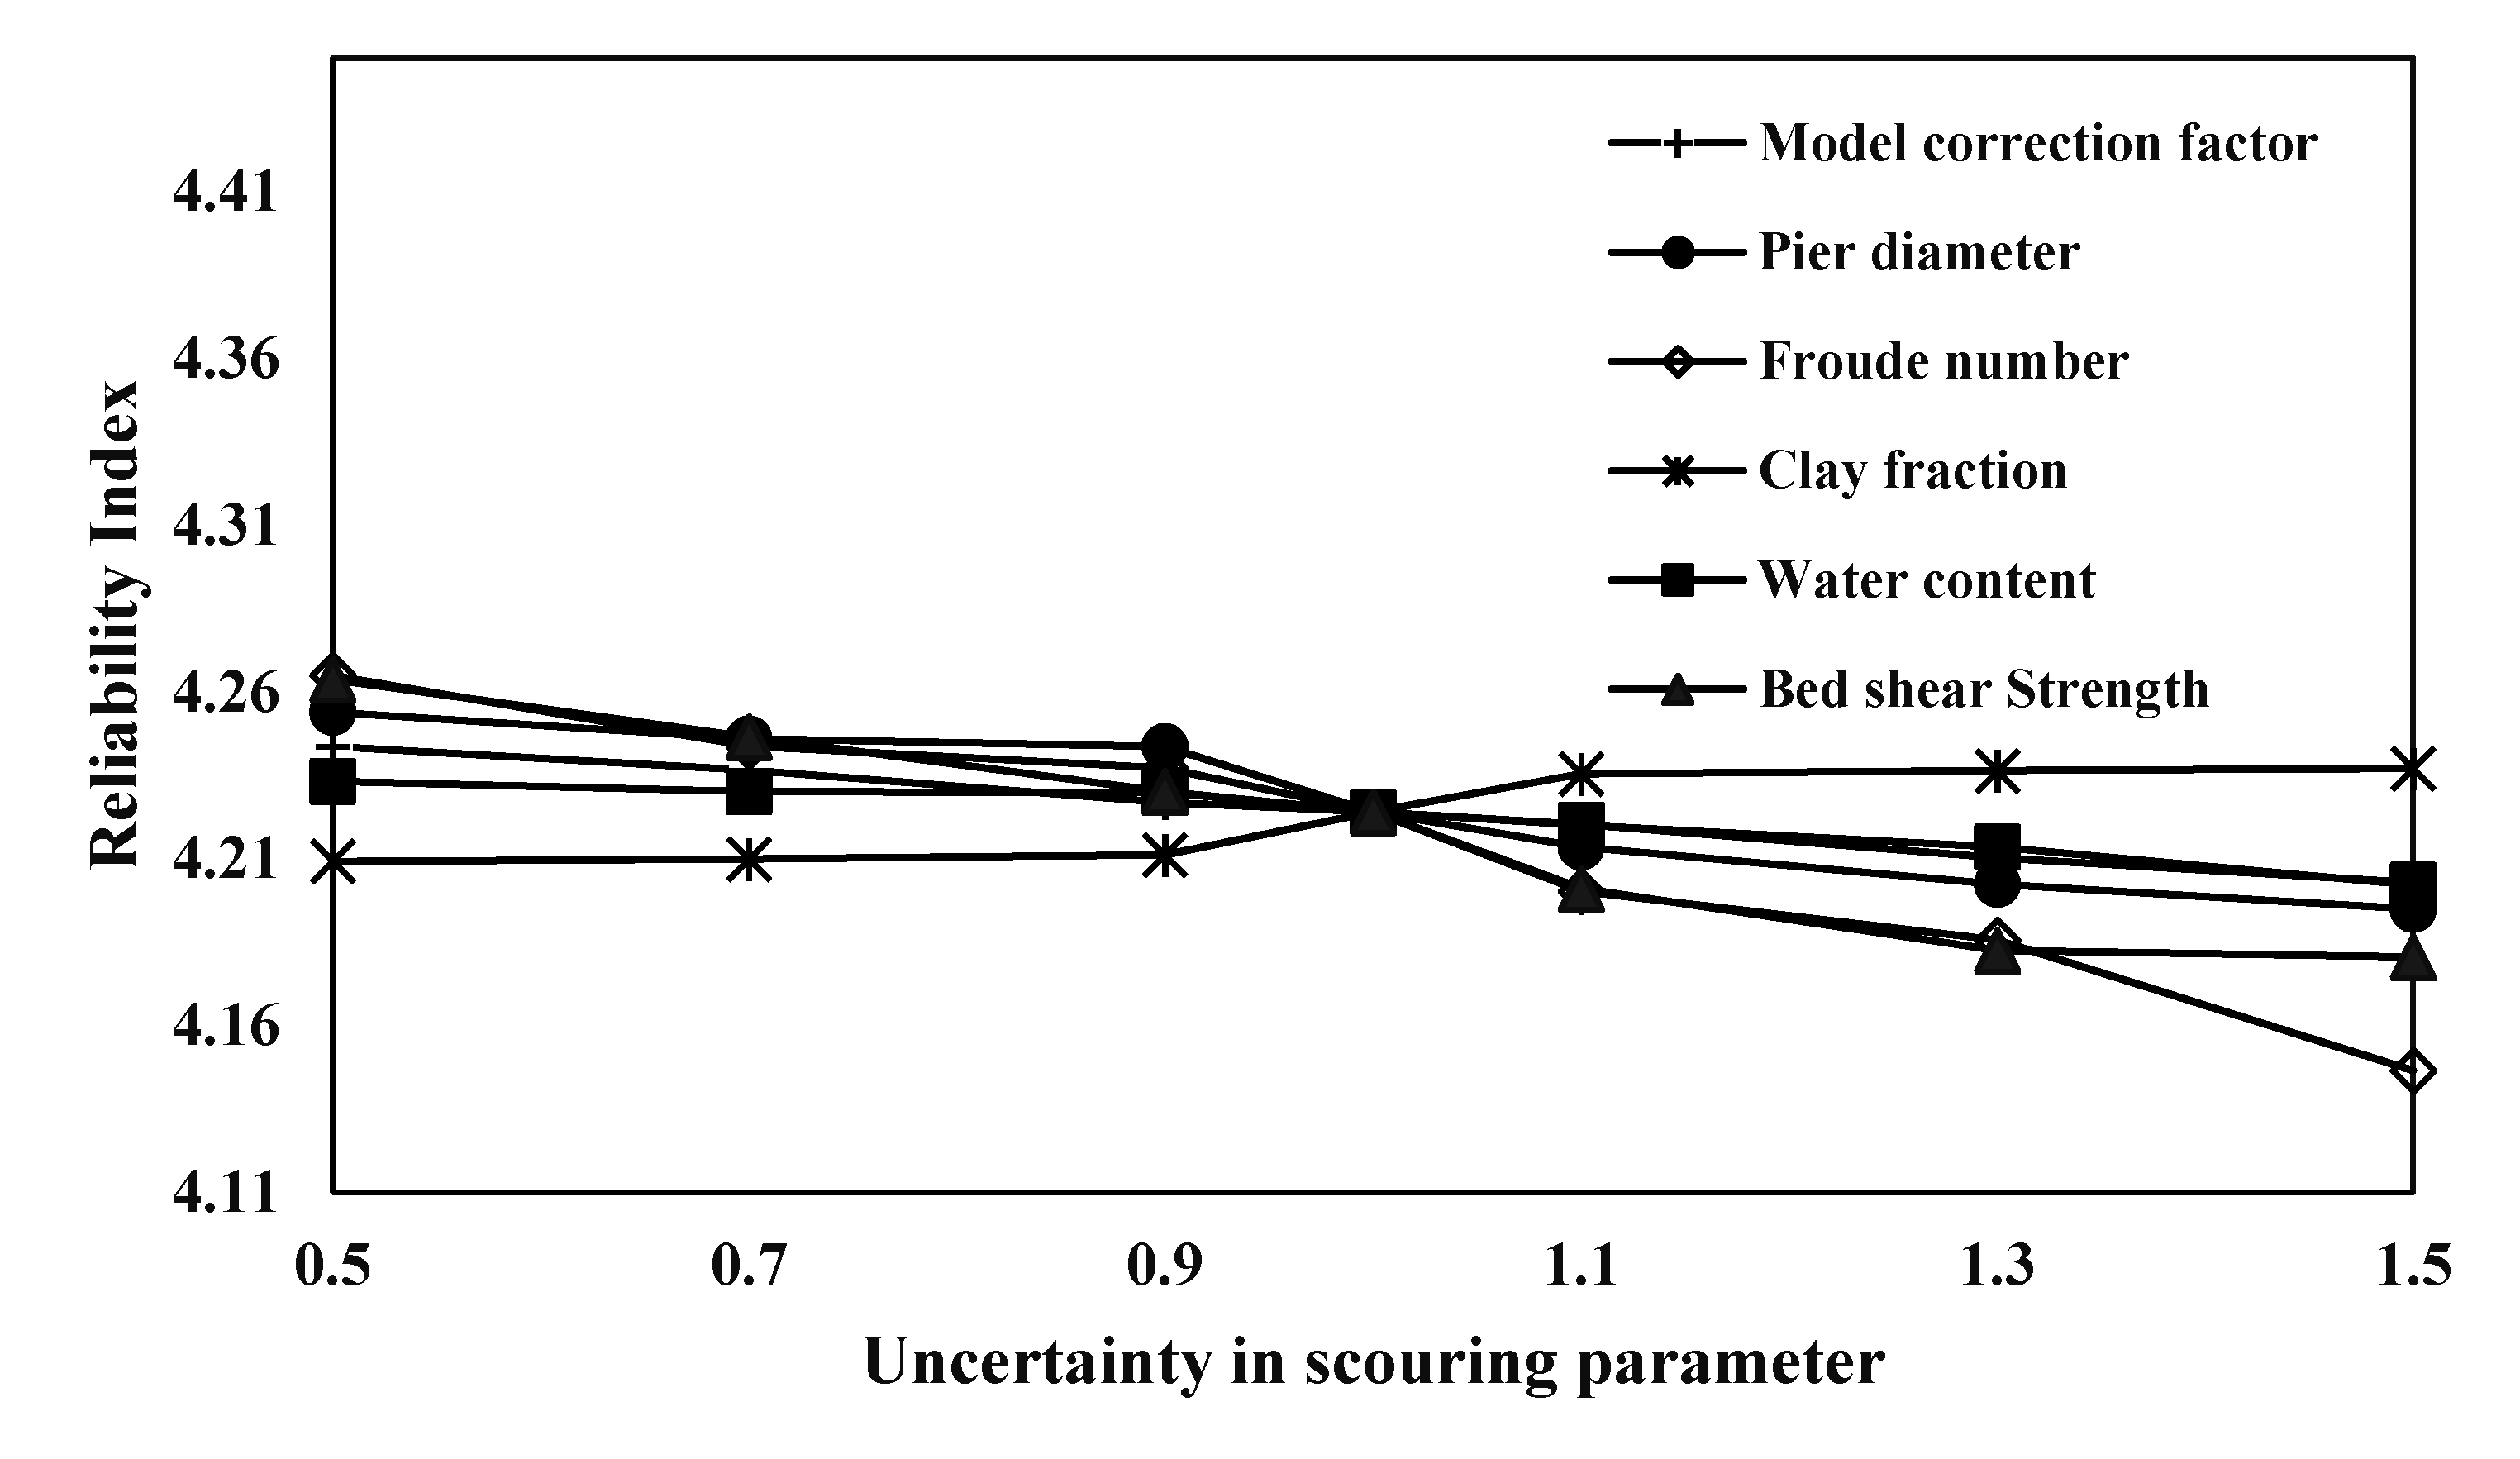
3.3. Uncertainty Effect of Scouring Parameters
4. Conclusions
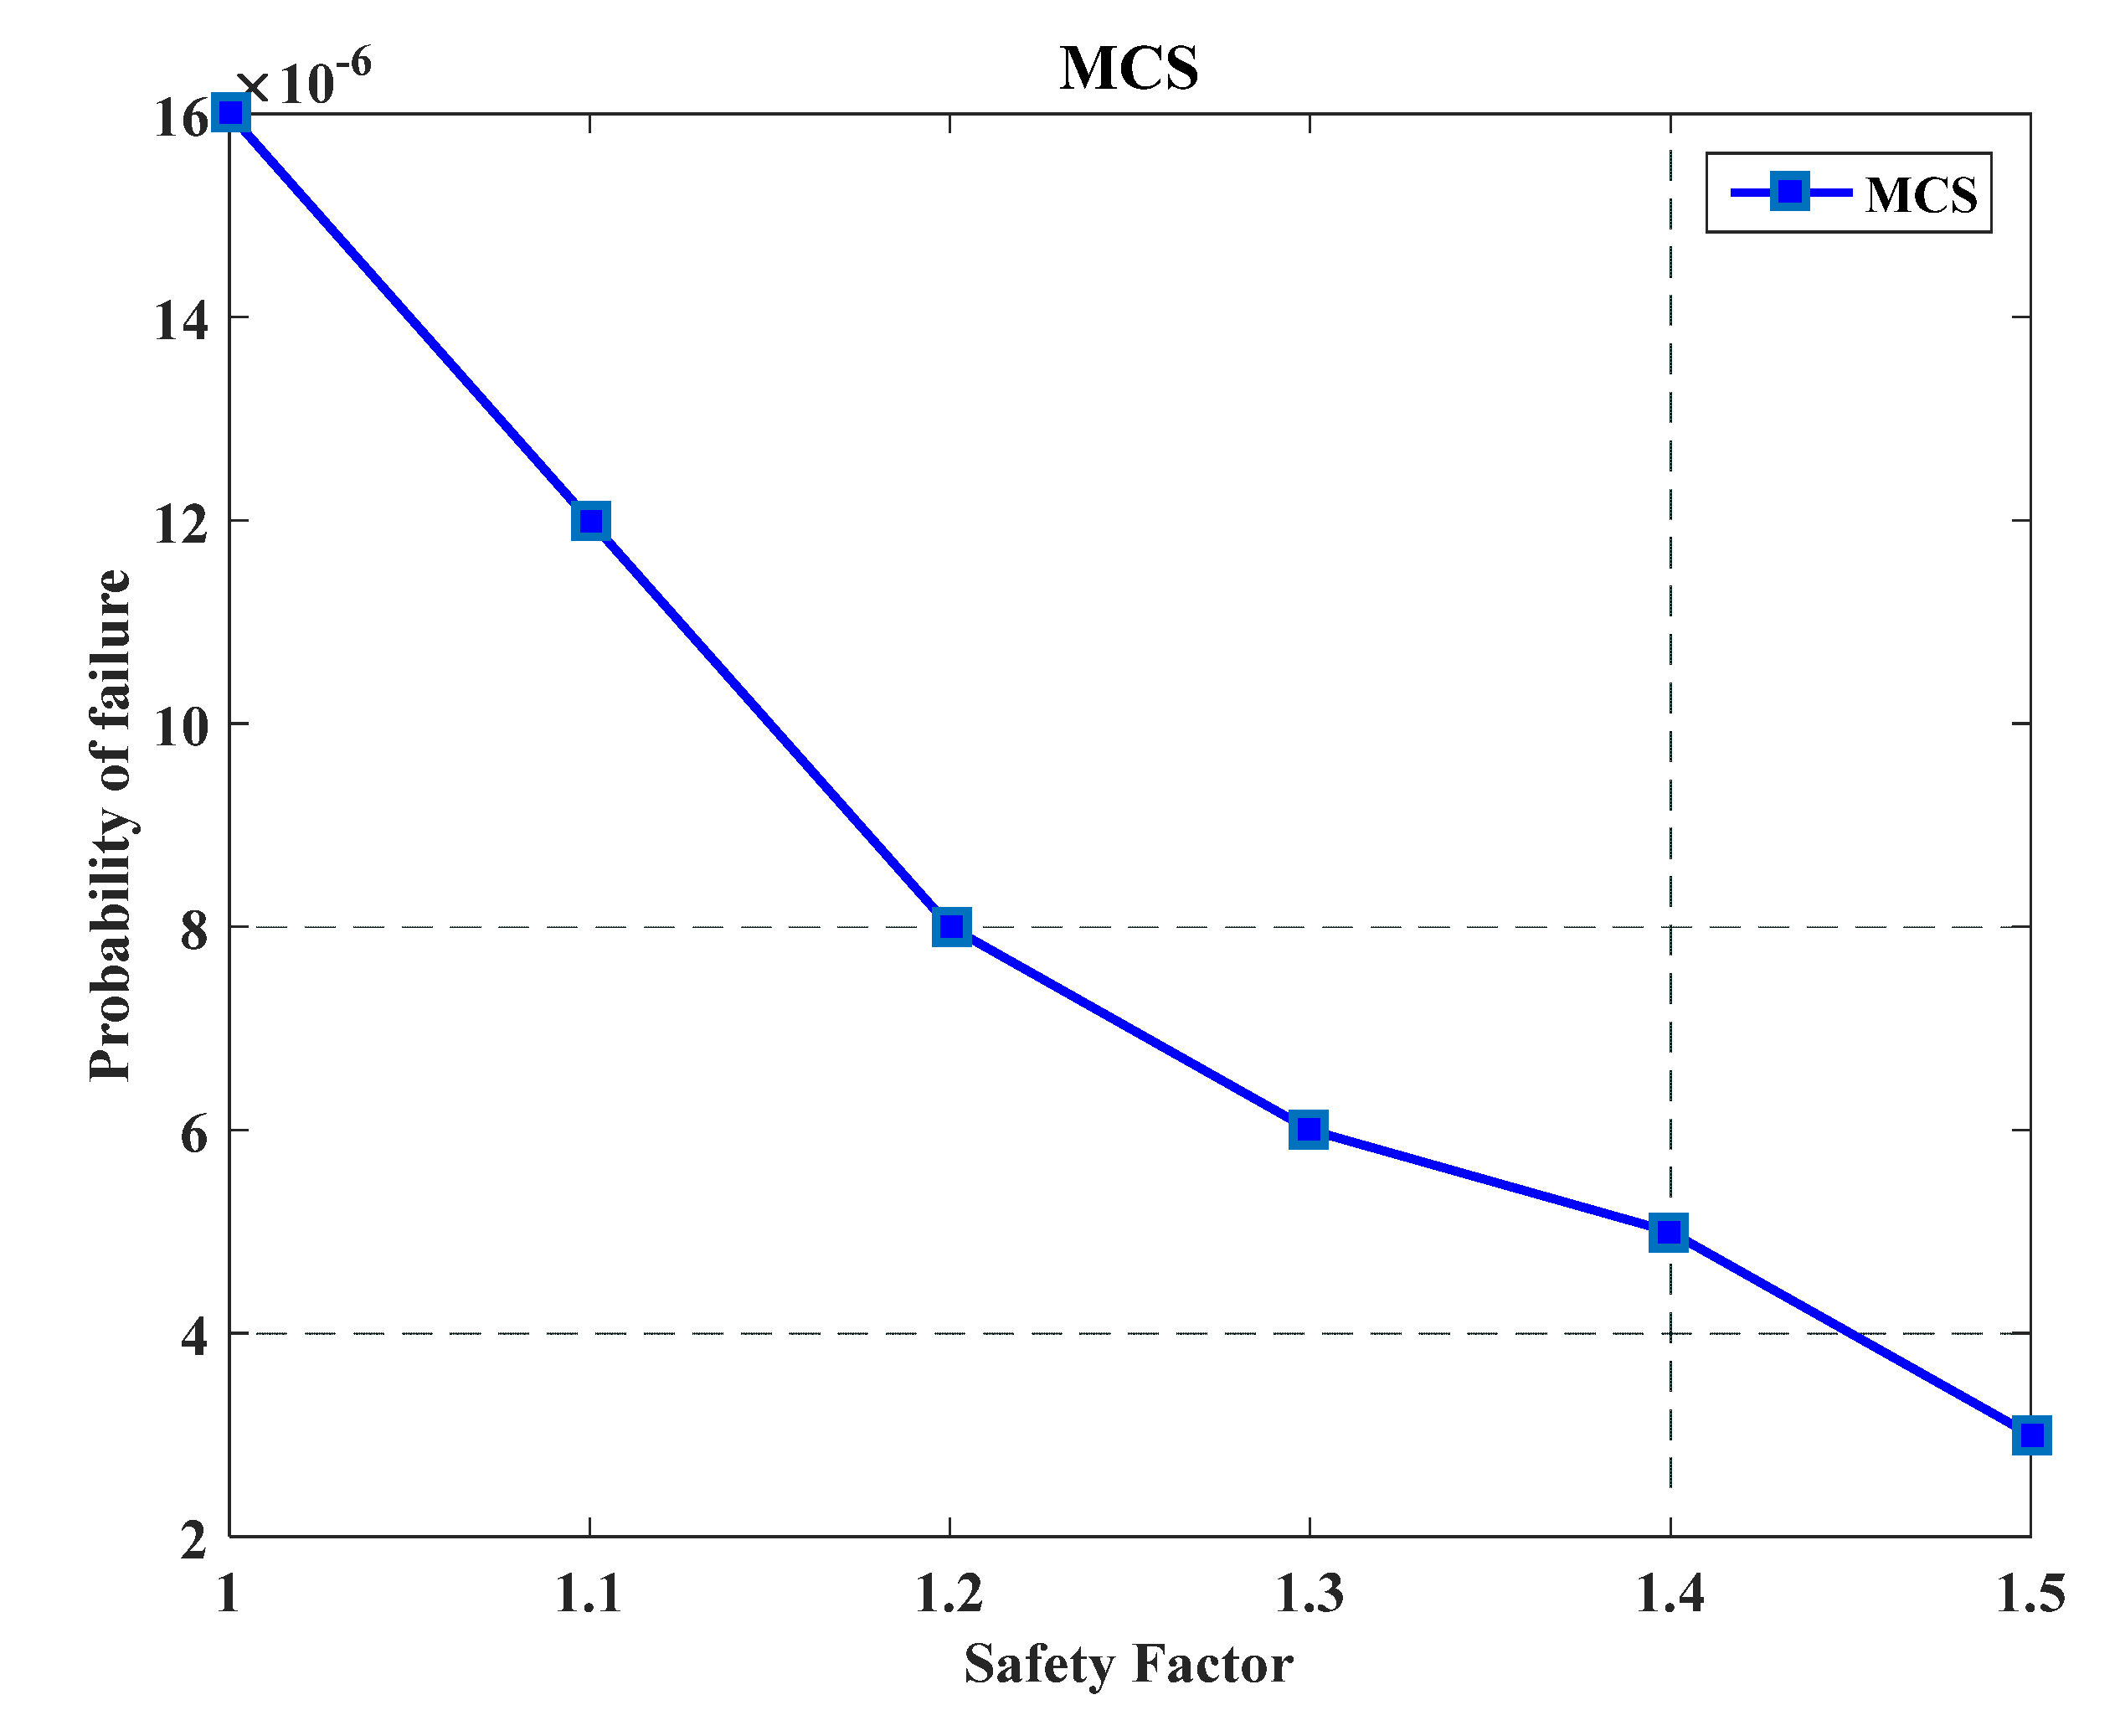
- The reliability index increases with an increase in the safety factor, whereas an increase in the safety factor causes a decrease in failure probability.
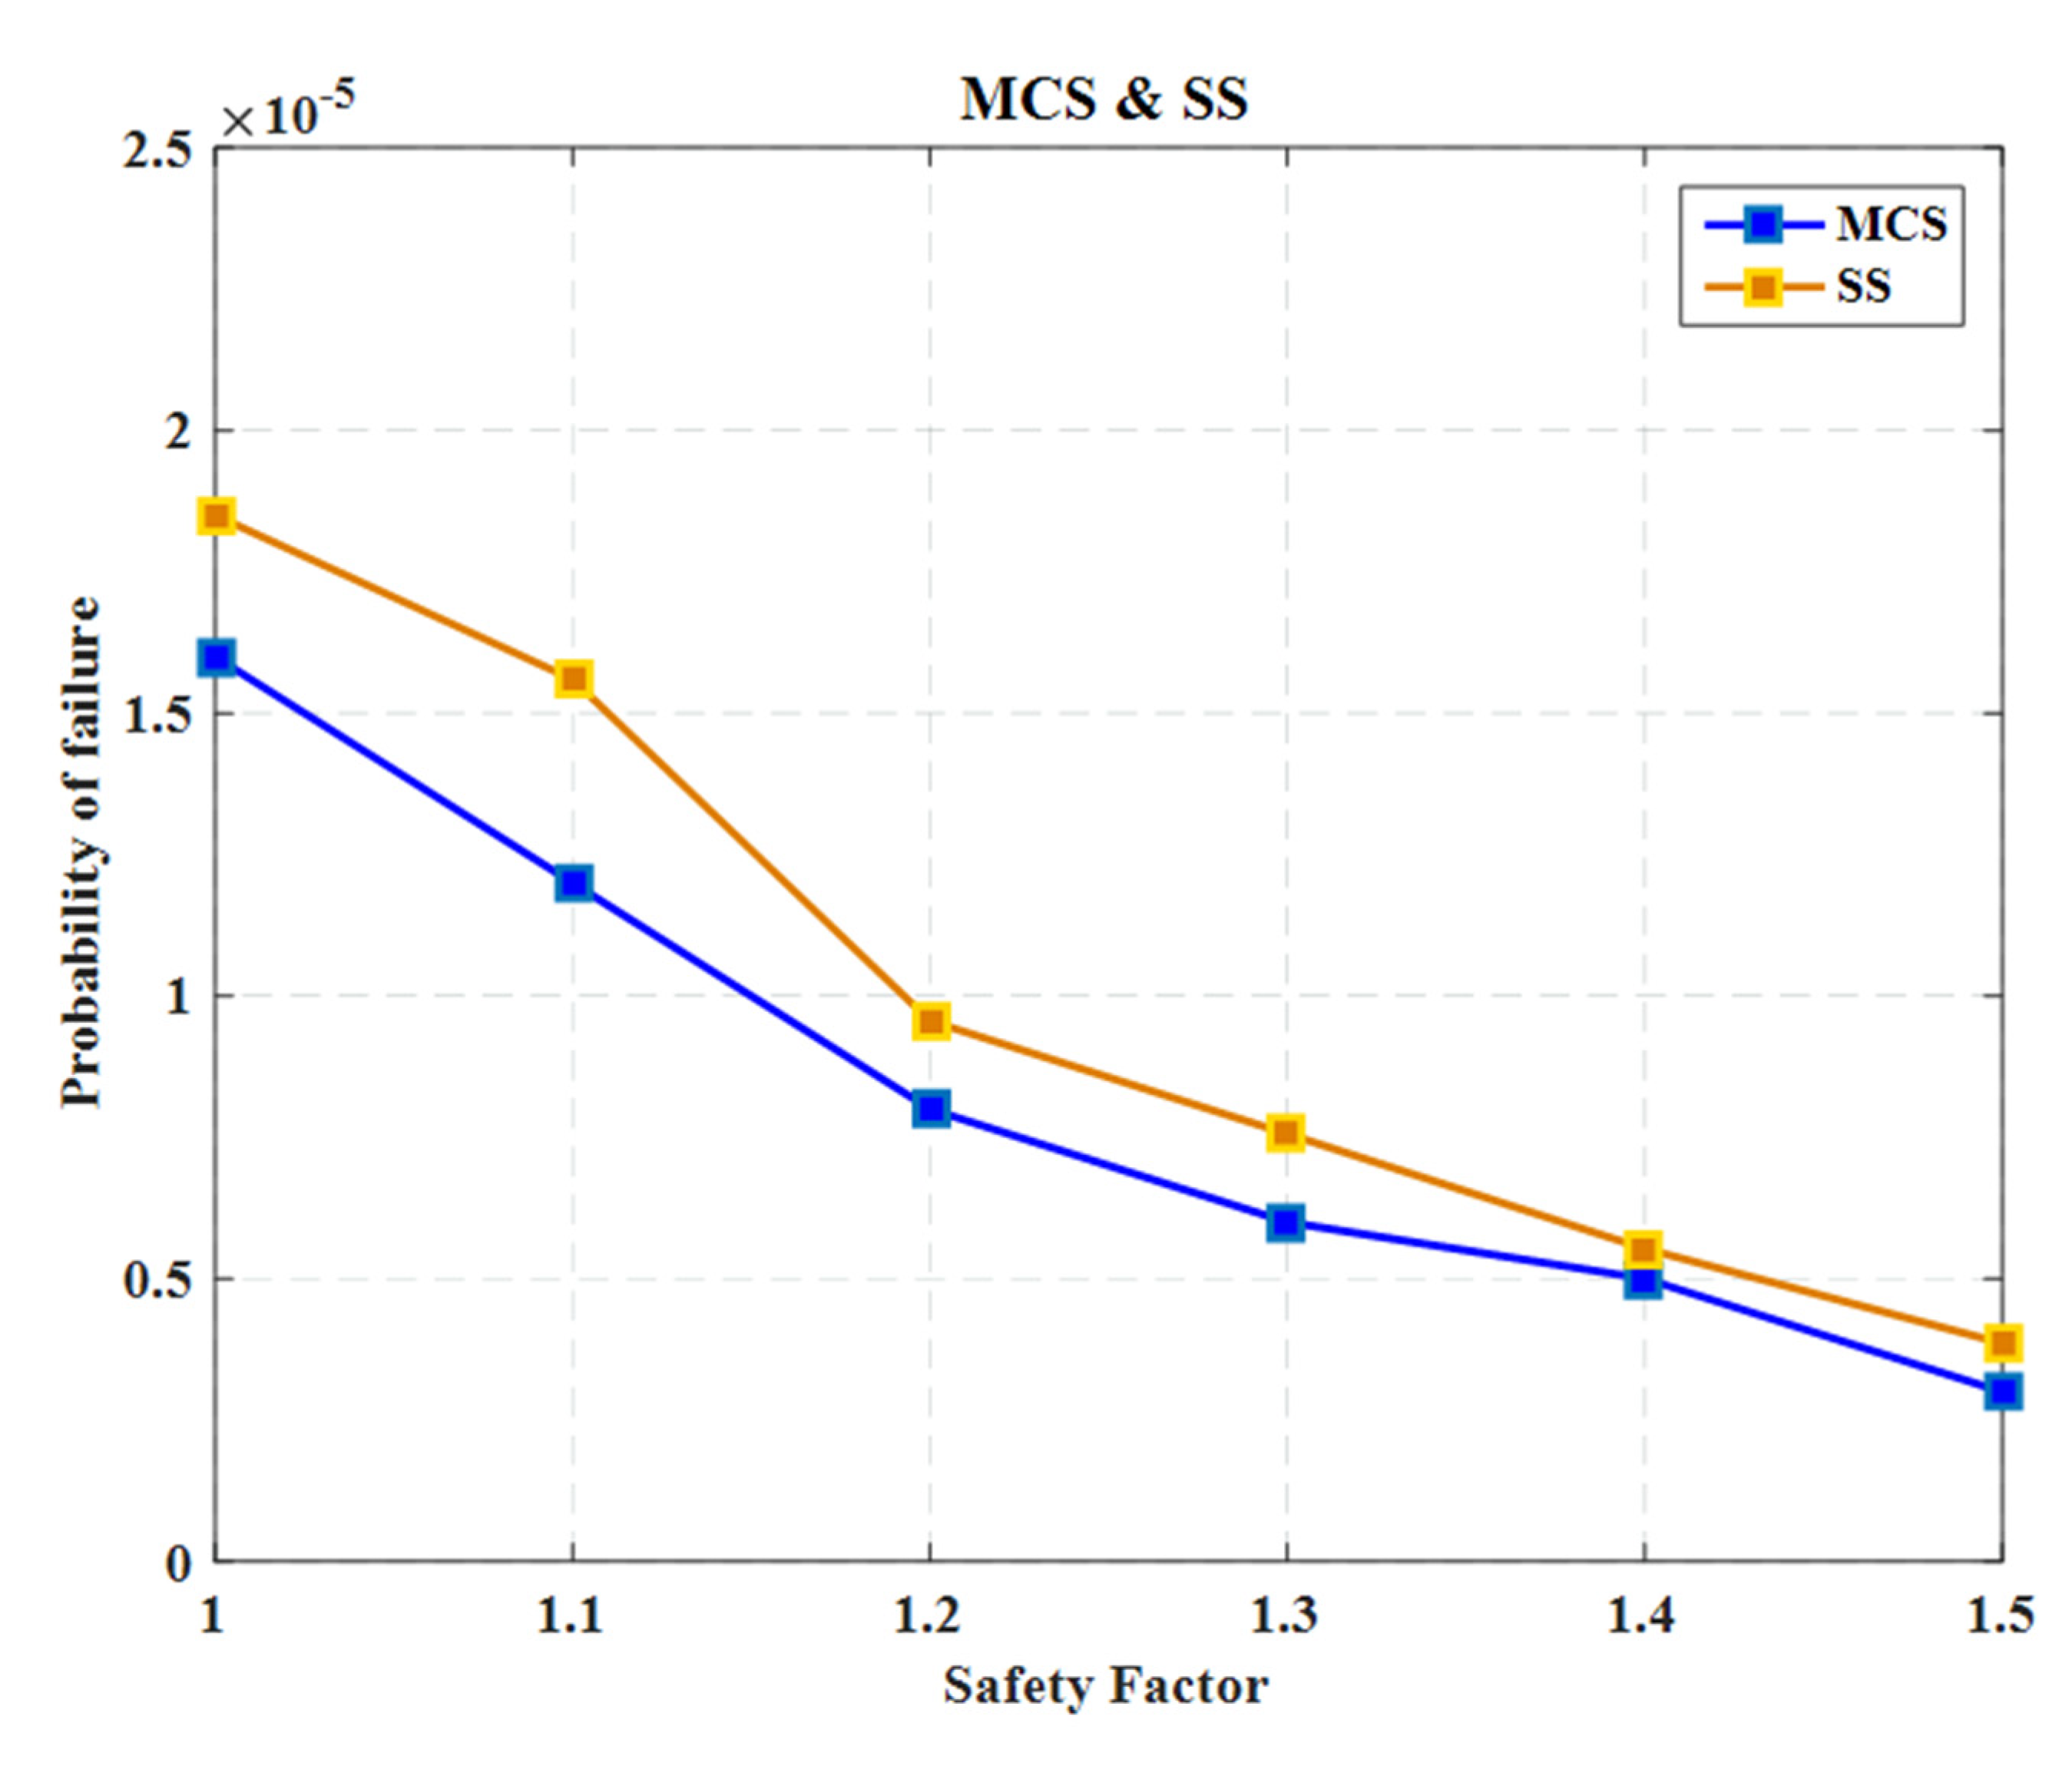
- The results showed that subset simulation (SS) has excellent performance for the accurate and precise estimation of failure probability compared to the IS, LS, and DS. The SS yielded the lowest relative error, relative to MCS, in which the highest error was 1.41% for a safety factor between 1 and 1.5.
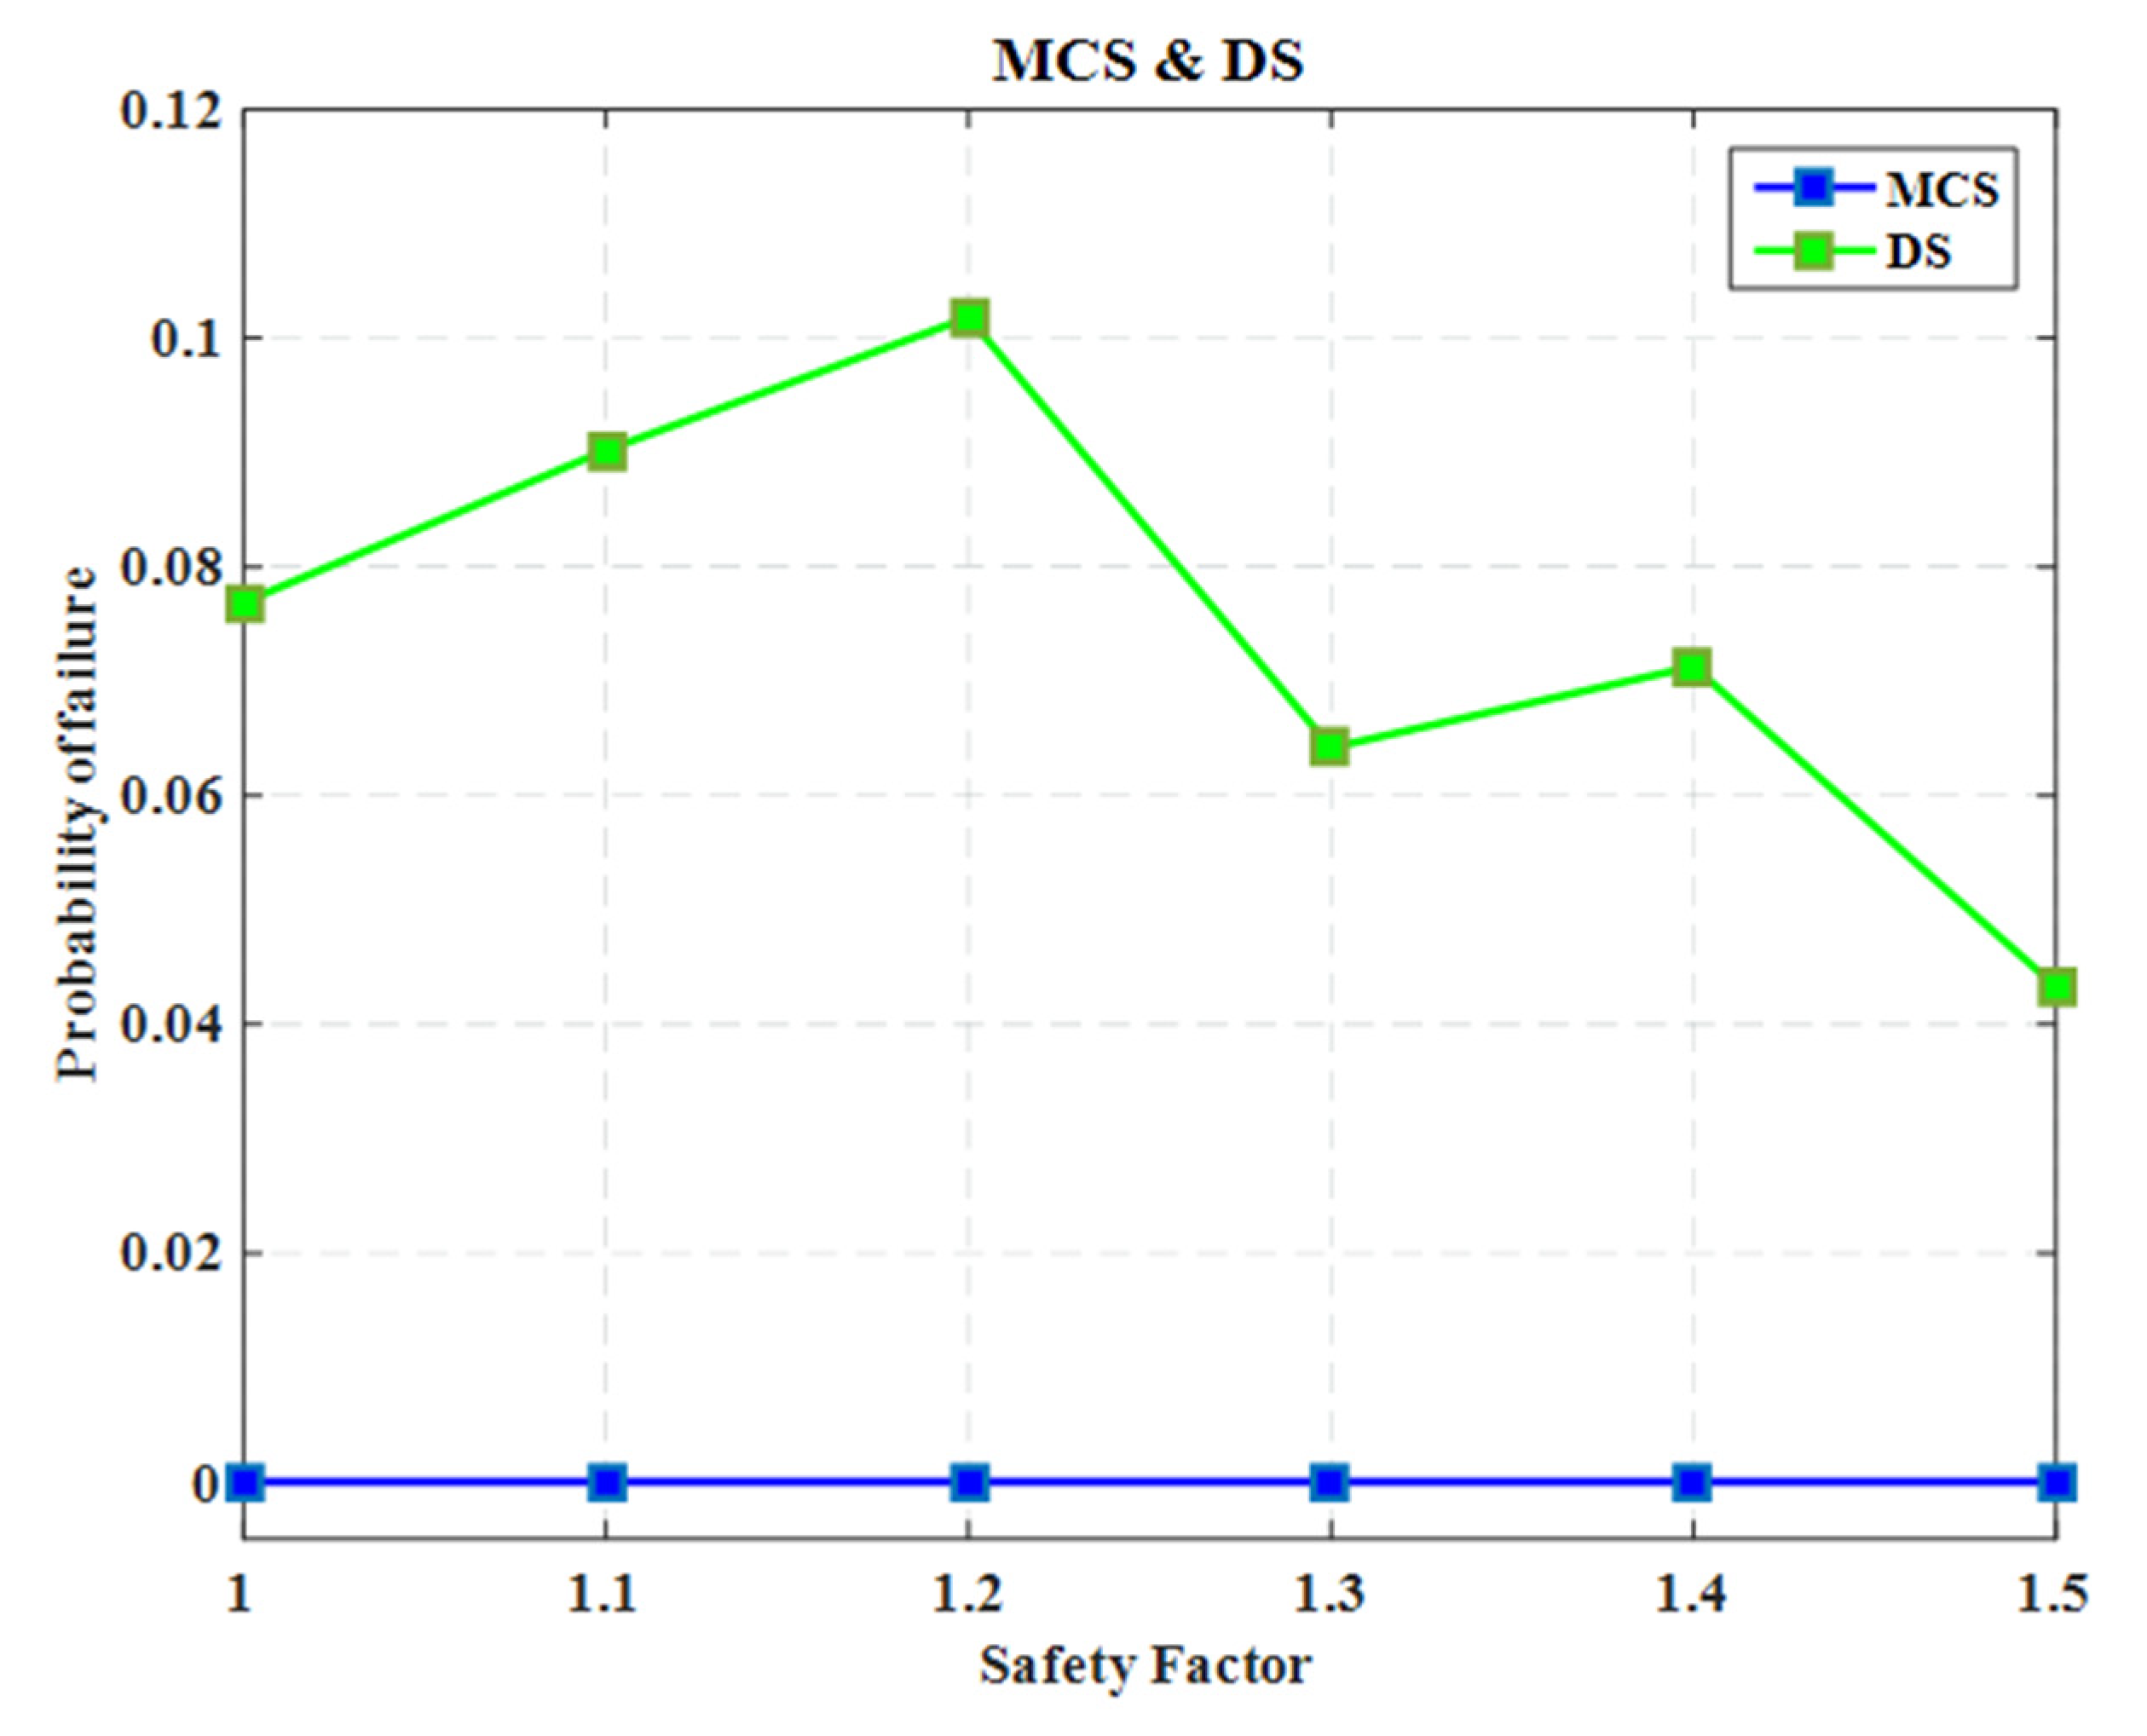
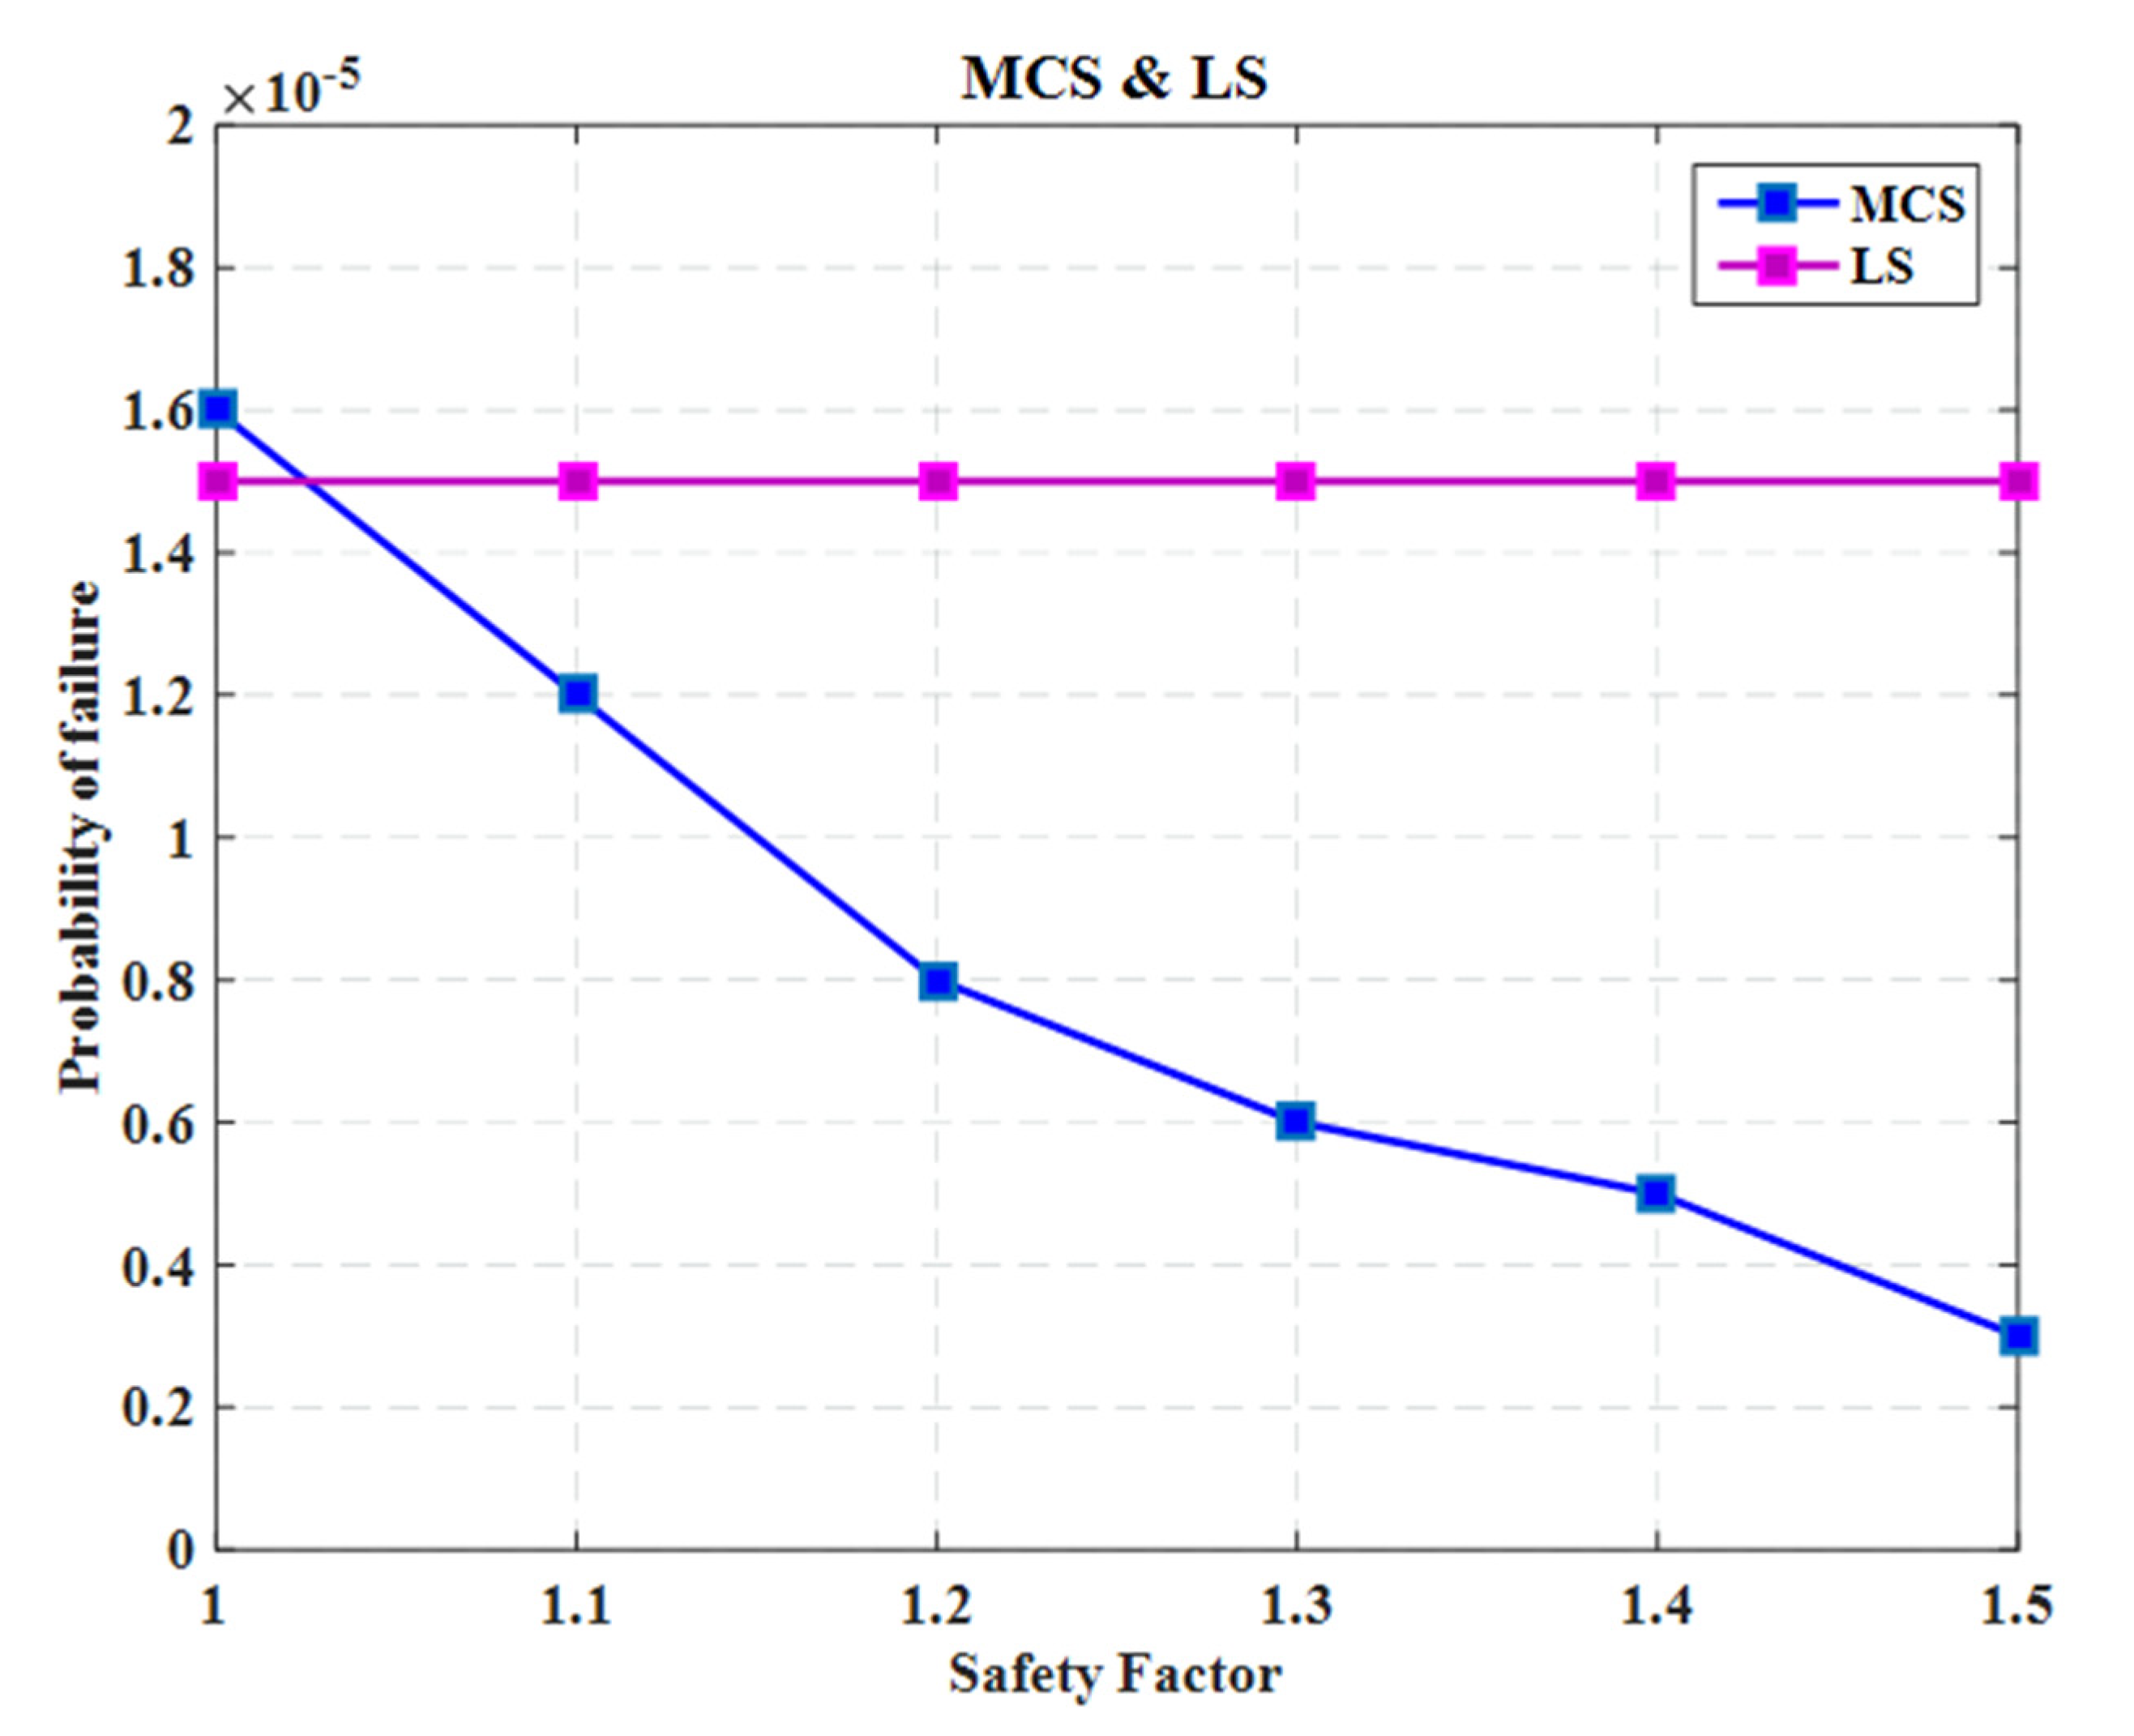
- The DS showed the lowest performance for solving this engineering problem, with the highest relative error of 70.54% (SF = 1.2) compared to other simulation methods. In addition, the LS failed to deal with this current problem and was unable to approximate the reliability index for different safety factor values.
- The sensitivity analysis revealed that the model correction factor and water content are resisting factors related to reliability. The Froude number was found to be a dominant parameter related to the bridge pier failure.
Author Contributions
Funding
Institutional Review Board Statement
Informed Consent Statement
Data Availability Statement
Conflicts of Interest
Nomenclature
| ds: | Maximum scour depth (m) |
| D: | Pier diameter (m) |
| C: | Clay content |
| : | Water content |
| Fr: | Pier Froude number |
| : | Bed shear strength |
| : | Dimensionless factor of the bed shear strength () |
| : | Mass density of water |
| V: | Depth averaged velocity |
| : | Limit state function |
| : | Failure probability |
| Depth of foundation | |
| MCS: | Monte Carlo simulation |
| DS: | Directional simulation |
| LS: | Line sampling |
| SS: | Subset simulation |
| IS: | Importance sampling |
| SF: | Safety factor |
| Probability density function |
References
- Frangopol, D.M.; Dong, Y.; Sabatino, S. Bridge life-cycle performance and cost: Analysis, prediction, optimisation and decision-making. Struct. Infrastruct. Eng. 2017, 13, 1239–1257. [Google Scholar] [CrossRef]
- Debnath, K.; Chaudhuri, S. Bridge pier scour in clay-sand mixed sediments at near-threshold velocity for sand. J. Hydraul. Eng. 2010, 136, 597–609. [Google Scholar] [CrossRef]
- Khalid, M.; Muzzammil, M.; Alam, J. Reliability analysis of local scour at bridge pier in clay-sand mixed sediments. Aquademia 2018, 2, 1. [Google Scholar] [CrossRef] [Green Version]
- Khalid, M.; Muzzammil, M.; Alam, J. A reliability-based assessment of live bed scour at bridge piers. ISH J. Hydraul. Eng. 2019, 1–8. [Google Scholar] [CrossRef]
- Briaud, J.-L.; Gardoni, P.; Yao, C. Statistical, risk, and reliability analyses of bridge scour. J. Geotech. Geoenviron. Eng. 2014, 140, 4013011. [Google Scholar] [CrossRef]
- Wang, Z.; Jin, W.; Dong, Y.; Frangopol, D.M. Hierarchical life-cycle design of reinforced concrete structures incorporating durability, economic efficiency and green objectives. Eng. Struct. 2018, 157, 119–131. [Google Scholar] [CrossRef]
- Tu, B.; Dong, Y.; Fang, Z. Time-dependent reliability and redundancy of corroded prestressed concrete bridges at material, component, and system levels. J. Bridge Eng. 2019, 24, 4019085. [Google Scholar] [CrossRef]
- Alipour, A.; Shafei, B.; Shinozuka, M. Reliability-based calibration of load and resistance factors for design of RC bridges under multiple extreme events: Scour and earthquake. J. Bridge Eng. 2013, 18, 362–371. [Google Scholar] [CrossRef]
- Chabert, J.; Engeldinger, P. Study of scour around bridge piers. Rep. Prep. Lab. Natl. D’hydraulique 1956. [Google Scholar]
- Laursen, E.M. The total sediment load of streams. J. Hydraul. Div. 1958, 84, 1–36. [Google Scholar] [CrossRef]
- Jain, S.C.; Fischer, E.E. Scour around bridge piers at high flow velocities. J. Hydraul. Div. 1980, 106, 1827–1842. [Google Scholar] [CrossRef]
- Chee, R.K.W. Live-bed scour at bridge piers. Publ. Auckl. Univ. N. Z. 1982. [Google Scholar]
- Melville, B.W. Live-bed scour at bridge piers. J. Hydraul. Eng. 1984, 110, 1234–1247. [Google Scholar] [CrossRef]
- Raudkivi, A.J. Functional trends of scour at bridge piers. J. Hydraul. Eng. 1986, 112, 1–13. [Google Scholar] [CrossRef]
- Kothyari, U.C.; Ranga Raju, K.G.; Garde, R.J. Live-bed scour around cylindrical bridge piers. J. Hydraul. Res. 1992, 30, 701–715. [Google Scholar] [CrossRef]
- Sheppard, D.M.; Miller, W., Jr. Live-bed local pier scour experiments. J. Hydraul. Eng. 2006, 132, 635–642. [Google Scholar] [CrossRef] [Green Version]
- Zhao, M.; Cheng, L.; Zang, Z. Experimental and numerical investigation of local scour around a submerged vertical circular cylinder in steady currents. Coast. Eng. 2010, 57, 709–721. [Google Scholar] [CrossRef]
- Dixen, M.; Sumer, B.M.; Fredsøe, J. Numerical and experimental investigation of flow and scour around a half-buried sphere. Coast. Eng. 2013, 73, 84–105. [Google Scholar] [CrossRef]
- Ettmer, B.; Orth, F.; Link, O. Live-bed scour at bridge piers in a lightweight polystyrene bed. J. Hydraul. Eng. 2015, 141, 4015017. [Google Scholar] [CrossRef]
- Hong, J.-H.; Guo, W.-D.; Chiew, Y.-M.; Chen, C.-H. A new practical method to simulate flood-induced bridge pier scour—A case study of Mingchu bridge piers on the Cho-Shui River. Water 2016, 8, 238. [Google Scholar] [CrossRef]
- Radice, A.; Lauva, O. Live-bed pier scour in a covered flow. J. Hydraul. Eng. 2017, 143, 6017016. [Google Scholar] [CrossRef]
- Guo, H.-Y.; Dong, Y.; Gu, X.-L. Two-step translation method for time-dependent reliability of structures subject to both continuous deterioration and sudden events. Eng. Struct. 2020, 225, 111291. [Google Scholar] [CrossRef]
- El Amine Ben Seghier, M.; Keshtegar, B.; Correia, J.A.F.O.; Lesiuk, G.; de Jesus, A.M.P. Reliability analysis based on hybrid algorithm of M5 model tree and Monte Carlo simulation for corroded pipelines: Case of study X60 Steel grade pipes. Eng. Fail. Anal. 2019, 97, 793–803. [Google Scholar] [CrossRef]
- Keshtegar, B.; el Amine Ben Seghier, M.; Zhu, S.; Abbassi, R.; Trung, N.-T. Journal of Loss Prevention in the Process Industries Reliability analysis of corroded pipelines: Novel adaptive conjugate first order reliability method. J. Loss Prev. Process Ind. 2019, 62, 103986. [Google Scholar] [CrossRef]
- Bagheri, M.; Peng, Z.S.-P.; el Amine Ben Seghier, M.; Keshtegar, B. Hybrid intelligent method for fuzzy reliability analysis of corroded X100 steel pipelines. Eng. Comput. 2020. [Google Scholar] [CrossRef]
- El Amine Ben Seghier, M.; Keshtegar, B.; Elahmoune, B. Reliability analysis of low, mid and high-grade strength corroded pipes based on plastic flow theory using adaptive nonlinear conjugate map. Eng. Fail. Anal. 2018. [Google Scholar] [CrossRef]
- Muzzammil, M.; Alama, J.; Danish, M. Scour prediction at bridge piers in cohesive bed using gene expression programming. Aquat. Procedia 2015, 4, 789–796. [Google Scholar] [CrossRef]
- El Amine Ben Seghier, M.; Keshtegar, B.; Tee, F.K.; Zayed, T.; Abbassi, R.; Trung, N.-T. Prediction of maximum pitting corrosion depth in oil and gas pipelines. Eng. Fail. Anal. 2020, 112, 104505. [Google Scholar] [CrossRef]
- Keshtegara, B.; el Amine Ben Seghier, M. Modified response surface method basis harmony search to predict the burst pressure of corroded pipelines. Eng. Fail. Anal. 2018, 89, 177–199. [Google Scholar] [CrossRef]
- El Amine Ben Seghier, M.; Keshtegar, B.; Taleb-Berrouane, M.; Abbassi, R.; Trung, N.-T. Advanced intelligence frameworks for predicting maximum pitting corrosion depth in oil and gas pipelines. Process Saf. Environ. Prot. 2021. [Google Scholar] [CrossRef]
- Mai, S.H.; el Amine Ben Seghier, M.; Nguyen, P.-L.; Thai, D.-K. A hybrid model for predicting the axial compression capacity of square concrete-filled steel tubular columns. Eng. Comput. 2020. [Google Scholar] [CrossRef]
- El Amine Ben Seghier, M.; Carvalho, H.; Keshtegar, B.; Correia, J.A.F.O.; Berto, F. Novel hybridized adaptive neuro-fuzzy inference system models based particle swarm optimization and genetic algorithms for accurate prediction of stress intensity factor. Fatigue Fract. Eng. Mater. Struct. 2020, 43, 2653–2667. [Google Scholar] [CrossRef]
- Sharafati, A.; Yasa, R.; Azamathulla, H.M. Assessment of stochastic approaches in prediction of wave-induced pipeline scour depth. J. Pipeline Syst. Eng. Pr. 2018, 9, 4018024. [Google Scholar] [CrossRef]
- Sreedhara, B.M.; Rao, M.; Mandal, S. Application of an evolutionary technique (PSO–SVM) and ANFIS in clear-water scour depth prediction around bridge piers. Neural Comput. Appl. 2019, 31, 7335–7349. [Google Scholar] [CrossRef]
- Khan, M.; Tufail, M.; Azamathulla, H.M.; Ahmad, I.; Muhammad, N. Genetic functions-based modelling for pier scour depth prediction in coarse bed streams. Proc. Inst. Civ. Eng. Water Manag. 2018, 171, 225–240. [Google Scholar] [CrossRef]
- Odeyemi, S.O.; Akinpelu, M.A.; Abdulwahab, R.; Dauda, K.A.; Chris-Ukaegbu, S. Scour Depth Prediction for Asa Dam Bridge, Ilorin, Using Artificial Neural Network. Int. J. Eng. Res. Afr. 2020, 47, 53–62. [Google Scholar] [CrossRef]
- Danish, M.; Alam, J.; Muzzammil, M. Scour Depth Prediction at Bridge Abutments in Cohesive Bed Using Group Method of Data Handling. In Proceedings of the International Conference on Hydraulics, Water Resources and Coastal Engineering (HYDRO 2016), Montreux, Switzerland, 10–12 October 2016. [Google Scholar]
- Johnson, P.A.; Ayyub, B.M. Assessing time-variant bridge reliability due to pier scour. J. Hydraul. Eng. 1992, 118, 887–903. [Google Scholar] [CrossRef]
- el Amine Ben Seghier, M.; Bettayeb, M.; Elahmoune, B.; Gaceb, M. Probabilistic approach evaluates reliability of pipelines with corrosion defects. Oil Gas J. 2017, 115, 64–68. [Google Scholar]
- el Amine Ben Seghier, M.; Bettayeb, M.; Correia, J.; de Jesus, A.; Calçada, R. Structural reliability of corroded pipeline using the so-called Separable Monte Carlo method. J. Strain Anal. Eng. Des. 2018, 53, 730–737. [Google Scholar] [CrossRef]
- Metropolis, N.; Ulam, S. The monte carlo method. J. Am. Stat. Assoc. 1949, 44, 335–341. [Google Scholar] [CrossRef]
- Rashki, M. Hybrid control variates-based simulation method for structural reliability analysis of some problems with low failure probability. Appl. Math. Model. 2018. [Google Scholar] [CrossRef]
- Ohadi, S.; Jafari-Asl, J. Multi-objective reliability-based optimization for design of trapezoidal labyrinth weirs. Flow Meas. Instrum. 2020, 77, 101787. [Google Scholar] [CrossRef]
- Grooteman, F. Adaptive radial-based importance sampling method for structural reliability. Struct. Saf. 2008, 30, 533–542. [Google Scholar] [CrossRef]
- Guillal, A.; el Amine Ben Seghier, M.; Nourddine, A.; Corria, J.A.F.O.; Mustaffa, Z.B.; Trung, N.-T. Probabilistic investigation on the reliability assessment of mid-and high-strength pipelines under corrosion and fracture conditions. Eng. Fail. Anal. 2020, 118, 104891. [Google Scholar] [CrossRef]
- Au, S.-K.; Beck, J.L. Estimation of small failure probabilities in high dimensions by subset simulation. Probabilistic Eng. Mech. 2001, 16, 263–277. [Google Scholar] [CrossRef] [Green Version]
- Zhang, J.; Xiao, M.; Gao, L.; Fu, J. A novel projection outline based active learning method and its combination with Kriging metamodel for hybrid reliability analysis with random and interval variables. Comput. Methods Appl. Mech. Eng. 2018. [Google Scholar] [CrossRef]
- Keshtegar, B.; Meng, D.; el Amine Ben Seghier, M.; Trung, N.-T.; Tien, D. A hybrid sufficient performance measure approach to improve robustness and efficiency of reliability-based design optimization. Eng. Comput. 2020. [Google Scholar] [CrossRef]
- Xiao, M.; Zhang, J.; Gao, L.; Lee, S.; Eshghi, A.T. An efficient Kriging-based subset simulation method for hybrid reliability analysis under random and interval variables with small failure probability. Struct. Multidiscip. Optim. 2019, 59, 2077–2092. [Google Scholar] [CrossRef]
- Melchers, R.E.; Beck, A.T. Structural Reliability Analysis and Prediction; John Wiley & Sons: Hoboken, NJ, USA, 2018; ISBN 1119265991. [Google Scholar]
- Li, L.; Lu, Z. Interval optimization based line sampling method for fuzzy and random reliability analysis. Appl. Math. Model. 2014, 38, 3124–3135. [Google Scholar] [CrossRef]


| Variables | Symbol | Unit | Xmean | COV | Distribution |
|---|---|---|---|---|---|
| Model correction factor | - | 1.00 | 0.06 | Normal | |
| Pier diameter | m | 0.09 | 0.05 | Lognormal | |
| Pier Froude number | - | 0.29 | 0.003 | Normal | |
| Clay fraction | - | 0.19 | 0.010 | Lognormal | |
| Water content | - | 0.22 | 0.002 | Normal | |
| Bed shear strength | 5271.42 | 0.06 | Lognormal |
| Methods | Number of Simulations |
|---|---|
| Monte Carlo simulation (MCS) | 1,000,000 |
| Importance sampling (IS) | 1000 |
| Subset simulation (SS) | 6000 |
| Line sampling (LS) | 100 |
| Directional simulation (DS) | 150 |
| Safety Factor | 1 | 1.1 | 1.2 | 1.3 | 1.4 | 1.5 | ||||||
|---|---|---|---|---|---|---|---|---|---|---|---|---|
| Pf | ꞵ | Pf | ꞵ | Pf | ꞵ | Pf | ꞵ | Pf | ꞵ | Pf | ꞵ | |
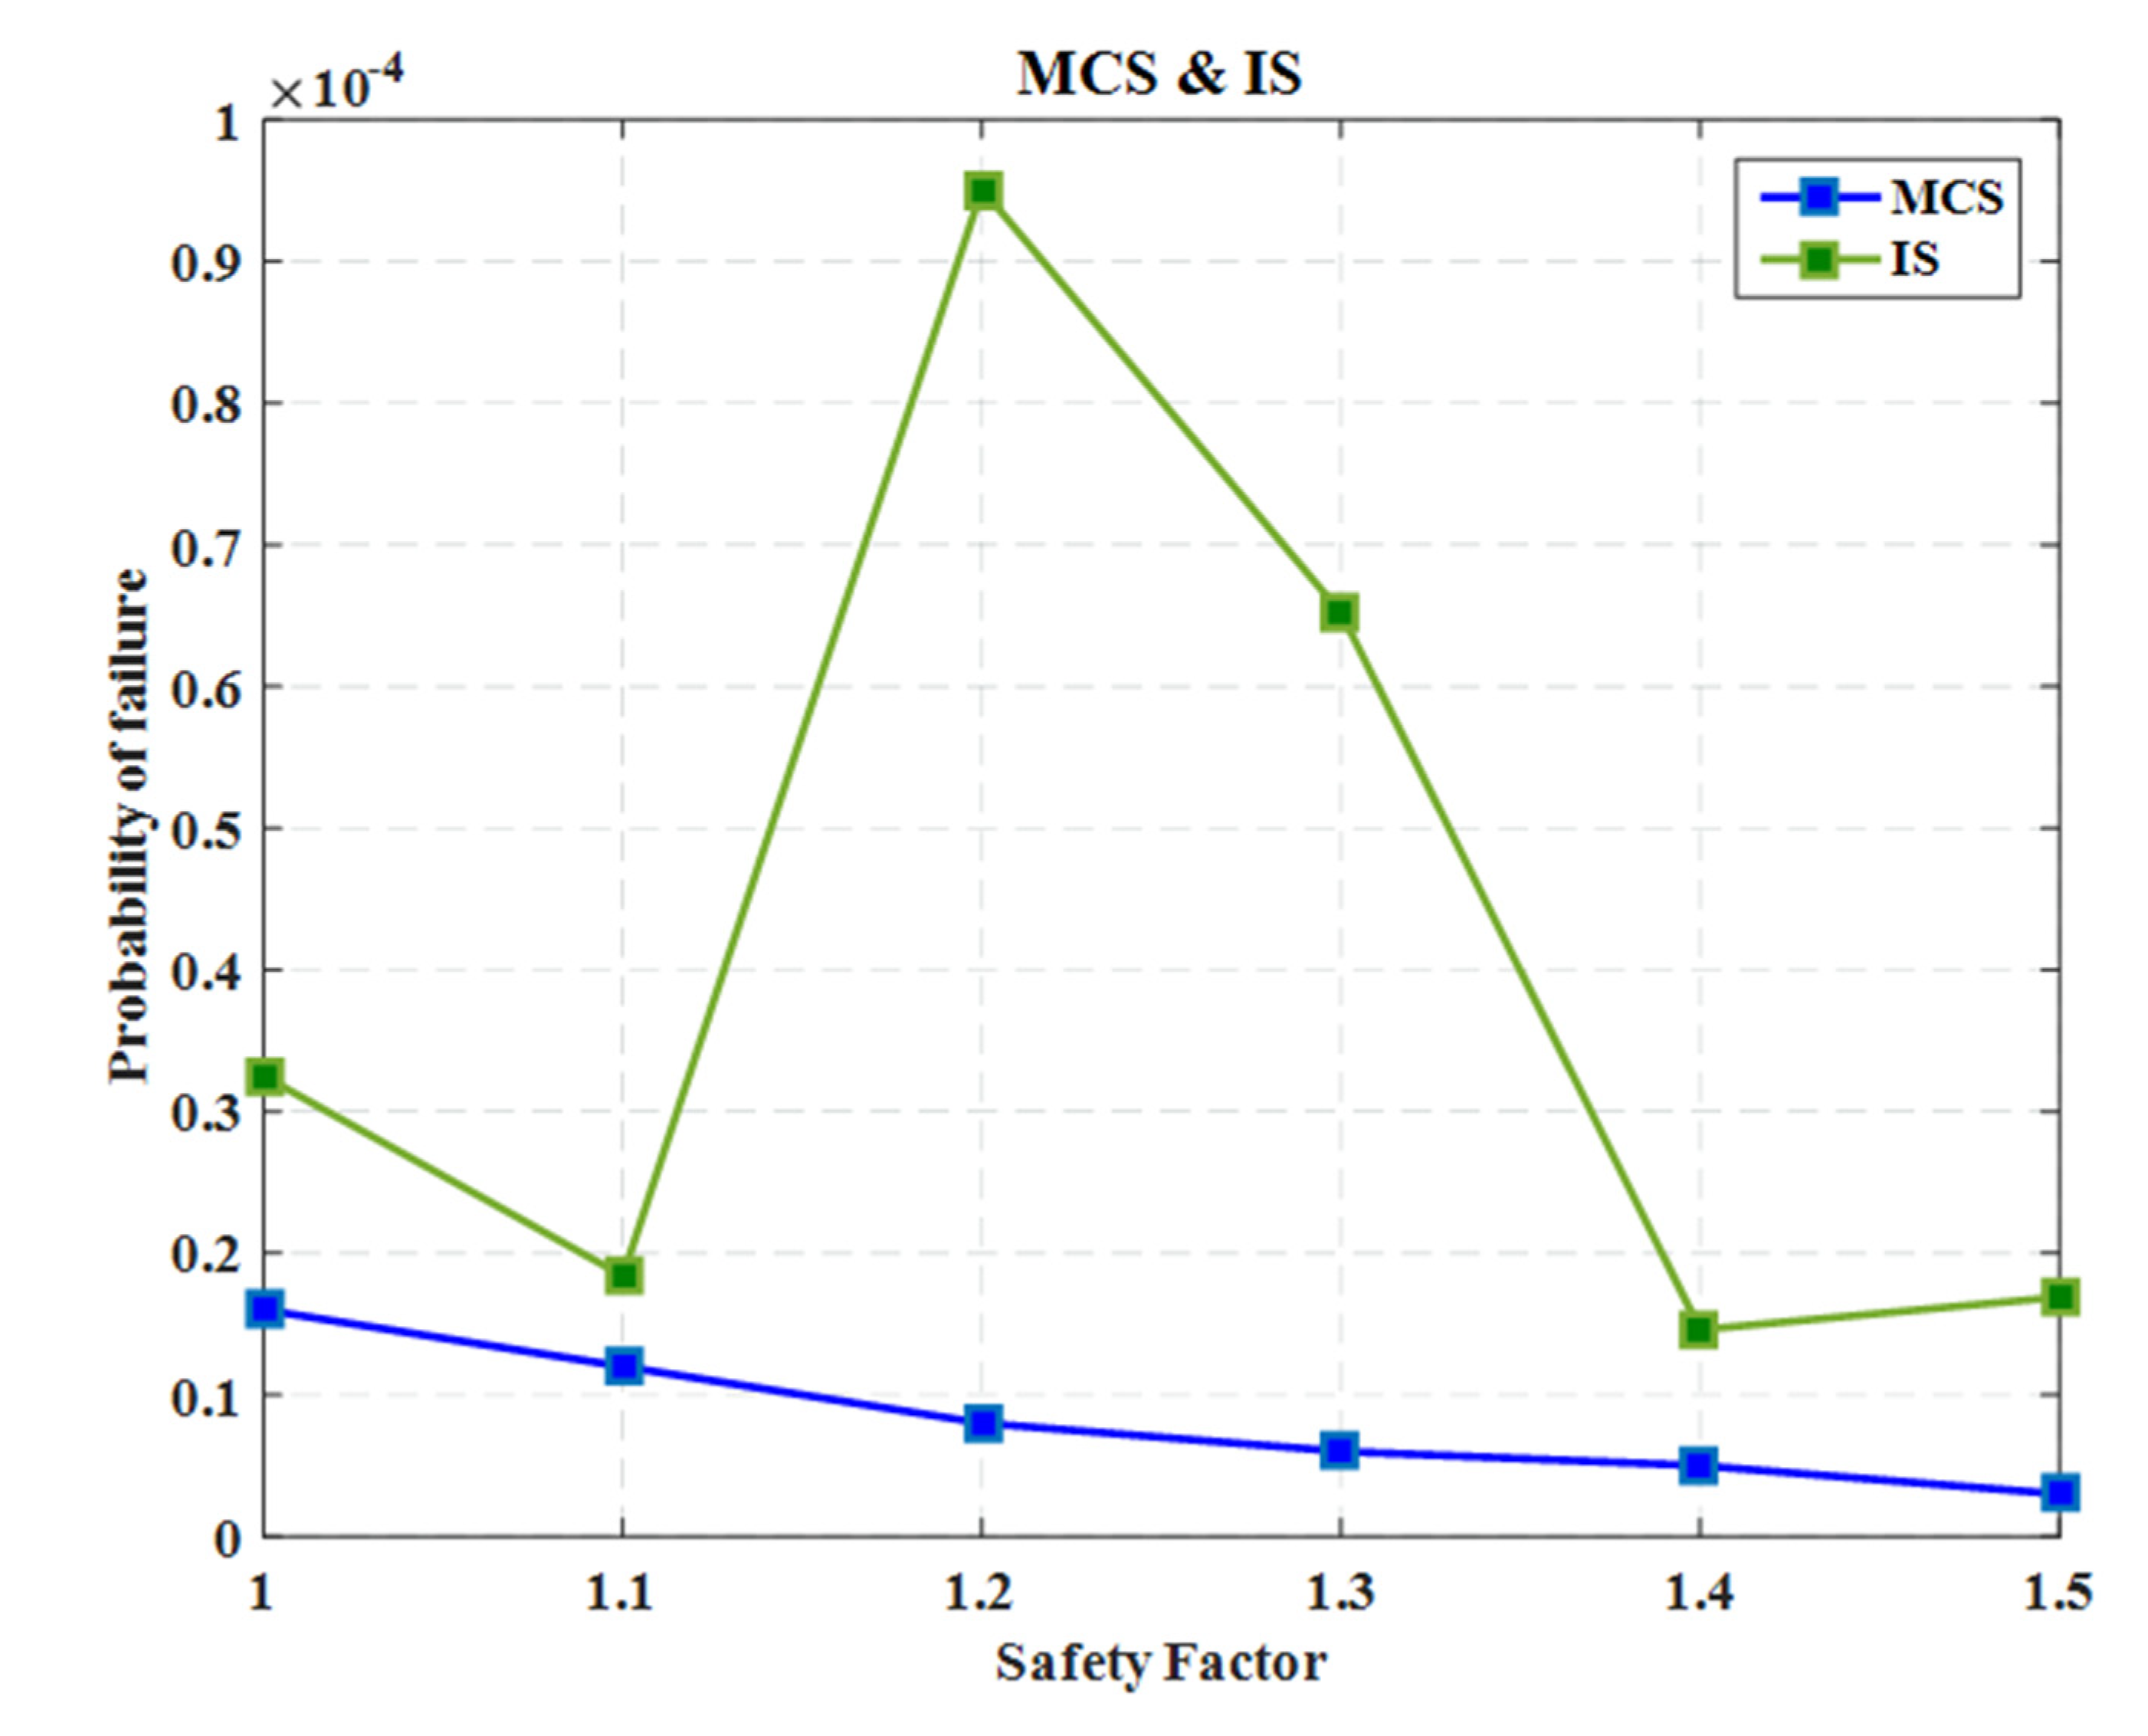
| MCS | 1.60 × 10⁻⁵ | 4.1587 | 1.20 × 10⁻⁵ | 4.224 | 8.00 × 10⁻⁶ | 4.3145 | 6.00 × 10⁻⁶ | 4.3776 | 5.00 × 10⁻⁶ | 4.4172 | 3.00 × 10⁻⁶ | 4.5264 |
| DS | 0.076985 | 1.43 | 9.02 × 10⁻² | 1.3394 | 1.02 × 10⁻¹ | 1.2711 | 6.42 × 10⁻² | 1.5203 | 7.13 × 10⁻² | 1.466 | 0.043372 | 1.7128 |
| LS | 1.05 × 10⁻⁵ | 4.2546 | 1.05 × 10⁻⁵ | 4.2546 | 1.05 × 10⁻⁵ | 4.2546 | 1.05 × 10⁻⁵ | 4.2546 | 1.05 × 10⁻⁵ | 4.2546 | 1.05 × 10⁻⁵ | 4.2546 |
| IS | 3.25 × 10⁻⁵ | 3.994 | 1.84 × 10⁻⁵ | 4.1268 | 9.51 × 10⁻⁵ | 3.7318 | 6.52 × 10⁻⁵ | 3.8257 | 1.46 × 10⁻⁵ | 4.1802 | 1.69 × 10⁻⁵ | 4.1464 |
| SS | 1.85 × 10⁻⁵ | 4.126 | 6.36 × 10⁻⁶ | 4.1643 | 7.67 × 10⁻⁶ | 4.2749 | 7.56 × 10⁻⁶ | 4.3269 | 2.90 × 10⁻⁶ | 4.3954 | 2.85 × 10⁻⁶ | 4.4727 |
| Method | DS | LS | IS | SS | ||||
|---|---|---|---|---|---|---|---|---|
| Safety Factor | ꞵ | Error (%) | ꞵ | Error (%) | ꞵ | Error (%) | ꞵ | Error (%) |
| 1 | 1.43 | 65.61 | 4.2546 | −2.31 | 3.994 | 3.96 | 4.126 | 0.79 |
| 1.1 | 1.3394 | 68.29 | 4.2546 | −0.72 | 4.1268 | 2.30 | 4.1643 | 1.41 |
| 1.2 | 1.2711 | 70.54 | 4.2546 | 1.39 | 3.7318 | 13.51 | 4.2749 | 0.92 |
| 1.3 | 1.5203 | 65.27 | 4.2546 | 2.81 | 3.8257 | 12.61 | 4.3269 | 1.16 |
| 1.4 | 1.466 | 66.81 | 4.2546 | 3.68 | 4.1802 | 5.37 | 4.3954 | 0.49 |
| 1.5 | 1.7128 | 62.16 | 4.2546 | 6.00 | 4.1464 | 8.40 | 4.4727 | 1.19 |
Publisher’s Note: MDPI stays neutral with regard to jurisdictional claims in published maps and institutional affiliations. |
© 2021 by the authors. Licensee MDPI, Basel, Switzerland. This article is an open access article distributed under the terms and conditions of the Creative Commons Attribution (CC BY) license (http://creativecommons.org/licenses/by/4.0/).
Share and Cite
Jafari-Asl, J.; Ben Seghier, M.E.A.; Ohadi, S.; Dong, Y.; Plevris, V. A Comparative Study on the Efficiency of Reliability Methods for the Probabilistic Analysis of Local Scour at a Bridge Pier in Clay-Sand-Mixed Sediments. Modelling 2021, 2, 63-77. https://doi.org/10.3390/modelling2010004
Jafari-Asl J, Ben Seghier MEA, Ohadi S, Dong Y, Plevris V. A Comparative Study on the Efficiency of Reliability Methods for the Probabilistic Analysis of Local Scour at a Bridge Pier in Clay-Sand-Mixed Sediments. Modelling. 2021; 2(1):63-77. https://doi.org/10.3390/modelling2010004
Chicago/Turabian StyleJafari-Asl, Jafar, Mohamed El Amine Ben Seghier, Sima Ohadi, You Dong, and Vagelis Plevris. 2021. "A Comparative Study on the Efficiency of Reliability Methods for the Probabilistic Analysis of Local Scour at a Bridge Pier in Clay-Sand-Mixed Sediments" Modelling 2, no. 1: 63-77. https://doi.org/10.3390/modelling2010004