Article

X-ray-Based 3D Histology of Murine Hearts Using Contrast-Enhanced Microfocus Computed Tomography (CECT) and Cryo-CECT

1
Mechatronic, Electrical Energy and Dynamic Systems, Institute of Mechanics, Materials and Civil Engineering, UCLouvain, 1348 Ottignies-Louvain-la-Neuve, Belgium
2
Pole of Morphology, Institute of Experimental and Clinical Research, UCLouvain, 1200 Brussels, Belgium
3
Pole of Cardiovascular Research, Institute of Experimental and Clinical Research, UCLouvain, 1200 Brussels, Belgium
4
L’Institut du Thorax, CNRS, INSERM, CHU Nantes, Nantes University, 44000 Nantes, France
5
Department of Materials Engineering, KU Leuven, 3001 Leuven, Belgium
6
Prometheus, Division for Skeletal Tissue Engineering, KU Leuven, 3000 Leuven, Belgium
*
Author to whom correspondence should be addressed.
Hearts 2024, 5(1), 14-28; https://doi.org/10.3390/hearts5010002
Submission received: 27 October 2023 / Revised: 19 December 2023 / Accepted: 20 December 2023 / Published: 23 December 2023

Abstract

:
Cardiovascular diseases are the most common cause of death worldwide, and they still have dramatic consequences on the patients’ lives. Murine models are often used to study the anatomical and microstructural changes caused by the diseases. Contrast-enhanced microfocus computed tomography (CECT) is a new imaging technique for 3D histology of biological tissues. In this study, we confirmed the nondestructiveness of Hf-WD 1:2 POM-based CECT and cryogenic CECT (cryo-CECT) to image the heart in 3D. The influence of the image quality (i.e., acquisition time and spatial resolution) was assessed for the characterization of the heart structural constituents: heart integrity, the coronary blood vessels and the heart valves. Coronary blood vessels were visualized and segmented in murine hearts, allowing us to distinguish veins from arteries and to visualize the 3D spatial distribution of the right coronary artery and the left main coronary artery. Finally, to demonstrate the added value of 3D imaging, the thickness distribution of the two leaflets in the mitral valve and three cusps in the aortic valve was computed in 3D. This study corroborates the added value of CECT and cryo-CECT compared to classical 2D histology to characterize ex vivo the structural properties of murine hearts and paves the way for the detailed 3D (micro)structural analyses of future cardiovascular disease models obtained in mice and rats.

1. Introduction

Cardiovascular diseases (CVDs) are the most common cause of death worldwide [1]. Among them, ischemic heart disease is the most prevalent one and corresponds to an insufficient blood supply to the heart muscle, usually due to an obstructed coronary artery [2,3]. In addition to this disease, the heart can also be affected by congenital heart diseases, defined as birth structural abnormality of the heart and/or the great vessels, and heart valve diseases, affecting one or several heart valves [2,4,5]. The number of deaths caused by CVDs has already decreased thanks to the improvement of prevention and treatments [6]. However, diseases affecting the heart still have dramatic consequences on the patient’s physical function, quality of life and longevity [1,2,3,4,5,7].
The proper functioning of the heart is regulated by a complex and heterogeneous structure (defined by the main constituents of the heart, such as the heart chambers, heart valves and main vessels) and microstructure (defined by the microscale constituents, such as the muscle fibers, cells and extracellular matrix) [8,9]. Improving the understanding of the healthy (micro)structure–function relationship as well as the (micro)structural changes caused by diseases is essential to better define, diagnose and treat CVDs. Animal and especially murine models are often used for such purposes [10,11,12].
To assess the microstructure, as well as the composition of the heart at the tissue and cellular levels, classical 2D histology remains the gold standard despite being destructive, prone to artefacts and relatively labor-demanding and not allowing an isotropic 3D reconstruction of the tissue [13,14]. To counteract these limitations, 3D imaging techniques are more and more used, and X-ray-based approaches have especially been investigated to image heterogeneous organs ex vivo [15,16]. Among them, contrast-enhanced computed tomography (CECT) has already demonstrated its capability to image the heart and its constituents, such as the heart valves, the coronary blood vessels and the muscle fibers [17]. Moreover, novel nondestructive contrast-enhancing staining agents (CESAs), such as (1:2) hafnium(IV)-substituted Wells–Dawson polyoxometalate (Hf-WD 1:2 POM) [18,19], were tested, and the technique was further optimized with the development of cryogenic CECT (cryo-CECT) [20]. With this approach, the biological sample is fixed and stained with a CESA, frozen and imaged (in frozen state) in an in-house-developed cryo-stage. We previously demonstrated that cryo-CECT enabled the visualization and characterization of single muscle fibers in a nondestructive way in healthy and hypertrophic murine hearts. Moreover, interstitial and perivascular fibrotic regions were visualized with CECT, as confirmed by colorimetric 2D histology [20]. Despite the ability to visualize individual muscle fibers using cryo-CECT, the other (micro)structural constituents of the heart (such as heart valves and coronary arteries) were previously only assessed in mice by destructive CESAs [21,22,23,24,25,26,27], advanced imaging approaches requiring the use of a synchrotron [28,29] or perfusion of contrast casting agents relying on a fine-tuned preparation and resulting in the visualization of the lumen of the coronary vessels only [30,31].
The goal of this study was to further optimize CECT for 3D histology of the murine heart. First, the effect of each sample preparation step on the heart integrity was evaluated to quantitatively demonstrate the nondestructiveness of Hf-WD 1:2 POM-based CECT and cryo-CECT. Moreover, the influence of the image quality (i.e., acquisition time and spatial resolution) on the visualization of various heart constituents was assessed, namely, the heart integrity, the coronary blood vessels and the heart valves. Finally, the added value of 3D imaging was shown by computing the thickness distribution of the left-sided heart valves.

2. Materials and Methods

2.1. Heart Samples

Three wild-type murine hearts were provided by the Pole of Cardiovascular Research (UCLouvain, IREC, Brussels, Belgium). Animal handling and experimental procedures were approved by the local authorities (Comité d’éthique facultaire pour l’expérimentation animale, 2021/UCL/MD/009) and performed in accordance with the Guide for the Care and Use of Laboratory Animals, published by the US National Institutes of Health [32]. All animals were housed with a 12 h/12 h light/dark cycle, with the dark cycle occurring from 6.00 p.m. to 6.00 a.m. Mice were observed daily and had free access to water and standard chow. Mice were first anesthetized with a single intraperitoneal injection of anesthetic (ketamine 100 mg/kg and xylazine 10 mg/kg) to induce deep sleep and loss of reflexes. The chest was opened to expose the heart. The right atrium was incised, and a needle was inserted in the ventricles to perfuse the heart with PBS and guarantee a complete removal of blood. Then, hearts were excised and fixed with 10 mL of 4% paraformaldehyde for 48 h at 4 °C, followed by rinsing for 24 h in PBS.

2.2. Contrast-Enhancing Staining Agent

As a CESA, 1:2 hafnium(IV)-substituted Wells-Dawson polyoxometalate (Hf-WD 1:2 POM, K16[Hf(α2-P2W17O61)2]19H2O) was used. It was synthetized as described in the literature [33,34]. The Hf-WD 1:2 POM staining solution was prepared by dissolving 35 mg/mL of Hf-WD 1:2 POM in PBS, and each heart was incubated in 2 mL of solution for 10 days on a shaker plate at room temperature.

2.3. Microfocus X-ray Computed Tomography (microCT) Imaging

The murine hearts were imaged using microCT at four different steps: after immersion into the staining solution, after complete staining (referred to as CECT datasets), after freezing (referred to as cryo-CECT datasets) and after paraffin embedding. All microCT datasets were acquired with a Phoenix Nanotom M (Backer Hughes Waygate Technologies, Hürth, Germany) equipped with a 180 kV/15 W energy nanofocus X-ray tube. A diamond-coated tungsten target was used. Acquisition parameters for each acquisition step are described in Table 1. First, the hearts were imaged immediately after immersion in the staining solution with the low-resolution fast scan mode. Then, after 10 days of staining on a shaker plate at room temperature, the hearts were removed from the staining solution and rinsed in PBS. They were placed in fresh PBS to be successively imaged with the low-resolution fast scan mode and the high-resolution normal multiscan mode (corresponding to three consecutive datasets acquired over the height of the sample). After CECT image acquisition, samples were frozen in precooled isopentane at −80 °C and imaged again with the low-resolution fast scan mode and the high-resolution normal multiscan mode in an in-house-developed cryo-stage, as described in [20]. The hearts were thawed and rinsed in PBS before being embedded in paraffin. They were then imaged again with the low-resolution fast scan mode.
The microCT datasets were reconstructed with the Datos|x software (Baker Hughes Waygate Technologies, Germany) and exported as XY slices (.tiff). An in-house-developed MATLAB script was used to convert the 16-bit slices (.tiff) to 8-bit slices (.bmp) while simultaneously windowing the histogram range to the dynamic range of the dataset [20].

2.4. CECT Image Segmentation and Analysis

For each dataset, the heart was segmented from the background using watershed segmentation and manual corrections (Thermo Fisher Scientific, Bordeaux, France). The low-resolution fast scan mode datasets were used to quantify the volume of the hearts at each sample preparation step. They were manually registered to the histological sections for comparison. The blood vessels were semimanually segmented on the high-resolution normal multiscan dataset acquired with CECT using Avizo software (magic wand tool, Thermo Fisher Scientific, Bordeaux, France). To characterize the left-sided heart valves, the CECT datasets acquired with high-resolution normal multiscan mode were first cropped in the heart valve region. Regions of interest were manually selected to segment the aortic and the mitral valves for each sample (lasso tool, Thermo Fisher Scientific, Bordeaux, France). Each valve was then further manually segmented to identify the individual cusps and leaflets, respectively. Their thickness distribution was computed in 3D using CTAn (Bruker, Kontisch, Belgium). The aortic valve from one sample was not included in the thickness analysis because the aortic valve was partially sectioned during dissection.

2.5. Data and Statistical Analyses

The heart volume measured on the low-resolution fast scan mode datasets (n = 3) was statistically tested compared to the reference (T0) using a mixed-effects analysis, with the Geisser–Greenhouse correction and a Dunnett’s multiple comparison test with GraphPad Prism 9 (GraphPad Software, La Jolla, CA, USA). In the bar graphs, the mean value for the different samples is indicated by the height of the bars. Error bars represent the standard error of the mean, and the individual datapoints are given.

2.6. Colorimetric 2D Histology

Sections of 5 µm thickness were cut from the paraffin-embedded samples using a microtome. They were stained with hematoxylin and eosin (H&E) for comparison with CECT and cryo-CECT. Histological sections were imaged using a Pannoramic scan II scanner (3DHISTECH, Budapest, Hungary).

3. Results

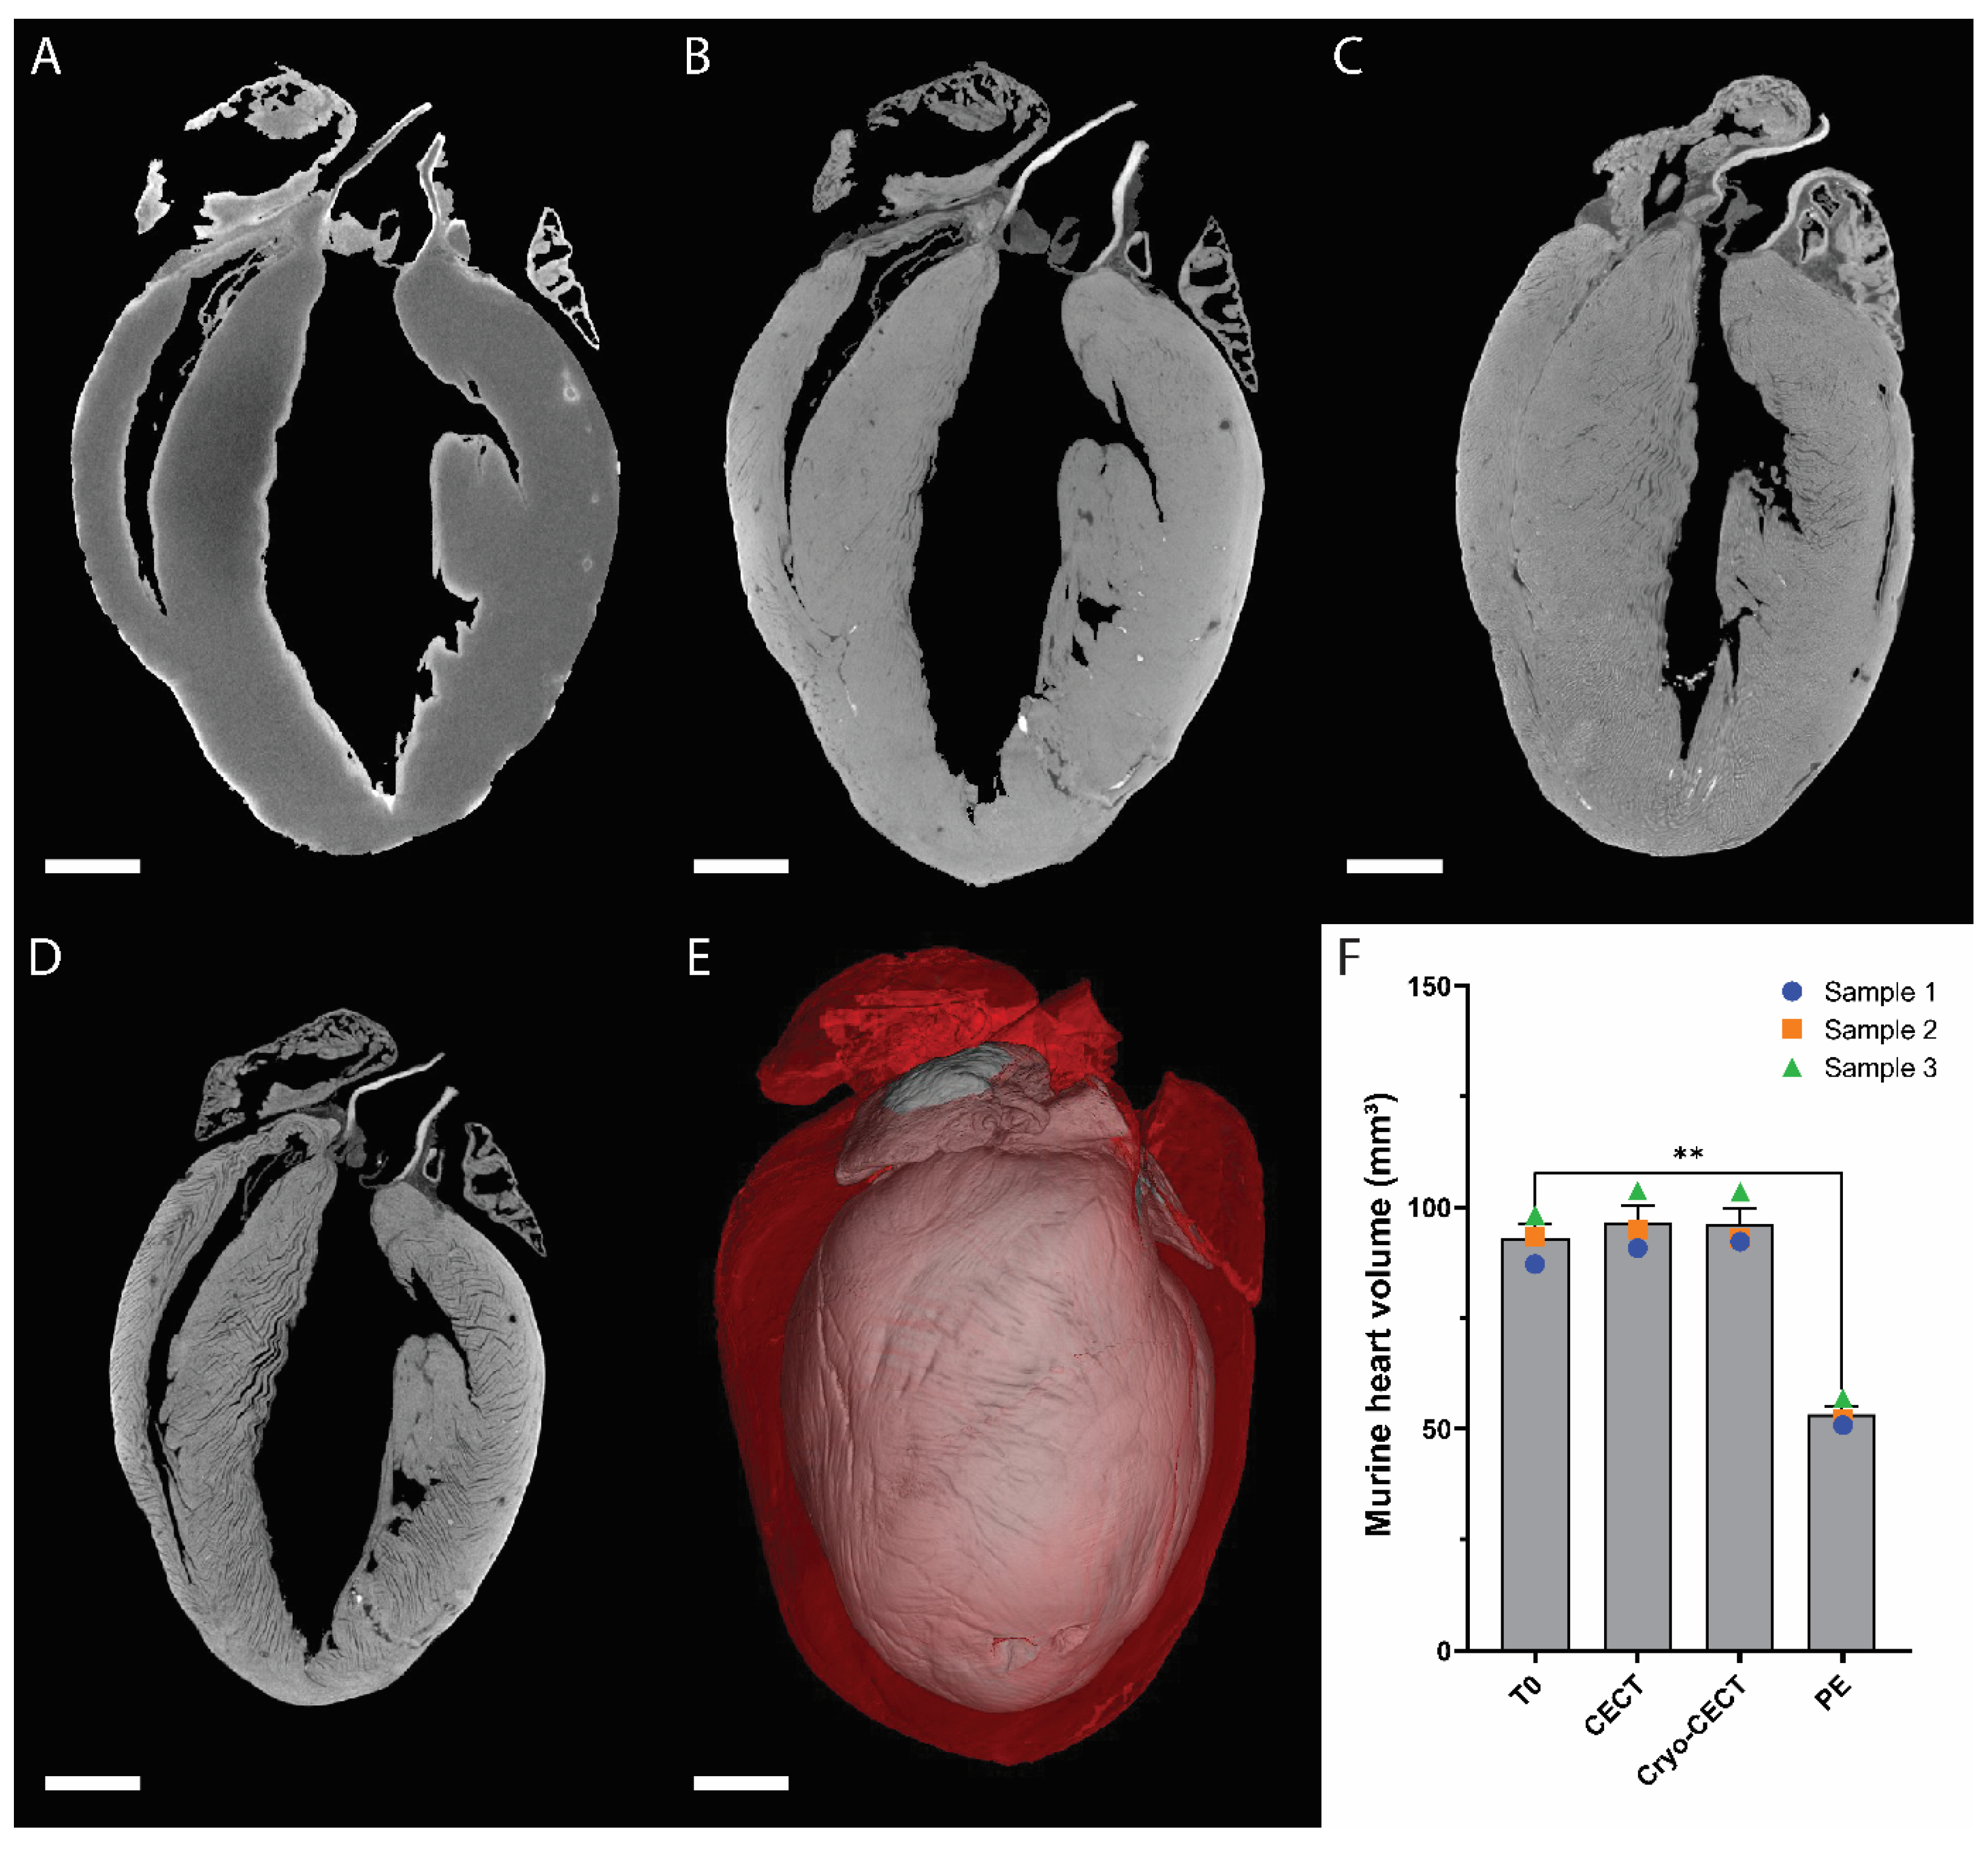
3.1. Influence of the Sample Preparation on the Heart Volume

The impact of each step in the sample preparation protocol was evaluated by quantifying the murine heart volume at each step (Figure 1). The heart volume at the introduction to the staining solution was taken as reference (referred to as T0; Figure 1A). The heart volume increase due to CESA staining (Figure 1B,F) and due to freezing (Figure 1C,F) was nonsignificant and on average equal to 3.82% and 3.54%, respectively. However, it decreased significantly by about 42.68% due to paraffin embedding (Figure 1A,D–F). The overlap of the heart volume after complete CESA staining and after paraffin embedding highlights this substantial structural change (Figure 1E).

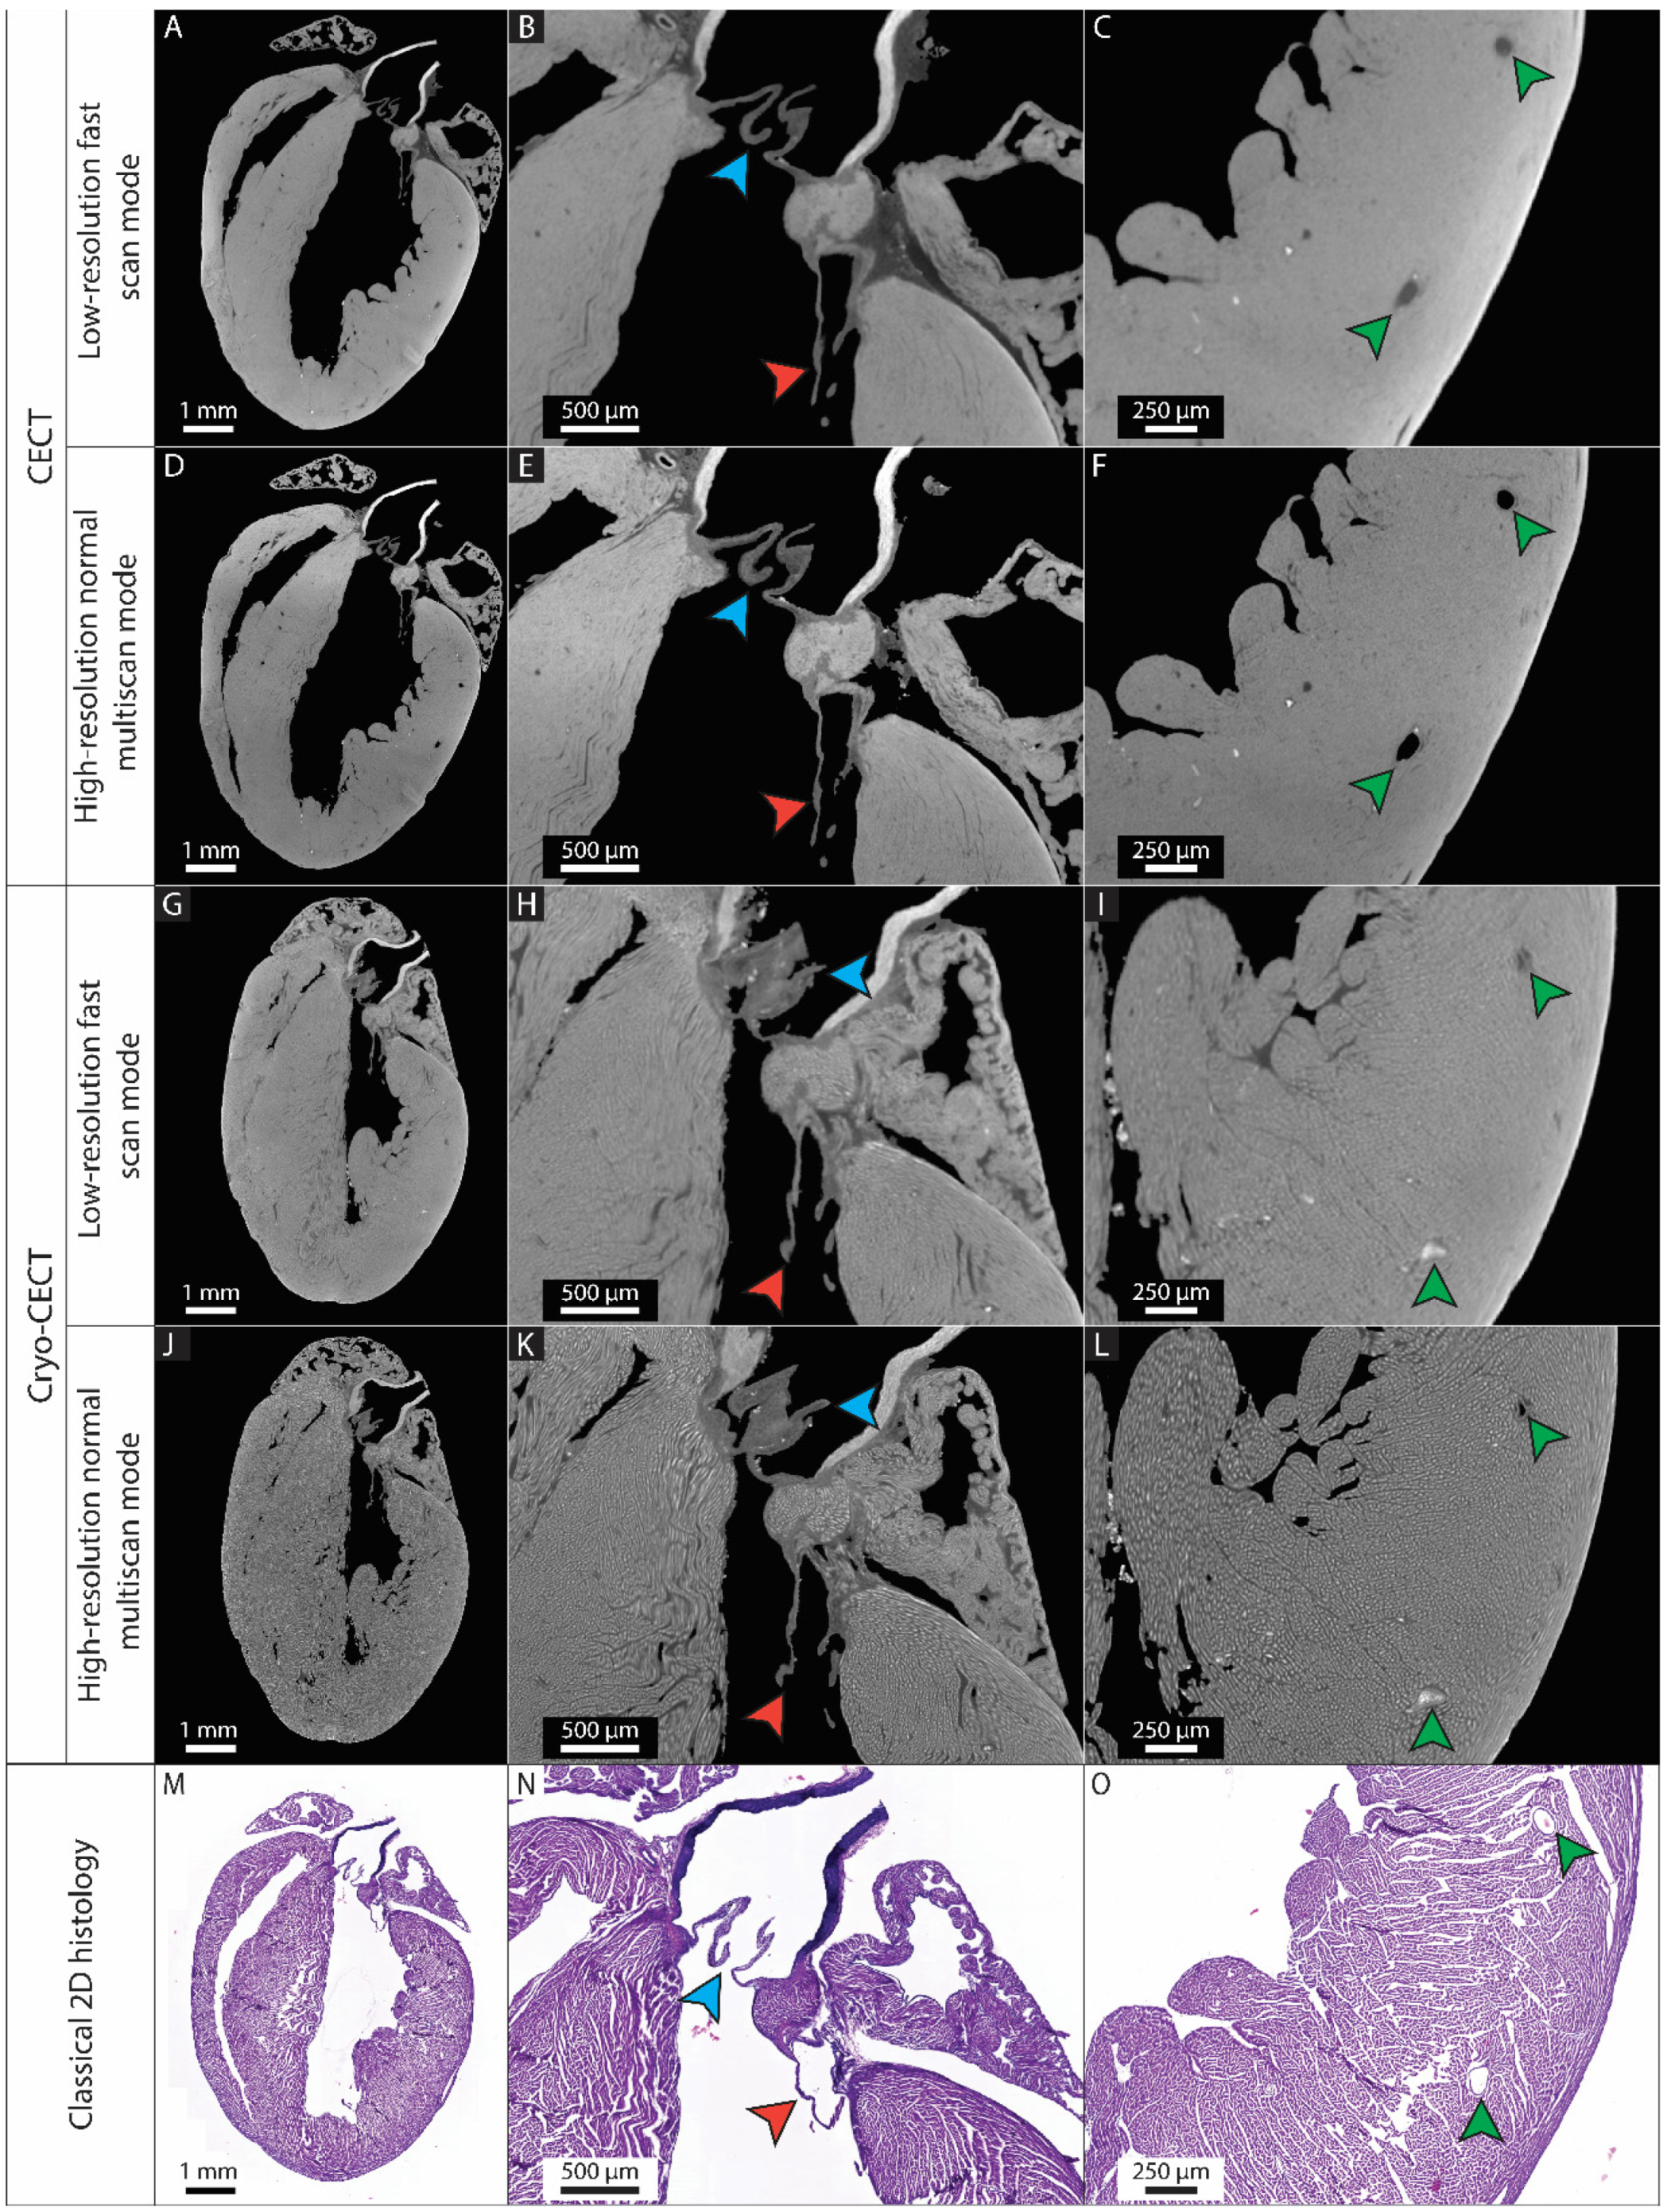
3.2. The Possibility of Visualizing and Segmenting the (Micro)Structural Constituents of the Heart Depends on the Imaging Quality

We first determined which imaging protocol (CECT or cryo-CECT) and which imaging quality (low-resolution fast scan mode or high-resolution normal multiscan mode) can be used to visualize and segment the different (micro)structural heart constituents (Figure 2A–L). We compared all these conditions to classical 2D histology sections of the same heart (Figure 2M–O). Based on our results, Table 2 gives guidelines for the selection of the best protocol and image quality for a given heart constituent. While the low-resolution fast scan mode datasets were sufficient to compute the entire heart volume, the visualization of the microstructural constituents, such as the coronary blood vessels and heart valves, was highly improved in the high-resolution normal multiscan CECT datasets (Figure 2A–D). High-resolution normal multiscan datasets acquired with cryo-CECT was the only imaging protocol that enabled the visualization of individual muscle fibers (Figure 2G–L). However, it caused the collapse of the heart chambers and blood vessels and affected the distinction of the heart valves. Classical 2D histology confirmed the capability of CECT and cryo-CECT to accurately image the entire murine heart, the heart valves and the coronary blood vessels (Figure 2M–O).
The high-resolution normal multiscan mode CECT dataset allowed the description of the heart structure in great detail (Supplementary Video S1). The aorta (Ao) and the four heart chambers (RV: right ventricle, LV: left ventricle, RA: right atrium and LA: left atrium) were easily identified, as were the two atrial appendages (RAA and LAA). The four heart valves (PV: pulmonary valve, TV: tricuspid valve, AV: aortic valve and MV: mitral valve) were also clearly visible with the insertion of the mitral valve into the papillary muscles (antero-lateral and postero-medial papillary muscles, referred to as PM1 and PM2, respectively, in Supplementary Video S1). Moreover, it was possible to distinguish dissection differences between two samples (Supplementary Figure S1, Supplementary Video S2). One of the samples was slightly cut in the atria (performed during sample extraction to properly flush the hearts with PBS) but still comprised both atrial appendages (Supplementary Figure S1A,C), whereas the second one was totally deprived of the aorta, the right atrium and the right atrial appendage (Supplementary Figure S1B,D). While the mitral valve is located between the left atrium and ventricle and should not be visible from the outside, it was visible in the first sample (Supplementary Figure S1C). In the second heart, not only the mitral valve but also two aortic valve cusps (the third one being absent) were seen from the outside (Supplementary Figure S1D).

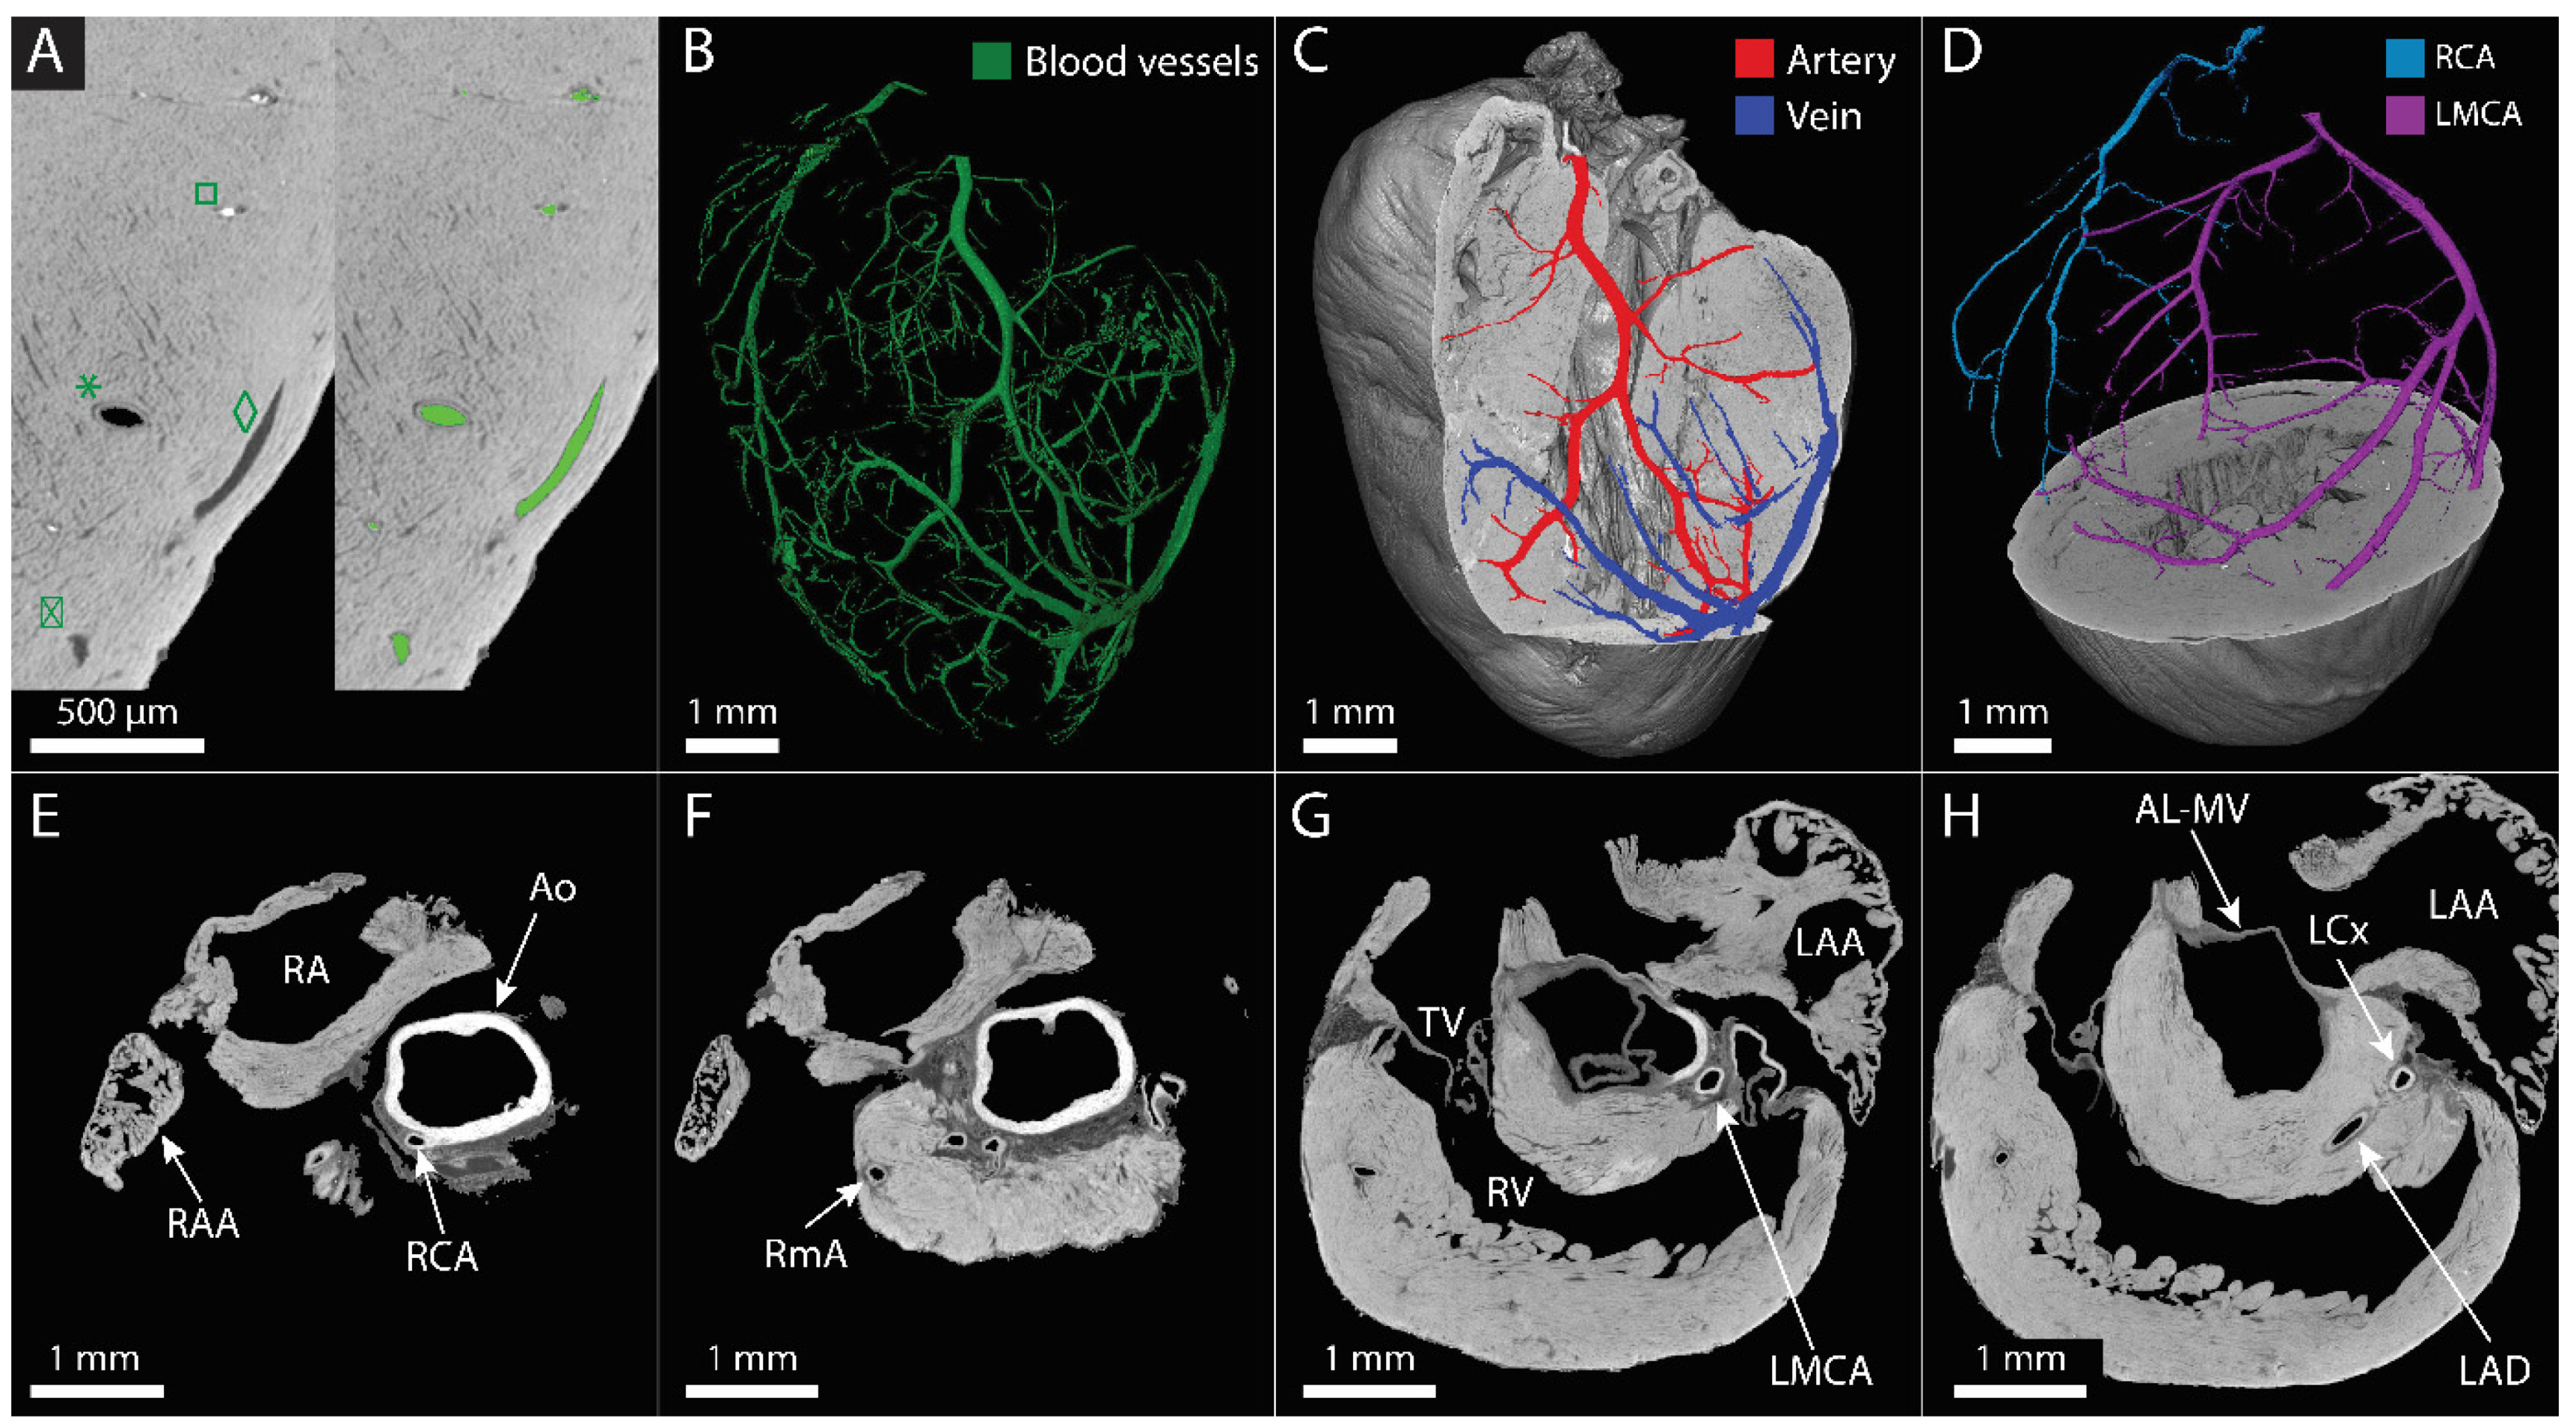
3.3. The Main Coronary Blood Vessels Could Be Visualized and Partially Segmented Using CECT

Based on the high-resolution normal multiscan mode CECT datasets, the main coronary blood vessels could be not only visualized but also partially segmented (Figure 3A,B). It was possible to discern empty vessels from the ones filled with blood based on grayscale differences and to distinguish veins from arteries based on the visualization of the thick arterial wall, allowing the segmentation of venous and arterial branches, respectively (Figure 3A,C). Thanks to the visualization in three dimensions, it was possible to distinguish and segment the left and right coronary arteries from their origin in the root of the ascending aorta up to the branching in the myocardium (Figure 3D, Supplementary Video S3). The aorta, the right coronary and marginal arteries, the left main coronary artery and the left circumflex and anterior descending arteries were identified (Figure 3E–H). However, the segmentation was limited to the largest vessels and was more and more discontinuous as the vessels divided into smaller branches towards arterioles, venules and capillaries (Supplementary Video S4).

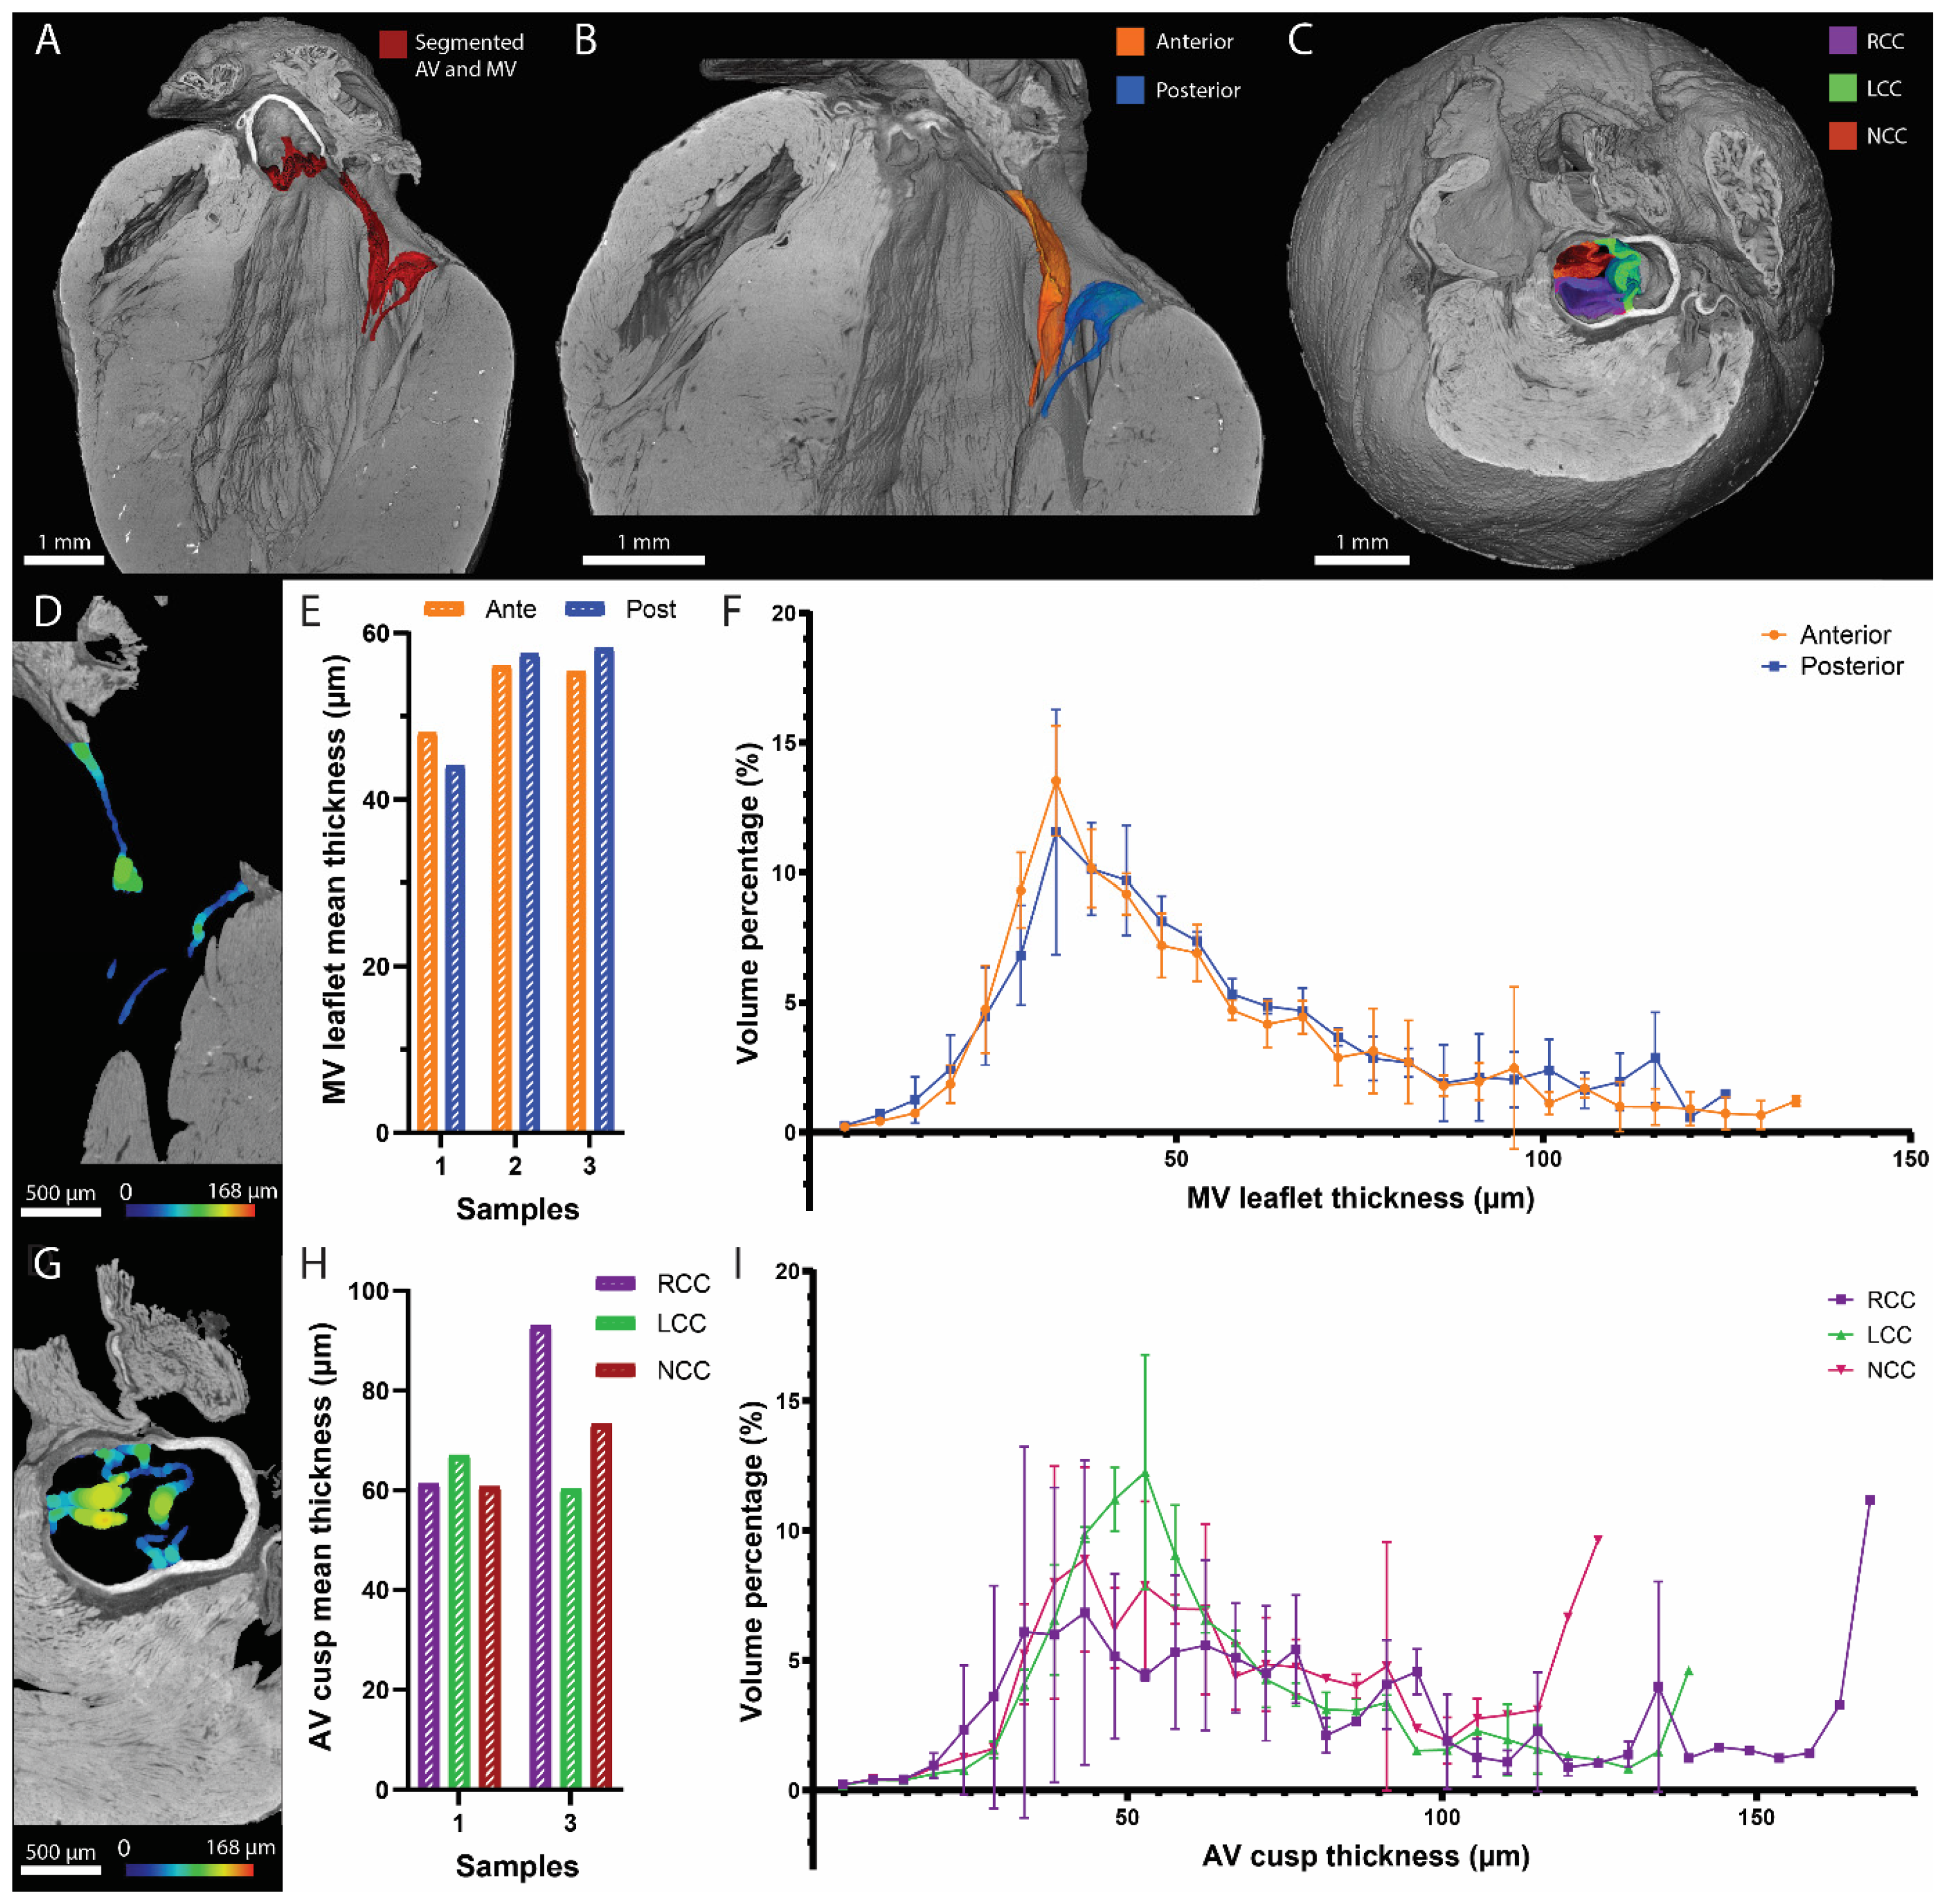
3.4. CECT Allowed for the 3D Characterization of the Left-Sided Heart Valves

We demonstrated before that the high-resolution normal multiscan mode CECT datasets had the best imaging quality to visualize the heart valves. The mitral valve apparatus and the aortic valve cusps were segmented for illustration (Figure 4A). The anterior and posterior leaflets (Figure 4B) and the right, left and noncoronary cusps (Figure 4C) were identified for each heart valve, respectively. The thickness distribution of each leaflet (including the chordae tendineae) and cusp was computed in 3D, showing the added value of CECT compared to classical 2D histology (Figure 4D–I). The mean thickness of the mitral valve leaflets ranged from 44.10 µm to 58.21 µm, while for the aortic valve cusps, the mean thickness varied between 60.22 µm and 92.97 µm. The 3D distribution allowed the visualization of local variations in the leaflet and cusp thickness (Figure 4F,I and Video S5).

4. Discussion

Despite the improvement of prevention and treatments, CVDs remain the major cause of death worldwide [1]. Murine models are often used to study the healthy (micro)structure of the heart and to improve the understanding of the disease consequences, the diagnosis and the potential treatments [10,11,12]. Whereas previous X-ray-based investigations of the murine heart mostly relied on destructive or not readily available techniques [17,35], new CESAs and an extended approach to CECT, namely, Hf-WD 1:2 POM and cryo-CECT, respectively, recently emerged [19,20]. In this study, we applied Hf-WD 1:2 POM-based CECT and cryo-CECT to entire murine hearts. We first assessed the influence of each preparation step on the heart integrity. We then compared (i) two imaging protocols (CECT and cryo-CECT) and (ii) two imaging qualities (low-resolution fast scan mode and high-resolution normal multiscan mode). Finally, we demonstrated the added value of 3D imaging by computing the thickness distribution of left-sided heart valves.
In one of our previous studies, Hf-WD 1:2 POM was already proposed as a nondestructive CESA that avoids tissue shrinkage, as opposed to destructive CESAs such as Lugol’s iodine and phosphotungstic acid (PTA) [17,18,19,20,36]. The results presented in this study confirm that Hf-WD 1:2 POM staining for CECT imaging and the subsequent freezing to perform cryo-CECT do not have a significant impact on the murine heart volume. In contrast, important tissue shrinkage was observed in the heart after paraffin embedding, which was nevertheless less visible after 2D sectioning using a microtome (Figure 1E vs. Figure 2M). We hypothesize that this might be a consequence of tissue relaxation in hot water between the 2D sectioning and tissue collection on a glass slide. The important tissue shrinkage observed in the heart due to paraffin embedding (during which the biological samples are totally dehydrated to progressively replace the water content with liquid paraffin) could be avoided by using, for instance, cryostat sections, which do not involve paraffin embedding. However, this usually requires fine-tuning in order to avoid freezing damage (e.g., when and how to use cryoprotectant and an embedding matrix such as OCT and the selection of the freezing method) and results in poor structural preservation, such as ruptures and cracks [37,38,39,40]. These results are added to the well-known limitations of classical 2D histology, namely, the irreversible cut performed in the sample along with a single cutting orientation and an anisotropic voxel size (in the rare case that serial sections were successfully obtained). The analysis can be affected by loss of data caused by different factors: tissue tearing, folding or washing off during mounting. Moreover, 2D sections might be misinterpreted [41,42] or the quantification performed on them might produce unreliable results (due to tissue alterations, staining variation even with a well-defined protocol or light microscope variability) [43,44,45,46]. Altogether, these elements highlight the superiority of X-ray-based 3D histology, namely, CECT and cryo-CECT, to capture the heterogeneity of complex organs such as the murine heart. However, unlike classical 2D histology, CECT and cryo-CECT do not provide information about the composition of the tissue and the cell phenotype. Nevertheless, as shown in our imaging protocol, the different approaches (CECT, cryo-CECT and classical 2D histology) can be combined and successively performed on a single sample.
We also showed that the image quality (time and voxel size) as well as the imaging protocol (CECT or cryo-CECT) have an important influence on the identification and analysis of the (micro)structural constituents of the heart. Our study was the first one to compare these two imaging protocols (namely, CECT and cryo-CECT) and to investigate the influence of the imaging qualities on the visualization of the heart constituents. It should be mentioned that the low-resolution scanning mode used in our study (voxel size of 4.5 µm) already corresponds to a high resolution compared to the current literature. Cryo-CECT was the only imaging modality that allowed the visualization of individual muscle fibers. Based on these images, quantitative information, such as fiber orientation and diameter (corresponding to the cross-sectional area of the cardiomyocytes), can also be obtained. These measures were previously computed on healthy and hypertrophic murine hearts and were not repeated in the frame of this study [20].
CECT imaging of the great coronary blood vessels allowed the distinction between venous and arterial branches and between the right coronary artery and the left main coronary artery. Some vessels were segmented thanks to the presence of blood in the lumen, which stains strongly with Hf-WD 1:2 POM, but this was highly sample-dependent. For instance, the alternance of vessels partially filled with blood and partially empty made the segmentation more difficult and more time-consuming. Therefore, the segmentation of all recognized blood vessels was highly discontinuous, and small details in branching and smaller vessels could not be visualized due to (i) the limited spatial resolution, (ii) collapse of the blood vessels, or (iii) the lack of blood inside the vessel lumen. X-ray-based visualization of the coronary blood vessel network was demonstrated in previous studies for human hearts using Lugol’s iodine and graphene oxide in combination with agarose [47], for rat hearts using phase-contrast imaging [48] and for murine hearts using destructive CESAs [26,27]. The use of Microfil as a casting contrast agent (CCA) was also investigated to visualize the coronary blood vessel network in rats [30] and mice [31,49]. However, the use of CCA necessitates fine-tuned and closely monitored perfusion pressure and viscosity. Applying the nondestructive Hf-WD 1:2 POM-based CECT approach presented in this study, with, for instance, even higher spatial resolution imaging in a determined region of interest, or in combination with postprocessing of the segmented datasets could help to obtain a better segmentation and more connected blood vessel network. In such a case, quantitative analysis of the structural properties of coronary blood vessels could be performed to determine, for instance, the length, diameter and branching of the blood vessels [50].
Based on the clear visualization of the heart valves and the distinction of the two leaflets and the three cusps in the mitral and aortic valves using high-resolution CECT, their thickness distribution was computed in 3D, and local variations were visualized. Heart valve thickness was previously assessed in other studies based on classical 2D histology [51,52,53]. However, in this case, the quantified values highly depend on the cutting location and orientation and do not allow the assessment of local variations. To counteract this limitation, Delwarde et al. used PTA-based CECT to compute the mitral valve leaflet volume in a rat model of degenerative mitral valve dystrophy. They demonstrated that the leaflet thickness increase observed in classical 2D histology was associated with a similar leaflet volume increase computed on the CECT datasets [53]. In comparison with other CECT-based analyses, such as PTA-based CECT, our study demonstrates the application of nondestructive CECT at higher resolution than previously conducted, without sample deterioration (shrinkage being the most common consequence of PTA-based CECT staining). Our study is the first to assess the 3D thickness distribution of the heart valve leaflets and cusps using CECT datasets. However, the mean thickness values obtained in our study contradict previous results reporting that atrioventricular valves (the mitral and tricuspid valves) are slightly thicker than the semilunar ones (the aortic and pulmonary valves) [51,54,55]. While it could be a bias from the limited 2D assessment of a 3D structure, this should be further investigated in additional samples. We are convinced that optimizing the sample preparation to preserve as much as possible its native microstructure and to obtain high-resolution imaging could provide more details on the heart valve anatomy and more information about the possible changes caused by diseases. We foresee several potential applications to heart valve disease models in which the heart valves are affected by local anatomical changes, for instance, before the apparition of calcification in the aortic valve [56,57,58] or due to degenerative heart valve diseases [53]. It should be noted that our analysis of the mitral valve considered the entire mitral valve apparatus (leaflets and chordae tendineae), while having the distinct thickness distribution of the leaflet and the chordae tendineae, respectively, might be of particular interest in the context of mitral valve prolapse, for example.
Finally, although having great potential, microCT techniques have several limitations. First, their use is currently limited by the amount of generated data: between 12 GB of raw data (radiographs obtained during microCT acquisition before any reconstruction) for the low-resolution fast scan mode datasets and up to 100 GB of raw data for the high-resolution normal multiscan mode datasets in this study. Hence, segmentation and 3D analysis can take several hours or days. Then, in order to be imaged with microCT, the heart needs to be explanted, which might affect its structure (for instance, the size of the heart chambers) due to the nonphysiological conditions. For instance, although ex vivo imaging was previously used to quantify the volume of the ventricles [59], we decided to not repeat this measure in this study because of the lack of reliability of such analyses. Moreover, the heart is fixed and stained, and it usually takes several days or weeks to achieve the complete staining of the sample; furthermore, the resolution limits the visualization of microstructural constituents (only the muscle fibers can be distinguished but no collagen and elastin fibers in the extracellular space, for example). This limitation can be avoided by using phase-contrast imaging. However, this requires the use of synchrotron or advanced laboratory systems providing information about the X-ray beam phase. Both of them are poorly available, even though more and more progress is being made to develop lab-based phase-contrast imaging [29,60,61]. Finally, in comparison to the gold standard classical 2D histology, which is well established in most laboratories, microCT requires specific infrastructures (which can be expensive, in the range of hundreds of thousands of euros).
Because of its capability to perform 3D structural analysis, Hf-WD 1:2 POM-based CECT, as presented in this study, could be applied to many disease models, especially for congenital heart diseases [12,62], coronary heart diseases [12,63] and heart valve diseases [10], and at several stages of embryogenesis. Three-dimensional nondestructive techniques are of high interest in the study of complex structural diseases, such as tetralogy of Fallot (combination of four defects in the heart structure) and wrong positioning of the main vessels, which are two examples of congenital heart diseases. This is particularly true for challenging samples due, for instance, to their small sizes or due to maceration (changes in the soft tissues) for which classical analyses might be precluded or lead to a wrong diagnosis.

5. Conclusions

In conclusion, this study confirms the added value of X-ray-based 3D histology using CECT and cryo-CECT compared to classical 2D histology only to characterize ex vivo the structural properties of murine hearts in laboratories. They allow for the 3D visualization of several heart (micro)structural constituents such as the heart chambers, coronary blood vessels, heart valves and individual muscle fibers. Our study was the first one to allow the nondestructive visualization of coronary blood vessels and heart valves, simultaneously, using CECT. The detailed 3D structural and microstructural analyses available through the use of CECT and cryo-CECT, combined or not with classical 2D histology, pave the way for many applications to cardiovascular disease models studied in mice, rats and even human biopsies.

Supplementary Materials

The following supporting information can be downloaded at: https://www.mdpi.com/article/10.3390/hearts5010002/s1, Figure S1: visualization of dissection differences for two murine heart samples. (A,B) 2D orthoslices of two different samples, showing the missing aorta and right atrial appendage in the second sample (B). AV = aortic valve, MV = mitral valve, RV = right ventricle, LV = left ventricle, RAA = right atrial appendage, LAA = left atrial appendage. (C,D) 3D renderings of the two samples showing abnormal opening on the mitral valve (C) and on the aortic and mitral valves (D). On the 3D renderings, the orange arrow shows the left atrial appendage and the white arrow shows the cut in the atria for each sample. The mitral valve is shown in red and the aortic valve in blue. Video S1: heart structure as visualized with high-resolution normal multiscan mode CECT in 3D (left) and on 2D orthoslice (right). Ao = aorta, RV = right ventricle, LV = left ventricle, RA = right atrium, LA = left atrium, RAA = right atrial appendage, LAA = left atrial appendage, PV = pulmonary valve, TV = tricuspid valve, AV = aortic valve, MV = mitral valve, PM = papillary muscle. Video S2: visualization of dissection differences for two murine heart samples. Sample on the left contains only a small cut in the atria while sample on the right is deprived of the aorta, right atrium and right atrial appendage. Video S3: distinction and segmentation of the two coronary arteries in the high-resolution normal multiscan CECT dataset. The 2D orthoslice shown on the left is the cutting plan used in the 3D rendering (right). RCA = right coronary artery (blue), LMCA = left marginal coronary artery (pink). Video S4: segmentation of the heart blood vessels is more and more discontinuous as the vessels divided in smaller branches. Video S5: heart valve characterization on the high-resolution normal multiscan CECT dataset. Back and forth longitudinal section through the heart showing the identification of the two leaflets in the mitral valve and their thickness distribution. Back and forth transverse section through the heart showing the identification of the three cusps in the aortic valve and their thickness distribution.

Author Contributions

C.P. and G.K. conceived and designed the study. A.M. dissected the murine hearts. C.P. conducted the experiments (sample preparation and staining, microCT acquisition and data analysis). C.P., L.S., A.M., S.H., R.C. and G.K. contributed to the interpretation of the data. C.P. wrote the manuscript. G.K. supervised the study. All authors have read and agreed to the published version of the manuscript.

Funding

C.P. and G.K. acknowledge the Action de Recherche Concertée (ARC 19/24-097)-Fédération Wallonie-Bruxelles and acknowledge the support from ASBL Jean Degroof-Marcel Van Massenhove funding and the UCLouvain Foundation Saint-Luc (RM2A project). A.M. is supported by a grant from the Fonds National de la Recherche Scientifique (FNRS), Belgium (T.0011.19; T.0009.21). This work is also supported by an ARC grant (ARC 18/23- 094). S.H. works as Senior Research Associate at FNRS, Belgium. RC is supported by a “Connect Talent” research chair from Région Pays de la Loire and Nantes Métropole. Avizo 2022.1 (Thermo Fisher Scientific, Illkirch, France) software acquisition was supported by the FNRS (EQP—Tomo4D- U.N069.20).

Institutional Review Board Statement

The animal study protocol was approved by the Institutional Review Board of UCLouvain (Comité d’éthique facultaire pour l’expérimentation animale, 2021/UCL/MD/009).

Informed Consent Statement

Not applicable.

Data Availability Statement

The raw data supporting the conclusions of this article will be made available by the authors, without undue reservation, upon request to the corresponding author.

Acknowledgments

We would like to thank Tim Balcaen and Wim De Borggraeve (KU Leuven) for the development and synthesis of Hf-WD 1:2 POM; Johan Vanulst and Joris Bleukx (KU Leuven) for the technical support in the design of the in situ cryo-stage; and Pierre Schneidewind and Delia Hoffmann (UCLouvain) for the sectioning and colorimetric staining of the biological samples. The X-ray microCT images were generated at the KU Leuven XCT Core Facility (supported by Jeroen Soete, research expert) and in the microCT lab of UCLouvain (IREC, Brussels).

Conflicts of Interest

The authors declare no conflicts of interest.

References

  1. Townsend, N.; Kazakiewicz, D.; Lucy Wright, F.; Timmis, A.; Huculeci, R.; Torbica, A.; Gale, C.; Achenbach, S.; Weidinger, F.; Vardas, P. Epidemiology of cardiovascular disease in Europe. Nat. Rev. Cardiol. 2022, 19, 133–143. [Google Scholar] [CrossRef]
  2. Ralapanawa, U.; Sivakanesan, R. Epidemiology and the magnitude of coronary artery disease and acute coronary syndrome: A narrative review. J. Epidemiol. Glob. Health 2021, 11, 169–177. [Google Scholar] [CrossRef]
  3. Khan, M.A.; Hashim, M.J.; Mustafa, H.; Baniyas, M.Y.; Al Suwaidi, S.K.B.M.; Al Katheeri, R.; Alblooshi, F.; Almatrooshi, M.; Alzaabi, M.; Darmaki, R.; et al. Global Epidemiology of Ischemic Heart Disease: Results from the Global Burden of Disease Study. Cureus 2020, 12, e9349. [Google Scholar] [CrossRef]
  4. Wu, W.; He, J.; Shao, X. Incidence and mortality trend of congenital heart disease at the global, regional, and national level, 1990–2017. Medicine 2020, 99, 853. [Google Scholar] [CrossRef]
  5. Coffey, S.; Roberts-Thomson, R.; Brown, A.; Carapetis, J.; Chen, M.; Enriquez-Sarano, M.; Zühlke, L.; Prendergast, B.D. Global epidemiology of valvular heart disease. Nat. Rev. Cardiol. 2021, 18, 853–864. [Google Scholar] [CrossRef]
  6. Mensah, G.A.; Wei, G.S.; Sorlie, P.D.; Fine, L.J.; Rosenberg, Y.; Kaufmann, P.G.; Mussolino, M.; Hsu, L.; Addou, E.; Engelgau, M.; et al. Decline in Cardiovascular Mortality. Circ. Res. 2017, 120, 366–380. [Google Scholar] [CrossRef]
  7. Vaduganathan, M.; Mensah, G.A.; Turco, J.V.; Fuster, V.; Roth, G.A. The Global Burden of Cardiovascular Diseases and Risk: A Compass for Future Health. J. Am. Coll. Cardiol. 2022, 80, 2361–2371. [Google Scholar] [CrossRef]
  8. Weinhaus, A.J.; Roberts, K.P. Anatomy of the human heart. In Handbook of Cardiac Anatomy, Physiology and Devices, 2nd ed.; Springer: Berlin/Heidelberg, Germany, 2005; pp. 59–85. [Google Scholar] [CrossRef]
  9. Torrent-Guasp, F.; Kocica, M.J.; Corno, A.F.; Komeda, M.; Carreras-Costa, F.; Flotats, A.; Cosin-Agillar, J.; Wen, H. Towards new understanding of the heart structure and function. Eur. J. Cardio-Thorac. Surg. 2005, 27, 191–201. [Google Scholar] [CrossRef]
  10. Zaragoza, C.; Gomez-Guerrero, C.; Martin-Ventura, J.L.; Blanco-Colio, L.; Lavin, B.; Mallavia, B.; Tarin, C.; Mas, S.; Ortiz, A.; Egido, J. Animal models of cardiovascular diseases. J. Biomed. Biotechnol. 2011, 2011, 497841. [Google Scholar] [CrossRef]
  11. Camacho, P.; Fan, H.; Liu, Z.; He, J.-Q. Small mammalian animal models of heart disease. Am. J. Cardiovasc. Dis. 2016, 6, 70–80. [Google Scholar]
  12. Jia, T.; Wang, C.; Han, Z.; Wang, X.; Ding, M.; Wang, Q. Experimental Rodent Models of Cardiovascular Diseases. Front. Cardiovasc. Med. 2020, 7, 588075. [Google Scholar] [CrossRef]
  13. Bindhu, P.R.; Krishnapillai, R.; Thomas, P.; Jayanthi, P. Facts in artifacts. J. Oral Maxillofac. Pathol. 2013, 17, 397–401. [Google Scholar] [CrossRef]
  14. Taqi, S.A.; Sami, S.A.; Sami, L.B.; Zaki, S.A. A review of artifacts in histopathology. J. Oral Maxillofac. Pathol. 2018, 22, 279. [Google Scholar] [CrossRef]
  15. Metscher, B.D. MicroCT for developmental biology: A versatile tool for high-contrast 3D imaging at histological resolutions. Dev. Dyn. 2009, 238, 632–640. [Google Scholar] [CrossRef]
  16. Rawson, S.D.; Maksimcuka, J.; Withers, P.J.; Cartmell, S.H. X-ray computed tomography in life sciences. BMC Biol. 2020, 18, 21. [Google Scholar] [CrossRef]
  17. Leyssens, L.; Pestiaux, C.; Kerckhofs, G. A review of ex vivo x-ray microfocus computed tomography-based characterization of the cardiovascular system. Int. J. Mol. Sci. 2021, 22, 3263. [Google Scholar] [CrossRef]
  18. De Bournonville, S.; Vangrunderbeeck, S.; Kerckhofs, G. Contrast-enhanced microCT for virtual 3D anatomical pathology of biological tissues: A literature review. Contrast Media Mol. Imaging 2019, 2019, 8617406. [Google Scholar] [CrossRef]
  19. Kerckhofs, G.; Stegen, S.; van Gastel, N.; Sap, A.; Falgayrac, G.; Penel, G.; Durand, M.; Luyten, F.; Geris, L.; Vandamme, K.; et al. Simultaneous three-dimensional visualization of mineralized and soft skeletal tissues by a novel microCT contrast agent with polyoxometalate structure. Biomaterials 2018, 159, 1–12. [Google Scholar] [CrossRef]
  20. Maes, A.; Pestiaux, C.; Marino, A.; Balcaen, T.; Leyssens, L.; Vangrunderbeeck, S.; Pyka, G.; Bertrand, L.; Beauloye, C.; Horman, S. Cryogenic contrast-enhanced microCT enables nondestructive 3D quantitative histopathology of soft biological tissues. Nat. Commun. 2022, 13, 6207. [Google Scholar] [CrossRef]
  21. Degenhardt, K.; Wright, A.C.; Horng, D.; Padmanabhan, A.; Epstein, J.A. Rapid 3D phenotyping of cardiovascular development in mouse embryos by micro-CT with iodine staining. Circ. Cardiovasc. Imaging 2010, 3, 314–322. [Google Scholar] [CrossRef]
  22. Kim, A.J.; Francis, R.; Liu, X.; Devine, W.A.; Ramirez, R.; Anderton, S.J.; Wong, L.; Faruque, F.; Gabriel, G.; Tobita, K. Microcomputed tomography provides high accuracy congenital heart disease diagnosis in neonatal and fetal mice. Circ. Cardiovasc. Imaging 2013, 6, 551–559. [Google Scholar] [CrossRef] [PubMed]
  23. Merchant, S.S.; Kosaka, Y.; Yost, H.J.; Hsu, E.W.; Brunelli, L. Micro-Computed Tomography for the Quantitative 3-Dimensional Assessment of the Compact Myocardium in the Mouse Embryo. Circ. J. 2016, 80, 1795–1803. [Google Scholar] [CrossRef] [PubMed]
  24. Doost, A.; Rangel, A.; Nguyen, Q.; Morahan, G.; Arnolda, L. Micro-CT scan with virtual dissection of left ventricle is a non-destructive, reproducible alternative to dissection and weighing for left ventricular size. Sci. Rep. 2020, 10, 13853. [Google Scholar] [CrossRef] [PubMed]
  25. Dullin, C.; Ufartes, R.; Larsson, E.; Martin, S.; Lazzarini, M.; Tromba, G.; Guentner, J.; Pinkert, D.; Alves, F. μCT of ex-vivo stained mouse hearts and embryos enables a precise match between 3D virtual histology, classical histology and immunochemistry. PLoS ONE 2017, 12, e0170597. [Google Scholar] [CrossRef] [PubMed]
  26. Dunmore-Buyze, P.J.; Tate, E.; Xiang, F.L.; Detombe, S.A.; Nong, Z.; Pickering, J.G.; Drangova, M. Three-dimensional imaging of the mouse heart and vasculature using micro-CT and whole-body perfusion of iodine or phosphotungstic acid. Contrast Media Mol. Imaging 2014, 9, 383–390. [Google Scholar] [CrossRef] [PubMed]
  27. Pai, V.M.; Kozlowski, M.; Donahue, D.; Miller, E.; Xiao, X.; Chen, M.Y.; Yu, Z.; Connelly, P.; Jeffries, K.; Wen, H. Coronary artery wall imaging in mice using osmium tetroxide and micro-computed tomography (micro-CT). J. Anat. 2012, 220, 514–524. [Google Scholar] [CrossRef] [PubMed]
  28. Dejea, H.; Garcia-Canadilla, P.; Cook, A.C.; Guasch, E.; Zamora, M.; Crispi, F.; Stampanoni, M.; Bijnens, B.; Bonnin, A. Comprehensive Analysis of Animal Models of Cardiovascular Disease using Multiscale X-Ray Phase Contrast Tomography. Sci. Rep. 2019, 9, 6996. [Google Scholar] [CrossRef]
  29. Reichardt, M.; Frohn, J.; Khan, A.; Alves, F.; Salditt, T. Multi-scale X-ray phase-contrast tomography of murine heart tissue. Biomed. Opt. Express 2020, 11, 2633–2651. [Google Scholar] [CrossRef]
  30. Sangaralingham, S.J.; Ritman, E.L.; McKie, P.M.; Ichiki, T.; Lerman, A.; Scott, C.G.; Martin, F.L.; Harders, G.E.; Burnett, J.C. Cardiac micro-computed tomography imaging of the aging coronary vasculature. Circ. Cardiovasc. Imaging 2012, 5, 518–524. [Google Scholar] [CrossRef]
  31. Vandoorne, K.; Vandsburger, M.H.; Raz, T.; Shalev, M.; Weisinger, K.; Biton, I.; Brumfeld, V.; Raanan, C.; Nevo, N. Chronic Akt1 deficiency attenuates adverse remodeling and enhances angiogenesis after myocardial infarction. Circ. Cardiovasc. Imaging 2013, 6, 992–1000. [Google Scholar] [CrossRef]
  32. Animals NRC (US). C for the update of the guide for the care and use of laboratory. In Guide for the Care and Use of Laboratory Animals; National Academies Press: Washington, DC, USA, 2011. [Google Scholar] [CrossRef]
  33. Ginsberg, A.P. Inorganic Syntheses; Wiley: Hoboken, NJ, USA, 2009; Volume 27. [Google Scholar]
  34. Kato, C.N.; Shinohara, A.; Hayashi, K.; Nomiya, K. Syntheses and X-ray crystal structures of zirconium(IV) and hafnium(IV) complexes containing monovacant wells-Dawson and Keggin polyoxotungstates. Inorg. Chem. 2006, 45, 8108–8119. [Google Scholar] [CrossRef] [PubMed]
  35. Dejea, H.; Bonnin, A.; Cook, A.C.; Garcia-Canadilla, P. Cardiac multi-scale investigation of the right and left ventricle ex vivo: A review. Cardiovasc. Diagn. Ther. 2020, 10, 1701–1717. [Google Scholar] [CrossRef] [PubMed]
  36. De Bournonville, S.; Vangrunderbeeck, S.; Ly, H.G.T.; Geeroms, C.; De Borggraeve, W.M.; Parac-Vogt, T.N.; Kerckhofs, G. Exploring polyoxometalates as non-destructive staining agents for contrast-enhanced microfocus computed tomography of biological tissues. Acta Biomater. 2020, 105, 253–262. [Google Scholar] [CrossRef] [PubMed]
  37. Kumar, A.; Accorsi, A.; Rhee, Y.; Girgenrath, M. Do’s and don’ts in the preparation of muscle cryosections for histological analysis. J. Vis. Exp. 2015, 2015, 52793. [Google Scholar] [CrossRef]
  38. Hira, V.V.V.; de Jong, A.L.; Ferro, K.; Khurshed, M.; Molenaar, R.J.; Van Noorden, C.J.F. Comparison of different methodologies and cryostat versus paraffin sections for chromogenic immunohistochemistry. Acta Histochem. 2019, 121, 125–134. [Google Scholar] [CrossRef] [PubMed]
  39. Vásquez-Rivera, A.; Oldenhof, H.; Dipresa, D.; Goecke, T.; Kouvaka, A.; Will, F.; Haverich, A.; Korossis, S.; Wolkers, W.F. Use of sucrose to diminish pore formation in freeze-dried heart valves. Sci. Rep. 2018, 8, 12982. [Google Scholar] [CrossRef] [PubMed]
  40. Zhou, H.; Li, J.; Guan, Y.; He, H.; Huang, F.L. Experimental study of different dehydration methods in the process of preparing frozen brain sections. Ibrain 2022, 11, 12075. [Google Scholar] [CrossRef]
  41. Ward, J.M.; Schofield, P.N.; Sundberg, J.P. Reproducibility of histopathological findings in experimental pathology of the mouse: A sorry tail. Lab. Anim. 2017, 46, 146–151. [Google Scholar] [CrossRef]
  42. Papparella, S.; Crescio, M.I.; Baldassarre, V.; Brunetti, B.; Burrai, G.P.; Cocumelli, C.; Grieco, V.; Maniscalco, L.; Mariotti, F. Reproducibility and Feasibility of Classification and National Guidelines for Histological Diagnosis of Canine Mammary Gland Tumours: A Multi-Institutional Ring Study. Vet. Sci. 2022, 9, 9070357. [Google Scholar] [CrossRef]
  43. Ehteshami Bejnordi, B.; Timofeeva, N.; Otte-Höller, I.; Karssemeijer, N.; van der Laak, J.A.W.M. Quantitative analysis of stain variability in histology slides and an algorithm for standardization. Med. Imaging 2014 Digit. Pathol. 2014, 9041, 904108. [Google Scholar] [CrossRef]
  44. Bejnordi, B.E.; Litjens, G.; Timofeeva, N.; Otte-Höller, I.; Homeyer, A.; Karssemeijer, N.; Van Der Laak, J.A. Stain specific standardization of whole-slide histopathological images. IEEE Trans. Med. Imaging 2016, 35, 404–415. [Google Scholar] [CrossRef] [PubMed]
  45. Lakin, B.A.; Patel, H.; Holland, C.; Freedman, J.D.; Shelofsky, J.S.; Snyder, B.D.; Stok, K.; Grinstaff, M.W. Contrast-enhanced CT using a cationic contrast agent enables non-destructive assessment of the biochemical and biomechanical properties of mouse tibial plateau cartilage. J. Orthop. Res. 2016, 34, 1130–1138. [Google Scholar] [CrossRef] [PubMed]
  46. Risser, G.E.; Machour, M.; Hernaez-Estrada, B.; Li, D.; Levenberg, S.; Spiller, K.L. Effects of Interleukin-4 (IL-4)-releasing microparticles and adoptive transfer of macrophages on immunomodulation and angiogenesis. Biomaterials 2023, 296, 122095. [Google Scholar] [CrossRef] [PubMed]
  47. Aminu, A.J.; Chen, W.; Yin, Z.; Kuniewicz, M.; Walocha, J.; Perde, F.; Molennar, P.; Iaizzo, P.A.; Atkinson, A. Novel micro-computed tomography contrast agents to visualise the human cardiac conduction system and surrounding structures in hearts from normal, aged, and obese individuals: Iodine and graphene oxide—Visualising human conduction system in normal, aged. Transl. Res. Anat. 2022, 27, 100175. [Google Scholar] [CrossRef]
  48. Planinc, I.; Garcia-Canadilla, P.; Dejea, H.; Ilic, I.; Guasch, E.; Zamora, M.; Crispi, F.; Milicic, D.; Bijnens, B. Comprehensive assessment of myocardial remodeling in ischemic heart disease by synchrotron propagation based X-ray phase contrast imaging. Sci. Rep. 2021, 11, 14020. [Google Scholar] [CrossRef] [PubMed]
  49. Kolesová, H.; Bartoš, M.; Hsieh, W.C.; Olejníčková, V.; Sedmera, D. Novel approaches to study coronary vasculature development in mice. Dev. Dyn. 2018, 247, 1018–1027. [Google Scholar] [CrossRef] [PubMed]
  50. Bumgarner, J.R.; Nelson, R.J. Open-source analysis and visualization of segmented vasculature datasets with VesselVio. Cell Rep. Methods 2022, 2, 100189. [Google Scholar] [CrossRef] [PubMed]
  51. Hinton, R.B.; Alfieri, C.M.; Witt, S.A.; Glascock, B.J.; Khoury, P.R.; Benson, D.W.; Yutzey, K.E. Mouse heart valve structure and function: Echocardiographic and morphometric analyses from the fetus through the aged adult. Am. J. Physiol. Heart Circ. Physiol. 2008, 294, 2480–2488. [Google Scholar] [CrossRef]
  52. He, S.; Nian, F.; Chen, W.; Yin, L.; Auchoybur, M.L.; Tao, Z.; Tang, S.; Chen, X. I-κB kinase-ε knockout protects against angiotensin II induced aortic valve thickening in apolipoprotein E deficient mice. Biomed. Pharmacother. 2019, 109, 1287–1295. [Google Scholar] [CrossRef]
  53. Delwarde, C.; Toquet, C.; Aumond, P.; Kayvanjoo, A.H.; Foucal, A.; Le Vely, B.; Baudic, M.; Lauzier, B.; Blandin, S. Multimodality imaging and transcriptomics to phenotype mitral valve dystrophy in a unique knock-in Filamin—A rat model. Cardiovasc. Res. 2023, 119, 759–771. [Google Scholar] [CrossRef]
  54. Hinton, R.B.; Yutzey, K.E. Heart valve structure and function in development and disease. Annu. Rev. Physiol. 2011, 73, 29–46. [Google Scholar] [CrossRef] [PubMed]
  55. Webb, R.H.; Culliford-Semmens, N.; Sidhu, K.; Wilson, N.J. Normal echocardiographic mitral and aortic valve thickness in children. Heart Asia 2017, 9, 70–75. [Google Scholar] [CrossRef] [PubMed]
  56. Miller, J.D.; Weiss, R.M.; Serrano, K.M.; Brooks, R.M.; Berry, C.J.; Zimmerman, K.; Young, S.; Heistad, D. Lowering plasma cholesterol levels halts progression of aortic valve disease in mice. Circulation 2009, 119, 2693–2701. [Google Scholar] [CrossRef] [PubMed]
  57. Sider, K.L.; Blaser, M.C.; Simmons, C.A. Animal Models of Calcific Aortic Valve Disease. Int. J. Inflam. 2011, 2011, 364310. [Google Scholar] [CrossRef] [PubMed]
  58. Ott, C.; Pappritz, K.; Hegemann, N.; John, C.; Jeuthe, S.; McAlpine, C.S.; Iwamoto, Y.; Lauryn, J.H.; Klages, J.; Klopfleisch, R.; et al. Spontaneous degenerative aortic valve disease in New Zealand obese mice. J. Am. Heart Assoc. 2021, 10, e023131. [Google Scholar] [CrossRef] [PubMed]
  59. Roostalu, U.; Thisted, L.; Skytte, J.L.; Salinas, C.G.; Pedersen, P.J.; Hecksher-Sørensen, J.; Rolin, B.; Hansen, H.; MacKrell, J.G.; Christie, R.; et al. Effect of captopril on post-infarction remodelling visualized by light sheet microscopy and echocardiography. Sci. Rep. 2021, 11, 5241. [Google Scholar] [CrossRef] [PubMed]
  60. Tao, S.; He, C.; Hao, X.; Kuang, C.; Liu, X. Principles of Different X-ray Phase-Contrast Imaging: A Review. Appl. Sci. 2021, 11, 2971. [Google Scholar] [CrossRef]
  61. Meloni, A.; Frijia, F.; Panetta, D.; Degiorgi, G.; De Gori, C.; Maffei, E.; Clemente, A.; Positano, V. Photon-Counting Computed Tomography (PCCT): Technical Background and Cardio-Vascular Applications. Diagnostics 2023, 13, 645. [Google Scholar] [CrossRef]
  62. Moon, A. Mouse Models of Congenital Cardiovascular Disease. Curr. Top. Dev. Biol. 2008, 84, 171–248. [Google Scholar] [CrossRef]
  63. Liao, J.; Huang, W.; Liu, G. Animal models of coronary heart disease. J. Biomed. Res. 2017, 31, 3–10. [Google Scholar] [CrossRef]
Figure 1. Effect of each sample preparation step on the volume of the murine heart. (AD) microCT orthoslices of a murine heart imaged at four consecutive stages: at the introduction to the staining solution (T0) (A); after complete staining at room temperature (CECT) (B); after freezing in cooled isopentane and preservation in the cryo-stage (cryo-CECT) (C); and after paraffin embedding (PE) (D). (E) Overlaid 3D renderings of the completely stained murine heart imaged with CECT (red) and after paraffin embedding (gray). (F) Volume quantification of the murine hearts at each sample preparation step (n = 3). **: p-value < 0.01. Scale bars = 1 mm.
Hearts 05 00002 g001
Figure 2. Comparison of two imaging protocols (CECT and cryo-CECT), two imaging qualities (low-resolution fast scan mode and high-resolution normal multiscan mode) and classical 2D histology. (AL) 2D orthoslices of the entire heart (left), the mitral and aortic valves (center) and the coronary blood vessels in the myocardium (right) from the CECT (AC) and cryo-CECT (GI) datasets acquired with low-resolution fast scan mode, respectively, and high-resolution normal multiscan mode (DF) and (JL), respectively. (MO) Classical 2D histology sections of the same heart with hematoxylin and eosin staining. The blue and red arrows indicate the aortic and mitral valves, respectively. The green arrows indicate the large coronary blood vessels in the myocardium.
Hearts 05 00002 g002
Figure 3. Visualization and segmentation of the coronary blood vessel network. (A) Zoom of CECT orthoslices obtained with the high-resolution normal multiscan mode of the murine myocardium before (left) and after (right) blood vessel segmentation, demonstrating the distinction of an artery (*) and a vein (◊) and the distinction of filled with blood (□) and empty (⌧). Segmented blood vessels are shown in green. (BD) Three-dimensional rendering of the main blood vessel network segmented in the murine heart (B), of the arterial (red) and venous (dark blue) branches in the left ventricular wall (C) and of the segmented right coronary artery (RCA, light blue) and the left main coronary artery (LMCA, purple) (D). (EH) Different 2D orthoslices of the murine heart at the level of the aorta. The main coronary branches are identified as well as some anatomical landmarks. Ao: aorta, RA: right atrium, RAA: right atrial appendage, RCA: right coronary artery, RmA: right marginal artery, TV: tricuspid valve, RV: right ventricle, LAA: left atrial appendage, LMCA: left main coronary artery, AL-MV: anterior leaflet of the mitral valve, LCx: left circumflex artery, LAD: left anterior descending artery.
Hearts 05 00002 g003
Figure 4. Visualization and thickness assessment of the mitral and aortic valves using CECT. (AC) Three-dimensional renderings of the murine heart (in gray) with a longitudinal view showing the mitral and the aortic valves in red (A); a longitudinal view of the mitral valve segmented into the anterior (orange) and posterior (blue) leaflets (B); and a top view showing the aortic valve segmented into the right coronary cusp (RCC, purple), left coronary cusp (LCC, green) and noncoronary cusp (NCC, red) (C). (DI) I thickness distribution of each leaflet of the mitral valve and each cusp of the aortic valve, computed in 3D. Two-dimensional orthoslices of the results (D,G). Bar graphs comparing the mean thickness of each leaflet in three hearts (E) and each cusp in two hearts (H). Average histograms of the thickness distribution for the two leaflets in three hearts (F) and the three cusps in two hearts (I). On the 2D orthoslices, the thickness is represented by the color scale bars, and on the average histograms, the error bars correspond to the standard deviation.
Hearts 05 00002 g004
Table 1. MicroCT acquisition and reconstruction parameters. Blue columns correspond to low-resolution fast scan mode and green columns to high-resolution normal multiscan mode.
Acquisition ParametersAt Staining
Starting Point
CECTCryo-CECTAfter Paraffin Embedding
Experimental ConditionsIn Hf-WD
1:2 POM Solution
In PBSFrozen in Isopentane at −80 °CIn Paraffin
Voxel size (µm)4.54.52.44.52.34.5
Source voltage (kV)909070907090
Tube current (µA)210210140210135210
Exposure time (ms)500500500500500500
Tube focus mode000000
Number of images120018002400180024001800
Average113131
Skip001010
Scanning modeFast scan modeFast scan modeNormal multiscanFast scan modeNormal multiscanFast scan mode
Acquisition duration (min)10152461524615
Beam hardening correction977777
Table 2. Summary of the 3D visualization and structural analysis of the heart constituents enabled by CECT and cryo-CECT for different image qualities.
Low-Resolution Fast Scan Mode CECTHigh-Resolution Normal Multiscan Mode CECTLow-Resolution Fast Scan Mode Cryo-CECTHigh-Resolution Normal Multiscan Mode Cryo-CECT
Total heart volume quantification++++
3D visualization of the heart chambers ++
Volume measurements of the heart chambers
3D visualization of the blood vessels+-++−
Segmentation of the blood vessels+
3D visualization of the heart valves++
3D structural analysis of the heart valves+−+
3D visualization the muscle fibers+−+
3D structural analysis of the muscle fibers+
Disclaimer/Publisher’s Note: The statements, opinions and data contained in all publications are solely those of the individual author(s) and contributor(s) and not of MDPI and/or the editor(s). MDPI and/or the editor(s) disclaim responsibility for any injury to people or property resulting from any ideas, methods, instructions or products referred to in the content.

