Article

Platinum Deposited Nitrogen-Doped Vertically Aligned Carbon Nanofibers as Methanol Tolerant Catalyst for Oxygen Reduction Reaction with Improved Durability †

1
Department of Chemistry, Kansas State University, Manhattan, KS 66506, USA
2
Tim Taylor Department of Chemical Engineering, Kansas State University, Manhattan, KS 66506, USA
*
Author to whom correspondence should be addressed.
This work is part of the Ph.D. thesis: Elangovan, A. Novel three-dimensional nanostructured carbon materials as electrocatalyst support in low-temperature fuel cells. KANSAS STATE UNIVERSITY, Manhattan, Kansas, U.S.A, 2020.
Appl. Nano 2021, 2(4), 303-318; https://doi.org/10.3390/applnano2040022
Submission received: 10 August 2021 / Revised: 22 September 2021 / Accepted: 11 October 2021 / Published: 17 October 2021
(This article belongs to the Collection Feature Papers for Applied Nano)

Abstract

:
Nitrogen doping in carbon materials can modify the employed carbon material’s electronic and structural properties, which helps in creating a stronger metal-support interaction. In this study, the role of nitrogen doping in improving the durability of Pt catalysts supported on a three-dimensional vertically aligned carbon nanofiber (VACNF) array towards oxygen reduction reaction (ORR) was explored. The nitrogen moieties present in the N-VACNF enhanced the metal-support interaction and contributed to a reduction in the Pt particle size from 3.1 nm to 2.3 nm. The Pt/N-VACNF catalyst showed better durability when compared to Pt/VACNF and Pt/C catalysts with similar Pt loading. DFT calculations validated the increase in the durability of the Pt NPs with an increase in pyridinic N and corroborated the molecular ORR pathway for Pt/N-VACNF. Moreover, the Pt/N-VACNF catalyst was found to have excellent tolerance towards methanol crossover.

1. Introduction

Platinum (Pt) nanoparticles (NPs) supported on amorphous carbon (Pt/C) are currently considered to be an effective catalyst for oxygen reduction reaction (ORR) with sluggish reaction kinetics. Besides the high cost and limited availability, Pt-based catalysts suffer from long-term durability issues, which creates a technical barrier for the commercialization of fuel cells [1]. The performance of Pt/C deteriorates in long-term operations due to the agglomeration or dissolution of Pt NPs [2]. Another factor that affects long-term performance is the oxidation of the underlying carbon support, i.e., carbon corrosion [3]. Fuel cells, during startup/shutdown, can experience an increase in the overall cell voltage (to 1.2–1.5 V) to counter-effect the hydrogen starvation, which can increase the potential of the cathode reaction [4,5]. At very high cathode potentials, the carbon starts to degrade and the corrosion rate increases drastically with the potential [6]. In addition, Pt on the surface can further catalyze the oxidation of carbon and thereby increasing the agglomeration or dissolution of Pt NPs [7]. To address these issues, various reports have recommended reducing the Pt loading or replacing it completely with non-noble metal catalysts. However, when the Pt loading is reduced, it is very challenging to maintain the catalytic activity and durability.
Different approaches, such as introducing strain and electronic effects by alloying with other noble/transition metals [7,8,9], designing various forms of Pt catalysts [10,11,12,13,14], developing new methods for catalyst synthesis [15], using other support materials such as TiO2 [16,17], IrO2 [18,19], SnO2 [20], SiC [21,22], W2C [23], etc., and incorporating heteroatom-doping in carbon materials [24,25,26], have been explored to solve the durability issue associated with Pt catalysts. However, among these methods, nitrogen-doped (N-doped) carbon nanomaterials, such as carbon nanotubes [27], carbon nanofibers [28,29], carbon nanocages [30], graphene [31], graphene paper [32], reduced graphene oxide [33], porous carbon [34], and ordered mesoporous carbon [35], as the catalyst support, have been considered to be a better choice for improving the catalysts’ durability. The nitrogen species in carbon materials have been found to alter the electronic and structural properties of the employed carbon material and create a stronger metal-support interaction, thereby enhancing the catalytic activity and improving the durability with reduced Pt loading [36,37,38]. Nitrogen doping can be achieved using in-situ or ex-situ methods, resulting in nitrogen doping with different N-functionalities [24]. Previous reports have suggested that among different N-functionalities, pyridinic N increases the available ORR active sites and contributes to improved ORR activity and catalyst stability [32,33,39]. In particular, Guo et al. [39] proposed, based on their study using well-defined model catalysts, that essentially all ORR catalytic activity by N-doping is generated by pyridinic N at the graphitic edges, i.e., the microgrooves cut in the highly oriented pyrolytic graphite (HOPG). Here we explore more practical catalyst supports, i.e., vertically aligned carbon nanofibers (VACNFs) with a unique conically stacked graphitic microstructure [37,38], which present similar well-defined graphitic edges at the sidewall surface that can be treated with NH3 plasma to create controlled pyridinic N-doping. To our knowledge, there has been no report on controlled N-doping on the VACNF sidewall for ORR catalysis. Furthermore, N-doped VACNFs were evaluated as a support structure for Pt catalysts to improve the durability and tolerance to methanol crossover.
In this work, we explored an N-doped three-dimensional VACNF array as the catalyst support for ORR. The graphitic VACNF array was first in-situ doped with N atoms during the growth process using a DC-biased plasma-enhanced chemical vapor deposition (PECVD) system and was then followed by further post-growth surface doping with combined thermal annealing (TA) and plasma annealing (PA). We have previously conducted a series of studies to illustrate the role of VACNFs as the catalyst support for ORR in alkaline conditions [37]. The resulting Pt/VACNF catalysts exhibited considerable durability and higher tolerance to methanol crossover when compared to commercial Pt/C catalysts. Herein, we further explored the role of additional nitrogen introduced into the VACNF structures and its influence on catalyst activity, durability, and methanol tolerance in alkaline conditions. Initially, the VACNF arrays were prepared using PECVD with an average diameter between 50 and 250 nm and an average length of ~5 µm. Nitrogen was introduced into the VACNF arrays using ammonia (NH3) plasma annealing at 550 °C for different time intervals. After plasma annealing, the surface morphology of the resulting N-VACNF was modified. The HRTEM imaging and EDX mapping verified that the plasma annealing created NiO NPs as the secondary nanostructures on the catalyst surface. The change in the nature of the carbon surface was characterized using Raman analysis. The at% of nitrogen increased with plasma annealing time and the increase in nitrogen content altered the electronic structure of the VACNF support. Evidently, when the N-VACNF was sputtered with Pt, the nitrogen atoms present in the support caused a decrease in the Pt particle size, modifying the Pt binding energy, and improving the interaction between Pt NPs and the VACNF support. In addition, nitrogen doping lead to a partial electron transfer between the carbon support and the Pt NPs, as verified by XPS analysis. As a result, the created Pt/N-VACNF had better durability compared to the counterpart Pt/C catalyst with similar loading, even with smaller particle size. Density functional theory (DFT) calculations validated the increase in the stability of Pt NPs with an increase in pyridinic N and confirmed the molecular ORR pathway for Pt/N-VACNF. Moreover, the resulting Pt/N-VACNF catalyst was also found to have a better tolerance towards methanol crossover and was highly selective towards ORR in the solution containing both methanol and O2.

2. Materials and Methods

2.1. Materials

Graphite papers (0.2 mm thick) were purchased from Toyo Tanso USA, Inc. (Troutdale, OR, USA). The Pt target was purchased from Kurt J. Lesker Company (Jefferson Hills, PA, USA). The commercial Pt/C catalyst (20 wt.% Pt on HiSPEC® 3000) was purchased from Alfa Aesar (Tewksbury, MA, USA). The 5 wt.% Nafion® solution was purchased from Sigma-Aldrich (St. Louis, MO, USA). Potassium hydroxide (KOH) of ACS grade was purchased from Fisher Scientific (Hampton, NH, USA). All aqueous solutions were prepared using ultrapure water (18.2 MΩ·cm at 25 °C) from a Millipore water system (EASYPURE II) purchased from Thermo Scientific (Waltham, MA, USA).

2.2. Growth of VACNF

Graphite paper of 1 × 1 inch was sputter-coated with a 22 nm (nominal thickness) nickel thin film at a constant deposition rate of 0.7 Å/s using a high-resolution ion beam coater (Model 681, Gatan Inc., Pleasanton, CA, USA). VACNFs were grown on the graphite paper using DC-biased PECVD (Black Magic, AIXTRON, Santa Clara, CA, USA) by following the previously reported procedure [37,40,41]. The graphite paper substrate with Ni coating was heated to 500 °C in 250 sccm NH3 at a pressure of 3.9 Torr for 150 s and this was then followed by a 40 W DC plasma treatment for 60 s. The combined effects of the thermal dewetting and NH3 plasma etching helped to break down the 22 nm Ni film into randomly distributed Ni NPs that catalyzed the growth of VACNFs in a tip growth mode. These Ni NPs determine the individual fiber diameter and areal density of the VACNF array. After pretreatment, the surface temperature was increased to 750 °C and a mixture of NH3 (250 sccm) and acetylene (63 sccm) was introduced as the precursors at a pressure of 4.6 Torr. The plasma power was kept at 45 W for 30 min to obtain VACNFs with an average length of 5 µm. The N-VACNFs were prepared by exposing the pristine VACNFs in NH3 (400 sccm) plasma for 5 min, 15 min, and 30 min at temperatures between 550–650 °C without interrupting the vacuum.

2.3. Preparation of Pt/N-VACNF

Among different N-VACNF samples, the 5 min plasma annealed sample at 550 °C (N-VACNF PA 5 min) was used as the support for the Pt catalyst. Pt was deposited on the N-VACNFs from a Pt target of 99.99% purity using the high-resolution ion beam coater (Model 681, Gatan Inc., Pleasanton, CA, USA) under a pressure of 1.5 × 10⁻⁴ Torr. The sample stage was inclined at an angle of 5° and rotated at a constant speed of 15 rpm to ensure uniform deposition of Pt along the fibers. The deposition was maintained at a steady rate of 0.5 Å/s and was precisely controlled to a nominal thickness of 20 nm using an in-situ quartz crystal microbalance with less than 5% error to achieve the desired Pt mass loading. The Pt/N-VACNF with a nominal thickness of 20 nm had a Pt loading of 43.0 µg/cm2 (denoted as 43.0 Pt/N-VACNF) and an overall Pt wt.% of 19.8%.

2.4. Materials Characterization

The surface topography of the N-VACNF catalysts was obtained using a DS 130F field-emission scanning electron microscope (FESEM) (Topcon, Tokyo, Japan). The microstructure of the N-VACNF and Pt/N-VACNF was analyzed using a CM 100 transmission electron microscope (TEM) (FEI, Hillsboro, OR, USA), operated at 100 kV, and a Tecnai F20 XT high-resolution transmission electron microscope (HRTEM) (FEI, Hillsboro, OR, USA), operated at 200 kV. Elemental mapping and analysis were obtained using energy-dispersive X-ray spectroscopy (EDS) in the Tecnai Osiris scanning/transmission electron microscope (S/TEM) (FEI, Hillsboro, OR, USA), operated at 200 kV, and a Tecnai F20 XT field-emission scanning/transmission electron microscope (S/TEM) (FEI, Hillsboro, OR, USA), operated at 200 kV. Raman spectra were obtained using a DXR Raman microscope (Thermo Scientific, Waltham, MA, USA) at an excitation laser wavelength of 532 nm. Surface composition and chemical environments of the catalysts were obtained using a K-Alpha X-ray photoelectron spectrometer system (Thermo Scientific, Waltham, MA, USA) with a monochromated Al Kα source (1486.7 eV). All the XPS spectra were obtained using a 400 µm spot size. Survey spectra were recorded using a pass energy of 200.0 eV, a step size of 1.00 eV, and a dwell time of 10 ms. The high-resolution spectra were recorded using a pass energy of 50.0 eV, a step size of 0.10 eV, and a dwell time of 50 ms. The high-resolution XPS spectra were deconvoluted using OriginPro (OriginLab Corporation, Northampton, MA, USA) and the peak fitting was done using Gaussian-Lorentzian curves and a Shirley background subtraction.

2.5. Electrochemical Characterization

The electrochemical properties and the catalytic activity towards the ORR were evaluated in a three-electrode setup using a CHI 760D electrochemical workstation (CH Instruments, Austin, TX, USA) and a rotating ring disk electrode controller (RRDE-3A, ALS Co., Ltd., Tokyo, Japan). The commercial Pt/C catalyst was studied under the same conditions to make a fair comparison. A coiled Pt wire (0.55 mm in diameter and 23 cm long) and a mercury-mercuric oxide (Hg/HgO) electrode (0.198 V vs. RHE) with 1.0 M NaOH filling solution was used as the counter and reference electrode, respectively. The working electrodes were prepared by punching out a 6.0 mm diameter disk from the as-grown N-VACNF and Pt/N-VACNF catalysts, pasting it on the RDE using a conductive silver paste, and drying at 70 °C for 2 h. For Pt/C, the working electrode was prepared by drop-casting 5.0 µL of the catalyst ink on a glassy-carbon RDE (3.15 mm diameter) and drying at ambient temperature to get a uniform thin film. The catalyst ink was prepared by dispersing 10.0 mg of the catalyst in a 2.5 mL mixture of water, isopropanol, and 5 wt.% Nafion followed by sonication for 1 h. The Pt loading for Pt/C was estimated to be 51.2 µg/cm2 and denoted as 51.2 Pt/C. The electrolyte for most of the studies was 0.10 M KOH solution saturated with Ar or O2.
Cyclic voltammetry (CV) was conducted between 0.30 V and −0.90 V (vs. Hg/HgO) at a scan rate of 50 mV/s. The RDE polarization curves were obtained using the linear sweep voltammetry (LSV) technique in a potential range of 0.20 V to −0.70 V (vs. Hg/HgO) at different rotation speeds, from 500 to 3000 rpm, and at a scan rate of 10 mV/s. All the potentials in this work were converted to a reversible hydrogen electrode (RHE), E(RHE) = E(Hg/HgO) + 0.198 V + 0.059 × pH. The limiting current density (Jlim) and the half-wave potential (E1/2) were obtained as described in our previous report [37]. The durability of both Pt/N-VACNF and Pt/C was evaluated by performing an accelerated stress test (AST) between 0.293 V and −0.307 V (vs. Hg/HgO), i.e., between 1.20 V and 0.60 V versus RHE, for 5000 cycles with a scan rate of 100 mV/s in O2-saturated 0.10 M KOH solution. CV curves and LSV curves at a rotation speed of 1600 rpm were collected after every 1000 AST cycles to understand the catalyst degradation. The methanol tolerance ability was evaluated by performing amperometric measurements and record j-t curves at −0.1 V (vs. Hg/HgO), while adding 3.0 M methanol into 0.10 M KOH in 20 steps at 0.2 mL/step followed by 8 steps at 2.0 mL/step.

2.6. Density Functional Simulation

Spin-polarized density functional theory (DFT) simulations were carried out using the Vienna Ab initio Simulation Package (VASP) [42]. The Generalized Gradient Approximation (GGA) Perdew–Burke–Ernzerhof (PBE) functional was used to account for the Kohn–Sham electron exchange correlation interactions [43]. The projector augmented wave (PAW) [44] method was used to represent the ionic cores. The cut-off energy for the plane-wave basis set expansion was 400 eV for all calculations. The break condition for the self-consistent iteration was set to be 1 × 10⁻⁶ eV. Ionic relaxation was stopped when the forces were smaller than 0.05 eV/Å. Monkhosrst–Pack [45] k-point of 1 × 4 × 1 was used. Moreover, Grimme’s DFT-D3 [46] method was used to account for long-range dispersion forces.
The adsorption energies of reaction intermediates were calculated using µ H 2 O and as reference states, as suggested by previous studies [47,48,49]. The reaction energies of each elementary step were calculated based on Equation (1), where Δ E represents the total energy change, Δ Z P E and T Δ S represent the zero-point energy and entropy changes, which were calculated using statistical mechanics. Δ G U represents the energy contribution from the applied potential, −ne U where n is the number of electrons transferred in each elementary step, and U is the applied potential. Therefore, the limiting potential ( U l i m ) can be calculated using Equation (2), which is defined as the highest applied potential that can keep the reaction exothermic [49,50]. U l i m was employed as one of the key metrics to evaluate the performance of ORR catalysts [37,48,50,51].
Δ G = Δ E + Δ Z P E T Δ S + Δ G U
U l i m = m a x [ Δ G 3 , Δ G 4 , Δ G 5 , Δ G 6 , Δ G 7 ] n e .

3. Results and Discussion

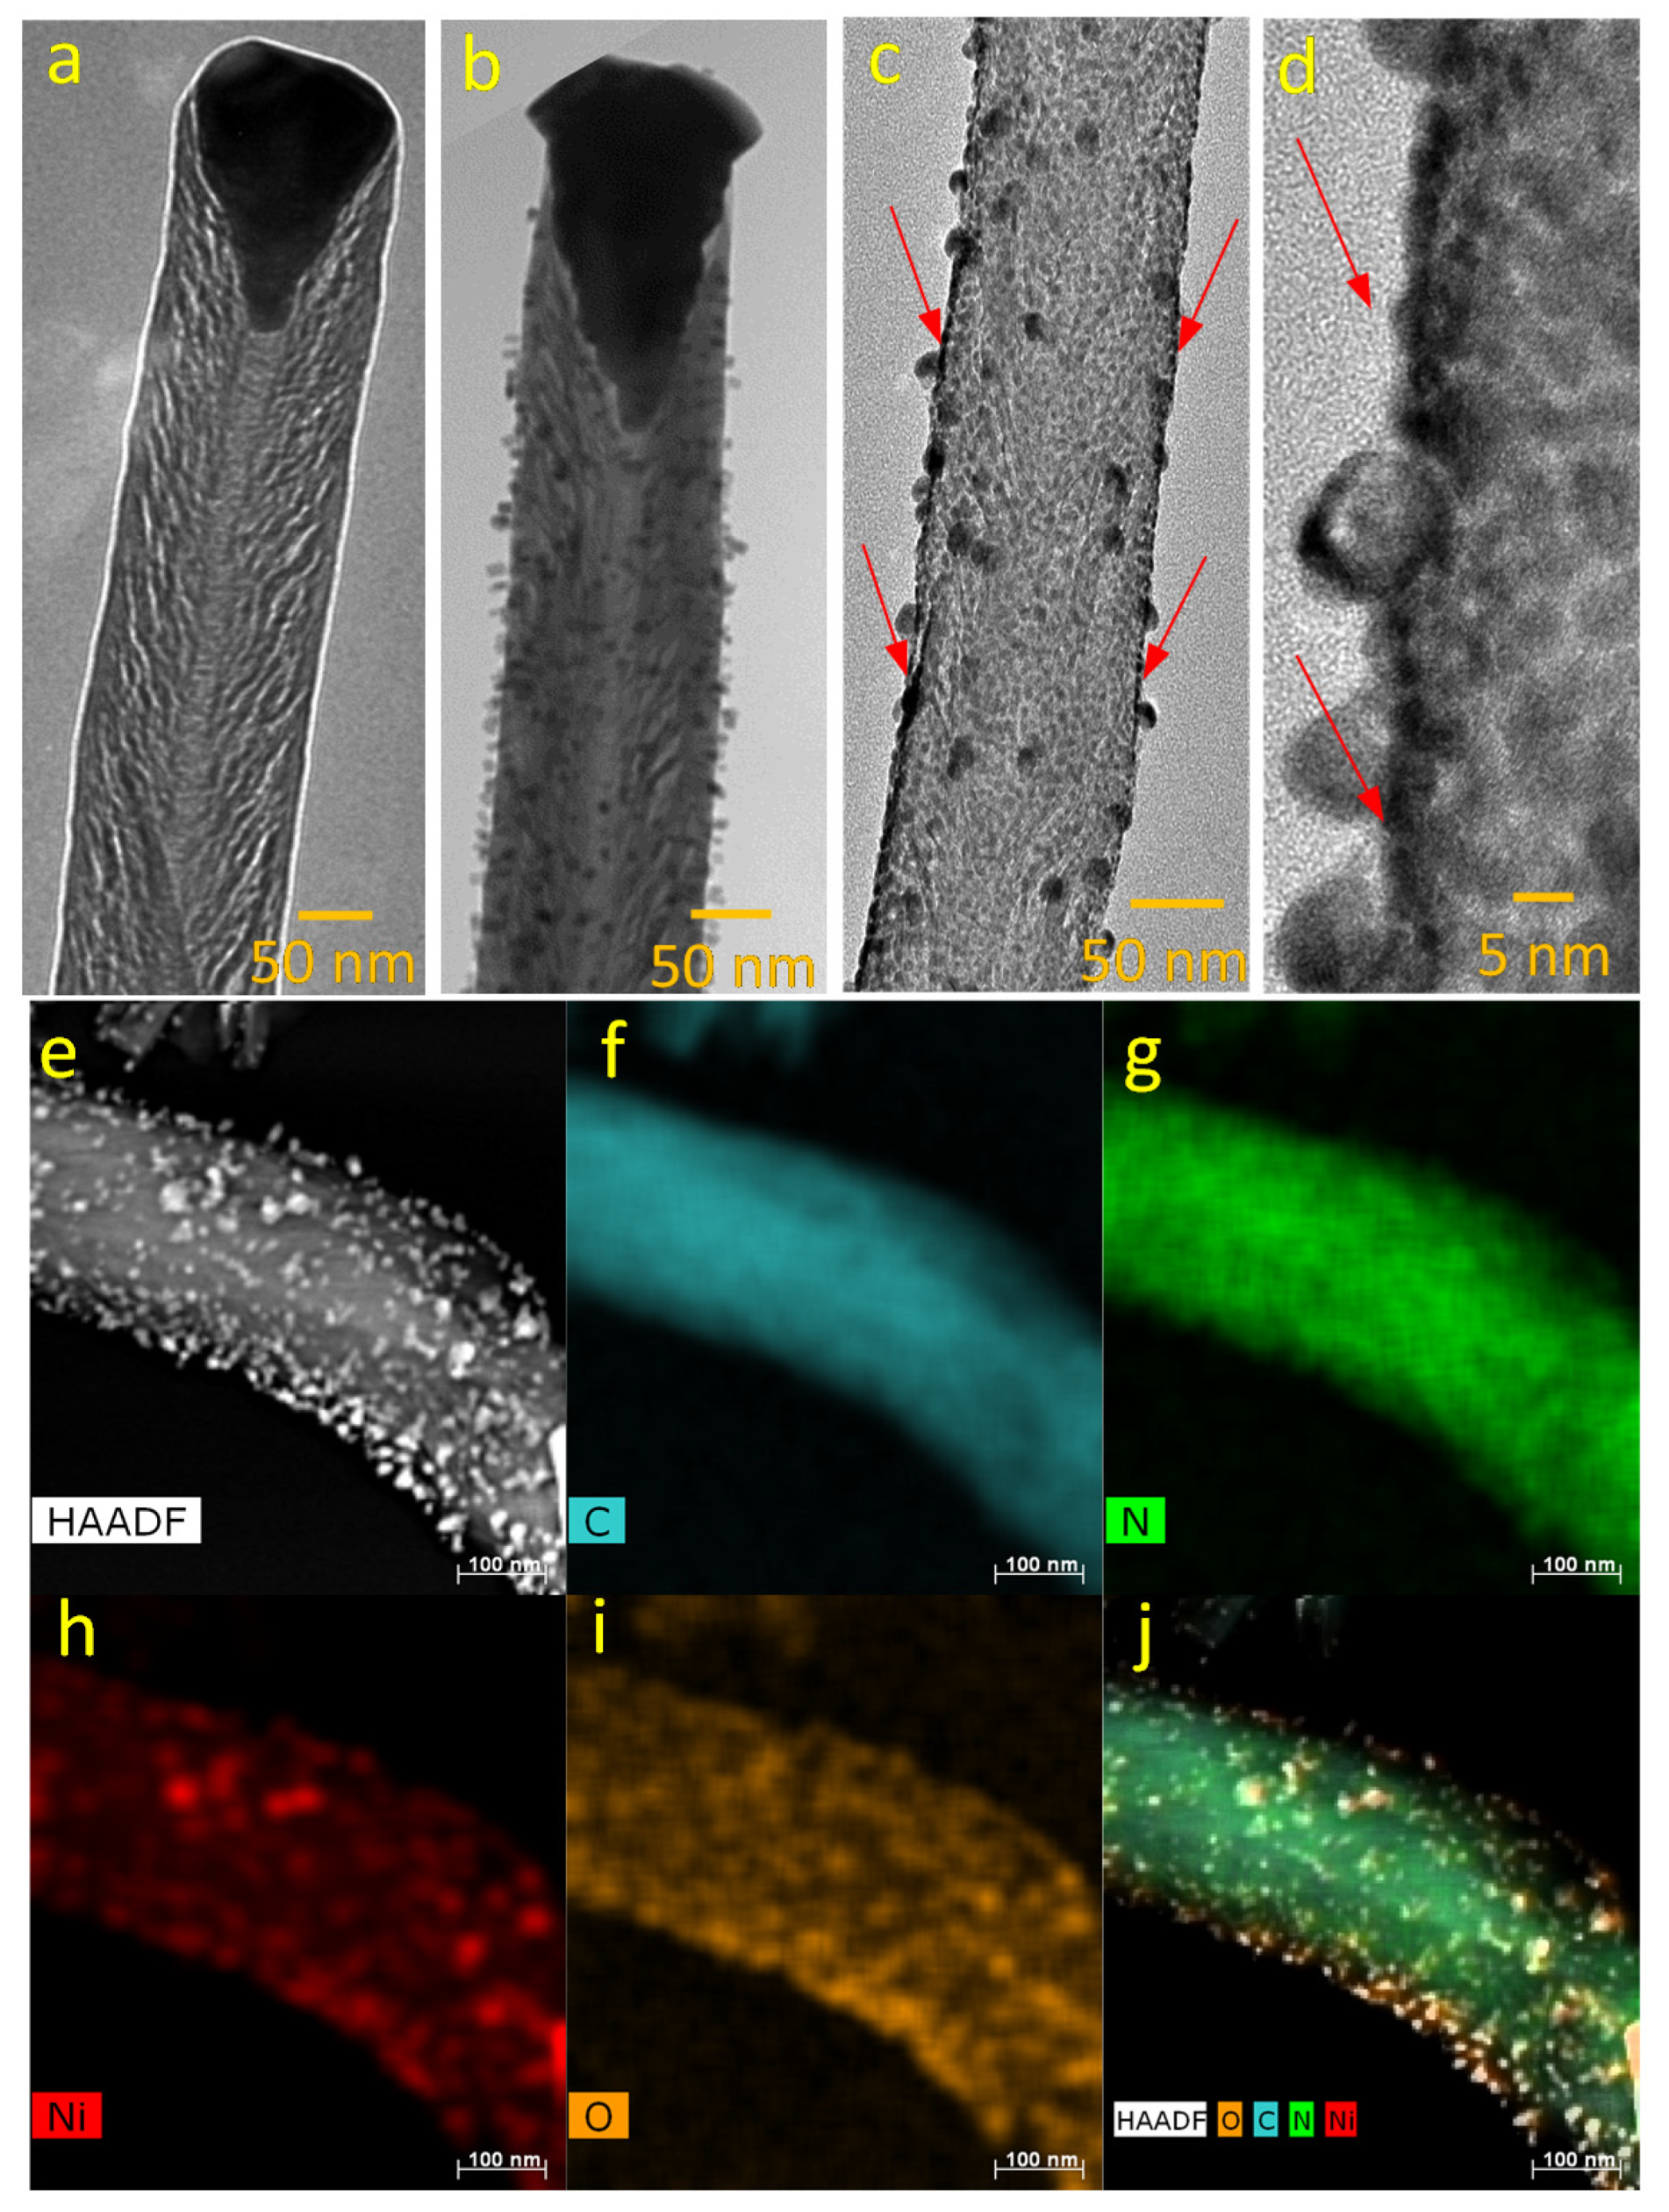
3.1. Structural Characterization
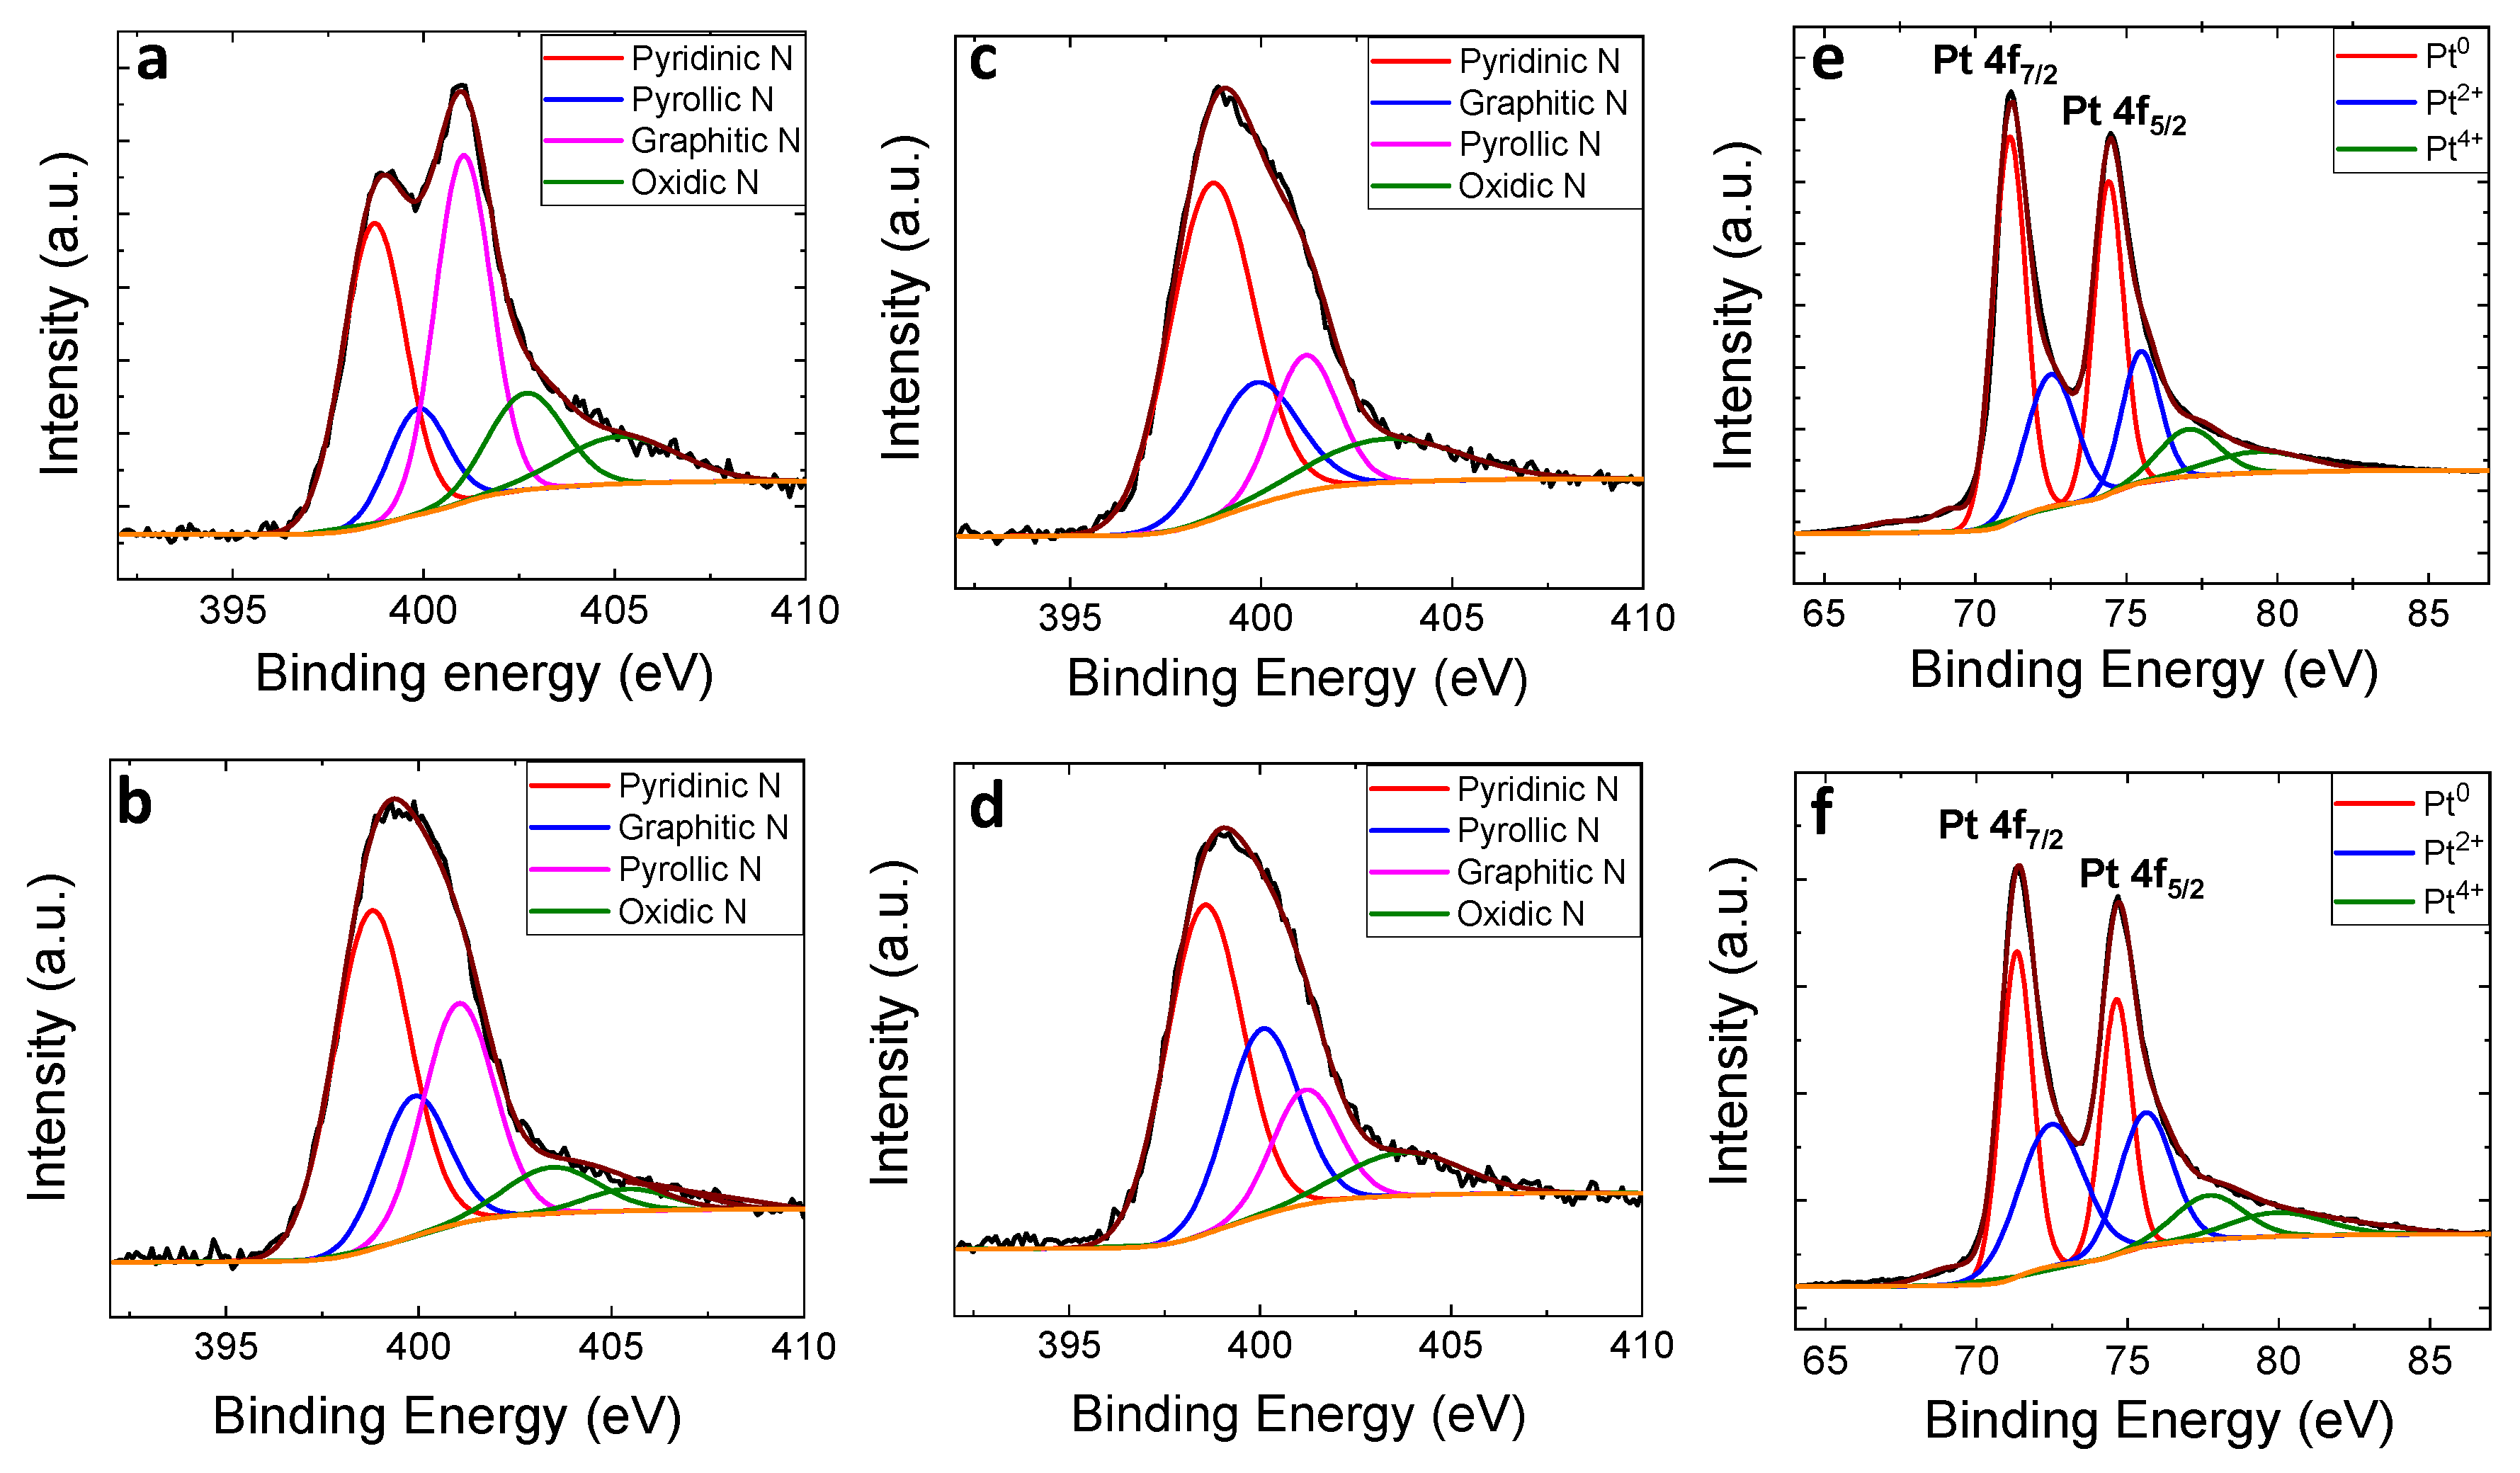
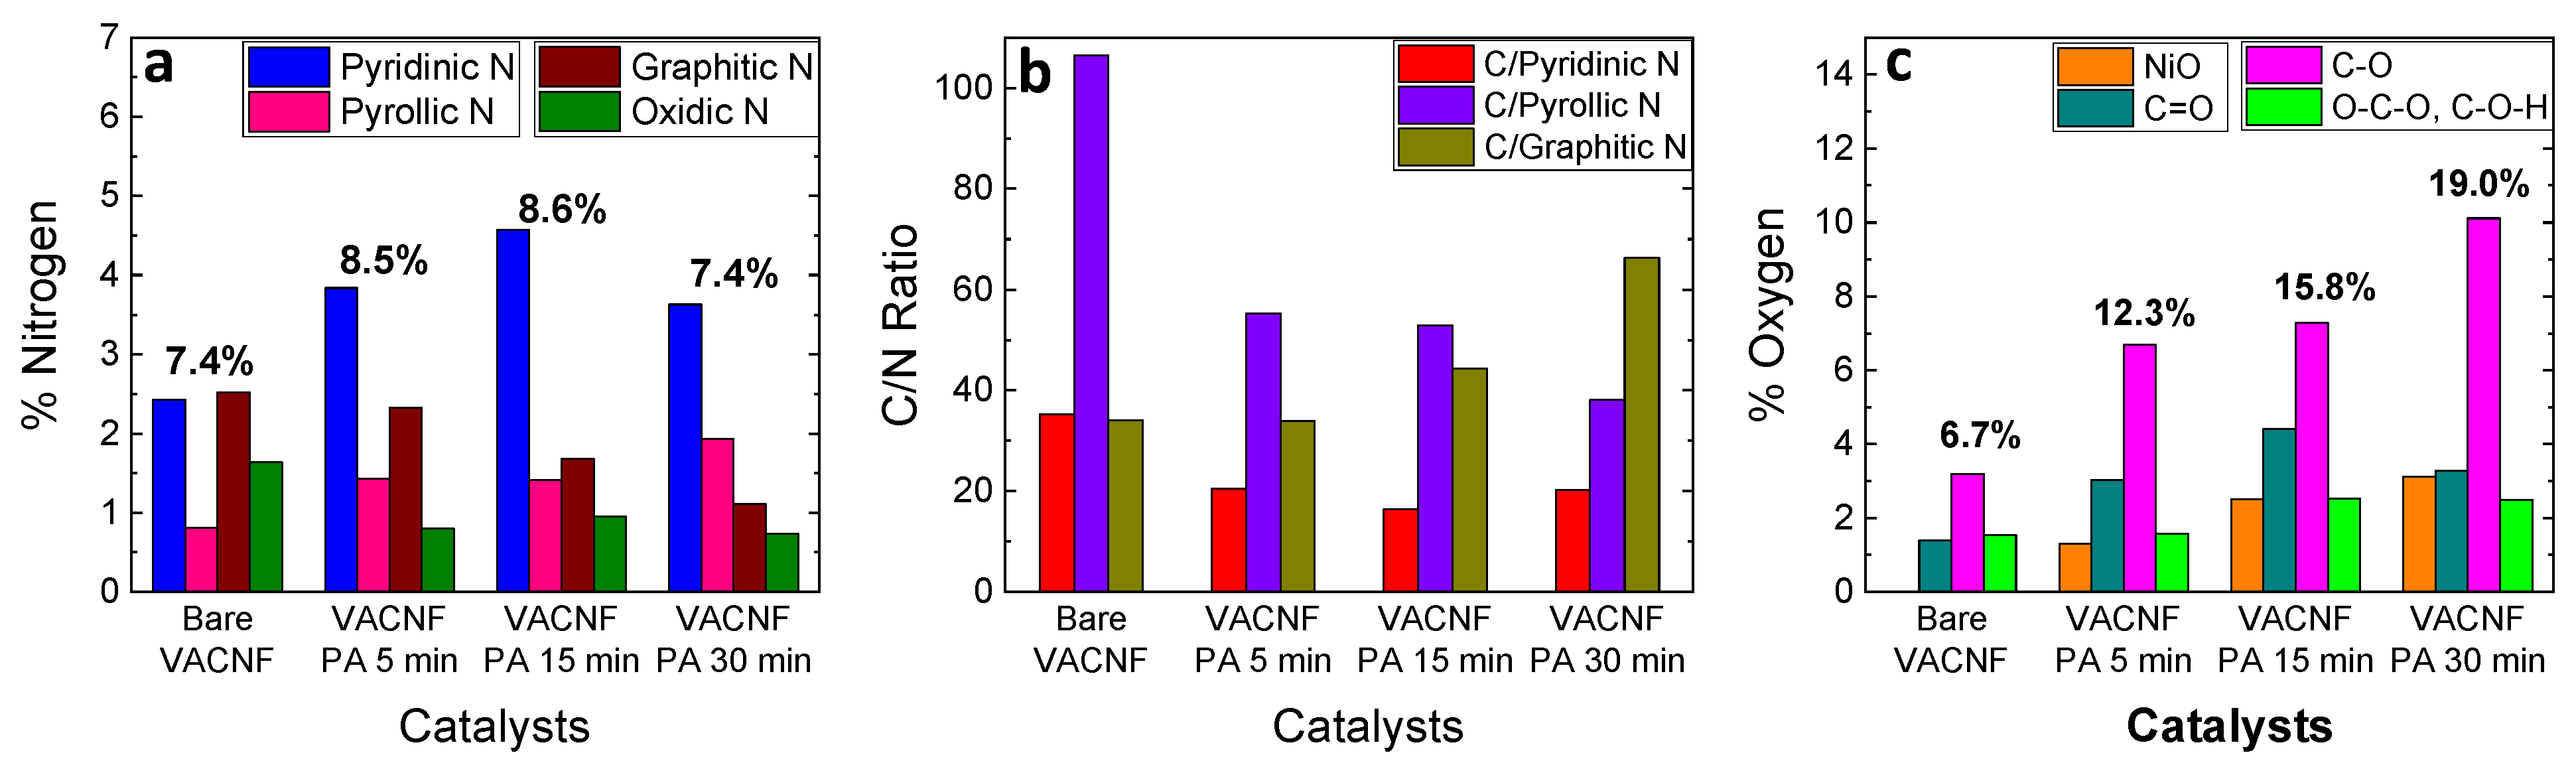
The morphology change in N-VACNF due to plasma annealing can be identified from the FESEM images in Figure S1. As the VACNFs were plasma annealed, the NH3 plasma started to etch the sidewalls of carbon fibers confirmed from the decrease in diameter. Apart from the diameter decrease, Figure S1c,d show secondary structures created on the surface of the VACNF resulting from the plasma annealing at different temperatures. The plasma annealing between 500–650 °C retained the original vertical alignment along with the unique brush-like structure. The 550 °C plasma-annealed sample (denoted as N-VACNF PA) was selected for the catalyst study with a view to minimizing disruption to the bulk VACNF structure caused by NH3 etching.
The TEM images in Figure 1 help to further identify the microstructures present in N-VACNFs and Pt/N-VACNFs. Figure 1a,b show a clear difference between the single carbon fiber before and after plasma annealing for 5 min. The Ni catalyst forms a teardrop shape at the tip and guides the conical stacking of graphitic layers. The diameter of the carbon nanofiber decreased by 20–30 nm, as shown in Figure 1b, resulting from the etching by NH3 plasma annealing, while the Ni NPs were much less affected, leading to a larger head at the tip (resembling a matchstick). In addition, the plasma annealed samples showed fiber-like secondary structures of 5–10 nm diameter and 10–15 nm long on the sidewall surface. Figure 1c shows the uniform dispersion of Pt NPs on the sidewall of N-VACNF PA 5 min after Pt sputtering and the higher magnification TEM image in Figure 1d further confirms the presence of Pt NPs. Figure S2 indicates that the Pt NPs had an average diameter of 2.26 ± 0.45 nm. The smaller particle size on Pt/N-VACNFs can be ascribed to the nitrogen incorporated on the VACNF surface, which increased the number of nucleation sites.
To identify the elements, present in the plasma annealed N-VACNF and the nature of the secondary structures, we used a high-angle annular dark-field scanning transmission electron microscope (HAADF-STEM) and EDS elemental mapping in the selected region. Figure 1e–j and Figure S3 confirm the presence of C, N, Ni, and O in the N-VACNFs annealed at 5 and 15 min. Based on the elemental mapping, carbon and nitrogen were present throughout the fiber. The secondary structures on the surface of VACNFs were found to be NiO from Figure 1h,i. We assume that this could be due to the re-deposition of the Ni head at the tip, or the unreacted Ni particles left on the graphite paper substrate surface that were etched away during plasma annealing. The TEM EDS spectrum in Figure S3a confirmed the presence of C, N, O, and Ni in the selected area (as shown by the orange rectangle) and the tabulated results in the inset reveals that carbon was the majority element with 96.26 at%. It was found that there was about 0.63 at% of Ni in the selected area, which further confirms that the secondary structures were Ni-based. The TEM EDS spectrum in Figure S4 of Pt/N-VACNF PA 5 min (43 μg/cm2) revealed the presence of C, O, Pt, with C being the majority element at 78.18%. The Cu signal came from the TEM grid. The wt.% of Pt in the selected area for EDX analysis was 18.54% which is close to the actual wt.% of Pt (19.8%) calculated earlier. Elemental mapping of Pt/N-VACNF PA 5 min revealed that the carbon and nitrogen were present throughout the fiber, Ni presented on the surface alongside oxygen, and Pt presented on the sidewalls, as shown in Figure S5.
Figure S6a–d displays the Raman spectra recorded for bare VACNF and VACNF samples plasma annealed at 550 °C for 5, 15, and 30 min. All four samples exhibited signature peaks at 1365 cm−1, 1580 cm−1, and 2695 cm−1 corresponding to the D-band, G-band, and 2D-band, respectively. The ID/IG ratio of bare VACNF, N-VACNF PA 5 min, N-VACNF PA 15 min, and N-VACNF PA 30 min was calculated to be 0.93, 0.92, 0.89, and 0.70, respectively. The decreased ID/IG ratio indicates that the sp3 carbon present in the VACNFs decreased, caused by the NH3 plasma etching of the sidewalls of carbon nanofibers. In addition to this, a sharp 2D-band from the 30 min plasma annealed sample revealed that the plasma annealing may have also produced some few-layer graphene flakes or few-walled CNTs onto the VACNF surface.

3.2. XPS Analysis

XPS measurements were taken to further evaluate the chemical features and composition of the prepared catalysts. The survey spectrum was recorded within the range 0–1400 eV, as shown in Figure S6e–h, for bare VACNF, N-VACNF PA 5 min, N-VACNF PA 15 min, and N-VACNF PA 30 min. The survey spectra revealed the presence of C, N, O, and Ni in all the catalysts, which further confirms the successful doping of nitrogen into the VACNFs. The at% of the different chemical components of all the catalysts are listed in Table S1. To obtain more information about the nitrogen functionalities and their content in the plasma annealed samples, the high-resolution N 1s spectra were deconvoluted, as shown in Figure 2a–d. The N 1s spectra were deconvoluted into four components: pyridinic N (398.80 ± 0.3 eV), pyrrolic N (400.1 ± 0.3 eV), graphitic N (401.20 ± 0.2 eV), and pyridinic N-oxide (oxidic N) (402.00–406.00 eV) [39,52]. The bare VACNF is mostly dominated by pyridinic N (ca. 32.9%) and graphitic N (ca. 34.0%) with a smaller amount of pyrrolic N (10.9%) and oxidic N (22.2%). As the VACNFs were plasma annealed, the at% of N increased in the sample and the relative% of N functionalities changed. For the N-VACNF PA 5 min, the at% of N increased from 7.4 to 8.5% along with the increase in % of pyridinic N. As shown in Figure 2b, it was deconvoluted into pyridinic N (ca. 45.2%), pyrrolic N (16.8), graphitic N (27.4%), and oxidic N (10.6%). When the plasma annealing time was further increased to 15 min, the at% of N content increased to 8.6% with an increase in the pyridinic N (ca. 53.1%), along with pyrrolic N (ca. 9.4%), graphitic N (ca. 16.4%), and oxidic N (12.1%). However, a further increase of plasma annealing time to 30 min decreased the total% N content to 7.4%, with a slight decrease in the pyridinic N (ca. 49.1%). The N-VACNF PA 30 min also contained pyrrolic N (26.1%), graphitic N (15.0%), and oxidic N (9.8%). Figure 3a displays the relative% of individual functionalities for each catalyst. Initially, the pyridinic N content increased with the plasma annealing time and dropped when the annealing time was extended beyond 15 min. The pyrrolic N content increased with the plasma annealing time, whereas the graphitic N and oxidic N content decreased. This decrease could be due to the etching of carbon fibers. Figure 3b displays the C/N ratio for different catalysts. This plot confirms that as the at% of N increased in the sample, there was a corresponding decrease in the relative ratio of C/N, confirming that more nitrogen was present. The high-resolution N 1s spectra and the C/N ratio plot validated the successful doping of N into VACNFs.
Figure S7 presents the O 1s spectra of bare VACNF, N-VACNF PA 5 min, N-VACNF PA 15 min, and N-VACNF PA 30 min. As the plasma annealing time increased, O at% increase in the sample. The O 1s spectra of bare VACNF can be deconvoluted into four different peaks with binding energies (BE) of 531.28, 532.26, 533.64, and 534.72 eV corresponding to the C=O, C-O, C-O-H/C-O-C bonds, and physisorbed water, which accounted for 20.7, 47.7, 23.0 and 8.6% of total oxygen atoms, respectively [53]. After plasma annealing, the N-VACNF samples showed C=O, C-O, and C-O-H/C-O-C peaks at almost the same binding energy with a small change in their relative% between samples. However, all three plasma-annealed samples had an additional peak at ~529.60 eV, which can be ascribed to the Ni-O bond [54]. This further confirmed the presence of NiO particles on the surface of VACNFs. The relative% of NiO was found to be 10.3, 15.0, and 16.4 for N-VACNF PA 5 min, N-VACNF PA 15 min, and N-VACNF PA 30 min, respectively. Figure 3c illustrates the total O content and % of different oxygen species present in all four catalysts. Table S2 summarizes the BE and the relative area% of the individual chemical components derived from O 1s and N 1s high-resolution spectra for all the prepared samples.
The N 1s high-resolution spectra of Pt/N-VACNF PA 5 min was deconvoluted, as shown in Figure S8a, to identify the type of nitrogen functionalities present after Pt sputtering. The peaks at 398.81, 400.13, and 401.20 eV were allocated to the pyridinic N, pyrrolic N, and graphitic N accounting for 45.3, 17.6, and 11.1% of total nitrogen, respectively. However, an additional peak at 397.75 eV, that was originally not present in either the bare VACNF or N-VACNF PA 5 min, was required to perfectly fit the N 1s spectra. The peak at 397.75 eV (ca. 33.9%) can be attributed to the presence of Pt-N bond as previously reported in the literature [55,56]. This gives stronger evidence for the presence of Pt and N interaction in the Pt/N-VACNF sample. In Pt/VACNF, the Pt-N bond was present at 398.00 eV, and it corresponded to about 26.0% of total N, as presented in Figure S8b. It is important to note that additional pyridinic N in the Pt/N-VACNF sample shifted the BE of the Pt-N peak negatively by 0.25 eV compared to Pt/VACNF and increased the relative% of the Pt-N bond. These findings validate the electron transfer between N and Pt, and are in good agreement with the smaller Pt particle size that resulted from the stronger interaction between N and Pt, as shown in Figure S2.
Figure 2e,f present the Pt 4f XPS spectra of Pt/C and Pt/N-VACNF. The Pt 4f spectrum consists of two spin-orbit splits, namely Pt 4f7/2 and Pt 4f5/2 with a peak ratio of 4:3. Each of these could be further deconvoluted into three peaks that were assigned to Pt0, Pt2+ (PtO or Pt(OH)2), and Pt4+ (PtO2) species, respectively. The BE and relative area% of each of the components in the Pt 4f spectra of Pt/C and Pt/N-VACNF is summarized in Table S3. As it is seen from Figure 2e,f, the BE of metallic Pt (Pt0 4f7/2 and Pt0 4f5/2) shifted negatively by 0.19 and 0.22 eV, respectively. This observed negative shift indicates that the Pt/VACNF catalyst had less electron transfer from the Pt to carbon support than the commercial Pt/C catalyst or had electron transfer from C to Pt [38]. In addition to this, the presence of N helps to increase the relative concentration of Pt0 (57.2%) compared to Pt/C (45.6%) which has no nitrogen. Overall, the XPS results confirmed the increase of pyridinic N content in the sample with PA, NiO presence in the plasma annealed samples, stronger metal-support interaction, and partial electron transfer between Pt and N.

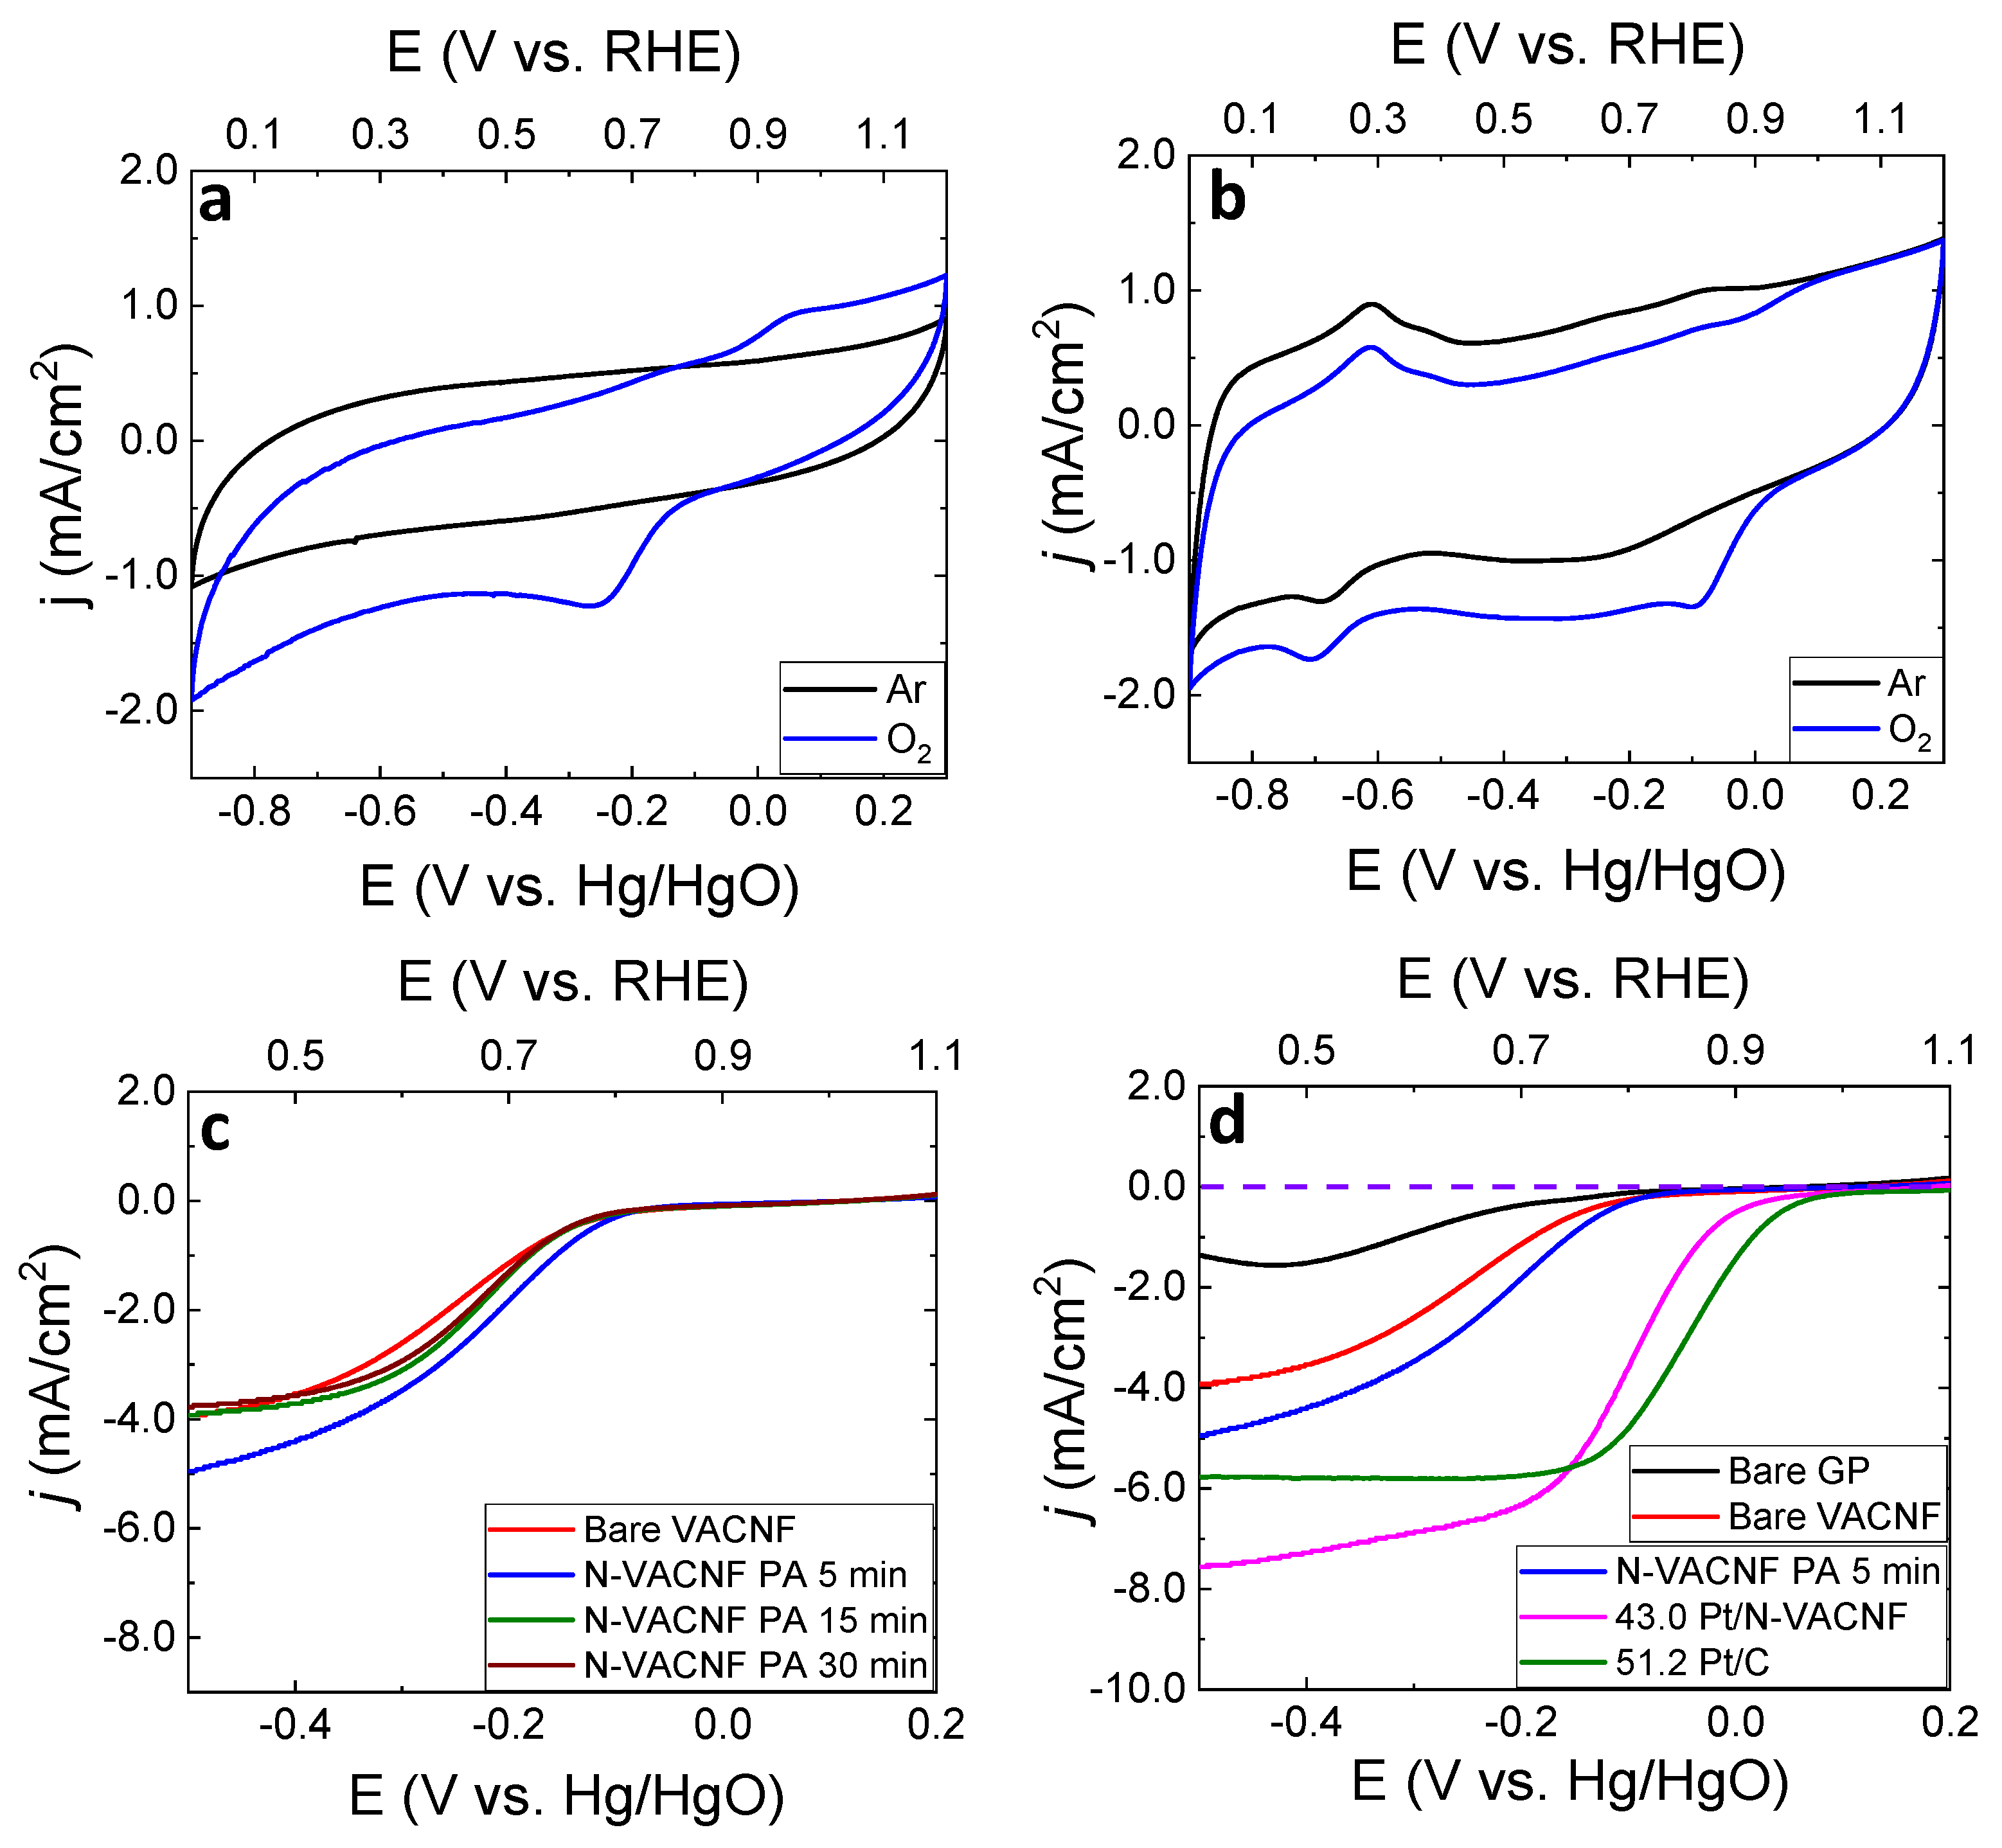
3.3. Evaluation of the ORR Catalytic Activity
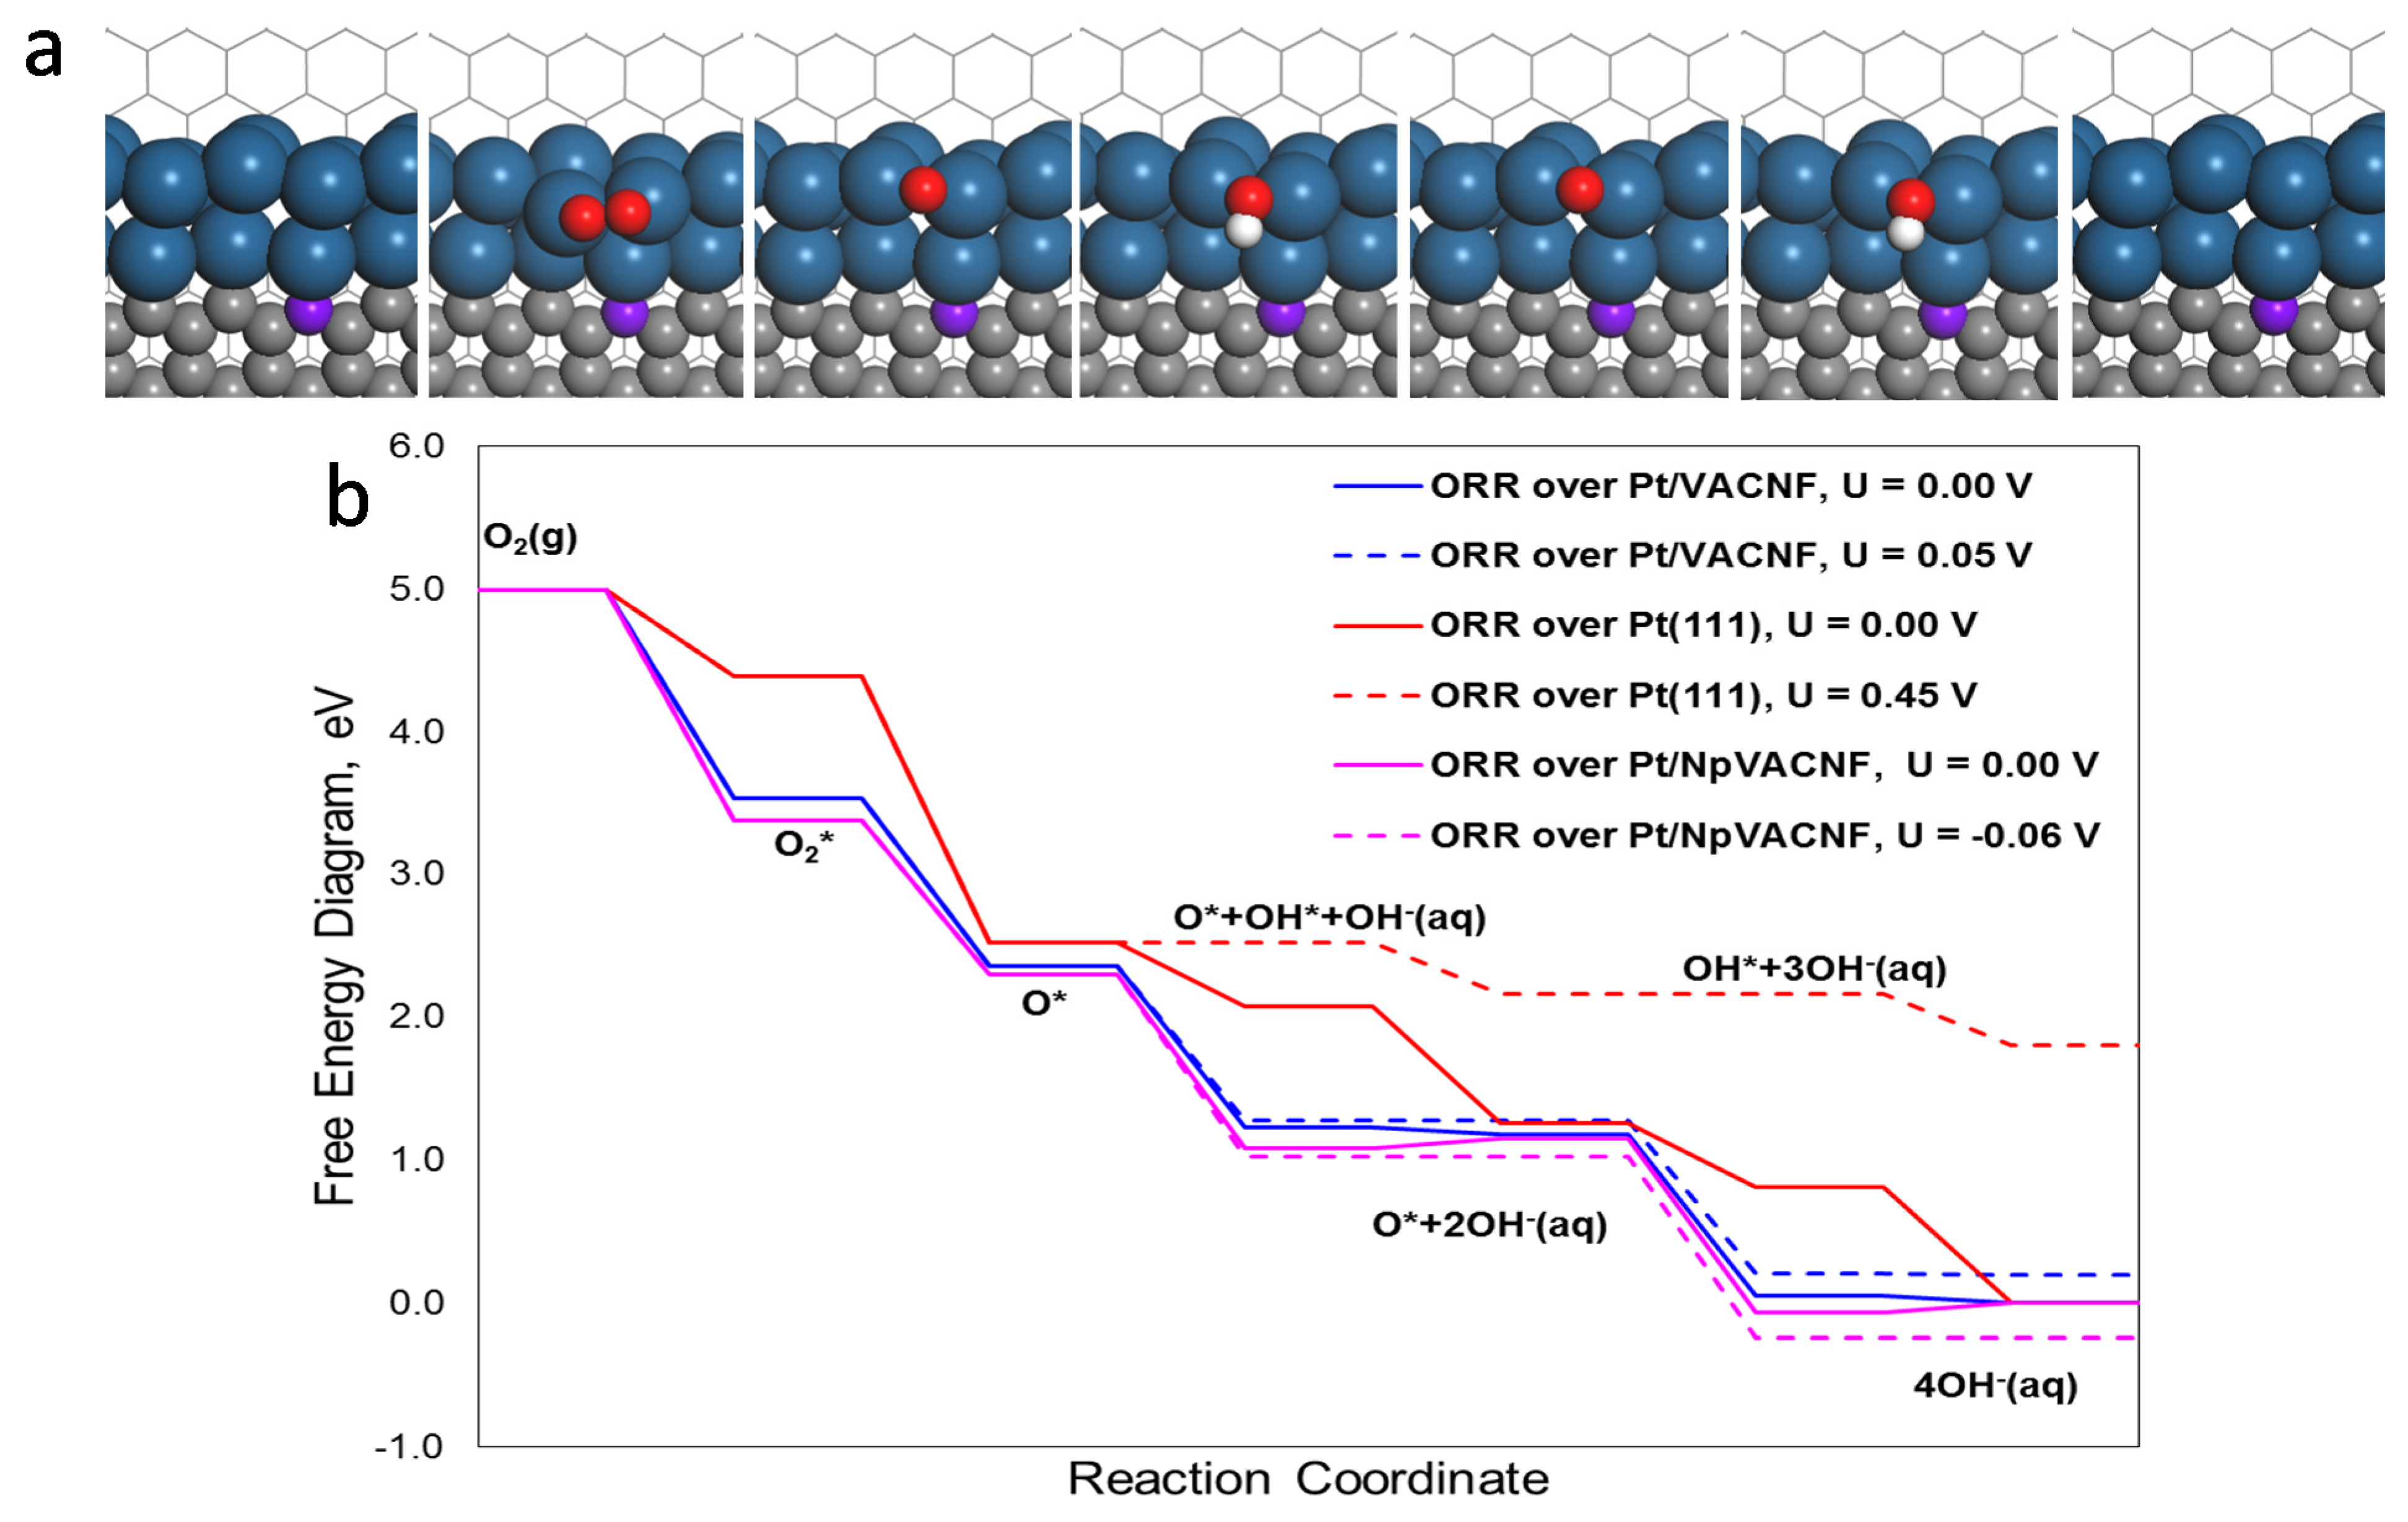
Figure 4a presents the cyclic voltammetry (CV) curves recorded in Ar-saturated and O2-saturated 0.10 M KOH solution for N-VACNF PA 5 min. In the presence of O2, there was a reduction peak at −0.252 V (vs. Hg/HgO) indicating the ORR activity of the catalyst. As the Pt was sputtered on the N-VACNF PA 5 min sample, the O2 reduction peak shifted to a more positive potential of about −0.099 V (vs. Hg/HgO), indicating an increase in the activity resulting from the Pt catalyst. As shown in Figure 4b, there was an additional peak around −0.70 V (vs. Hg/HgO) due to hydrogen adsorption on the Pt surfaces. The Pt deposit also increased the capacitance of the electrode, as indicated by the larger baseline separation between the forward and reverse scans. The impact of a larger capacitive current on the Pt/N-VACNF is discussed in detail in our previous work [37]. Figure S9 displays the CV curves recorded for the Pt/N-VACNF catalysts with different Pt loadings. As the Pt loading decreased, the current density of the O2 reduction peak and the H2 adsorption peak decreased.
Figure 4c shows the linear sweep voltammetry (LSV) curves recorded at a rotation speed of 1600 rpm between +0.20 V and −0.50 V (vs. Hg/HgO) in O2-saturated 0.10 M KOH solution for the bare VACNF and VACNF PA annealed samples. The LSV’s had almost identical onset potentials and they overlapped in the kinetic region. The differences occurred in the mixed and diffusion-limited regions. Once the sample was plasma annealed for 5 min, the E1/2 shifted positively to −0.205 V (vs. Hg/HgO), which was about 42 mV higher when compared to the bare VACNF (−0.247 V vs. Hg/HgO). In addition, the current density at −0.50 V for N-VACNF PA 5 min had an almost 20% increase compared to the bare VACNF. However, the ORR activity did not significantly improve when the PA time was increased. We attributed this to larger NiO particles blocking the ORR active sites. Consequently, in further studies involving Pt deposition, we used the N-VACNF PA 5 min as the support. It is noteworthy that the ORR takes a 2-electron pathway on pristine VACNF and N-doped VACNF, as we demonstrated with Koutecky–Levich (KL) analysis in our previous study [37]. Overall, the increased pyridinic N at the graphitic edge of VACNFs by NH3 plasma annealing only slightly improved the ORR catalytic activity. This is not consistent with the study by Guo et al. [39], using HOPG model catalysts, which concluded that N-doped graphitic carbon materials can be an effective ORR catalysts and that essentially all ORR catalytic activity is generated by pyridinic N at the graphitic edges. Further studies are necessary to resolve the discrepancies. However, as shown here, N-doped VACNFs were found to be an effective catalyst support to enhance the ORR catalytic properties of Pt catalysts.
After sputtering 20 nm of Pt, the positive shift in the E1/2 and increase in the current density can clearly be seen, indicating the improvement in the catalytic activity, with a clear sigmoidal shape in LSV representing the steady-state condition. However, compared to the commercial catalyst Pt/C, the baseline in the diffusion-limited region was slanted towards the negative potential. A similar feature was noticed for Pt/VACNF and a detailed study of this is reported in our previous work [37]. The 43.0 Pt/N-VACNF had a Jlim value of 6.7 mA/cm2, which was the same as for 43.0 Pt/VACNF with similar Pt loading. The difference arose with the negative shift in the ORR curve. For 43.0 Pt/N-VACNF, the value of E1/2 was −0.096 V (vs. Hg/HgO) which shifted negatively by 10 mV when compared to the 43.0 Pt/VACNF (−0.086 V vs. Hg/HgO). We wanted to check if this negative shift was due to the presence of NiO NPs on the VACNF surface.
As shown in Figure S10a–c, the NiO NPs diameter increased when the PA time increased. The NiO NPs present on the surface were removed by soaking the Pt/N-VACNF PA catalysts in 1.0 M HNO3 for 20 min. Figure S10d–f confirms that the NiO NPs were successfully removed, including the Ni head at the top. It is noteworthy that the HNO3-treated N-VACNF PA 5 min sample needed to be dried under vacuum at 70 °C before sputtering 20 nm Pt catalyst for the ORR catalytic tests. As presented in Figure S11a, the Pt sputtered after HNO3 treatment had a negative E1/2 shift when compared to the Pt/N-VACNF without any treatment in HNO3. This negative shift can be attributed to the other factors introduced post-HNO3 treatment. When the samples were taken out from the 1.0 M HNO3 solution, the individual VACNFs bundled up together, as shown in Figure S11b,c, due to the capillary force during the drying process and lost their original brush-like architecture. To avoid this architecture change, we left the NiO NPs on the VACNF for the ORR studies. In addition, in the high alkaline conditions there could be a possibility of nickel hydroxides from the NiO NPs. However, the presence of NiO or Ni(OH)2 did not affect our investigation into the activity of the Pt/N-VACNF catalyst.
The RDE voltammogram, at a series of rotation speeds between 500 and 3000 rpm, was recorded for the bare VACNF, N-VACNF with PA for different time intervals, and Pt/N-VACNF PA 5 min, with different Pt loadings (6.5, 10.8, 21.5, and 43.0 µg/cm2), as presented in Figures S12 and S13. As the rotation speed increased, the Jlim increased as more O2 flux reached the electrode surface. All the Pt/VACNF catalysts showed higher Jlim values than the benchmark Pt/C catalyst due to the much larger sample thickness (~210 µm for VACNF/graphite paper vs. <200 nm in Pt/C), as we illustrated in our previous study [37], but the tilt of the curve in the diffusion-controlled region became smaller as the Pt loading increased.

3.4. DFT Analysis

Semi-periodic fishbone models were built based on our previous work [37]. Due to the multi-edged feature of VACNFs, the Pt NPs clusters were directly supported by open carbon edges. As shown in Figure S14, to focus on the impact of N-doping in VACNFs, C atoms at the graphitic edge were replaced by pyridinic N. Figure S15 shows that the formation energy of Pt on pyridinic N (Np)-doped graphitic edge became more negative as the % of Np increased. This indicates that the stability of the Pt NPs increased when the pyridinic N content increased. Pt atoms were considered to be the primary binding site for O2, which is similar to the undoped fishbone edge [37], and the most stable ORR intermediates over Pt supported by Np-doped graphitic edge are given in Figure 5a. To compare the ORR reactivity over Pt/VACNF vs. Pt/NpVACNF, the free energy diagram was constructed based on the dissociative mechanism since this reaction pathway is more energetically favored compared to the associative pathway [37]. According to the free energy diagram in Figure 5b, the overall energy profile for the ORR over Pt supported by Np-doped graphitic edge is very much like the undoped graphitic edge with the rate-limiting step still being the OH desorption step and the reaction following a 4-e pathway. However, Pt supported by an Np-doped graphitic edge showed slightly stronger adsorption of ORR intermediates. In addition to that, the U l i m calculated on Pt/NpVACNF was −0.06 V, which was lower than 0.05 V on Pt/VACNF and 0.45 V on Pt (111) due to the stronger binding of OH. Our previous study, based on screening ORR catalysts, produced a volcano-type plot using the OH adsorption energy as a descriptor [51]. Based on the OH adsorption energy over Pt/NpVACNF, this should fit on the left side of the volcano, indicating that the potential determining step is the OH desorption step and that overly strong OH adsorption energy will lower the U l i m and limit the catalytic performance. Our previous work reported that the pyridinic N dopants can result in an upshift of the d-band center of Pt atoms, which results in stronger binding to ORR intermediates [38]. Based on these results, we can conclude that the −10 mV shift in E1/2 of Pt/N-VACNF was due to the stronger binding of OH and may not be due to the presence of NiO particles.

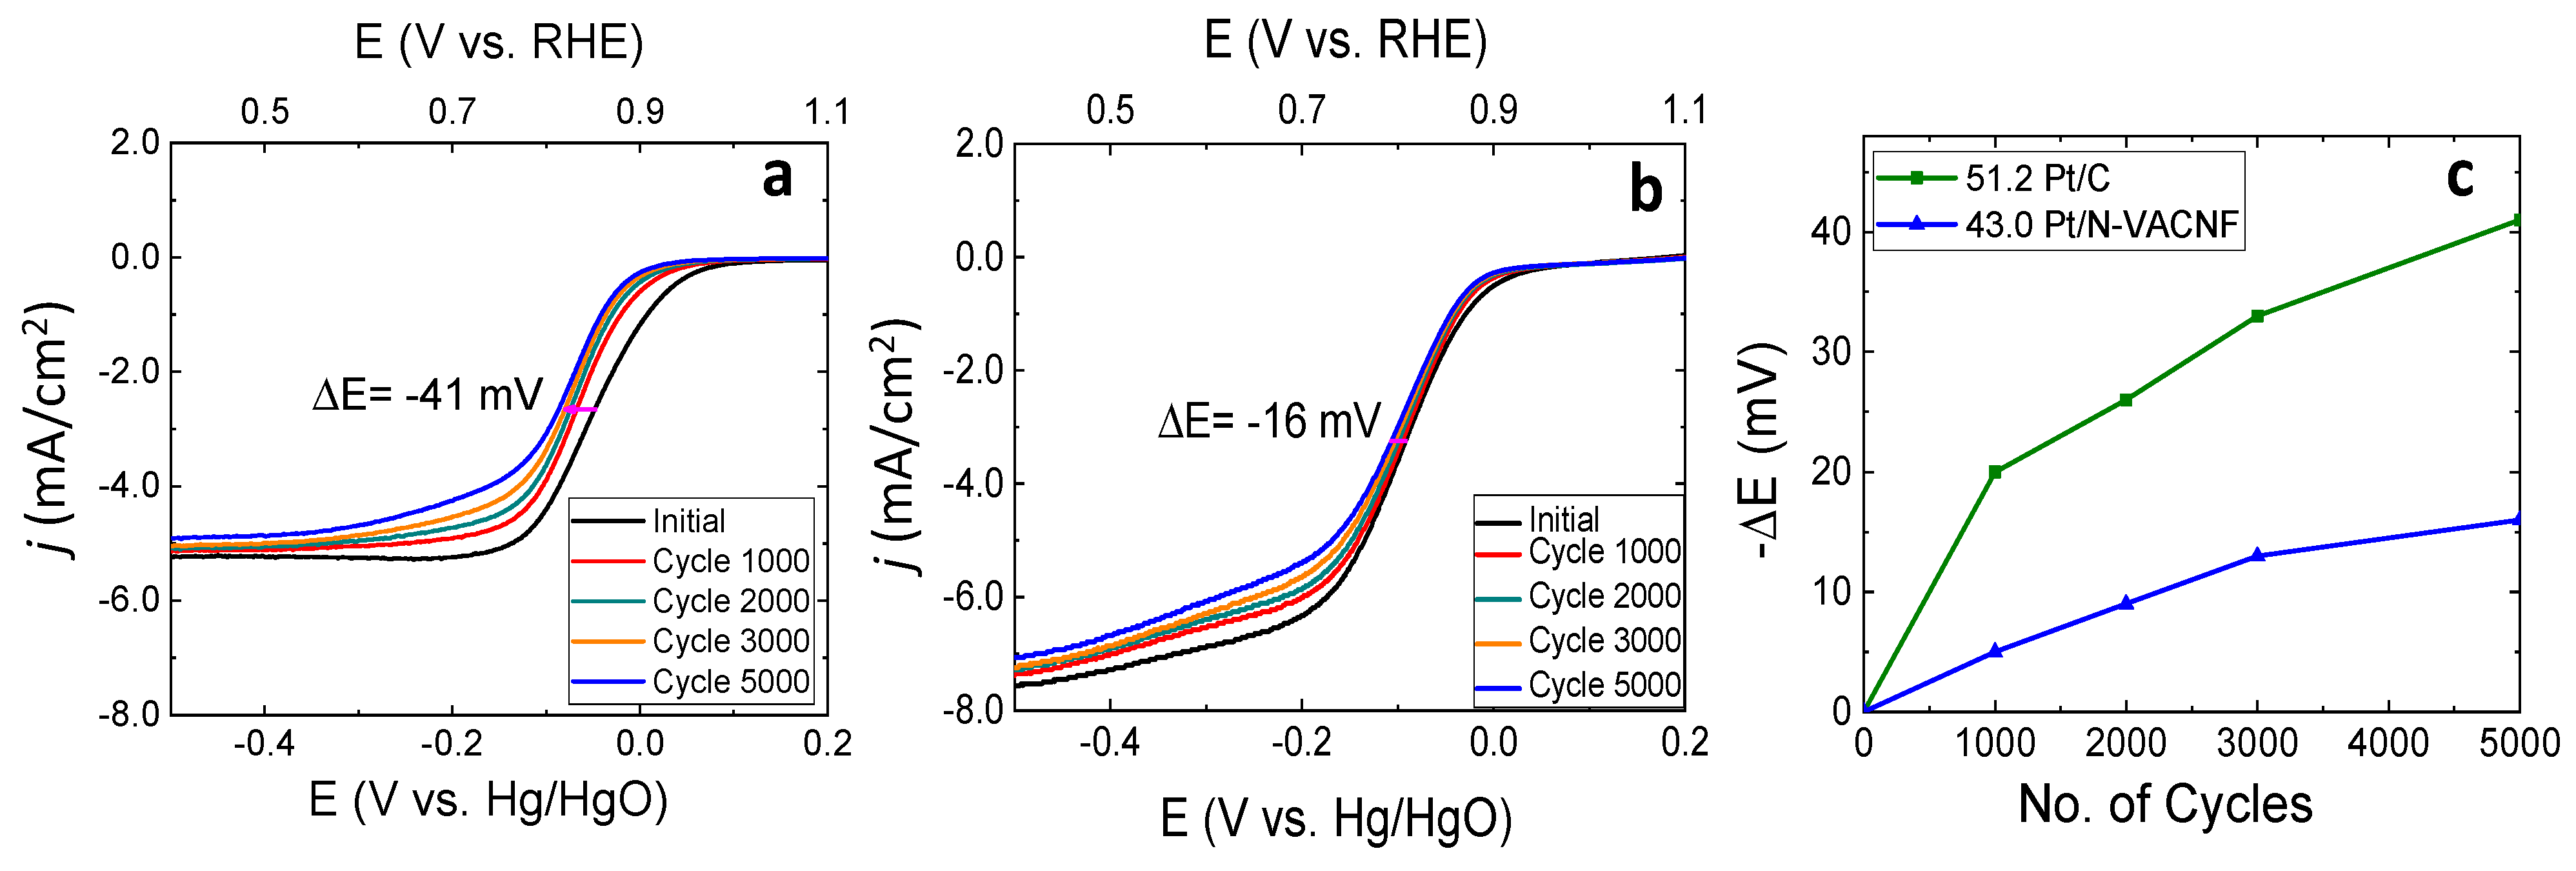
3.5. Durability Test for Pt/N-VACNF

The durability tests of the prepared 43.0 Pt/N-VACNF, 43.0 Pt/VACNF, and 51.2 Pt/C catalysts were studied using fast potential cycling (100 mV/s) between 0.293 V and −0.307 V, i.e., an accelerated stress test (AST). The ORR activity was tested for all the catalysts by recording the CV and LSV at 1600 rpm for every 1000 AST cycles. We evaluated the durability of the catalyst by calculating the value of the shift in potential (∆E) to maintain the original half-wave current density. As presented in Figure 6a,b, the Pt/N-VACNF catalysts showed much more stable LSV curves than that obtained for Pt/C. The potential shift ∆E after 5000 AST cycles was about −16.0 mV for Pt/N-VACNF, whereas it was −41.0 mV for the commercial Pt/C catalyst. This lower shift in ∆E indicates that the Pt NPs deposited on N-VACNF PA 5 min were much more stable even with a smaller particle size of ~2.3 nm compared to ~3.5 nm for Pt/C. The better durability with an even smaller Pt particle size of Pt/N-VACNF can be ascribed to the presence of pyridinic N, which increases the stability of the Pt NPs, as verified by DFT analysis, and a strong interaction between the Pt and catalyst support, as verified by XPS analysis.

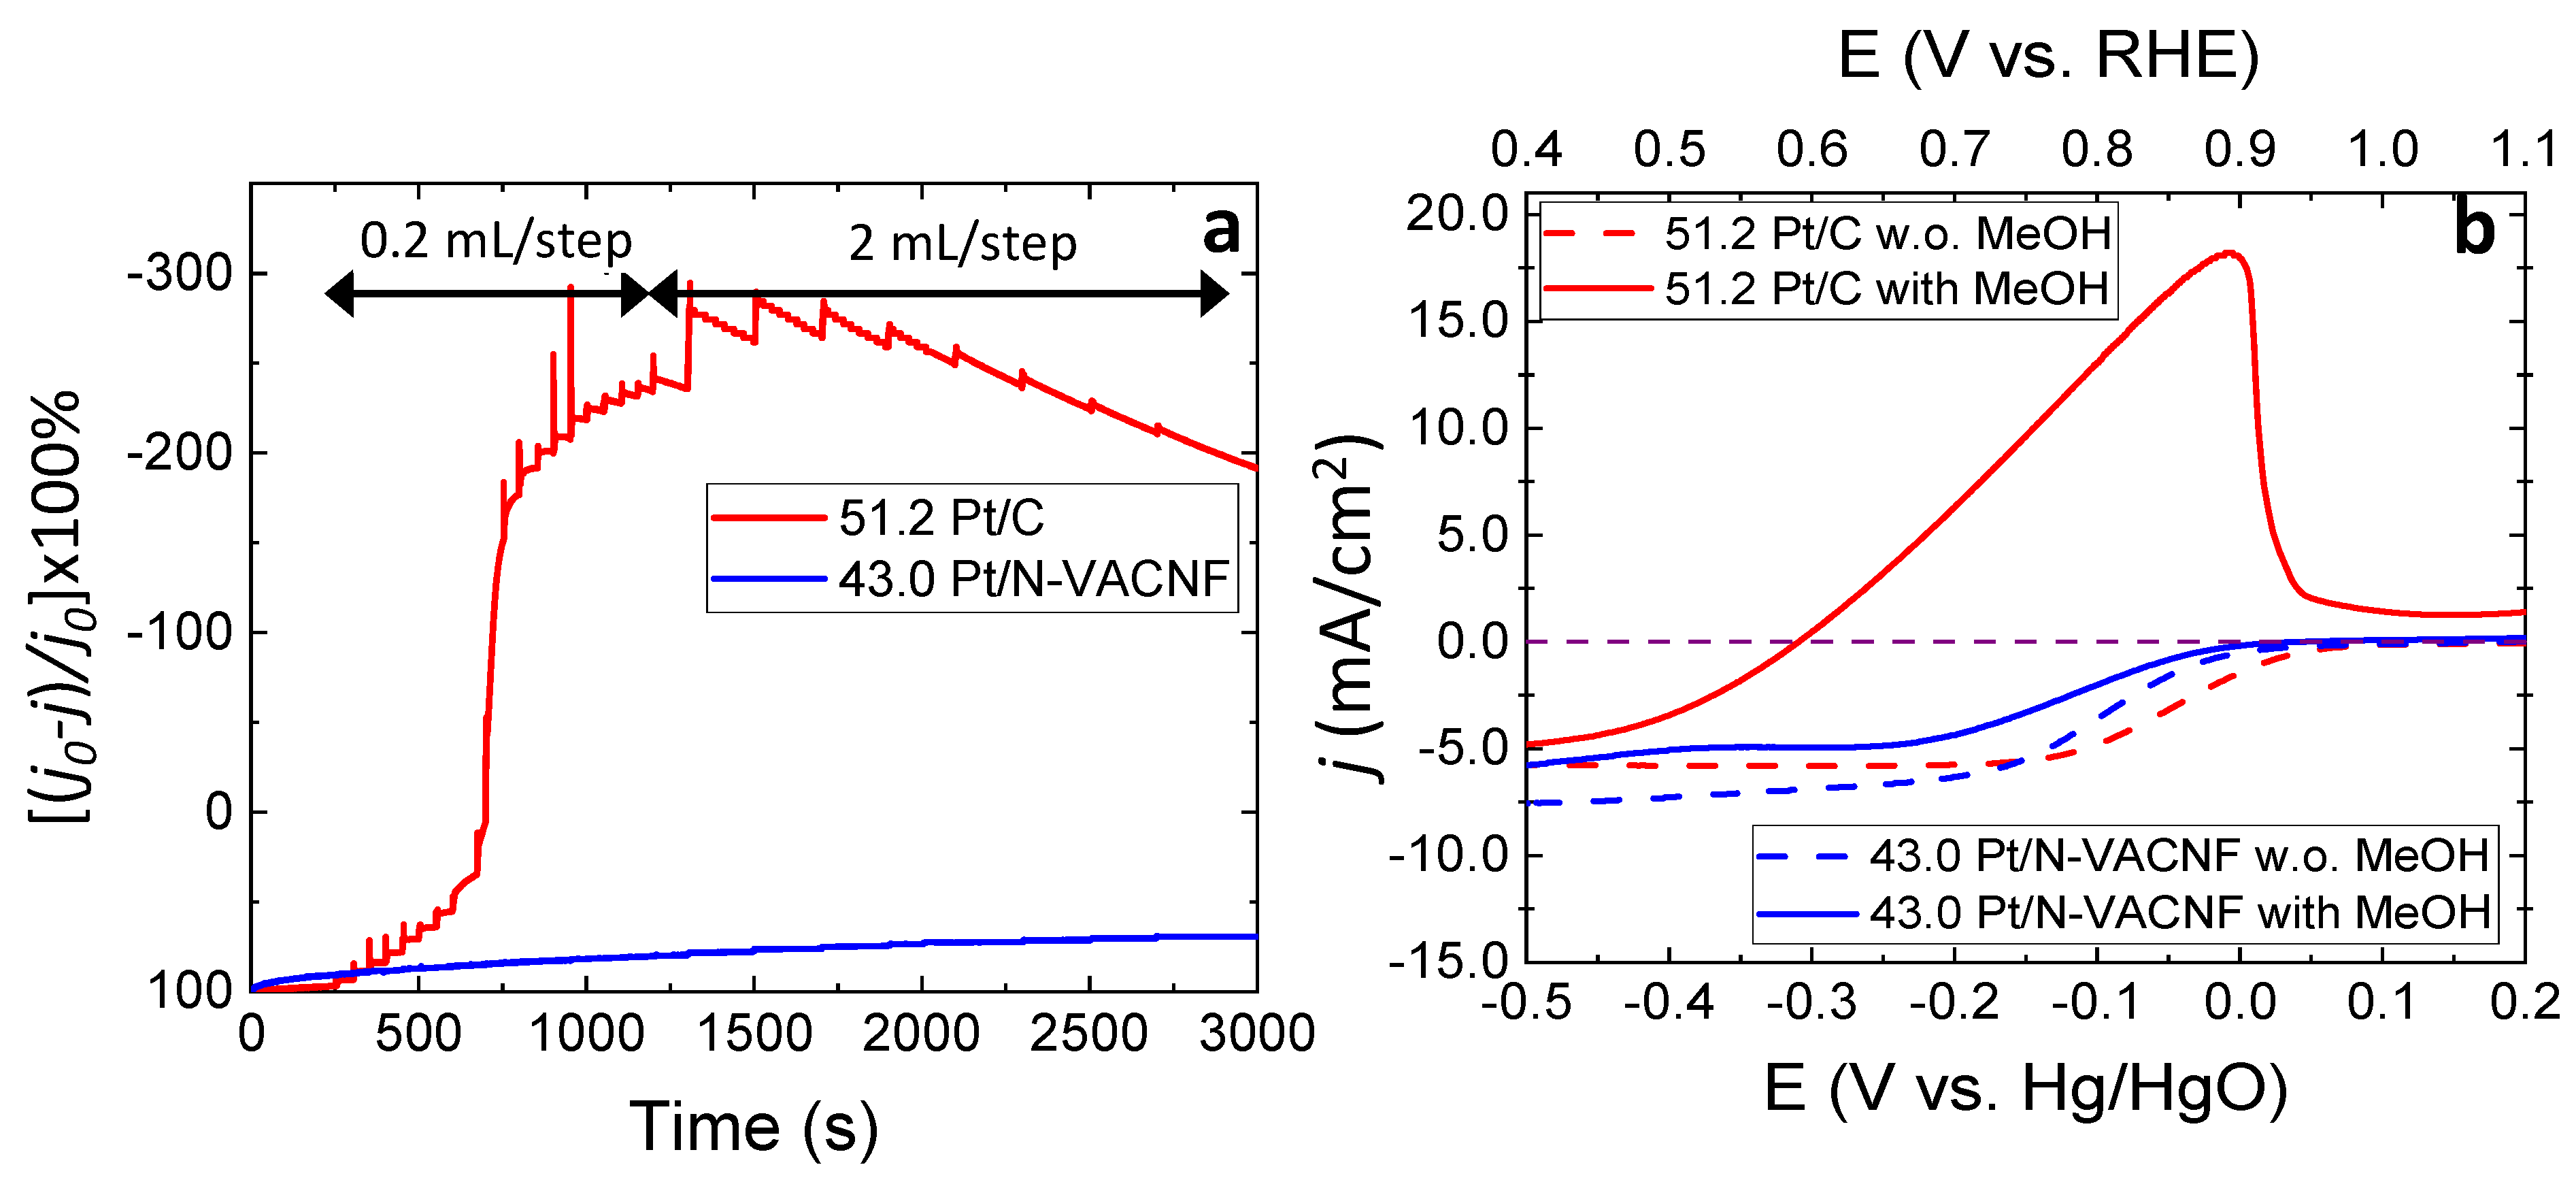
3.6. Methanol Tolerance of Pt/N-VACNF

The ability to withstand methanol crossover is an essential criterion for the ORR catalyst for direct methanol fuel cells. The methanol tolerance was evaluated by employing amperometric measurements. The amperometric j-t curve was recorded at −0.10 V (vs. Hg/HgO), which is the more critical potential at which Pt catalysts are sensitive to methanol. Figure 7a displays the amperometric j-t curve recorded for 43.0 Pt/N-VACNF and 51.2 Pt/C when 3.0 M methanol was successively added (0.2 mL/step first then 2.0 mL/step) into the 0.10 M KOH solution until reaching a final methanol concentration of 0.75 M. The percentage loss of the original ORR current, i.e., [(j0j)/j0] × 100%, was plotted as the methanol was added. The 43.0 Pt/N-VACNF catalysts lost only about 21% of the ORR current density (i.e., with (j0j)/j0 = 21%) after adding 0.75 M of methanol, whereas the current 51.2 Pt/C commercial catalyst completely changed the polarity with (j0 − j)/j0 = −300%, indicating that the dominant reaction had changed from oxygen reduction to methanol oxidation. Furthermore, the high tolerance towards methanol oxidation for Pt/N-VACNF was further confirmed using the LSV curves as presented in Figure 7b. For the Pt/N-VACNF catalyst with 43.0 µg/cm2 Pt loading, the LSV curve in the presence of methanol exhibited a reduction current in the full ORR potential range and the methanol oxidation was significantly suppressed, which explains why a large ORR current density was still observed at −0.10 V even after adding approximately 0.75 M methanol. In contrast, for the 51.2 µg/cm2 Pt/C catalyst, the LSV curve was dominated by methanol oxidation at a potential above −0.30 V (vs. Hg/HgO), indicating a poor tolerance to methanol crossover. Overall, the Pt/N-VACNF was highly selective towards the ORR in a mixed environment, indicating a higher tolerance to methanol crossover.

4. Conclusions

In summary, a new catalyst support structure, N-doped VACNF, was successfully prepared via plasma annealing coupled with PECVD. The structural characterization results identified the morphological changes on the catalyst surface and confirmed the attachment of Pt NPs. The presence of nitrogen species and different oxygen functionalities on the VACNFs because of plasma annealing was revealed by XPS analysis. The increase of pyridinic N at the graphitic edges of the VACNFs after NH3 plasma treatment was found to improve ORR activity only slightly. However, the presence of nitrogen assisted in reducing the size of Pt NPs to ~2.3 nm and generated a stronger Pt-support interaction. The Pt/N-VACNF with 43 µg/cm2 Pt loading exhibited a ∆E shift of only −16 mV after 5000 potential cycles in the accelerated stress test, indicating that it had better durability compared to its commercial counterpart, Pt/C. The increased durability resulted from the strong metal-support interaction and partial electron transfer induced by the presence of nitrogen. DFT calculations have validated the strong binding of Pt atoms with the pyridinic N-doped graphitic edge and confirmed the 4-e pathway for the Pt/N-VACNF catalyzed ORR. In addition, the Pt/N-VACNF catalysts have shown excellent tolerance to methanol oxidation and the oxygen reduction was maintained as the dominant reaction in the full potential range when up to 0.75 M methanol was added. Altogether, the increased N content improved the durability of the Pt/N-VACNF catalysts.

Supplementary Materials

The following are available online at https://www.mdpi.com/article/10.3390/applnano2040022/s1, Figure S1: FESEM images of VACNFs (a) as-grown and plasma annealed for 5 min at (b) 550 °C, (c) 600 °C, and (d) 650 °C. Figure S2: TEM image of Pt/N-VACNF PA 5 min (43.0 µg/cm2) with the corresponding particle size distribution. Figure S3: (a) TEM-EDS spectrum and (b) HAADF-STEM image showing the selected area for EDS analysis of N-VACNF PA 5 min; (c) HAADF-STEM image and (d–g) STEM-EDS mapping for all the elements of N-VACNF (PA 5 min). The inset table in (a) shows the atomic% of different elements. Figure S4: TEM-EDS spectrum of Pt/N-VACNF PA 5 min. The orange rectangle in inset HAADF-STEM image shows the selected area for EDS analysis. The inset table shows the weight% of different elements. Figure S5: (a) HAADF-STEM image and (b–g) STEM-EDS elemental mapping of Pt/N-VACNF PA 5 min. Figure S6: (a–d) Raman spectra and (e–h) XPS survey spectra of bare VACNF, N-VACNF PA 5 min, N-VACNF PA 15 min, and N-VACNF PA 30 min. Figure S7: O 1s XPS spectra of (a) bare VACNF, (b) N-VACNF PA 5 min, (c) N-VACNF PA 15 min, and (d) N-VACNF PA 30 min. Figure S8: N 1s XPS spectra of (a) Pt/N-VACNF PA 5 min and (b) Pt/VACNF. Figure S9: CV curves recorded at a scan rate of 50 mV/s in O2 saturated 0.10 M KOH solution for N-VACNF PA 5 min catalysts with different Pt loadings (6.5, 10.8, 21.5, and 43.0 µg/cm2). Figure S10: TEM image of (a) and (d) N-VACNF PA 5 min; (b) and (e) N-VACNF PA 15 min; (c) and (f) N-VACNF PA 30 min, where (a–c) are as-prepared and (d–f) are after treatment in 1.0 M HNO3. Figure S11: (c) LSV recorded at 1600 rpm in O2-saturated 0.10 M KOH solution with Pt sputtered without any treatment in HNO3 and after treatment in HNO3 for Pt/N-VACNF PA 5 min; (a and b) FESEM image of N-VACNF PA 5 min after contact with solution. Figure S12: RDE LSV voltammogram of (a) bare VACNF, (b) N-VACNF PA 5 min, (c) N-VACNF PA 15 min, and (d) N-VACNF PA 30 min in O2-saturated 0.10 M KOH solution at a scan rate of 10 mV/s and at a rotation speed from 500 to 3000 rpm. The purple dash-line marks the zero-current density. Figure S13: RDE LSV voltammogram of (a) Pt/N-VACNF PA 5 min (6.5 µg/cm2 Pt), (b) Pt/N-VACNF PA 5 min (10.8 µg/cm2 Pt), (c) Pt/N-VACNF PA 5 min (21.5 µg/cm2 Pt), and (d) Pt/N-VACNF PA 5 min (43.0 µg/cm2 Pt) in O2-saturated 0.10 M KOH solution at a scan rate of 10 mV/s and at a rotation speed from 500 to 3000 rpm. Figure S14: Side view (a) and front view (b) of molecular model for Pt/NpVACNF model to represent Pt NPs supported by NpVACNF edge. Color code: blue-Pt, gray-C, purple-N, red-O, white-H. Figure S15: Stability analysis of Pt particles over pyridinic nitrogen (Np) doped edge. Color code: blue-Pt, gray-C, purple-N. Table S1: Atomic Percentage (at%) of the elemental species from the XPS survey spectra. Table S2: Binding energies (BE) and integrated relative area% of individual chemical component from N 1s and O 1s XPS spectra of Bare VACNF, N-VACNF PA 5min, N-VACNF PA 15 min, and N-VACNF PA 30 min. Table S3: Binding energies (BE) and integrated relative area% for each species of Pt/C and Pt/N-VACNF from Pt 4f XPS spectra.

Author Contributions

Conceptualization, J.L. and A.E.; methodology, A.E. and J.X.; validation, A.E. and J.X.; formal analysis, A.E., J.X., A.S., S.R., B.L. and J.L.; investigation, A.E. and J.X.; data curation, A.E. and J.X.; visualization, A.E.; resources, J.L. and B.L.; writing—original draft preparation, A.E.; writing—review and editing, A.E., J.X., A.S., S.R., B.L. and J.L.; funding acquisition, J.L. and B.L.; supervision, J.L. and B.L.; project administration, J.L. All authors have read and agreed to the published version of the manuscript.

Funding

This work was supported by the National Science Foundation grant CBET-1703263 and in part by the U.S. Department of Energy’s Office of Energy Efficiency and Renewable Energy (EERE) under the Fuel Cell Technologies Office Award Number DE-EE0008440. The computation work in this project was performed on the Beocat Research Cluster at Kansas State University, which is funded in part by NSF grants CHE-1726332, CNS-1006860, EPS-1006860, EPS-0919443, National Energy Research Scientific Computing Centre (NERSC) under the contract No. DEAC02-05CH11231, and the Extreme Science and Engineering Discovery Environment (XSEDE) supported by the National Science Foundation grant number ACI-1548562. The materials characterization was performed in part in the Nebraska Nanoscale Facility: National Nanotechnology Coordinated Infrastructure and the Nebraska Center for Materials and Nanoscience, which are supported by the National Science Foundation under Award ECCS: 1542182 and the Nebraska Research Initiative.

Institutional Review Board Statement

Not applicable.

Informed Consent Statement

Not applicable.

Acknowledgments

We would like to thank Balasubramanian Balamurugan from the University of Nebraska for the XPS analysis.

Conflicts of Interest

The authors declare no conflict of interest.

References

  1. Shao, Y.; Yin, G.; Gao, Y. Understanding and approaches for the durability issues of Pt-based catalysts for PEM fuel cell. J. Power Sources 2007, 171, 558–566. [Google Scholar] [CrossRef]
  2. Zhang, C.; Shen, X.; Pan, Y.; Peng, Z. A review of Pt-based electrocatalysts for oxygen reduction reaction. Front. Energy 2017, 11, 268–285. [Google Scholar] [CrossRef]
  3. Zhou, Y.; Holme, T.; Berry, J.; Ohno, T.R.; Ginley, D.; O’Hayre, R. Dopant-Induced Electronic Structure Modification of HOPG Surfaces: Implications for High Activity Fuel Cell Catalysts. J. Phys. Chem. C 2010, 114, 506–515. [Google Scholar] [CrossRef]
  4. Reiser, C.A.; Bregoli, L.; Patterson, T.W.; Yi, J.S.; Yang, J.D.; Perry, M.L.; Jarvi, T.D. A Reverse-Current Decay Mechanism for Fuel Cells. Electrochem. Solid-State Lett. 2005, 8, A273. [Google Scholar] [CrossRef]
  5. Gasteiger, H.A.; Kocha, S.S.; Sompalli, B.; Wagner, F.T. Activity benchmarks and requirements for Pt, Pt-alloy, and non-Pt oxygen reduction catalysts for PEMFCs. Appl. Catal. B 2005, 56, 9–35. [Google Scholar] [CrossRef]
  6. Yu, X.; Ye, S. Recent advances in activity and durability enhancement of Pt/C catalytic cathode in PEMFC: Part II: Degradation mechanism and durability enhancement of carbon supported platinum catalyst. J. Power Sources 2007, 172, 145–154. [Google Scholar] [CrossRef]
  7. Li, X.; Park, S.; Popov, B.N. Highly stable Pt and PtPd hybrid catalysts supported on a nitrogen-modified carbon composite for fuel cell application. J. Power Sources 2010, 195, 445–452. [Google Scholar] [CrossRef]
  8. Su, L.; Jia, W.; Li, C.-M.; Lei, Y. Mechanisms for Enhanced Performance of Platinum-Based Electrocatalysts in Proton Exchange Membrane Fuel Cells. ChemSusChem 2014, 7, 361–378. [Google Scholar] [CrossRef]
  9. Greeley, J.; Stephens, I.E.L.; Bondarenko, A.S.; Johansson, T.P.; Hansen, H.A.; Jaramillo, T.F.; Rossmeisl, J.; Chorkendorff, I.; Nørskov, J.K. Alloys of platinum and early transition metals as oxygen reduction electrocatalysts. Nat. Chem. 2009, 1, 552–556. [Google Scholar] [CrossRef] [PubMed]
  10. Liang, H.-W.; Cao, X.; Zhou, F.; Cui, C.-H.; Zhang, W.-J.; Yu, S.-H. A Free-Standing Pt-Nanowire Membrane as a Highly Stable Electrocatalyst for the Oxygen Reduction Reaction. Adv. Mater. 2011, 23, 1467–1471. [Google Scholar] [CrossRef] [PubMed]
  11. Xia, B.Y.; Wu, H.B.; Yan, Y.; Lou, X.W.; Wang, X. Ultrathin and Ultralong Single-Crystal Platinum Nanowire Assemblies with Highly Stable Electrocatalytic Activity. J. Am. Chem. Soc. 2013, 135, 9480–9485. [Google Scholar] [CrossRef] [PubMed]
  12. Chen, Z.; Waje, M.; Li, W.; Yan, Y. Supportless Pt and PtPd Nanotubes as Electrocatalysts for Oxygen-Reduction Reactions. Angew. Chem. 2007, 46, 4060–4063. [Google Scholar] [CrossRef]
  13. Lim, B.; Jiang, M.; Camargo, P.H.C.; Cho, E.C.; Tao, J.; Lu, X.; Zhu, Y.; Xia, Y. Pd-Pt Bimetallic Nanodendrites with High Activity for Oxygen Reduction. Science 2009, 324, 1302–1305. [Google Scholar] [CrossRef] [Green Version]
  14. Liu, M.; Zhao, Z.; Duan, X.; Huang, Y. Nanoscale Structure Design for High-Performance Pt-Based ORR Catalysts. Adv. Mater. 2019, 31, 1802234. [Google Scholar] [CrossRef]
  15. Wang, H.-H.; Zhou, Z.-Y.; Yuan, Q.; Tian, N.; Sun, S.-G. Pt nanoparticle netlike-assembly as highly durable and highly active electrocatalyst for oxygen reduction reaction. Chem. Commun. 2011, 47, 3407–3409. [Google Scholar] [CrossRef] [Green Version]
  16. Ando, F.; Tanabe, T.; Gunji, T.; Tsuda, T.; Kaneko, S.; Takeda, T.; Ohsaka, T.; Matsumoto, F. Improvement of ORR Activity and Durability of Pt Electrocatalyst Nanoparticles Anchored on TiO2/Cup-Stacked Carbon Nanotube in Acidic Aqueous Media. Electrochim. Acta 2017, 232, 404–413. [Google Scholar] [CrossRef]
  17. Elezović, N.R.; Babić, B.M.; Radmilovic, V.R.; Vračar, L.M.; Krstajić, N.V. Novel Pt catalyst on ruthenium doped TiO2 support for oxygen reduction reaction. Appl. Catal. B 2013, 140–141, 206–212. [Google Scholar] [CrossRef]
  18. Samad, S.; Loh, K.S.; Wong, W.Y.; Lee, T.K.; Sunarso, J.; Chong, S.T.; Wan Daud, W.R. Carbon and non-carbon support materials for platinum-based catalysts in fuel cells. Int. J. Hydrogen Energy 2018, 43, 7823–7854. [Google Scholar] [CrossRef]
  19. Antolini, E. Iridium As Catalyst and Cocatalyst for Oxygen Evolution/Reduction in Acidic Polymer Electrolyte Membrane Electrolyzers and Fuel Cells. ACS Catal. 2014, 4, 1426–1440. [Google Scholar] [CrossRef]
  20. Zhang, P.; Huang, S.-Y.; Popov, B.N. Mesoporous tin oxide as an oxidation-resistant catalyst support for proton exchange membrane fuel cells. J. Electrochem. Soc. 2010, 157, B1163. [Google Scholar] [CrossRef] [Green Version]
  21. Lv, H.; Mu, S.; Cheng, N.; Pan, M. Nano-silicon carbide supported catalysts for PEM fuel cells with high electrochemical stability and improved performance by addition of carbon. Appl. Catal. B 2010, 100, 190–196. [Google Scholar] [CrossRef]
  22. Paraknowitsch, J.P.; Thomas, A. Doping carbons beyond nitrogen: An overview of advanced heteroatom doped carbons with boron, sulphur and phosphorus for energy applications. Energy Environ. Sci. 2013, 6, 2839–2855. [Google Scholar] [CrossRef] [Green Version]
  23. Wang, Y.; Song, S.; Maragou, V.; Shen, P.K.; Tsiakaras, P. High surface area tungsten carbide microspheres as effective Pt catalyst support for oxygen reduction reaction. Appl. Catal. B 2009, 89, 223–228. [Google Scholar] [CrossRef]
  24. Zhou, Y.; Neyerlin, K.; Olson, T.S.; Pylypenko, S.; Bult, J.; Dinh, H.N.; Gennett, T.; Shao, Z.; O’Hayre, R. Enhancement of Pt and Pt-alloy fuel cell catalyst activity and durability via nitrogen-modified carbon supports. Energy Environ. Sci. 2010, 3, 1437–1446. [Google Scholar] [CrossRef]
  25. Asefa, T.; Huang, X. Heteroatom-Doped Carbon Materials for Electrocatalysis. Chem. Eur. 2017, 23, 10703–10713. [Google Scholar] [CrossRef] [PubMed]
  26. Li, J.-C.; Hou, P.-X.; Liu, C. Heteroatom-Doped Carbon Nanotube and Graphene-Based Electrocatalysts for Oxygen Reduction Reaction. Small 2017, 13, 1702002. [Google Scholar] [CrossRef] [PubMed] [Green Version]
  27. Liang, L.; Xiao, M.; Zhu, J.; Ge, J.; Liu, C.; Xing, W. Low-temperature synthesis of nitrogen doped carbon nanotubes as promising catalyst support for methanol oxidation. J. Energy Chem. 2019, 28, 118–122. [Google Scholar] [CrossRef] [Green Version]
  28. Peera, S.G.; Arunchander, A.; Sahu, A.K. Platinum nanoparticles supported on nitrogen and fluorine co-doped graphite nanofibers as an excellent and durable oxygen reduction catalyst for polymer electrolyte fuel cells. Carbon 2016, 107, 667–679. [Google Scholar] [CrossRef]
  29. Sebastián, D.; Ruíz, A.G.; Suelves, I.; Moliner, R.; Lázaro, M.J.; Baglio, V.; Stassi, A.; Aricò, A.S. Enhanced oxygen reduction activity and durability of Pt catalysts supported on carbon nanofibers. Appl. Catal. B 2012, 115–116, 269–275. [Google Scholar] [CrossRef]
  30. Wang, X.X.; Tan, Z.H.; Zeng, M.; Wang, J.N. Carbon nanocages: A new support material for Pt catalyst with remarkably high durability. Sci. Rep. 2014, 4, 4437. [Google Scholar] [CrossRef] [Green Version]
  31. Vinayan, B.P.; Nagar, R.; Rajalakshmi, N.; Ramaprabhu, S. Novel Platinum–Cobalt Alloy Nanoparticles Dispersed on Nitrogen-Doped Graphene as a Cathode Electrocatalyst for PEMFC Applications. Adv. Funct. Mater. 2012, 22, 3519–3526. [Google Scholar] [CrossRef]
  32. Bang, G.S.; Shim, G.W.; Shin, G.H.; Jung, D.Y.; Park, H.; Hong, W.G.; Choi, J.; Lee, J.; Choi, S.-Y. Pyridinic-N-Doped Graphene Paper from Perforated Graphene Oxide for Efficient Oxygen Reduction. ACS Omega 2018, 3, 5522–5530. [Google Scholar] [CrossRef]
  33. Li, Z.; Gao, Q.; Zhang, H.; Tian, W.; Tan, Y.; Qian, W.; Liu, Z. Low content Pt nanoparticles anchored on N-doped reduced graphene oxide with high and stable electrocatalytic activity for oxygen reduction reaction. Sci. Rep. 2017, 7, 43352. [Google Scholar] [CrossRef] [Green Version]
  34. Guo, L.; Jiang, W.-J.; Zhang, Y.; Hu, J.-S.; Wei, Z.-D.; Wan, L.-J. Embedding Pt Nanocrystals in N-Doped Porous Carbon/Carbon Nanotubes toward Highly Stable Electrocatalysts for the Oxygen Reduction Reaction. ACS Catal. 2015, 5, 2903–2909. [Google Scholar] [CrossRef]
  35. Prithi, J.A.; Rajalakshmi, N.; Ranga Rao, G. Nitrogen doped mesoporous carbon supported Pt electrocatalyst for oxygen reduction reaction in proton exchange membrane fuel cells. Int. J. Hydrogen Energy 2018, 43, 4716–4725. [Google Scholar] [CrossRef]
  36. Quílez-Bermejo, J.; Melle-Franco, M.; San-Fabián, E.; Morallón, E.; Cazorla-Amorós, D. Towards understanding the active sites for the ORR in N-doped carbon materials through fine-tuning of nitrogen functionalities: An experimental and computational approach. J. Mater. Chem. A 2019, 7, 24239–24250. [Google Scholar] [CrossRef] [Green Version]
  37. Elangovan, A.; Xu, J.; Brown, E.; Liu, B.; Li, J. Fundamental Electrochemical Insights of Vertically Aligned Carbon Nanofiber Architecture as a Catalyst Support for ORR. J. Electrochem. Soc. 2020, 167, 066523. [Google Scholar] [CrossRef]
  38. Elangovan, A.; Xu, J.; Sekar, A.; Liu, B.; Li, J. Enhancing Methanol Oxidation Reaction with Platinum-based Catalysts using a N-Doped Three-dimensional Graphitic Carbon Support. ChemCatChem 2020, 12, 6000–6012. [Google Scholar] [CrossRef]
  39. Guo, D.; Shibuya, R.; Akiba, C.; Saji, S.; Kondo, T.; Nakamura, J. Active sites of nitrogen-doped carbon materials for oxygen reduction reaction clarified using model catalysts. Science 2016, 351, 361–365. [Google Scholar] [CrossRef] [PubMed]
  40. Cruden, B.A.; Cassell, A.M.; Ye, Q.; Meyyappan, M. Reactor design considerations in the hot filament/direct current plasma synthesis of carbon nanofibers. J. Appl. Phys. 2003, 94, 4070–4078. [Google Scholar] [CrossRef]
  41. Chen, Y.; Elangovan, A.; Zeng, D.; Zhang, Y.; Ke, H.; Li, J.; Sun, Y.; Cheng, H. Vertically Aligned Carbon Nanofibers on Cu Foil as a 3D Current Collector for Reversible Li Plating/Stripping toward High-Performance Li–S Batteries. Adv. Funct. Mater. 2020, 30, 1906444. [Google Scholar] [CrossRef]
  42. Kresse, G.; Furthmüller, J. Efficient iterative schemes for ab initio total-energy calculations using a plane-wave basis set. Phys. Rev. B 1996, 54, 11169–11186. [Google Scholar] [CrossRef] [PubMed]
  43. Perdew, J.P.; Burke, K.; Ernzerhof, M. Generalized Gradient Approximation Made Simple. Phys. Rev. Lett. 1996, 77, 3865–3868. [Google Scholar] [CrossRef] [Green Version]
  44. Blöchl, P.E. Projector augmented-wave method. Phys. Rev. B 1994, 50, 17953–17979. [Google Scholar] [CrossRef] [Green Version]
  45. Monkhorst, H.J.; Pack, J.D. Special points for Brillouin-zone integrations. Phys. Rev. B 1976, 13, 5188–5192. [Google Scholar] [CrossRef]
  46. Grimme, S.; Antony, J.; Ehrlich, S.; Krieg, H. A consistent and accurate ab initio parametrization of density functional dispersion correction (DFT-D) for the 94 elements H-Pu. J. Chem. Phys. 2010, 132, 154104. [Google Scholar] [CrossRef] [Green Version]
  47. Hunter, M.A.; Fischer, J.M.T.A.; Yuan, Q.; Hankel, M.; Searles, D.J. Evaluating the Catalytic Efficiency of Paired, Single-Atom Catalysts for the Oxygen Reduction Reaction. ACS Catal. 2019, 9, 7660–7667. [Google Scholar] [CrossRef] [Green Version]
  48. Meng, Y.; Yin, C.; Li, K.; Tang, H.; Wang, Y.; Wu, Z. Improved Oxygen Reduction Activity in Heteronuclear FeCo-Codoped Graphene: A Theoretical Study. ACS Sustain. Chem. Eng 2019, 7, 17273–17281. [Google Scholar] [CrossRef]
  49. He, F.; Li, H.; Ding, Y.; Li, K.; Wang, Y.; Wu, Z. The oxygen reduction reaction on graphitic carbon nitride supported single Ce atom and CexPt6-x cluster catalysts from first-principles. Carbon 2018, 130, 636–644. [Google Scholar] [CrossRef]
  50. Xu, J.; Liu, B. Intrinsic properties of nitrogen-rich carbon nitride for oxygen reduction reaction. Appl. Surf. Sci. 2020, 500, 144020. [Google Scholar] [CrossRef]
  51. Xu, J.; Elangovan, A.; Li, J.; Liu, B. Graphene-Based Dual-Metal Sites for Oxygen Reduction Reaction: A Theoretical Study. J. Phys. Chem. C 2021, 125, 2334–2344. [Google Scholar] [CrossRef]
  52. Bae, G.; Youn, D.H.; Han, S.; Lee, J.S. The role of nitrogen in a carbon support on the increased activity and stability of a Pt catalyst in electrochemical hydrogen oxidation. Carbon 2013, 51, 274–281. [Google Scholar] [CrossRef]
  53. Ganguly, A.; Sharma, S.; Papakonstantinou, P.; Hamilton, J. Probing the Thermal Deoxygenation of Graphene Oxide Using High-Resolution In Situ X-ray-Based Spectroscopies. J. Phys. Chem.C 2011, 115, 17009–17019. [Google Scholar] [CrossRef] [Green Version]
  54. Jeerage, K.M.; Candelaria, S.L.; Stavis, S.M. Rapid Synthesis and Correlative Measurements of Electrocatalytic Nickel/Iron Oxide Nanoparticles. Sci. Rep. 2018, 8, 4584. [Google Scholar] [CrossRef] [PubMed]
  55. Ma, J.; Habrioux, A.; Luo, Y.; Ramos-Sanchez, G.; Calvillo, L.; Granozzi, G.; Balbuena, P.B.; Alonso-Vante, N. Electronic interaction between platinum nanoparticles and nitrogen-doped reduced graphene oxide: Effect on the oxygen reduction reaction. J. Mater. Chem. A 2015, 3, 11891–11904. [Google Scholar] [CrossRef]
  56. Xiong, Y.; Ma, Y.; Zou, L.; Han, S.; Chen, H.; Wang, S.; Gu, M.; Shen, Y.; Zhang, L.; Xia, Z.; et al. N-doping induced tensile-strained Pt nanoparticles ensuring an excellent durability of the oxygen reduction reaction. J. Catal. 2020, 382, 247–255. [Google Scholar] [CrossRef]
Figure 1. TEM image of bare VACNF (a) before and (b) after plasma annealing for 5 min at 550 °C. TEM image of Pt/N-VACNF PA 5 min (43.0 μg/cm2) at (c) low and (d) high magnification. The red arrow indicates the Pt NPs deposited on the sidewalls; (e) HAADF-STEM image and (fj) STEM-EDS elemental mapping of N-VACNF PA 15 min.
Applnano 02 00022 g001
Figure 2. N 1s XPS spectra of (a) bare VACNF, (b) N-VACNF PA 5 min, (c) N-VACNF PA 15 min, and (d) N-VACNF PA 30 min; Pt 4f XPS spectra for (e) Pt/N-VACNF and (f) Pt/C.
Applnano 02 00022 g002
Figure 3. (a) Atomic% of different types of nitrogen, (b) ratio of C to N, and (c) atomic% of different types of oxygen in bare VACNF and VACNF samples plasma annealed for different time intervals.
Applnano 02 00022 g003
Figure 4. Cyclic voltammogram of (a) N-VACNF PA 5 min and (b) 43.0 Pt/N-VACNF recorded in Ar-saturated (black line) and O2-saturated (blue line) 0.10 M KOH solution at a scan rate of 50 mV/s; LSV curves recorded at a scan rate of 10 mV/s and a rotation speed of 1600 rpm (c) for various N doped VACNF catalysts and (d), bare graphite paper, bare VACNF, N-VACNF PA 5 min, Pt/N-VACNF (43.0 μg/cm2), and Pt/C (51.2 μg/cm2). The purple dash line marks the zero current density.
Applnano 02 00022 g004
Figure 5. (a) Molecular structures of the most stable ORR intermediates over Pt/NpVACNF; (b) Free energy diagram of the 4-e pathway for ORR on Pt/NpVACNF (pink) compared with Pt (111) (red) and Pt/VACNF (blue) by both associative (dotted) and dissociative (solid) mechanisms. Color code: blue-Pt, gray-C, purple-N, red-O, white-H.
Applnano 02 00022 g005
Figure 6. LSV curves of (a) Pt/C (51.2 µg/cm2) and (b) Pt/N-VACNF (43.0 µg/cm2) after every 1000 AST cycles in O2-saturated 0.10 M KOH solution at a scan rate of 10 mV/s and a rotation speed of 1600 rpm; (c) Change in the half-wave potential of the LSV curves vs. the number of AST cycles for all the catalysts.
Applnano 02 00022 g006
Figure 7. (a) Amperometric j-t curve of Pt/C (51.2 µg/cm2) and Pt/N-VACNF (43.0 µg/cm2) recorded at 1600 rpm in O2-saturated 0.10 M KOH solution with successive addition of 3.0 M methanol to the final concentration of 0.75 M at the potential of –0.1 V (vs. Hg/HgO); (b) LSV curves recorded at a scan rate of 10 mV/s and 1600 rpm in 0.10 M KOH + 0.75 M MeOH for Pt/C (51.2 µg/cm2) and Pt/N-VACNF (43.0 µg/cm2). The purple dash line marks the zero current density.
Applnano 02 00022 g007
Publisher’s Note: MDPI stays neutral with regard to jurisdictional claims in published maps and institutional affiliations.

