
Determining the Oxidation Stability of Electrolytes for Lithium-Ion Batteries Using Quantum Chemistry and Molecular Dynamics

 , ,
, ,  , , and
Abstract
:1. Introduction
2. Materials and Methods
2.1. Theoretical Parts
2.1.1. Molecular Dynamic Simulations
2.1.2. Quantum Chemistry Calculations
2.2. Experimental Part
3. Results
3.1. Molecular–Dynamic Results
3.2. QC Calculations Results
3.2.1. Structures of Complexes and Thermodynamic Parameters
Complexes {Li+DFOB−}(DMC)n(EC)m (n, m = 1, 2)
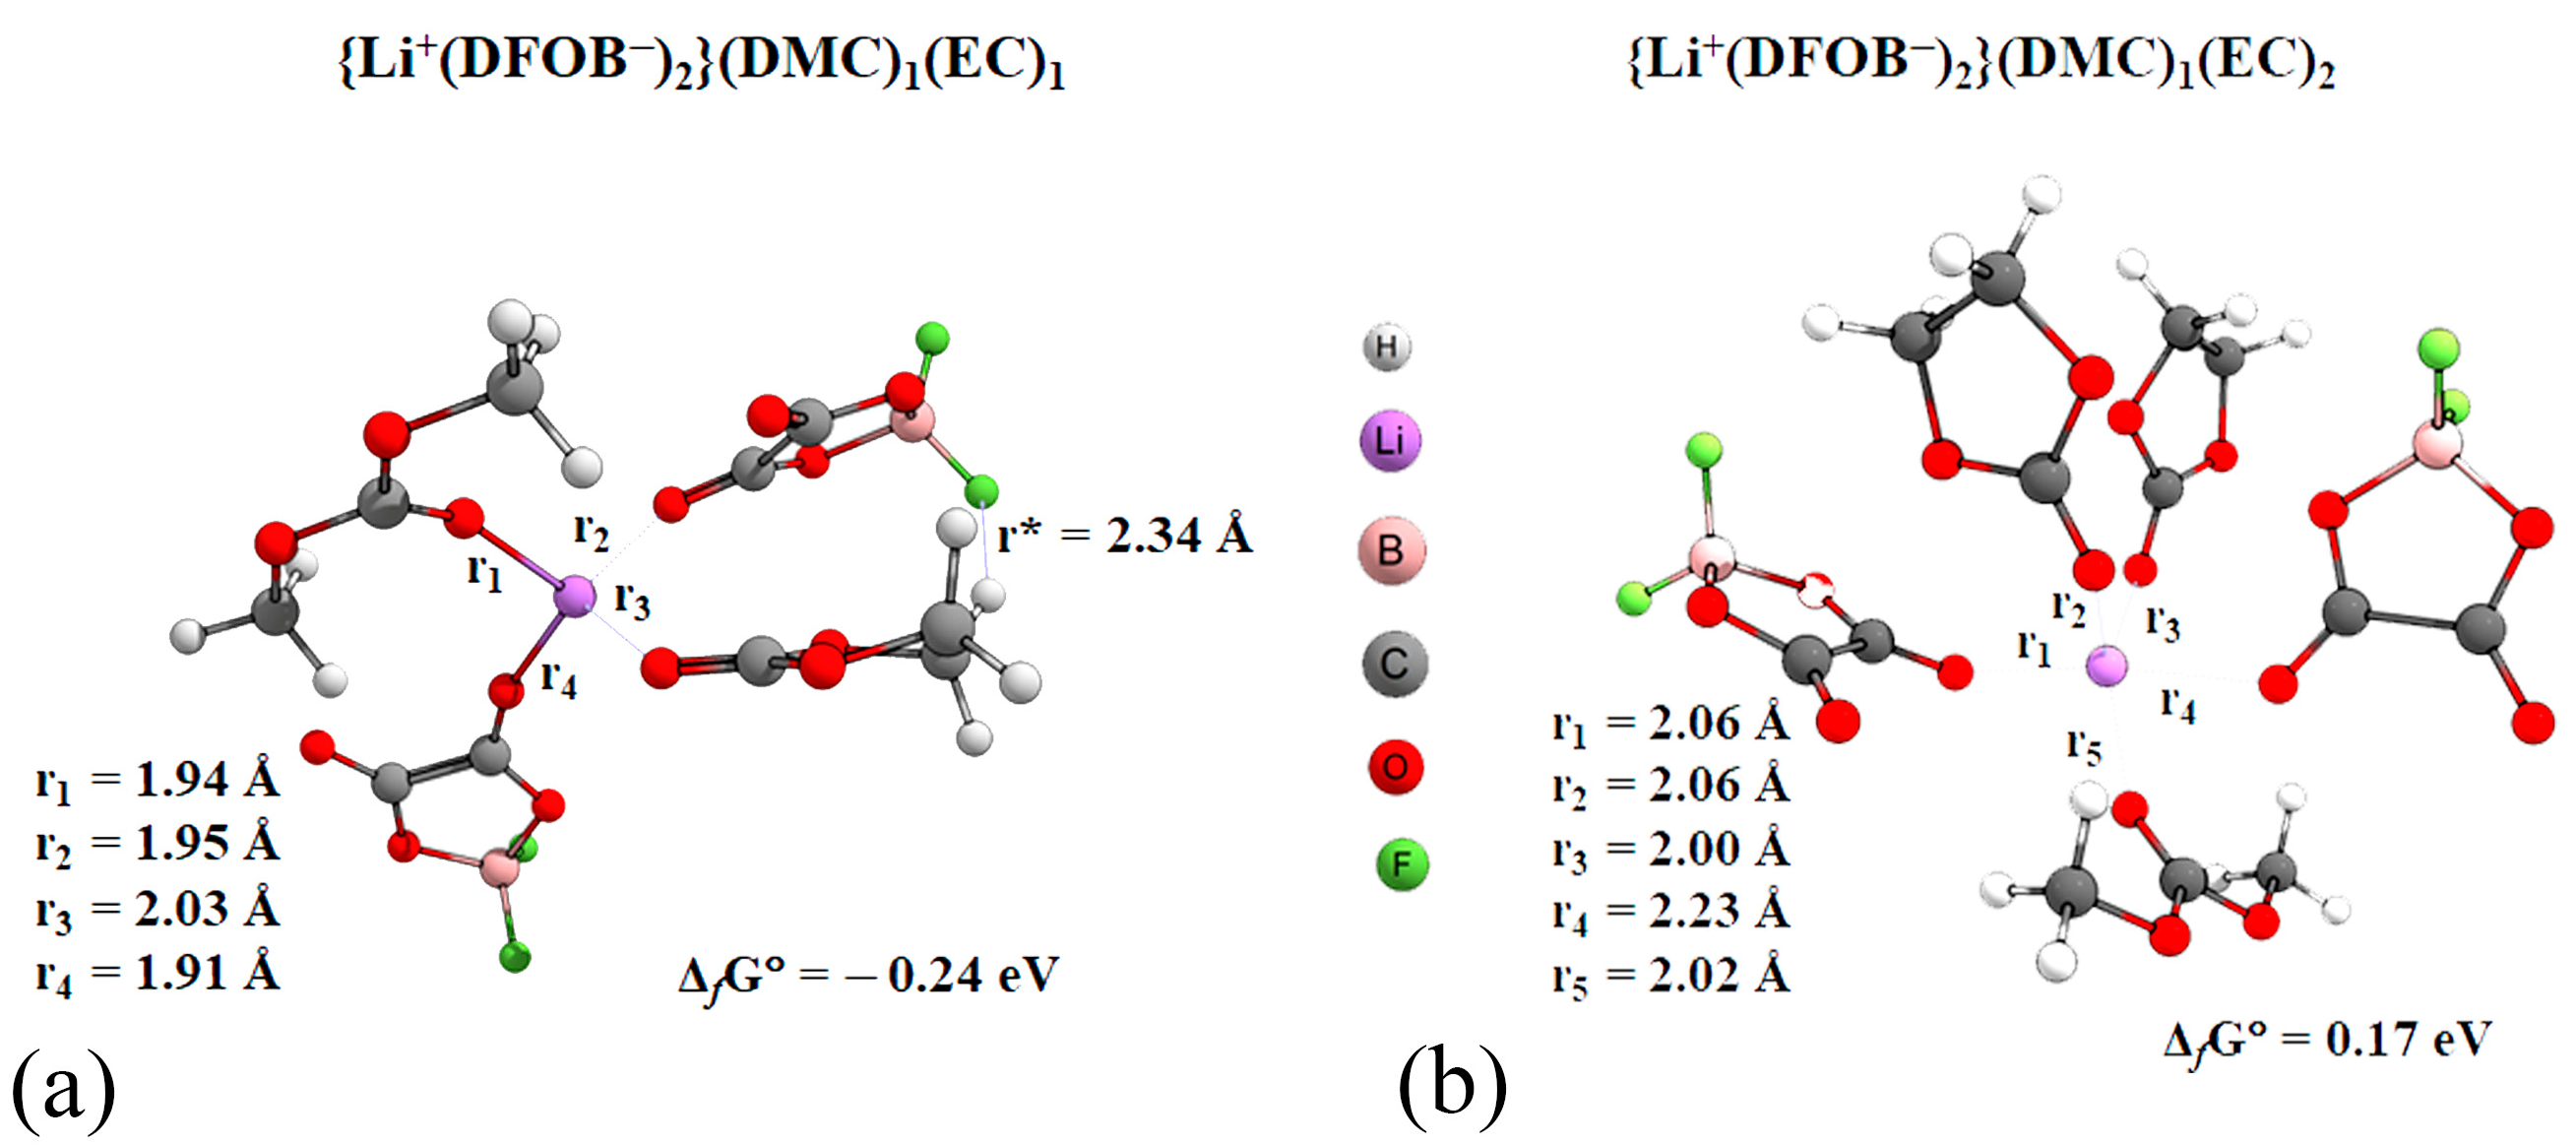
Complexes {Li+(DFOB−)2}(DMC)n(EC)m (n, m = 1, 2)
NMR Study
3.2.2. Oxidation Potential
4. Discussion
5. Conclusions
- (1)
- Creation of a model system based on experimental data.
- (2)
- Molecular dynamic simulations for each model system for at least 50 ns, including system equilibration. The adequacy of the models used can be assessed by calculating the system density.
- (3)
- A thorough analysis of molecular dynamic simulations to evaluate the environment of each lithium cation throughout the simulation time.
- (4)
- Selection of statistically significant complexes, optimization of their geometric parameters and calculation of energy parameters using quantum chemistry methods.
- (5)
- Assessment of the additive value of the oxidative potential, taking into account the proportion of complexes of each type.
Supplementary Materials
Author Contributions
Funding
Data Availability Statement
Acknowledgments
Conflicts of Interest
Appendix A

| Complex | ΔfGoinc, eV | IP, eV | ΔEox, V |
|---|---|---|---|
| Nonsolvent ionic pair {Li+DFOB−} | −0.64 | 10.50 | 6.95 |
| {Li+DFOB−}(DMC)1 | −0.20 | 9.99 | 6.91 |
| {Li+DFOB−}(EC)1 | −0.23 | 9.74 | 7.52 |
| {Li+DFOB−}(DMC)2 {Li+DFOB−}(DMC)1 + DMC ⮀ {Li+DFOB−}(DMC)2 | −0.28 | 9.55 | 6.78 |
| {Li+DFOB−}(DMC)1(EC)1 {Li+DFOB−}(EC)1 + DMC ⮀ {Li+DFOB−}(EC)1(DMC)1 | 0.05 | 9.25 | 6.50 |
| {Li+DFOB−}(DMC)1 + EC ⮀ {Li+DFOB−}(DMC)1(EC)1 | 0.03 | ||
| {Li+DFOB−}(DMC)2(EC)1 {Li+DFOB−}(DMC)1(EC)1 + DMC ⮀ {Li+DFOB−}(DMC)2(EC)1 | 0.09 | 9.05 | 6.32 |
| {Li+DFOB−}(DMC)1(EC)2 {Li+DFOB−}(DMC)1(EC)1 + EC ⮀ {Li+DFOB−}(DMC)1(EC)2 | 0.11 | 8.95 | 6.39 |
| {Li+DFOB−}(DMC)2(EC)2 {Li+DFOB−}(DMC)1(EC)2 + DMC ⮀ {Li+DFOB−}(DMC)2(EC)2 | 0.31 | 8.83 | 6.31 |
| {Li+DFOB−}(DMC)2(EC)1 + EC ⮀ {Li+DFOB−}(DMC)2(EC)2 | 0.33 | ||
| {Li+(DFOB−)2−}(DMC)1(EC)1 {Li+(DFOB−)2−} (DMC)1 + EC ⮀ {Li+(DFOB−)2−}(DMC)1(EC)1 | 0.10 | 5.94 | 6.14 |
| {Li+DFOB−} (DMC)1(EC)1 + DFOB− ⮀ {Li+(DFOB−)2−}(DMC)1(EC)1 | 0.31 | ||
| {Li+(DFOB−)2−} (EC)1 + DMC ⮀ {Li+(DFOB−)2−}(DMC)1(EC)1 | 0.20 | ||
| {Li+(DFOB−)2−}(DMC)1(EC)2 {Li+DFOB−} (DMC)1(EC)2 + DFOB− ⮀ {Li+(DFOB−)2−}(DMC)1(EC)1 | 0.61 | 5.94 | 5.81 |
| {Li+(DFOB−)2−} (DMC)1(EC)1 + EC ⮀ {Li+(DFOB−)2−}(DMC)1(EC)2 | 0.41 |
References
- Choi, J.W.; Aurbach, D. Promise and reality of post-lithium-ion batteries with high energy densities. Nat. Rev. Mater. 2016, 1, 16013. [Google Scholar] [CrossRef]
- Xiang, J.; Wei, Y.; Zhong, Y.; Yang, Y.; Cheng, H.; Yuan, L.; Xu, H.; Huang, Y. Building Practical High-Voltage Cathode Materials for Lithium-Ion Batteries. Adv. Mater. 2022, 34, e2200912. [Google Scholar] [CrossRef]
- Lee, W.; Muhammad, S.; Sergey, C.; Lee, H.; Yoon, J.; Kang, Y.; Yoon, W. Advances in the Cathode Materials for Lithium Rechargeable Batteries. Angew. Chemie Int. Ed. 2020, 59, 2578–2605. [Google Scholar] [CrossRef]
- Guo, K.; Qi, S.; Wang, H.; Huang, J.; Wu, M.; Yang, Y.; Li, X.; Ren, Y.; Ma, J. High-Voltage Electrolyte Chemistry for Lithium Batteries. Small Sci. 2022, 2, 2100107. [Google Scholar] [CrossRef]
- Zhong, Q.; Bonakdarpour, A.; Zhang, M.; Gao, Y.; Dahn, J.R. Synthesis and Electrochemistry of LiNixMn2−xO4. J. Electrochem. Soc. 1997, 144, 205–213. [Google Scholar] [CrossRef]
- Santhanam, R.; Rambabu, B. Research progress in high voltage spinel LiNi0.5Mn1.5O4 material. J. Power Sources 2010, 195, 5442–5451. [Google Scholar] [CrossRef]
- Amine, K. Olivine LiCoPO4 as 4.8 V Electrode Material for Lithium Batteries. Electrochem. Solid-State Lett. 1999, 3, 178. [Google Scholar] [CrossRef]
- Brutti, S.; Panero, S. Recent Advances in the Development of LiCoPO4 as High Voltage Cathode Material for Li-Ion Batteries. In Nanotechnology for Sustainable Energy; ACS Publications: Washington, DC, USA, 2013; pp. 67–99. [Google Scholar] [CrossRef]
- Wu, J.; Tsai, C.-J. Qualitative modeling of the electrolyte oxidation in long-term cycling of LiCoPO4 for high-voltage lithium-ion batteries. Electrochim. Acta 2021, 368, 137585. [Google Scholar] [CrossRef]
- Sreedeep, S.; Natarajan, S.; Aravindan, V. Recent advancements in LiCoPO4 cathodes using electrolyte additives. Curr. Opin. Electrochem. 2022, 31, 100868. [Google Scholar] [CrossRef]
- Okada, S.; Ueno, M.; Uebou, Y.; Yamaki, J. Fluoride phosphate Li2CoPO4F as a high-voltage cathode in Li-ion batteries. J. Power Sources 2005, 146, 565–569. [Google Scholar] [CrossRef]
- Wu, X.; Gong, Z.; Tan, S.; Yang, Y. Sol–gel synthesis of Li2CoPO4F/C nanocomposite as a high power cathode material for lithium ion batteries. J. Power Sources 2012, 220, 122–129. [Google Scholar] [CrossRef]
- Jung, S.-K.; Kim, H.; Cho, M.G.; Cho, S.-P.; Lee, B.; Kim, H.; Park, Y.-U.; Hong, J.; Park, K.-Y.; Yoon, G.; et al. Lithium-free transition metal monoxides for positive electrodes in lithium-ion batteries. Nat. Energy 2017, 2, 16208. [Google Scholar] [CrossRef]
- Kothalawala, V.N.; Devi, A.A.S.; Nokelainen, J.; Alatalo, M.; Barbiellini, B.; Hu, T.; Lassi, U.; Suzuki, K.; Sakurai, H.; Bansil, A. First Principles Calculations of the Optical Response of LiNiO2. Condens. Matter 2022, 7, 54. [Google Scholar] [CrossRef]
- Kothalawala, V.N.; Suzuki, K.; Nokelainen, J.; Hyvönen, A.; Makkonen, I.; Barbiellini, B.; Hafiz, H.; Tynjälä, P.; Laine, P.; Välikangas, J.; et al. Compton scattering study of strong orbital delocalization in a LiNiO2 cathode. Phys. Rev. B 2024, 109, 035139. [Google Scholar] [CrossRef]
- Zhao, W.; Ji, Y.; Zhang, Z.; Lin, M.; Wu, Z.; Zheng, X.; Li, Q.; Yang, Y. Recent advances in the research of functional electrolyte additives for lithium-ion batteries. Curr. Opin. Electrochem. 2017, 6, 84–91. [Google Scholar] [CrossRef]
- Han, J.; Kim, K.; Lee, Y.; Choi, N. Scavenging Materials to Stabilize LiPF6-Containing Carbonate-Based Electrolytes for Li-Ion Batteries. Adv. Mater. 2019, 31, e1804822. [Google Scholar] [CrossRef]
- Xu, K. Electrolytes and Interphases in Li-Ion Batteries and Beyond. Chem. Rev. 2014, 114, 11503–11618. [Google Scholar] [CrossRef]
- Aurbach, D.; Markovsky, B.; Salitra, G.; Markevich, E.; Talyossef, Y.; Koltypin, M.; Nazar, L.; Ellis, B.; Kovacheva, D. Review on electrode–electrolyte solution interactions, related to cathode materials for Li-ion batteries. J. Power Sources 2007, 165, 491–499. [Google Scholar] [CrossRef]
- Fan, X.; Wang, C. High-voltage liquid electrolytes for Li batteries: Progress and perspectives. Chem. Soc. Rev. 2021, 50, 10486–10566. [Google Scholar] [CrossRef]
- Chen, M.; Huang, Y.; Shi, Z.; Luo, H.; Liu, Z.; Shen, C. Effect of High-Voltage Additives on Formation of Solid Electrolyte Interphases in Lithium-Ion Batteries. Materials 2022, 15, 3662. [Google Scholar] [CrossRef]
- Zhang, K.; Tian, Y.; Wei, C.; An, Y.; Feng, J. Building stable solid electrolyte interphases (SEI) for microsized silicon anode and 5 V-class cathode with salt engineered nonflammable phosphate-based lithium-ion battery electrolyte. Appl. Surf. Sci. 2021, 553, 149566. [Google Scholar] [CrossRef]
- Zhou, H.; Xiao, K.; Li, J. Lithium difluoro(oxalate)borate and LiBF4 blend salts electrolyte for LiNi0.5Mn1.5O4 cathode material. J. Power Sources 2016, 302, 274–282. [Google Scholar] [CrossRef]
- Zhang, S.S. Electrochemical study of the formation of a solid electrolyte interface on graphite in a LiBC2O4F2-based electrolyte. J. Power Sources 2007, 163, 713–718. [Google Scholar] [CrossRef]
- Nie, M.; Lucht, B.L. Role of Lithium Salt on Solid Electrolyte Interface (SEI) Formation and Structure in Lithium Ion Batteries. J. Electrochem. Soc. 2014, 161, A1001–A1006. [Google Scholar] [CrossRef]
- Park, K.; Yu, S.; Lee, C.; Lee, H. Comparative study on lithium borates as corrosion inhibitors of aluminum current collector in lithium bis(fluorosulfonyl)imide electrolytes. J. Power Sources 2015, 296, 197–203. [Google Scholar] [CrossRef]
- Shkrob, I.A.; Zhu, Y.; Marin, T.W.; Abraham, D.P. Mechanistic Insight into the Protective Action of Bis(oxalato)borate and Difluoro(oxalate)borate Anions in Li-Ion Batteries. J. Phys. Chem. C 2013, 117, 23750–23756. [Google Scholar] [CrossRef]
- Xiang, J.; Wu, F.; Chen, R.; Li, L.; Yu, H. High voltage and safe electrolytes based on ionic liquid and sulfone for lithium-ion batteries. J. Power Sources 2013, 233, 115–120. [Google Scholar] [CrossRef]
- Borodin, O.; Behl, W.; Jow, T.R. Oxidative Stability and Initial Decomposition Reactions of Carbonate, Sulfone, and Alkyl Phosphate-Based Electrolytes. J. Phys. Chem. C 2013, 117, 8661–8682. [Google Scholar] [CrossRef]
- Delp, S.A.; Borodin, O.; Olguin, M.; Eisner, C.G.; Allen, J.L.; Jow, T.R. Importance of Reduction and Oxidation Stability of High Voltage Electrolytes and Additives. Electrochim. Acta 2016, 209, 498–510. [Google Scholar] [CrossRef]
- Zhao, D.; Wang, P.; Cui, X.; Mao, L.; Li, C.; Li, S. Robust and sulfur-containing ingredient surface film to improve the electrochemical performance of LiDFOB-based high-voltage electrolyte. Electrochim. Acta 2018, 260, 536–548. [Google Scholar] [CrossRef]
- Li, B.; Shao, Y.; He, J.; Chen, R.; Huang, S.; Wu, Z.; Li, J.; Wang, Z.; Liu, G. Cyclability improvement of high voltage lithium cobalt oxide/graphite battery by use of lithium difluoro(oxalate)borate electrolyte additive. Electrochim. Acta 2022, 426, 140783. [Google Scholar] [CrossRef]
- Zhang, J.; Zhang, H.; Deng, L.; Yang, Y.; Tan, L.; Niu, X.; Chen, Y.; Zeng, L.; Fan, X.; Zhu, Y. An additive-enabled ether-based electrolyte to realize stable cycling of high-voltage anode-free lithium metal batteries. Energy Storage Mater. 2023, 54, 450–460. [Google Scholar] [CrossRef]
- Sanginov, E.A.; Borisevich, S.S.; Kayumov, R.R.; Istomina, A.S.; Evshchik, E.Y.; Reznitskikh, O.G.; Yaroslavtseva, T.V.; Melnikova, T.I.; Dobrovolsky, Y.A.; Bushkova, O.V. Lithiated Nafion plasticised by a mixture of ethylene carbonate and sulfolane. Electrochim. Acta 2021, 373, 137914. [Google Scholar] [CrossRef]
- Dobrovolsky, Y.A.; Ilyina, M.G.; Evshchik, E.Y.; Khamitov, E.M.; Chernyak, A.V.; Shikhovtseva, A.V.; Melnikova, T.I.; Bushkova, O.V.; Borisevich, S.S. QC and MD Modelling for Predicting the Electrochemical Stability Window of Electrolytes: New Estimating Algorithm. Batteries 2022, 8, 292. [Google Scholar] [CrossRef]
- Ikeguchi, M. Partial rigid-body dynamics in NPT, NPAT and NPγT ensembles for proteins and membranes. J. Comput. Chem. 2004, 25, 529–541. [Google Scholar] [CrossRef]
- Bowers, K.J.; Chow, E.; Xu, H.; Dror, R.O.; Eastwood, M.P.; Gregersen, B.A.; Klepeis, J.L.; Kolossvary, I.; Moraes, M.A.; Sacerdoti, F.D.; et al. Scalable algorithms for molecular dynamics simulations on commodity clusters. In Proceedings of the 2006 ACM/IEEE Conference on Supercomputing, Tampa, FL, USA, 11–17 November 2006. [Google Scholar] [CrossRef]
- Lu, C.; Wu, C.; Ghoreishi, D.; Chen, W.; Wang, L.; Damm, W.; Ross, G.A.; Dahlgren, M.K.; Russell, E.; Bargen, C.D.; et al. OPLS4: Improving Force Field Accuracy on Challenging Regimes of Chemical Space. J. Chem. Theory Comput. 2021, 17, 4291–4300. [Google Scholar] [CrossRef]
- Humphrey, W.; Dalke, A.; Schulten, K. VMD: Visual molecular dynamics. J. Mol. Graph. 1996, 14, 33–38. [Google Scholar] [CrossRef]
- Zhao, Y.; Schultz, N.E.; Truhlar, D.G. Design of Density Functionals by Combining the Method of Constraint Satisfaction with Parametrization for Thermochemistry, Thermochemical Kinetics, and Noncovalent Interactions. J. Chem. Theory Comput. 2006, 2, 364–382. [Google Scholar] [CrossRef]
- Schäfer, A.; Huber, C.; Ahlrichs, R. Fully optimized contracted Gaussian basis sets of triple zeta valence quality for atoms Li to Kr. J. Chem. Phys. 1994, 100, 5829–5835. [Google Scholar] [CrossRef]
- Marenich, A.V.; Cramer, C.J.; Truhlar, D.G. Universal Solvation Model Based on Solute Electron Density and on a Continuum Model of the Solvent Defined by the Bulk Dielectric Constant and Atomic Surface Tensions. J. Phys. Chem. B 2009, 113, 6378–6396. [Google Scholar] [CrossRef]
- Borodin, O.; Jow, T.R. Quantum Chemistry Study of the Oxidation-Induced Decomposition of Tetramethylene Sulfone (TMS) Dimer and TMS/BF4−. ECS Trans. 2013, 50, 391–398. [Google Scholar] [CrossRef]
- Chatfield, D.; Christopher, J. Cramer: Essentials of Computational Chemistry: Theories and Models. Theor. Chem. Accounts Theory Comput. Model. 2002, 108, 367–368. [Google Scholar] [CrossRef]
- Li, S.; Liu, Q.; Zhang, W.; Fan, L.; Wang, X.; Wang, X.; Shen, Z.; Zang, X.; Zhao, Y.; Ma, F.; et al. High-Efficacy and Polymeric Solid-Electrolyte Interphase for Closely Packed Li Electrodeposition. Adv. Sci. 2021, 8, 2003240. [Google Scholar] [CrossRef]


| [LiDFOB], mol/kg | EC/DMC | ||||
|---|---|---|---|---|---|
| Ratio | Probable Composition of the Complexes | N, % | |||
| (DFOB)− | DMC | EC | |||
| 0.5 | 1 | 1 | 1 | {Li+DFOB−}(DMC)1(EC)1 | 69 |
| 2 | 1 | 2 | {Li+DFOB−} *(DMC)1(EC)2 {Li+(DFOB−)2−}(DMC)1(EC)2 | 19 | |
| 1 | 2 | 1 | {Li+DFOB−}(DMC)2(EC)1 | 12 | |
| 0.75 | 1 | 1 | 1 | {Li+DFOB−}(DMC)1(EC)1 | 63 |
| 1 | 2 | 2 | {Li+DFOB−}(DMC)2(EC)2 | 24 | |
| 1 | 1 | 2 | {Li+DFOB−}(DMC)1(EC)2 | 13 | |
| 1.0 | 1 | 1 | 1 | {Li+DFOB−}(DMC)1(EC)1 | 24 |
| 1 | 1 | 2 | {Li+DFOB−}(DMC)1(EC)2 | 76 | |
Disclaimer/Publisher’s Note: The statements, opinions and data contained in all publications are solely those of the individual author(s) and contributor(s) and not of MDPI and/or the editor(s). MDPI and/or the editor(s) disclaim responsibility for any injury to people or property resulting from any ideas, methods, instructions or products referred to in the content. |
© 2024 by the authors. Licensee MDPI, Basel, Switzerland. This article is an open access article distributed under the terms and conditions of the Creative Commons Attribution (CC BY) license (https://creativecommons.org/licenses/by/4.0/).
Share and Cite
Evshchik, E.Y.; Borisevich, S.S.; Ilyina, M.G.; Khamitov, E.M.; Chernyak, A.V.; Pugacheva, T.A.; Kolmakov, V.G.; Bushkova, O.V.; Dobrovolsky, Y.A. Determining the Oxidation Stability of Electrolytes for Lithium-Ion Batteries Using Quantum Chemistry and Molecular Dynamics. Electrochem 2024, 5, 107-123. https://doi.org/10.3390/electrochem5010007
Evshchik EY, Borisevich SS, Ilyina MG, Khamitov EM, Chernyak AV, Pugacheva TA, Kolmakov VG, Bushkova OV, Dobrovolsky YA. Determining the Oxidation Stability of Electrolytes for Lithium-Ion Batteries Using Quantum Chemistry and Molecular Dynamics. Electrochem. 2024; 5(1):107-123. https://doi.org/10.3390/electrochem5010007
Chicago/Turabian StyleEvshchik, Elizaveta Y., Sophia S. Borisevich, Margarita G. Ilyina, Edward M. Khamitov, Alexander V. Chernyak, Tatiana A. Pugacheva, Valery G. Kolmakov, Olga V. Bushkova, and Yuri A. Dobrovolsky. 2024. "Determining the Oxidation Stability of Electrolytes for Lithium-Ion Batteries Using Quantum Chemistry and Molecular Dynamics" Electrochem 5, no. 1: 107-123. https://doi.org/10.3390/electrochem5010007