
Electrochemical Digitization of Biological Fluids Samples


Independent Researcher, Vasilieva Str. 3, 15, 459770 Snehinsk, Russia
Electrochem 2022, 3(4), 653-667; https://doi.org/10.3390/electrochem3040043
Submission received: 30 July 2022
/
Revised: 9 September 2022
/
Accepted: 26 September 2022
/
Published: 9 October 2022
(This article belongs to the Special Issue Emerging Trends of Electrochemical Sensors in Food Analysis)
Abstract
:Digital medicine based on the integration of all medical data from a particular patient has become a reality today, thanks to information technology. Traditional medical examinations can be supplemented by assessment results of the oxidative-anti-oxidative (OAO) status of the body. Electrochemical sensors are able to not only determine the integral indicators of the OAO system of the body but also to depict details of the processes occurring in the system. The main obstacle to the widespread use of electrochemical sensors in medical diagnostics is the extremely small amount of received information in comparison to the tens of thousands of known human diseases. The problem can be eliminated only by rethinking the purpose of electrochemical measurement within the framework of thermodynamics of information processes and information theory. In the information paradigm of electrochemical analysis of biological fluids, a sample is considered an electrochemical message created by a sensor. The purpose of electrochemical measurement is to obtain information in a volume sufficient to identify the sample composition within the range of possible concentrations of its components. The fundamentals of the thermodynamics of information processes are considered and conclusions that are of practical importance for the development of electrochemical sensors and analyzers are derived. It is shown that the potentiostatic control of the sensor is physically impacted by the electromechanical instability of the electrical double layer, which is the main source of sensor signal noise. Estimates of a minimum amount of analytical signal information required for the identification of a sample of known composition, such as a biological fluid, are provided. Examples of highly informative analytical signals for flowing and stationary samples are presented. Problems related to the visualization of such signals are noted.
Keywords:
electrochemistry; analytical signal; noise; trends; identification; classification; fluids samples1. Introduction
The pandemic has highlighted the serious problems of world medicine—insufficient resources, and an unprecedented burden on doctors. Telemedicine techniques and basic home gadgets, such as pulse oximeters, not to mention effective portable home diagnostic devices, could really help people. Such devices should be simple, affordable and safe. Electrochemical sensors have long been successfully used for such purposes, for example, most glucometers have electrochemical sensors. However, the diagnostic and prognostic potential of electroanalytics, in comparison with the role played by electrochemical processes in the human body, clearly remains unclaimed.
The problem lies in the low information content of routine electrochemical analysis, usually aimed at measuring the level of one or another metabolite. In the best case, the goal is to determine an integral parameter characterizing the state of any critically important system of a human body, for example, an antioxidant one [1,2]. More than a dozen actors connected by chains of biochemical transformations can participate in such a system. Consequently, the diagnostic efficiency directly depends on the amount of information about the electrochemical processes in the antioxidant system. It is critically important to understand that information means any experimental data, regardless of its usability significance, which can be reproduced under identical conditions. Of course, the information should be in digital form, which will exclude manual decryption of primary data and will allow fully automating the diagnostic procedure.
This principle of “experimental presumption” works successfully in practice, for example, in genetic research. Thanks to the development of information technologies, the read but undeciphered human genome, nevertheless, allows doctors to identify genetic diseases and to check the effectiveness of various cancer drugs for a particular patient.
The proposed procedure for electrochemical identification is based on the theory of communication and information and is conceptually different from traditional electrochemical analysis. If we consider a sample as a “chemical information item” or “chemical message”, then the task of the sensor is to digitize this information and encode it into some digital image of the sample (a fingerprint, a pattern, a QR code) [3]. This technology is not an analysis in its traditional sense, but rather resembles a method of taking fingerprints—dactyloscopy. The more “papillary patterns” are in the print, the more reliable the identification. A prerequisite for identification is a sufficient amount of a priori information; in dactyloscopy, this information is contained in the fingerprint database.
In medical diagnostics, the composition of biological samples is known, and homeostasis maintains the concentration of physiologically significant components within fairly narrow limits. The first diagnostic task is to obtain objective information about the variations in the concentrations of physiologically significant components. The optimal ways to solve the first problem are discussed in the article.
The second task is to establish causal relationships between the information received and pathological processes in the human body. This task, which is outside the scope of the article, is solved in the process of analyzing data collected in the national programs of digital medicine.
2. Analytical Signal of an Electrochemical Sensor
The development of electroanalytics took place within the framework of classical analytical chemistry, which assumed the solution of two problems: the determination of the qualitative composition of the sample and the quantitative measurement of the concentration of the sample components. A traditional three-electrode cell allows both tasks to be solved simultaneously. The auxiliary electrode only eliminates the influence of extraneous electrode reactions, while the reference electrode identifies the potential of the working electrode according to the standard potential scale, i.e., provides qualitative analysis (component identification).
Depending on the registered parameter, measurement methods are divided into direct and indirect. With active measurement, the measuring instrument itself has a significant impact on the object under study. If the impact is negligible, then the measurement is considered passive.
Every measurement is a process taking place over time. In electrochemical sensors, the measured concentrations of the sample components are recorded as a time-dependent parameter. For electrochemistry, the usually recorded parameter is the electric charge. Such measurement is straightforward because the Faraday charge is directly proportional to the amount of the analyte. The problem is that charge is an integral value that depends on both current and time. For this reason, the recorded parameters can be current and time, as independent physical quantities and their combinations. It will be shown below that the potential of the working electrode is a dependent parameter, since the function i(u) does not satisfy the one-to-one correspondence condition due to the specifics of its nonlinearity.
An analytical signal is the time dependence of the recorded parameter. Moreover, even time intervals can serve as the recorded parameter.
3. Information in an Analytical Signal
The primary act of any information process is measurement. The uniqueness of electrochemical sensors is that the measurement can be performed by directly converting an amount of a substance into an electrical charge.
Any signal, in addition to information about the analyzed sample, contains noise. From the primary transducer, the signal is transmitted to the “receiver”, where information is separated from the noise and, in general, is extracted (decoded). A clear understanding of the measurement purpose allows for choosing the correct information decoding algorithm. Leaving the scientific goals outside the scope of the article, let us focus on purely practical measurements, for example, on determining the concentration of one, less often, two or three components of a solution. In the process of routine electrochemical analysis, a researcher, based on a priori information about the sample, can handle the analytical signal quite freely, for example, limit the range of used potentials, choose the cathodic or anodic reaction, filter the electrical current, or subtract the “background line”. It means separating the experimental information into “useful” and useless. However, in information theory, there is neither “useful” nor “useless” information, but there is only a signal and noise. A signal is information that can be reproduced (with a high degree of probability) from measurement to measurement under identical conditions. Everything else is noise—a source of random measurement errors. Strictly speaking, the signal also contains systematic and methodological errors (so-called conversion errors).
A completely different situation arises during an analysis of samples of unknown composition, for example, natural ones. The absence or insufficient amount of a priori data does not allow neglecting information about any electrochemical and electrophysical processes occurring on the electrodes. The more information characterizing a sample is collected in one measurement, the higher the likelihood of identifying this sample, or at least classifying it. Obviously, the solution to such a problem requires multiple measurements, and the involvement of other physicochemical methods of analysis.
The task of classification (identification) of biological samples looks much simpler. The composition of such samples is known in advance, and the concentration of the components is maintained by homeostasis in a fairly narrow range. This makes it possible to formally determine the minimally required amount of information in the analytical signal, which ensures reliable classification (identification) of the sample.
Assessment of the Amount of Information Required to Classify a Sample
Let the sample contain N electrochemically active analytes. Additionally known, are the reference concentrations of each component, as well as the minimal physiologically significant absolute deviations from the norm
Let us estimate the number αi of significant samples for each component of the sample:
where is the concentration limit for the detection of component i.
Moreover, the amount of a priori “chemical information” in bits is equal to:
Or
Note, that the amount of posteriori information obtained in each measurement cannot exceed the amount of a priori information: .
The accumulation of posteriori information occurs when repeating independent measurements, in our case when using samples from different patients.
4. Electrophysical Features of Electrochemical Sensors
The electrical properties of the interface between the conductor of the first and second kind are unique because they have substantially nonlinear parameters, such as conductivity and capacitance. In addition, the interface exhibits its own electrical activity and a distinct hysteresis effect. In sensor applications, it is often necessary to take into account the length of the working electrode and, as a consequence, the distributed nature of the electrical parameters. In fact, we are talking about electrical wave processes in active and nonlinear distributed systems [4].
Such processes have long been of interest to physicists, developers of electronic devices, and biologists [5]. In particular, biologists studying the electrical properties of lipid membranes have encountered their instability. To explain the phenomenon, a simple model of an “elastic” capacitor was proposed [6]. The model also describes well the behavior of the electrical double layer, where similar phenomena are called negative capacitance [7], and the model itself is called an “elastic capacitor”. Calculations using the model showed that the φ-control (of the potential) leads to a system instability. The slightest disturbance causes the appearance of potential waves near the electrode surface. The larger the surface area, the greater the intensity of the waves. However, another type of control—q control (of the charge) ensures the stability of the system in a wide range of potentials.
The first control mode in electrochemistry is usually called potentiostatic, and the second—galvanostatic.
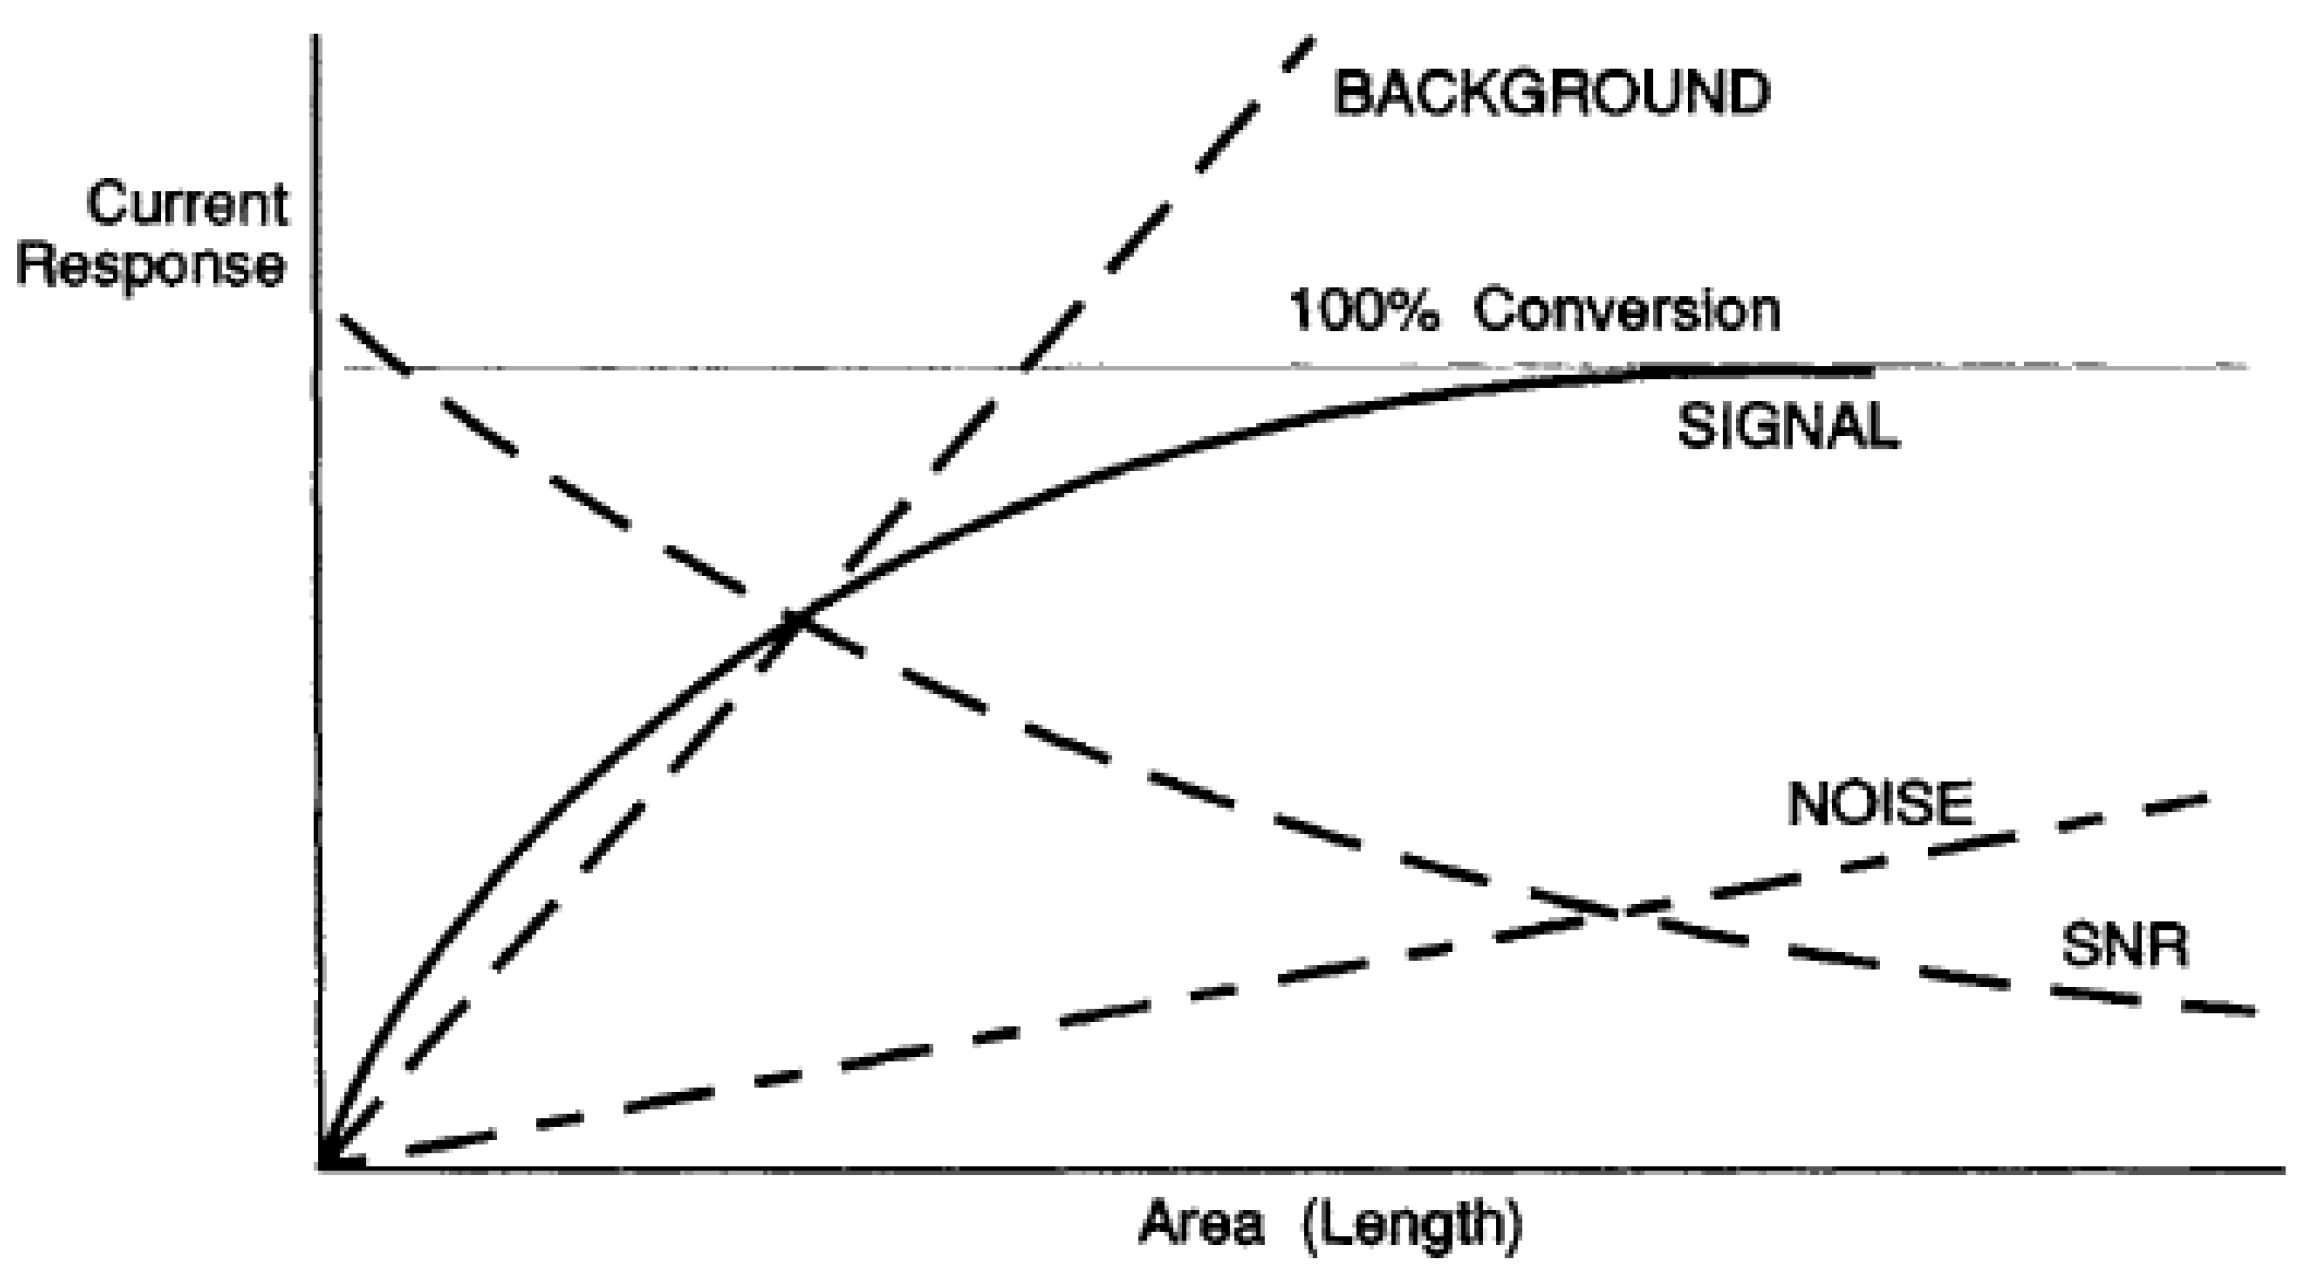
The theoretical results obtained on the model are well aligned with experiments [8,9] showing that with potentiometric control of the cell, an increase in the surface area of the working electrode increases both the signal level and the noise level. However, the noise level increases faster than the signal level; therefore, the signal-to-noise ratio decreases (Figure 1).
It is not surprising that the authors of these publications, published long before the true causes of the noise were established, made the erroneous conclusion that it was impossible to achieve a minimum detection limit on large electrodes. As shown above, the noise of the instability of the electric double layer is a consequence of the potential control of the cell. It is important to understand the nature of the noise; it is not generated by a potentiostat, but rather caused by an electric double layer on the surface of the working electrode.
Note, that the level of thermal fluctuations of the electric charge q, which really limits the detection limit, increases with an increase in the electrode surface area and, as a consequence, with an increase in the capacitance C of the electric double layer [10] (p. 113):
, where k is the Boltzmann constant, and T is the thermodynamic temperature.
However, the cell noise caused by voltage fluctuations , decreases with an increase in the electrode surface area.
Indeed,
Hence,
One of the most important parameters that determine the information efficiency of an electrochemical measurement is the conversion coefficient η, which is equal to the fraction of the component participating in the indicator reaction νi to the total amount of this substance in the sample ν0:
The conversion efficiency at a constant current density j = const, and other identical conditions, is proportional to the surface area of the working electrode and the duration of the measurement.
Thus, the absolute detection limit decreases with an increase in the working electrode surface area and an increase in the measurement duration.
Based on these ratios, it is possible to estimate the root-mean-square values of charge and voltage fluctuations for an electrode with an area of 1 cm2. The electric capacitance of the electrode is taken to be 10 μF, and the temperature is 300 K.
Then
The number of electrons forming such a charge is 2.1 amol.
Thus, the absolute detection limit of an analyte in a one-electron reaction is 2.1 × 10⁻¹⁸ mol.
Moreover, the root-mean-square amplitude of thermal voltage fluctuations is
This value is eight orders of magnitude less than the potentials used.
5. Thermodynamics of Information Processes
In 1871, James Maxwell [11] (pp. 308–309) proposed a thought experiment to illustrate the possibility of breaking the second law of thermodynamics. Some being (a demon) able to see the gas molecules, sorts them according to their velocities with the help of a door. In this way, it creates a temperature difference in the two parts of the gas compartment without consuming energy. Maxwell’s hypothetical experiment caused a lengthy but fruitful discussion by the most prominent physicists of his time. It is clear that in order to perform an experiment, the being needs information about the speed of each molecule and the ability to control the door. This requires energy consumption and leads to a decrease in the entropy of the gas. The very concept of information was born, inextricably linked with the consumption of energy and a decrease in entropy. Leo Szilard was the first to note the connection between informational and thermodynamic characteristics of an experiment [12]. Leon Brillouin, in his original works, developed this direction, as well as systematized the works of other authors, laying the foundations of the thermodynamics of information processes [13].
For a long time, the thermodynamics of information processes has slowly developed as a purely theoretical direction aimed at establishing the limiting relationships between information characteristics (accuracy, information volume) and thermodynamics (energy, entropy) [14]. The development of sensor networks and systems has stimulated the interest of researchers in this area [15].
The format of the article does not allow for a detailed presentation of the basics of information thermodynamics; therefore, we restrict ourselves to the phenomenological model of physical measurement according to Brillouin.
An electrochemical sensor is an open thermodynamic system [16]. Measurement of the parameters of any physical object is accompanied by the consumption of energy. The energy impact of the measuring device on the thermodynamic system brings it out of its equilibrium state and, consequently, reduces the entropy of the system. In the Brillouin model, the decrease in entropy (negentropy) determines the amount of “bound” information. In the process of restoring equilibrium, entropy increases, and “bound” information is converted into “free” information.
Although the information process is irreversible due to the irreversibility of time, the Carnot theorem can be extended to it. This approach makes it possible to estimate the information efficiency of a measurement similar to the efficiency of a heat machine (see Section 6.1 and Section 6.4).
With regard to electrochemistry, several practical conclusions from this model can be formulated.
The amount of information received in the active measurement is proportional to the decrease in entropy in the object under study (electrochemical cell).
Generalization of Carnot’s theorem to information processes allows us to find the limit rate of transformation of the decrease entropy into information.
The maximum conversion coefficient is achieved during an equilibrium or a quasi-equilibrium process.
The presence of feedback, using the information obtained in the measurement process to control the object (electrochemical cell), significantly increases the amount of information received.
6. Comparison of the Information Content of Electrochemical Methods
6.1. Voltammetry
Voltammetry is the most common method for the electrochemical analysis of liquids. There are many varieties of the method, which differ, first of all, in the form of the potential sweep. Only the potential control and registration of the dependence of the current on the potential remain unchanged.
If we consider a typical voltammogram from the position of information theory, then it cannot be considered an analytical signal. Firstly, such a dependence does not satisfy the condition of a one-to-one relationship, and secondly, it does not explicitly link to the time scale. Of course, time is present in the signal in an indirect form, through the rate of potential change.
Linear potential sweep is often used,
where v—sweep speed, and the dependence of the current on the potential is recorded .
The disadvantages of this approach are obvious: firstly, the potential control results in a high level of noise, and secondly, the position of the current peaks is shifted along the potential scale, which complicates the identification of analytes, especially if there are several peaks. Third, the charge-discharge current of the electric double layer increases in proportion to the sweep speed. At the same time, the amplitude of the current peaks also increases, but only in proportion to the square root of the speed. As a result, the conversion efficiency η (7) decreases with increasing potential sweep speed.
Such conclusions are confirmed by the example of our recent work [17], in which a sensor on a carbon veil was studied for the determination of ascorbic acid.
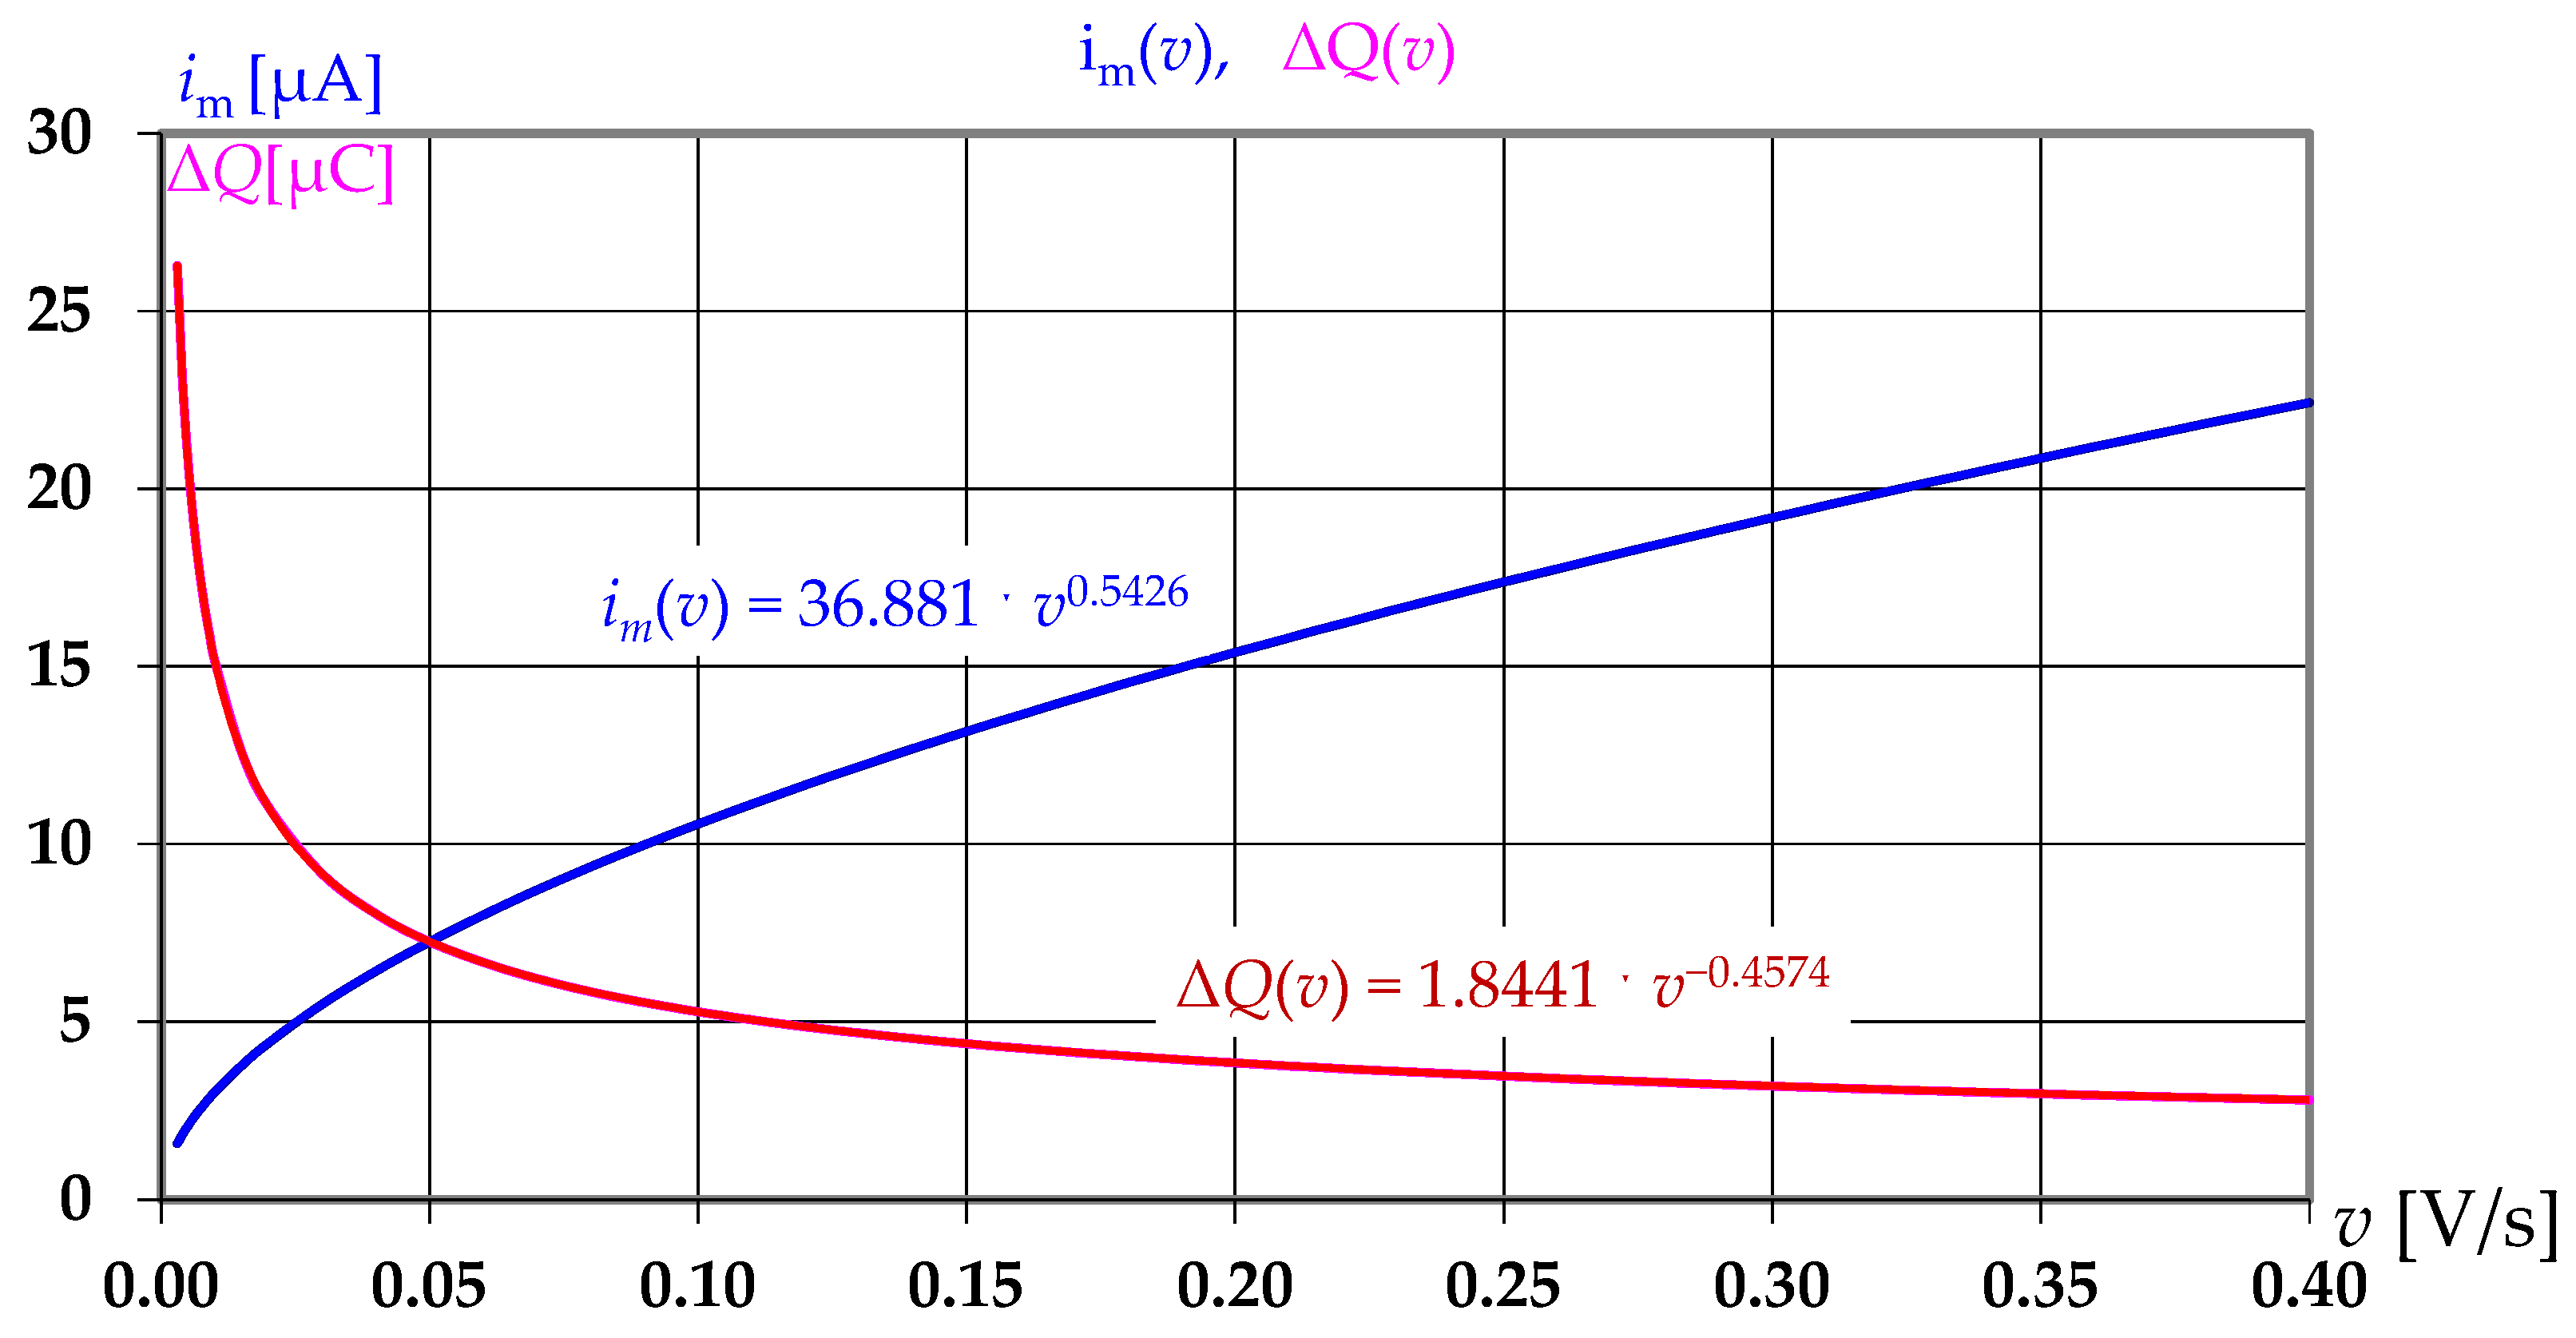
In this work on several voltammograms with a linear potential sweep, an empirical equation was obtained for the dependence of the amplitude of the pulse current im on the potential sweep speed v:
Let us express the dependence (11) of the current pulse amplitude on the speed in an explicit form:
Equation (12) will be simplified if we replace the exponent with its value
For the linear sweep . Let us take the value of the voltage interval comparable to the width of the current peak . Then the time interval corresponding to the passage of the peak .
Let us find the dependence of the charge flowing through the electrode at the moment of the maximum current on the sweep speed:
Given Equation (10), let us transform Equation (13):
Note, that is actually a scale factor and does not affect the nature of the dependence (14).
The graphs shown in Figure 2 clearly demonstrate the opposite trends. As the sweep speed increases, the current amplitude increases, and the Faraday charge, which is a natural analytical signal, decreases. Accordingly, the conversion efficiency coefficient decreases. Consequently, as the sweep speed increases, the amount of information obtained decreases.
In addition to this problem, the amplitude of the charge-discharge current of the double electric layer capacitance increases in proportion to the sweep speed.
The example given by the author shows the internal contradictions of the voltammetry method, which makes it difficult to optimize the parameters of the experiment.
In fact, the researcher is faced with a dilemma. Either to obtain a “beautiful peak” or to obtain the maximum information. The question that remains is, what do we choose to study a multicomponent sample?
6.2. Stripping Voltammetry
Let us consider separately a stripping voltammetry. This truly ingenious method of increasing the information content of a measurement, proposed in 1952 [18], serves as an excellent illustration of the Brillouin model of physical measurement.
The measurement is performed in two steps. The first step is preparatory—to perform an electrochemical concentration of analytes in potentiostatic mode (φ-control). Let the entropy of the initial state of the solution be . In the process of concentration, some of the ions are reduced, i.e., part of the solute goes into the solid phase, and the entropy of the solution decreases to the value .
The change in entropy is proportional to the total charge of the reduced ions Q:
, where ξ—is a coefficient of proportionality.
According to the Brillouin model, the amount of “bound” information is proportional to the decrease in cell entropy: . During the measurement process, this related information can be converted into “free” information: , where γ—coefficient of transformation of entropy into information, is similar to a heat engine efficiency coefficient. The information content of the measurement depends on the value of this coefficient, and its maximum value, as for a heat engine, is achieved in the quasi-equilibrium process of returning the solution to its initial state with entropy .
6.3. Scanning Coulometry
From 1996 to 1998, the author participated in an international project to create a portable water analyzer for heavy metals Pb, Cd, and Cu. In the course of the project, it was required to solve a very difficult problem: to develop a fully automatic portable electrochemical analyzer of natural samples of unknown composition for use in field conditions. In this case, it was necessary to use disposable sensors without reference measurement methods. The first stage of the project involved a small team of developers led by the author.
Such a device has not yet been created, but in the past few years, our group managed to eliminate a number of fundamental problems and create a working model of a portable water analyzer [19]. The author’s method of “scanning coulometry” [20] used in this device made it possible not only to fully automate the measurement process but also to completely eliminate the subjective factor at the physical level. The analytical signal of the device is a sequence of time intervals that fix the time moments of the system passing through the given points in the coordinates u-i. The device does not register either the dependence of current and potential on time or current on potential. In the process of measurement, it does not use any signal filtering and does not require the building of a background line.
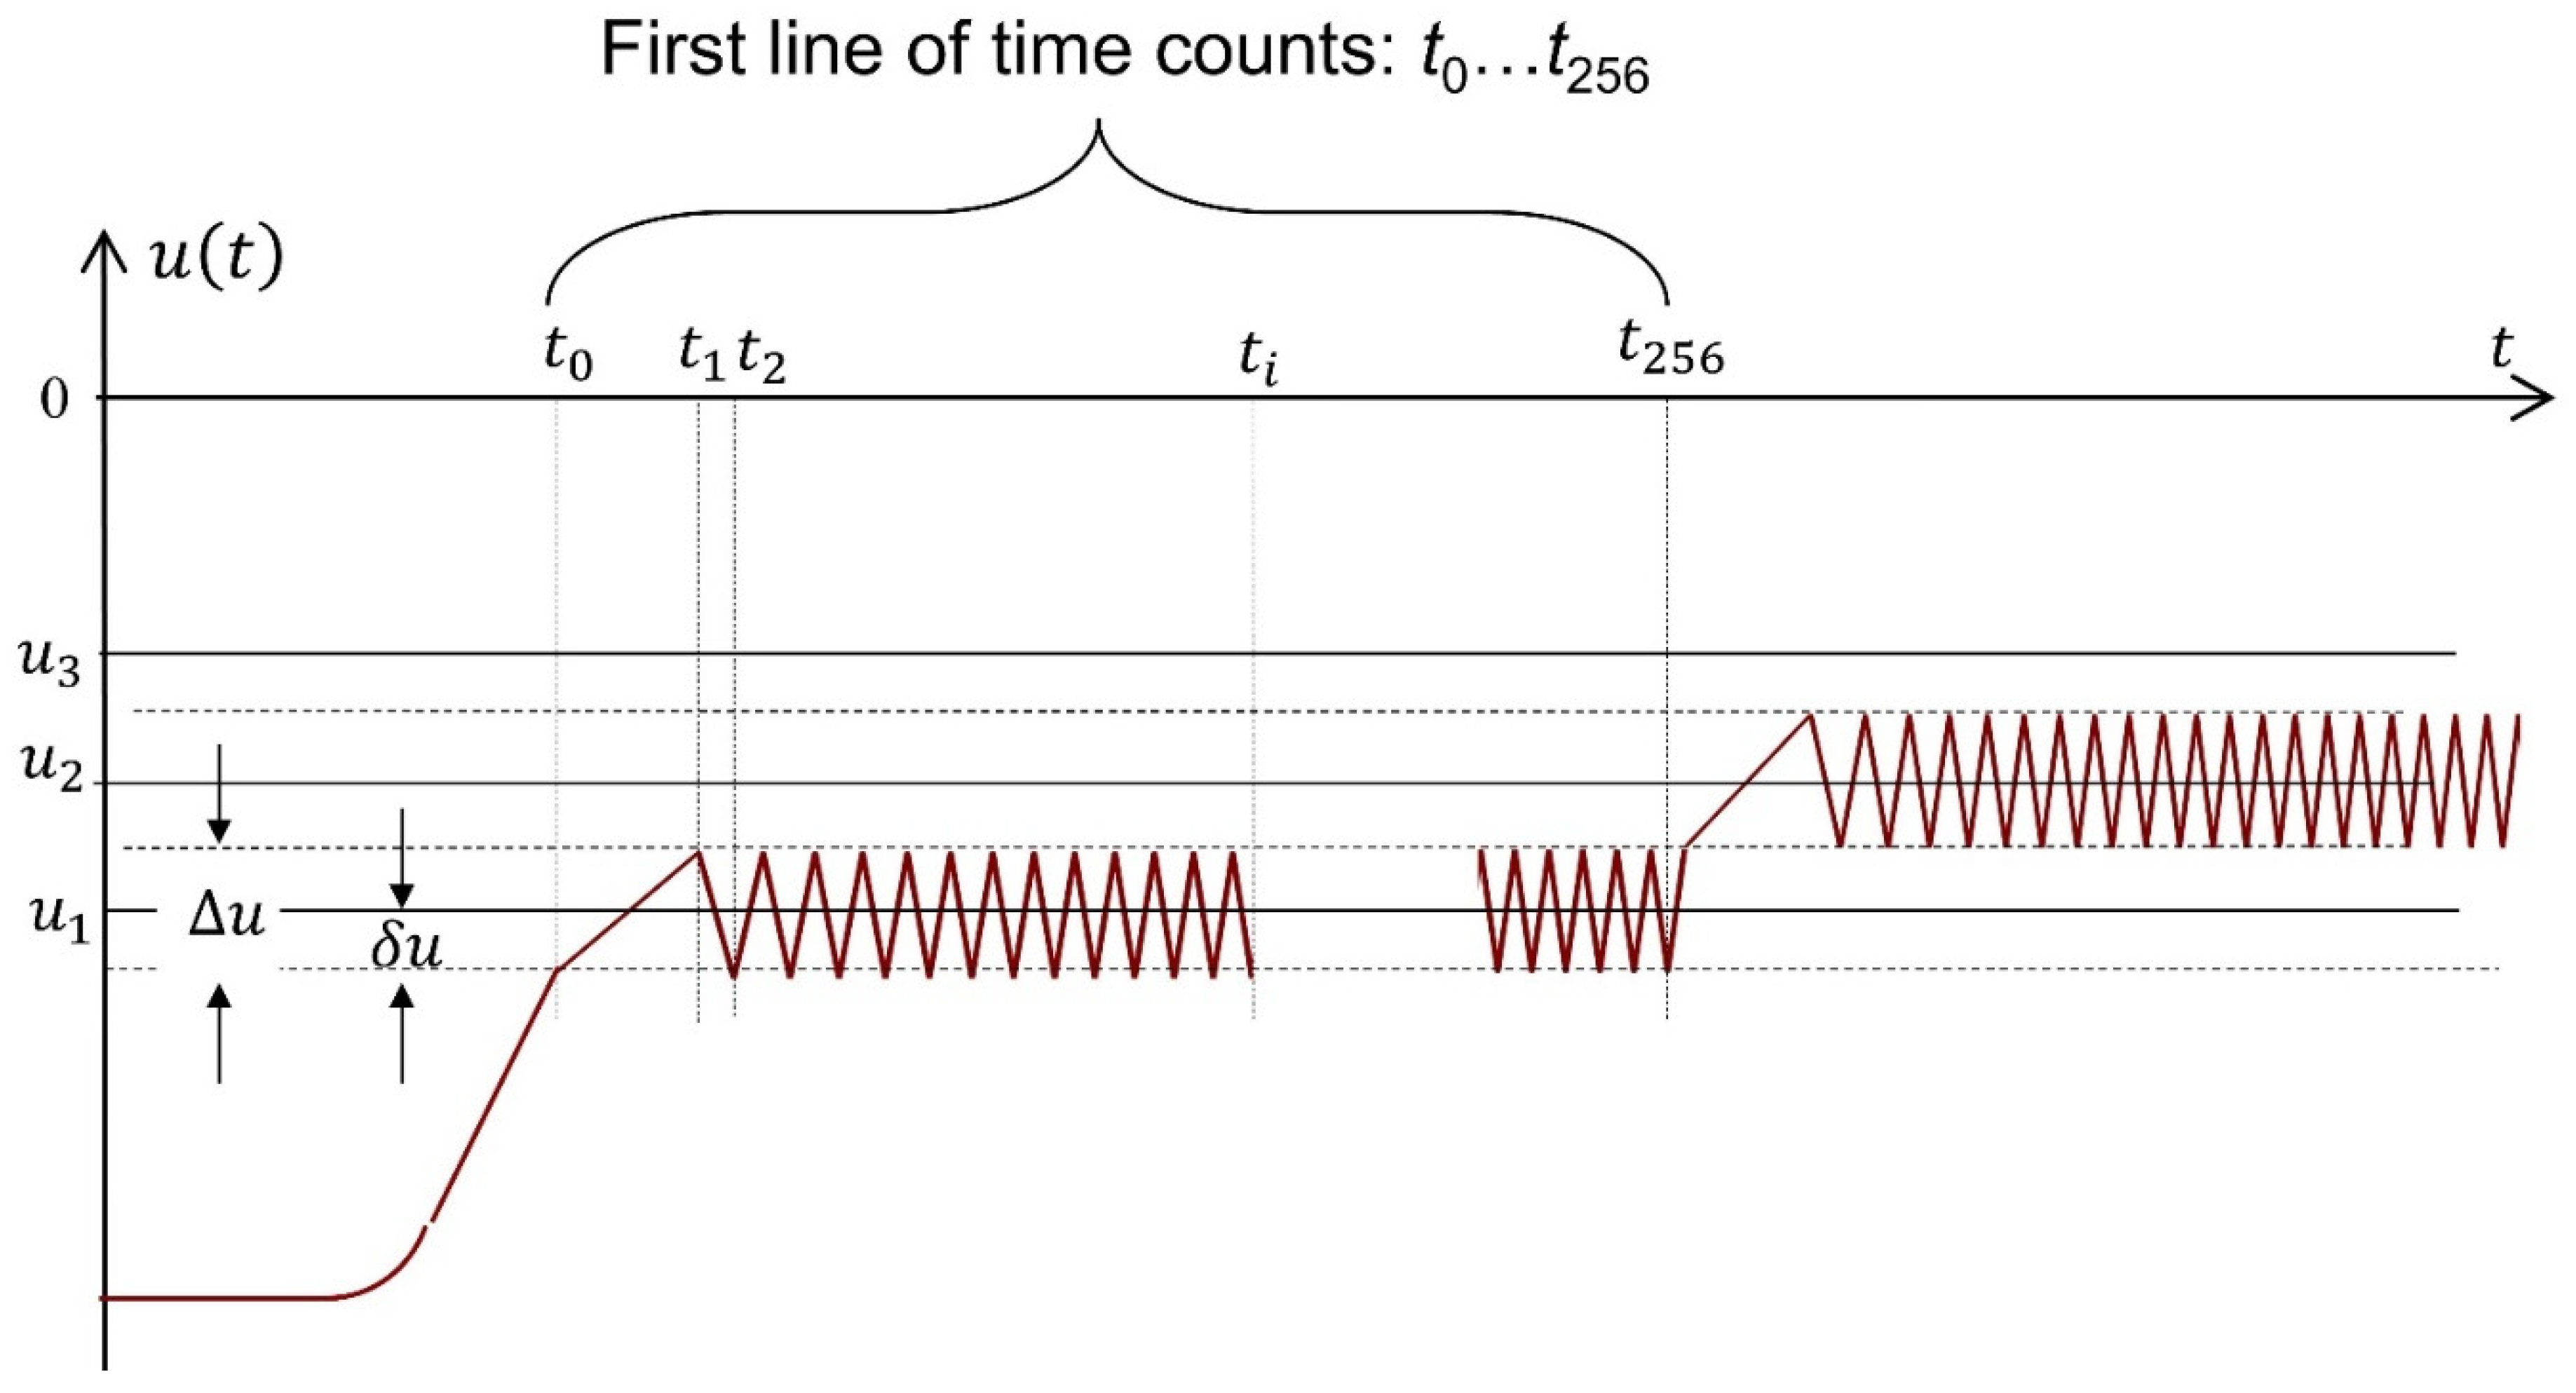
The measurement control algorithm (Figure 3) corresponds to the Brillouin model of physical measurement. At the first stage of measurement, as in stripping voltammetry, the electrochemical accumulation of analytes is carried out on the working electrode in a potentiostatic mode with intensive stirring of the sample.
The second stage is actually active, adaptive measurement, with feedback. A galvanostatic control mode is used, with a constant current value. The potential of the working electrode is kept within the predetermined narrow range 2δu (Figure 3) as follows: when one of the limits of the potential range is reached, the current is inverted. The moment of this event is recorded by the control panel. The current inversion causes the potential to move to the second limit of the range , upon reaching it, the current is inverted and the moment of this event is recorded. Cycles with current inversion are repeated until the duration of the time intervals stabilizes. This event means that a dynamic equilibrium has been established between two stationary electrode processes: anodic and cathodic.
The analytical signal obtained by this method contains comprehensive information about all electrochemical processes occurring on the electrode. The invariability of the current ensures that the electrode processes are stationary. The total charge corresponding to each time interval is . The Faraday charge of the sought-for reaction will be less than the total value of the charge of the steady-state process.
This eliminates the subjective procedure for subtracting the background line in the entire potential range. The analytical signal also makes it easy to find the fractions of analytes oxidized by the chemical mechanism, the reaction reversibility constants, and the quantity of metals restored at the stage of accumulation.
Figure 4 shows the analytical signal obtained on model samples with concentrations of Cu 10 µg/L, Pb 50 µg/L, Cd 50 µg/L. Acetate buffer. Cell volume 150 μL, I = 50 μA. Measurement duration (without the stage of electrochemical concentration) 59.6 s.
A more detailed description of the experiment and the electrochemical analyzer is given in the Supplementary Materials.
The main source of methodological measurement error is the uncertainty of the conversion rate. The methodical error can be reduced by bringing the conversion coefficient value as close as possible to 100%.
Based on the analyzer test results on a cell equivalent, the instrumental error was determined, the value of which does not exceed 10−9 C.
6.4. Electrochemical Analysis with Preliminary Separation of the Sample
Sample separation is an effective way to increase information content. In accordance with the Brillouin model of physical measurement, the amount of associated information is determined by the change in entropy. During separation, the entropy of the sample decreases and this decrease is equal to the entropy of the mix .
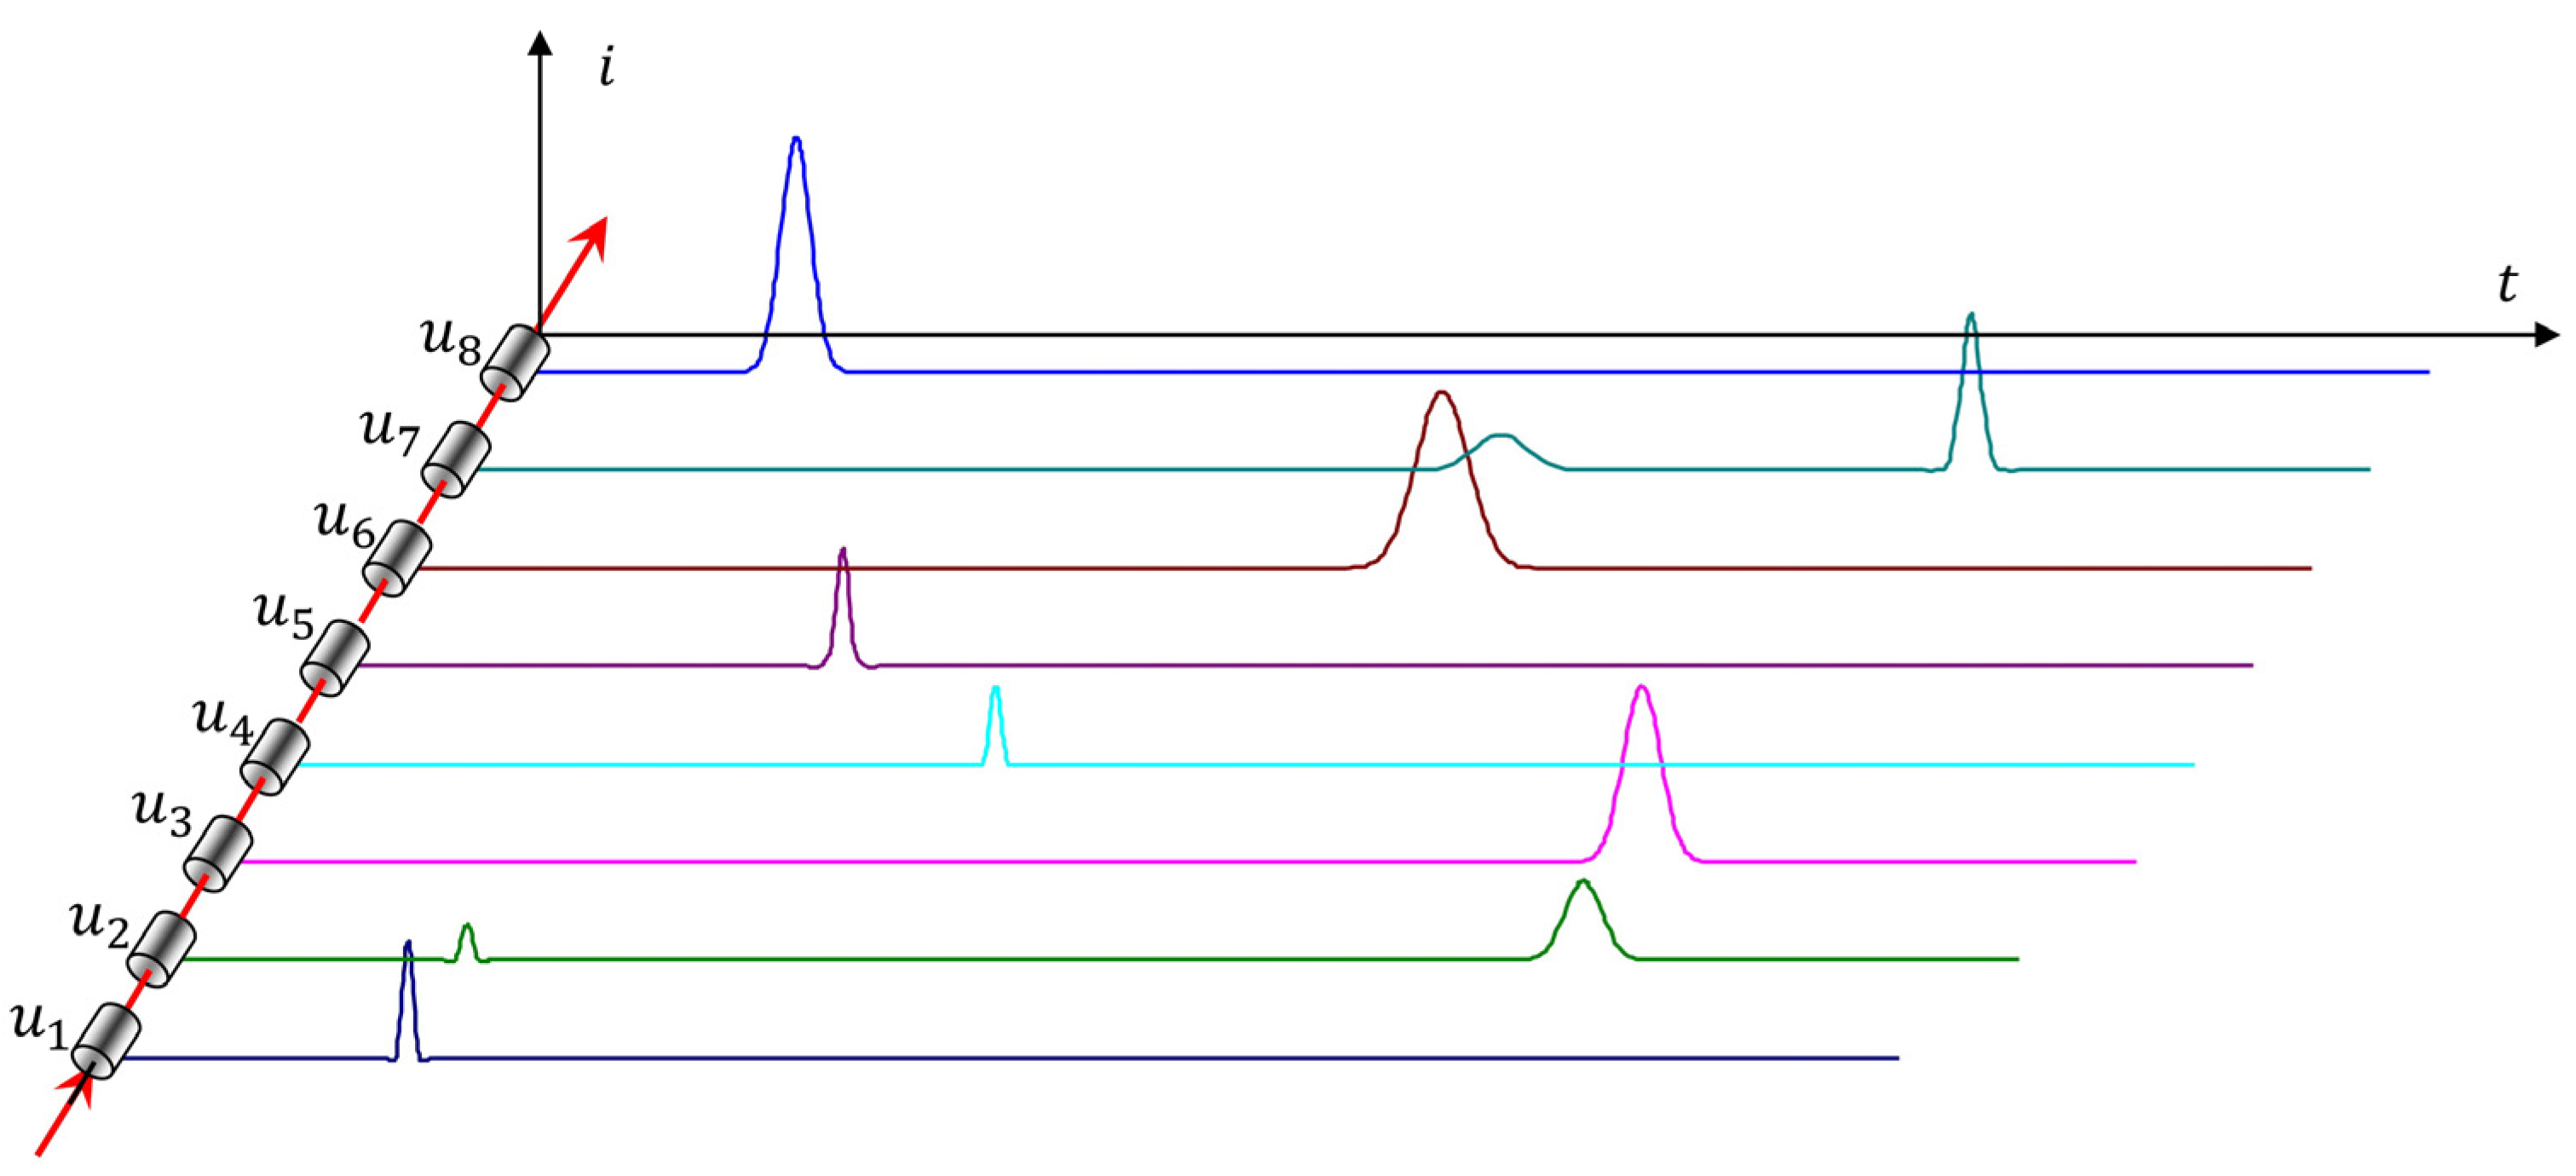
The higher the degree of separation, the more information is in the analytical signal. The greatest gain comes from high-performance liquid chromatography (HPLC), in which electrochemical detectors have been successfully used for a long time. HPLC systems with multi-electrode electrochemical array detectors are some of the most informative analytical tools available. Such systems allow obtaining 3D chromatograms [21]. Due to the unique carbon electrode with oriented micron channels, the conversion efficiency of the cell in the coulometric mode is close to 99%. Up to 16 similar cells with different potentials of working electrodes can be connected in series to the hydraulic line of the chromatograph (Figure 5). The amount of information received in each dimension increases in proportion to the number of cells. Separation by retention time in the column is supplemented by separation by the potential of the electrochemical reaction, which additionally increases the amount of information obtained. This completely solves the problem of recognizing overlapping chromatographic peaks.
Of course, such a complex and expensive technology cannot be used in sensors, but it is possible to use a flow cell in the scanning coulometry mode.
In 2005, a team led by the author developed an electrochemical detector for HPLC systems; a double coulometric cell type 5010A P/N70-5560 S/N 5010A-0292 from the firm ESA Inc. (Chelmsford, MA, USA) was used as a sensor. The cell has two reference electrodes and two auxiliary electrodes. A working electrode made of carbon material with many longitudinal submicron channels is placed between these electrode systems. Due to the large area of the channels, the conversion efficiency of the working electrode is ~99%. The manufacturer uses the cell in the coulometric mode: at a fixed value of the working electrode potential, the current dependence on time is recorded, and the Faraday charge of the reaction is calculated by integrating the current peak.
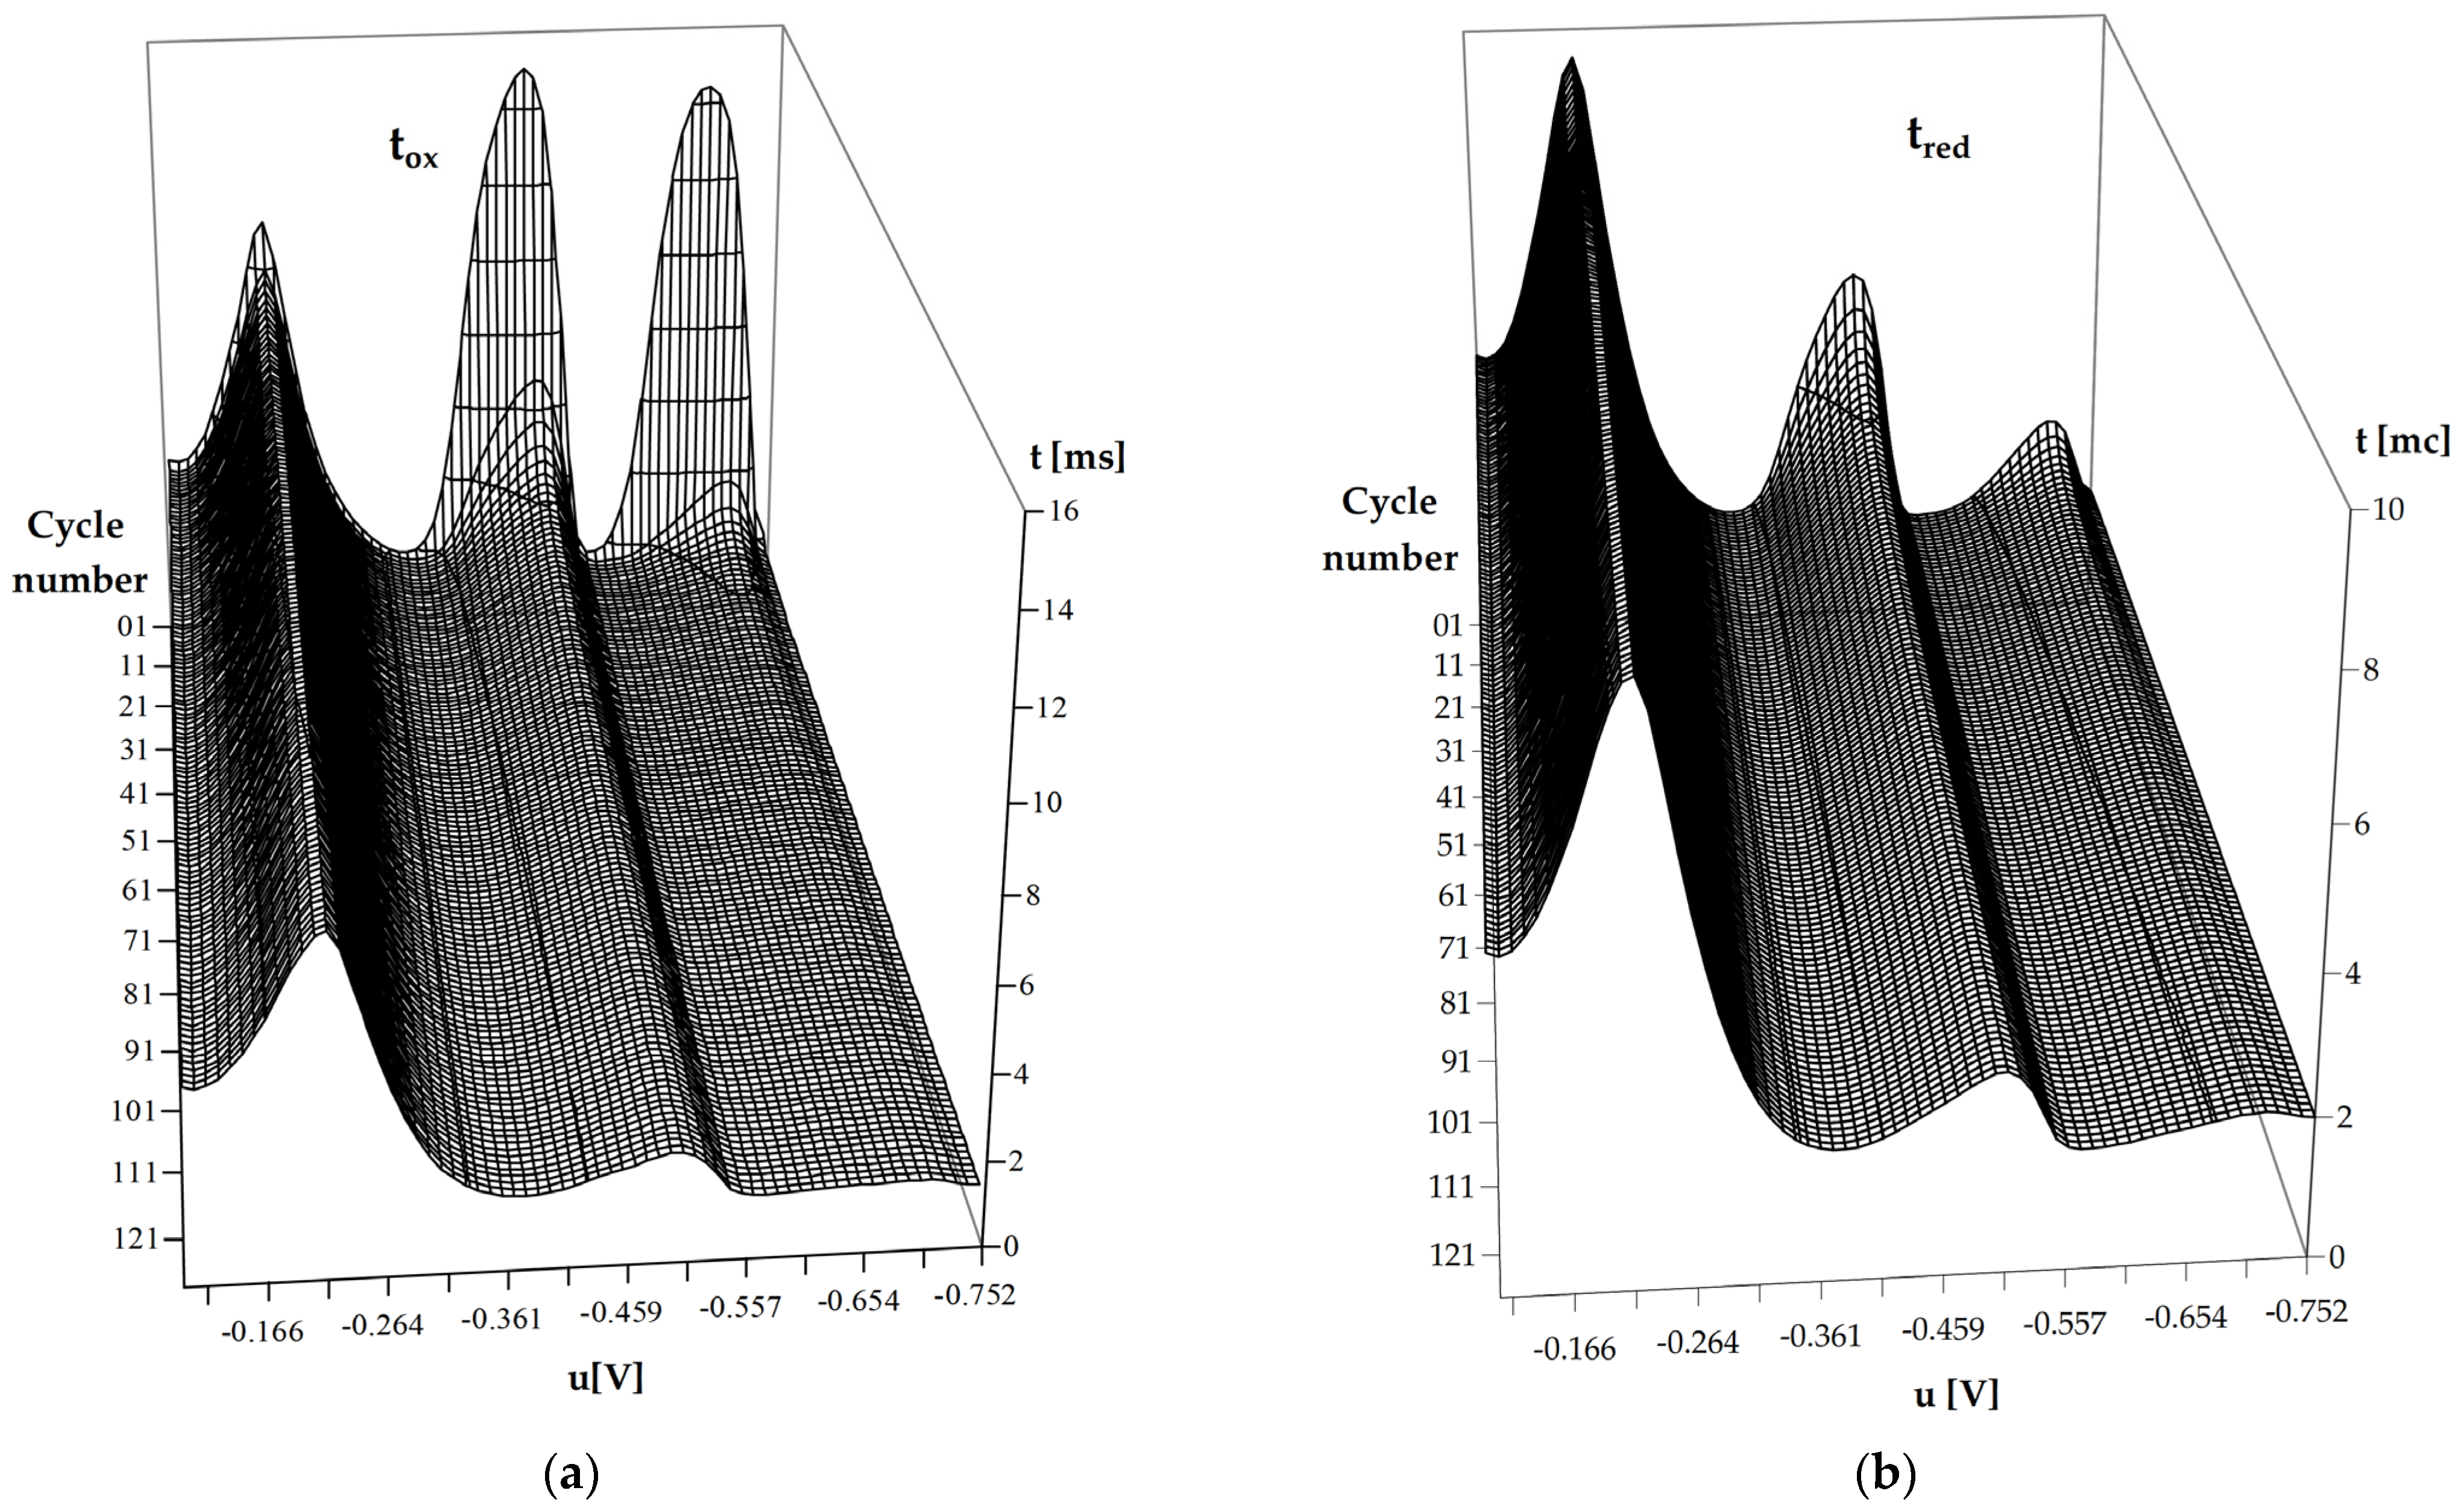
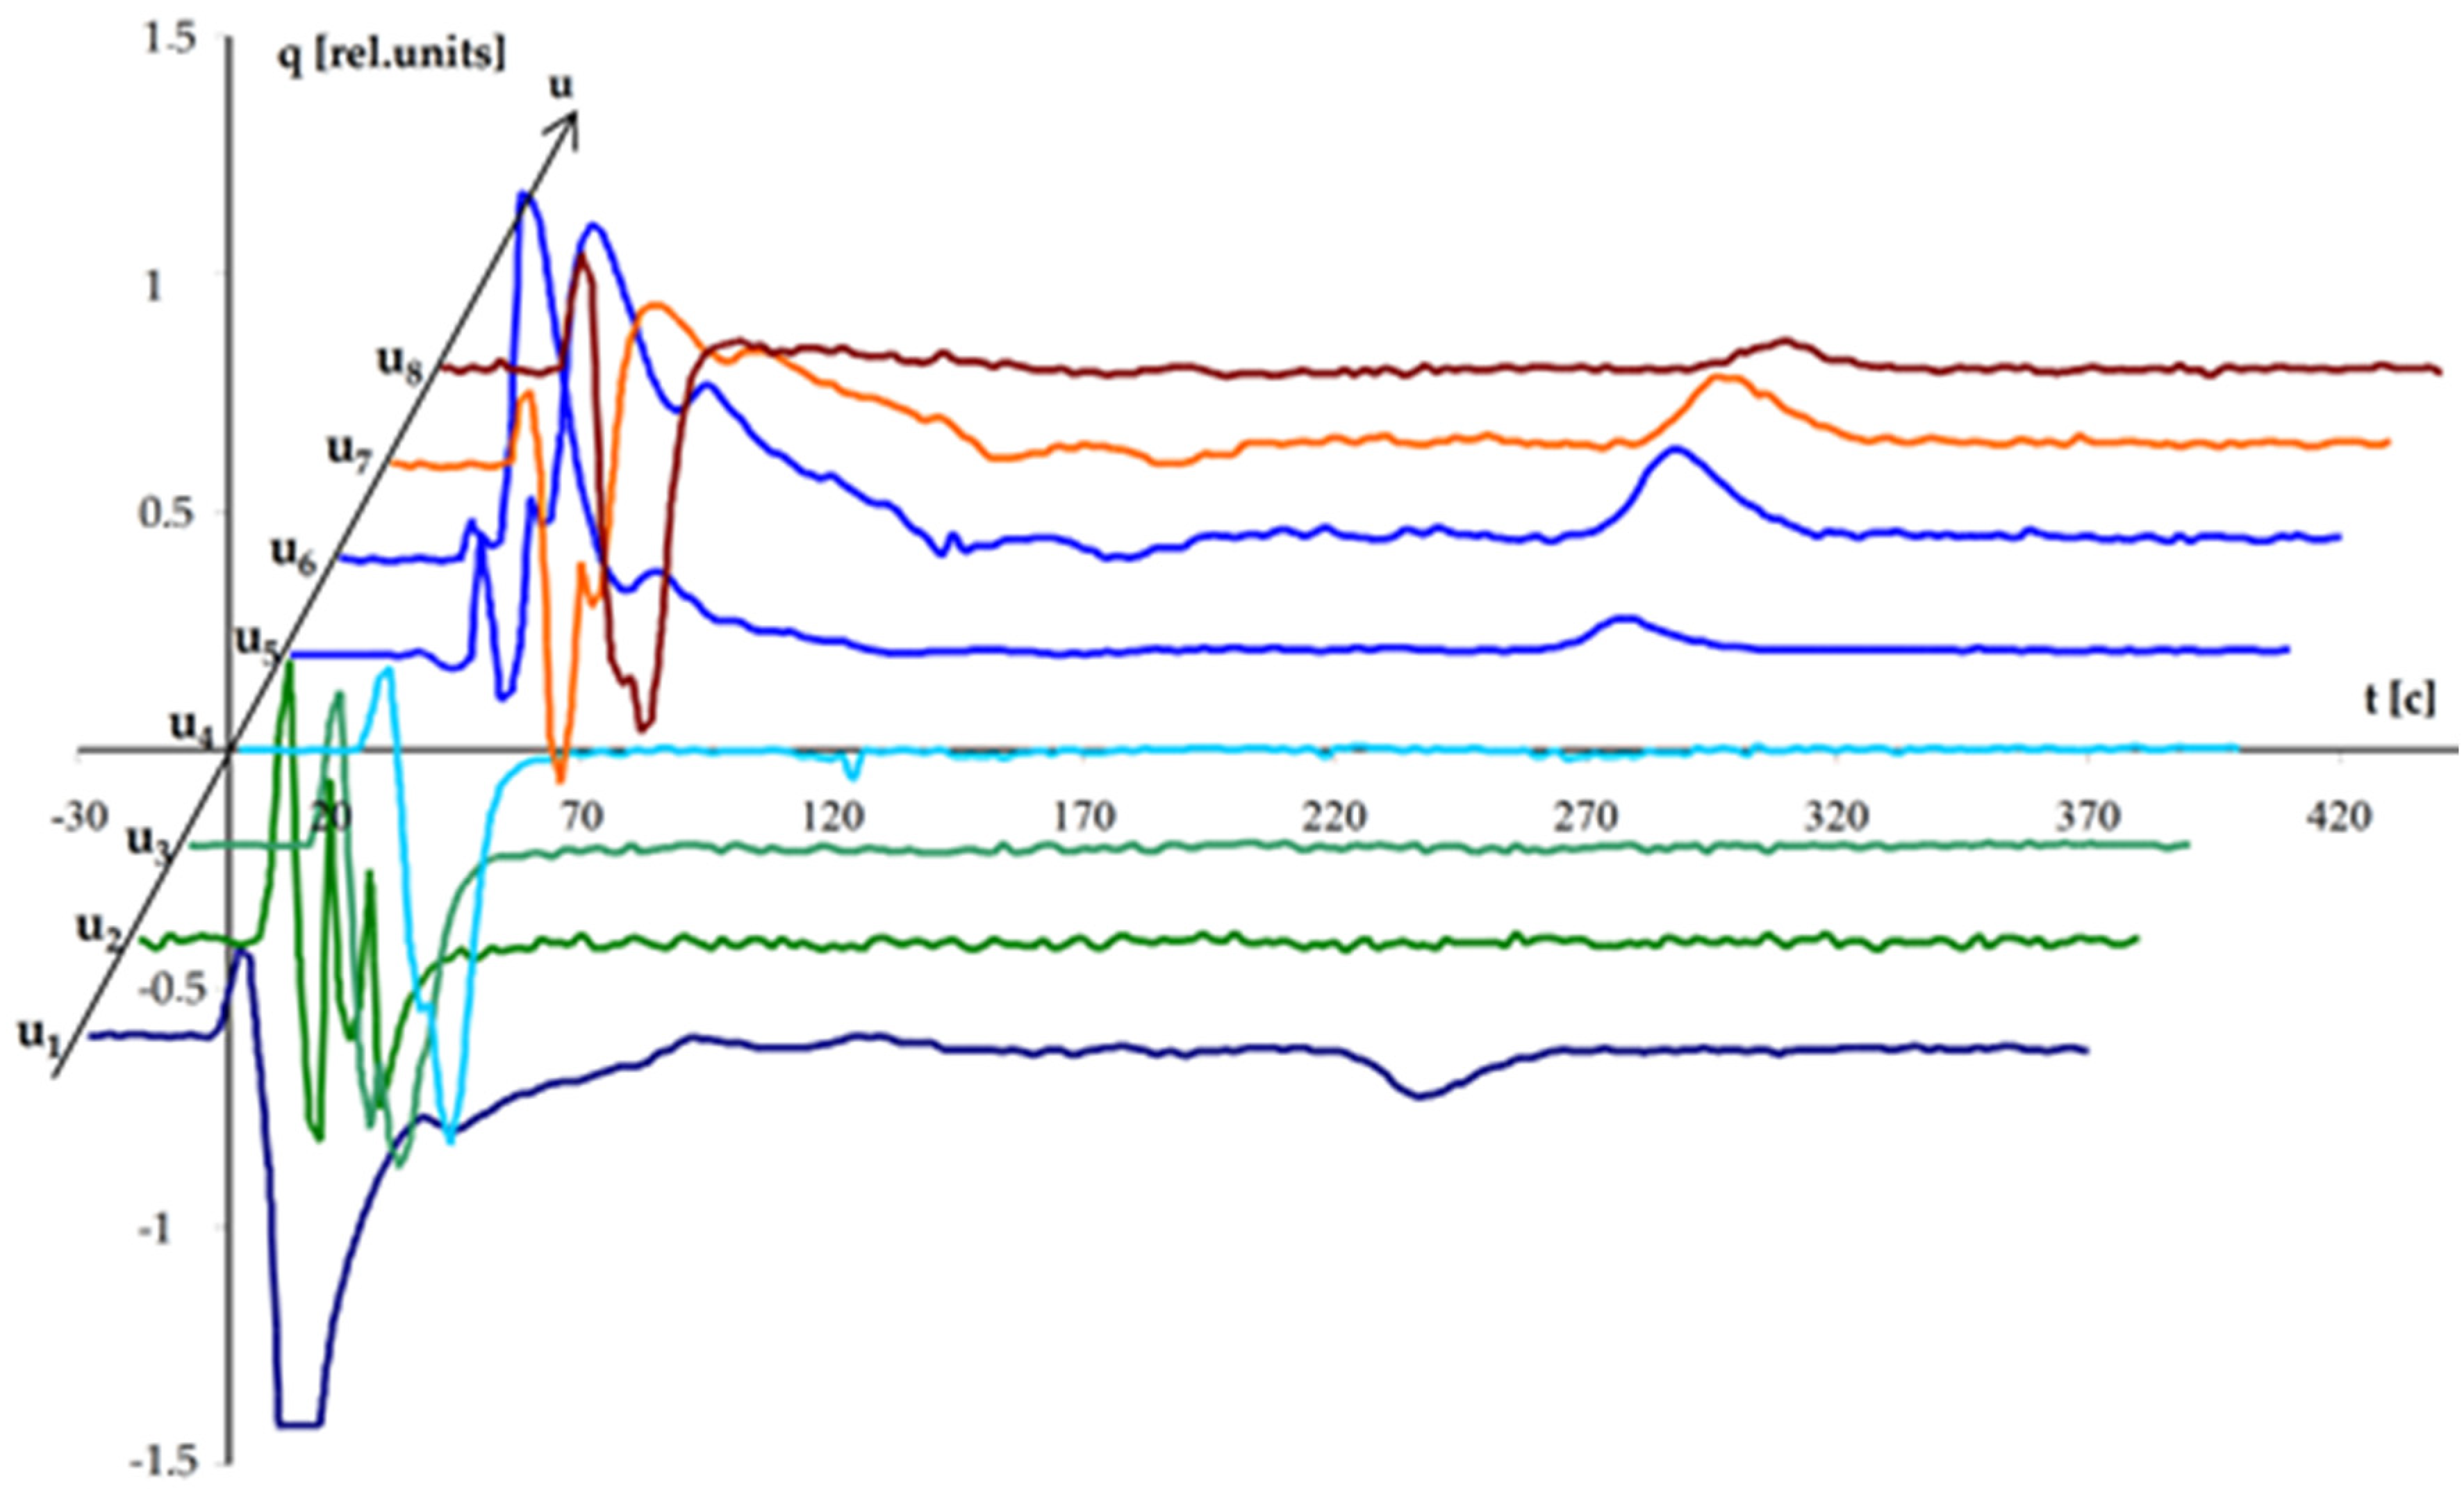
A mode close to cyclic chronopotentiometry at a given current was used [22]. The potential scale was divided into several adjacent intervals. For each interval, its own current value was set. The analytical signal of the device is a sequence of time intervals that fix the time moments of the system passing through the given points in the coordinates u-i. Thus, a continuous cyclic operation of the cell was ensured. All intervals are recorded in real-time. The amplitude of the control current for each of the eight intervals is set separately. The analytical signal is a sequence of Faraday charges, and each charge is bound to a given interval potential and real-time (Figure 6).
A more detailed description of the experiment and the electrochemical detector of the analyzer for HPLC is given in the attachment.
Tests have shown the high sensitivity and information content of the detector. The amount of information depends on the number of intervals into which the potential range of the working electrode is divided. During the tests, a slow drift of the background line was detected. Later, this problem was completely resolved.
7. Analytical Signal Visualization
A large amount of information is required for medical diagnostics based on digital technologies and artificial intelligence. It turned out that there are problems associated with adequate human perception of such volumes of information. Visualization of the analytical signal is important for the researcher since it allows one to assess the correct operation of the measuring system and optimize its parameters. The task of visualizing highly informative 3D signals is especially important.
The difficulty of perceiving large amounts of information is often a psychological obstacle to the propagation of modern devices. For example, for the introduction of X-ray tomographs, it was necessary not only to retrain the radiologists but also to provide for the possibility of visualizing the results in the form of foreshortened X-ray images.
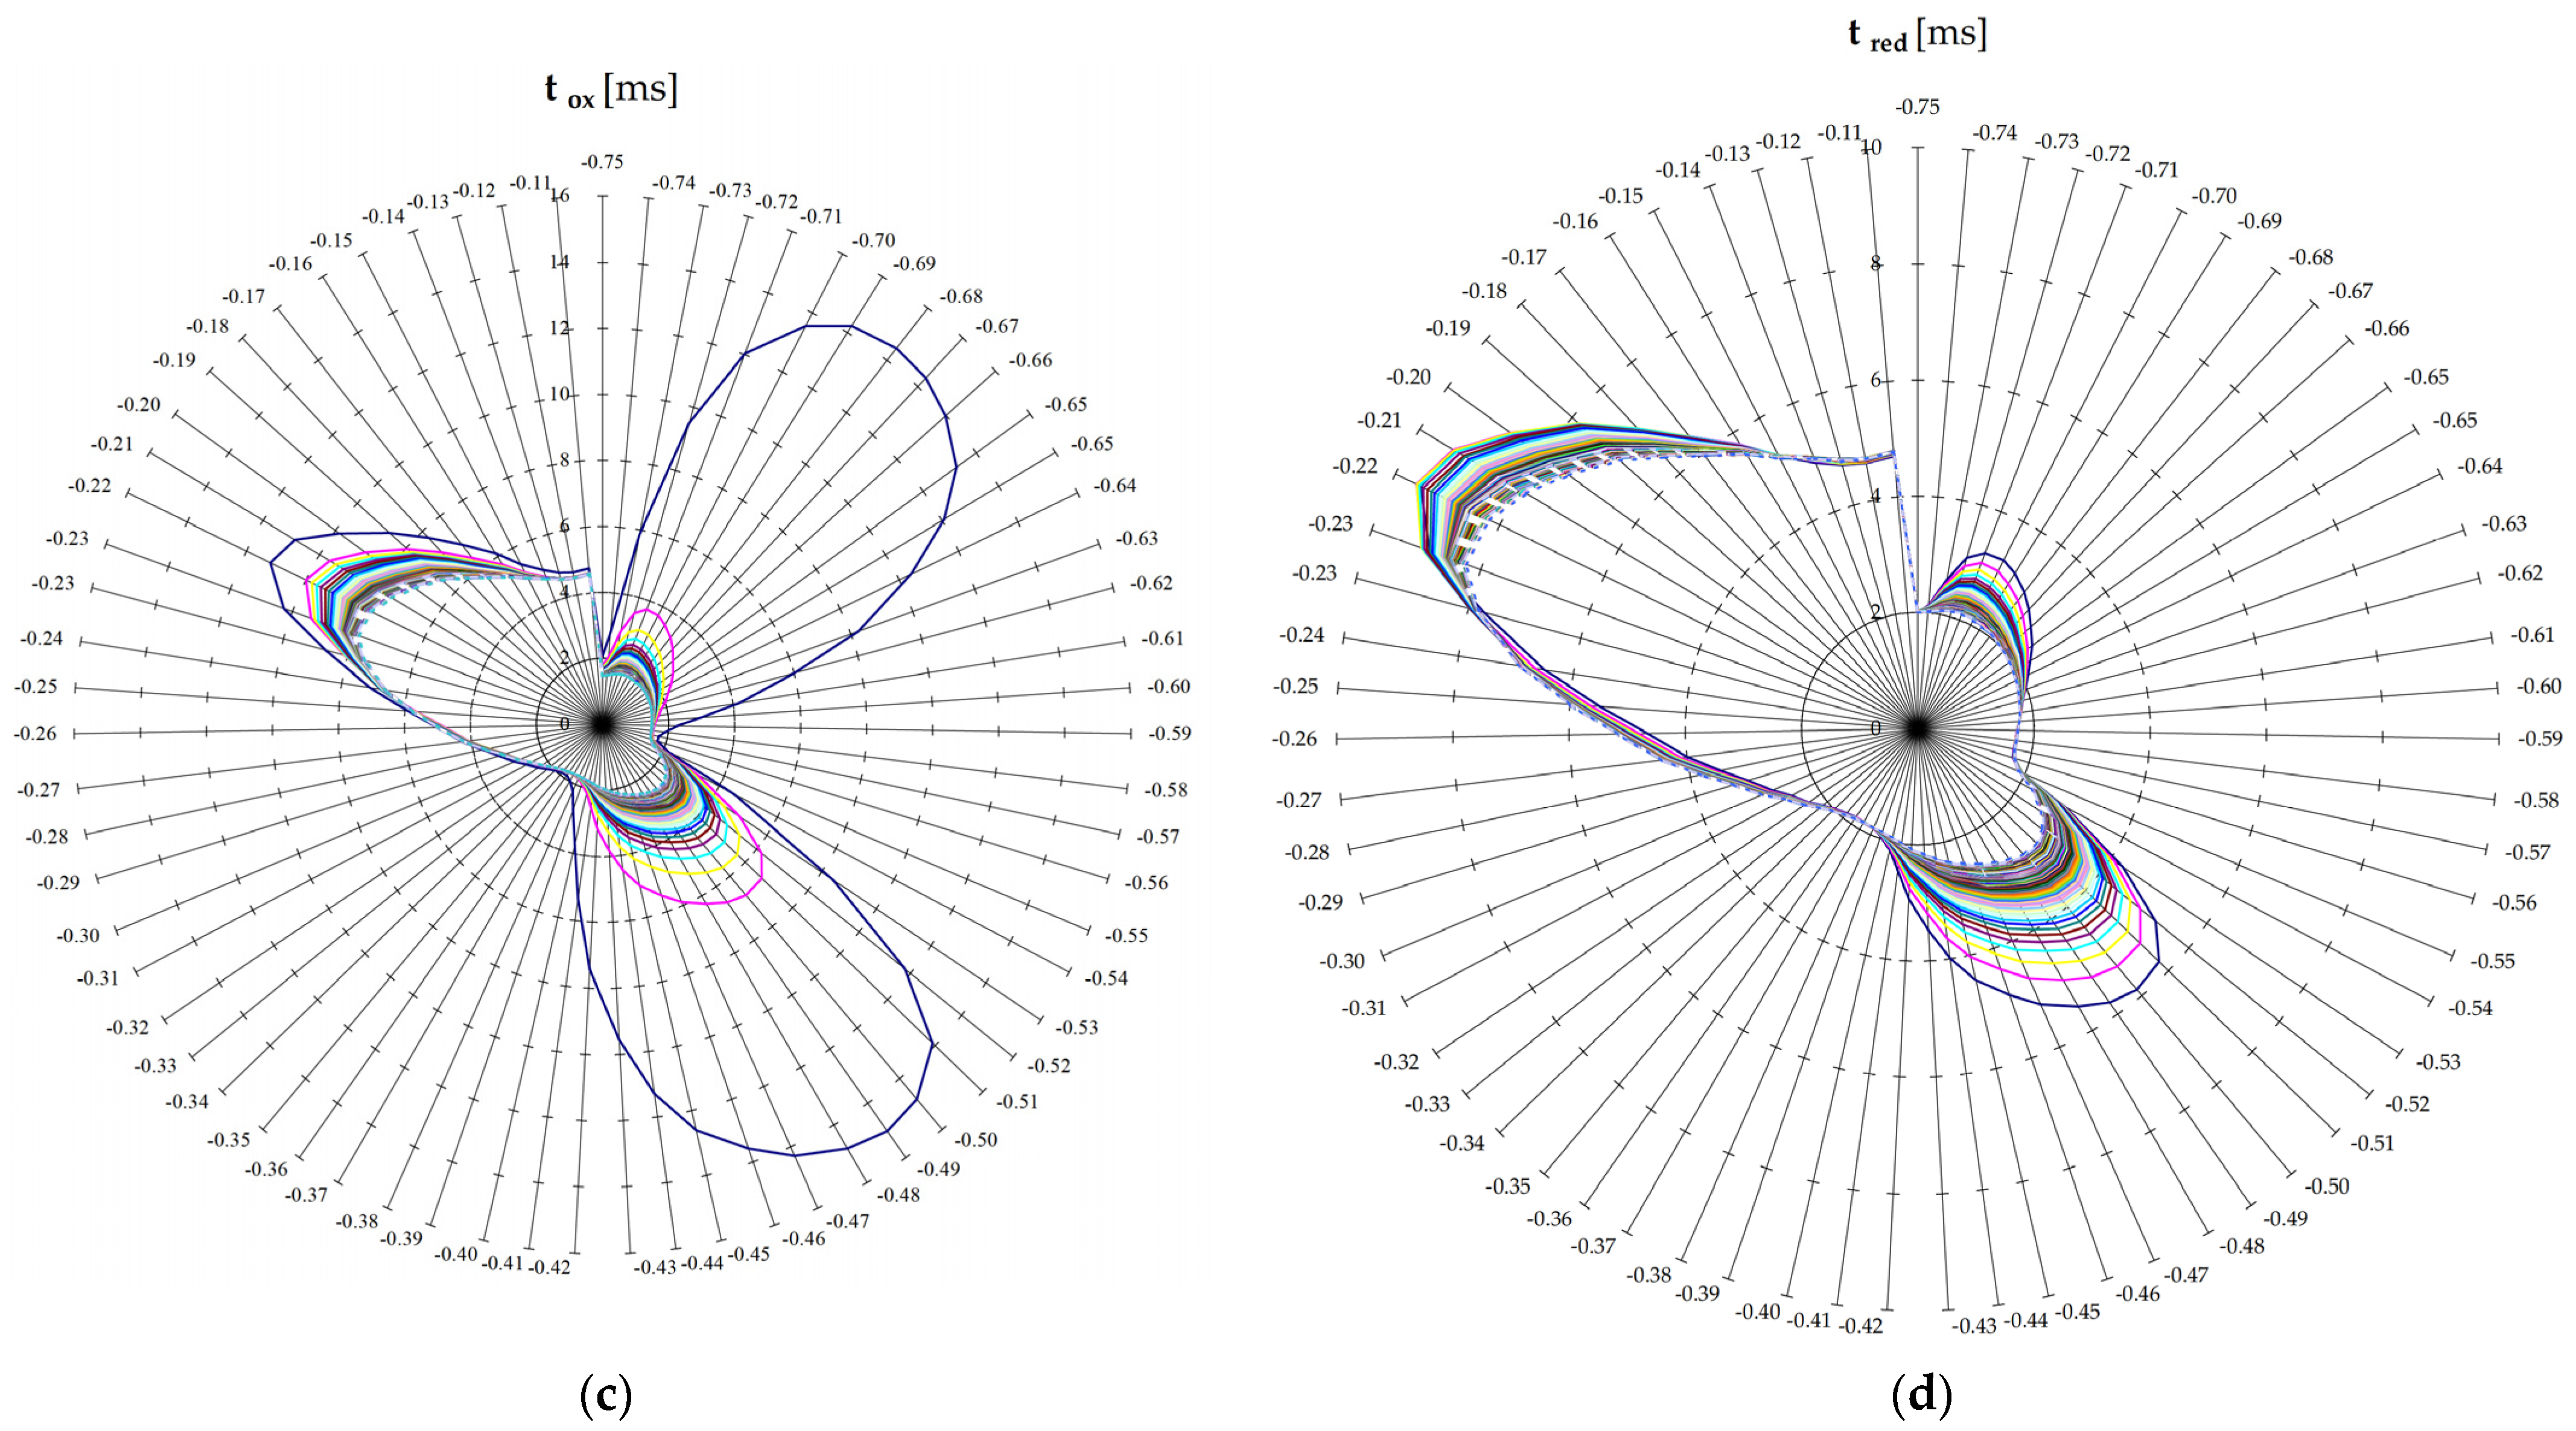
Below are examples of 2D visualization of highly informative analytical signals (Figure 7).
The most striking impression is made by moving analytical signals. A video of such a signal in real-time is attached to the article (see Supplementary Materials). The video shows eight chromatograms in polar coordinates. The signals are normalized so that the electrochemical image of the eluent is approximated to coincide with a regular octahedron. The initial fragment of the chromatogram from 26 to 130 s is slowed down by a factor of 4. This time interval corresponds to the passage through the detector of an unseparated sample.
8. Discussion and Perspectives
The author is aware of a certain complexity of perception of his manuscript materials by the readers of a specialized journal, so he considers it necessary to make several explanations.
Firstly, the purpose of the publication is to rethink the role of electrochemical analysis as a measurement procedure which, in turn, is the primary stage of the information process, as well as to find ways to integrate this information process into modern information technologies.
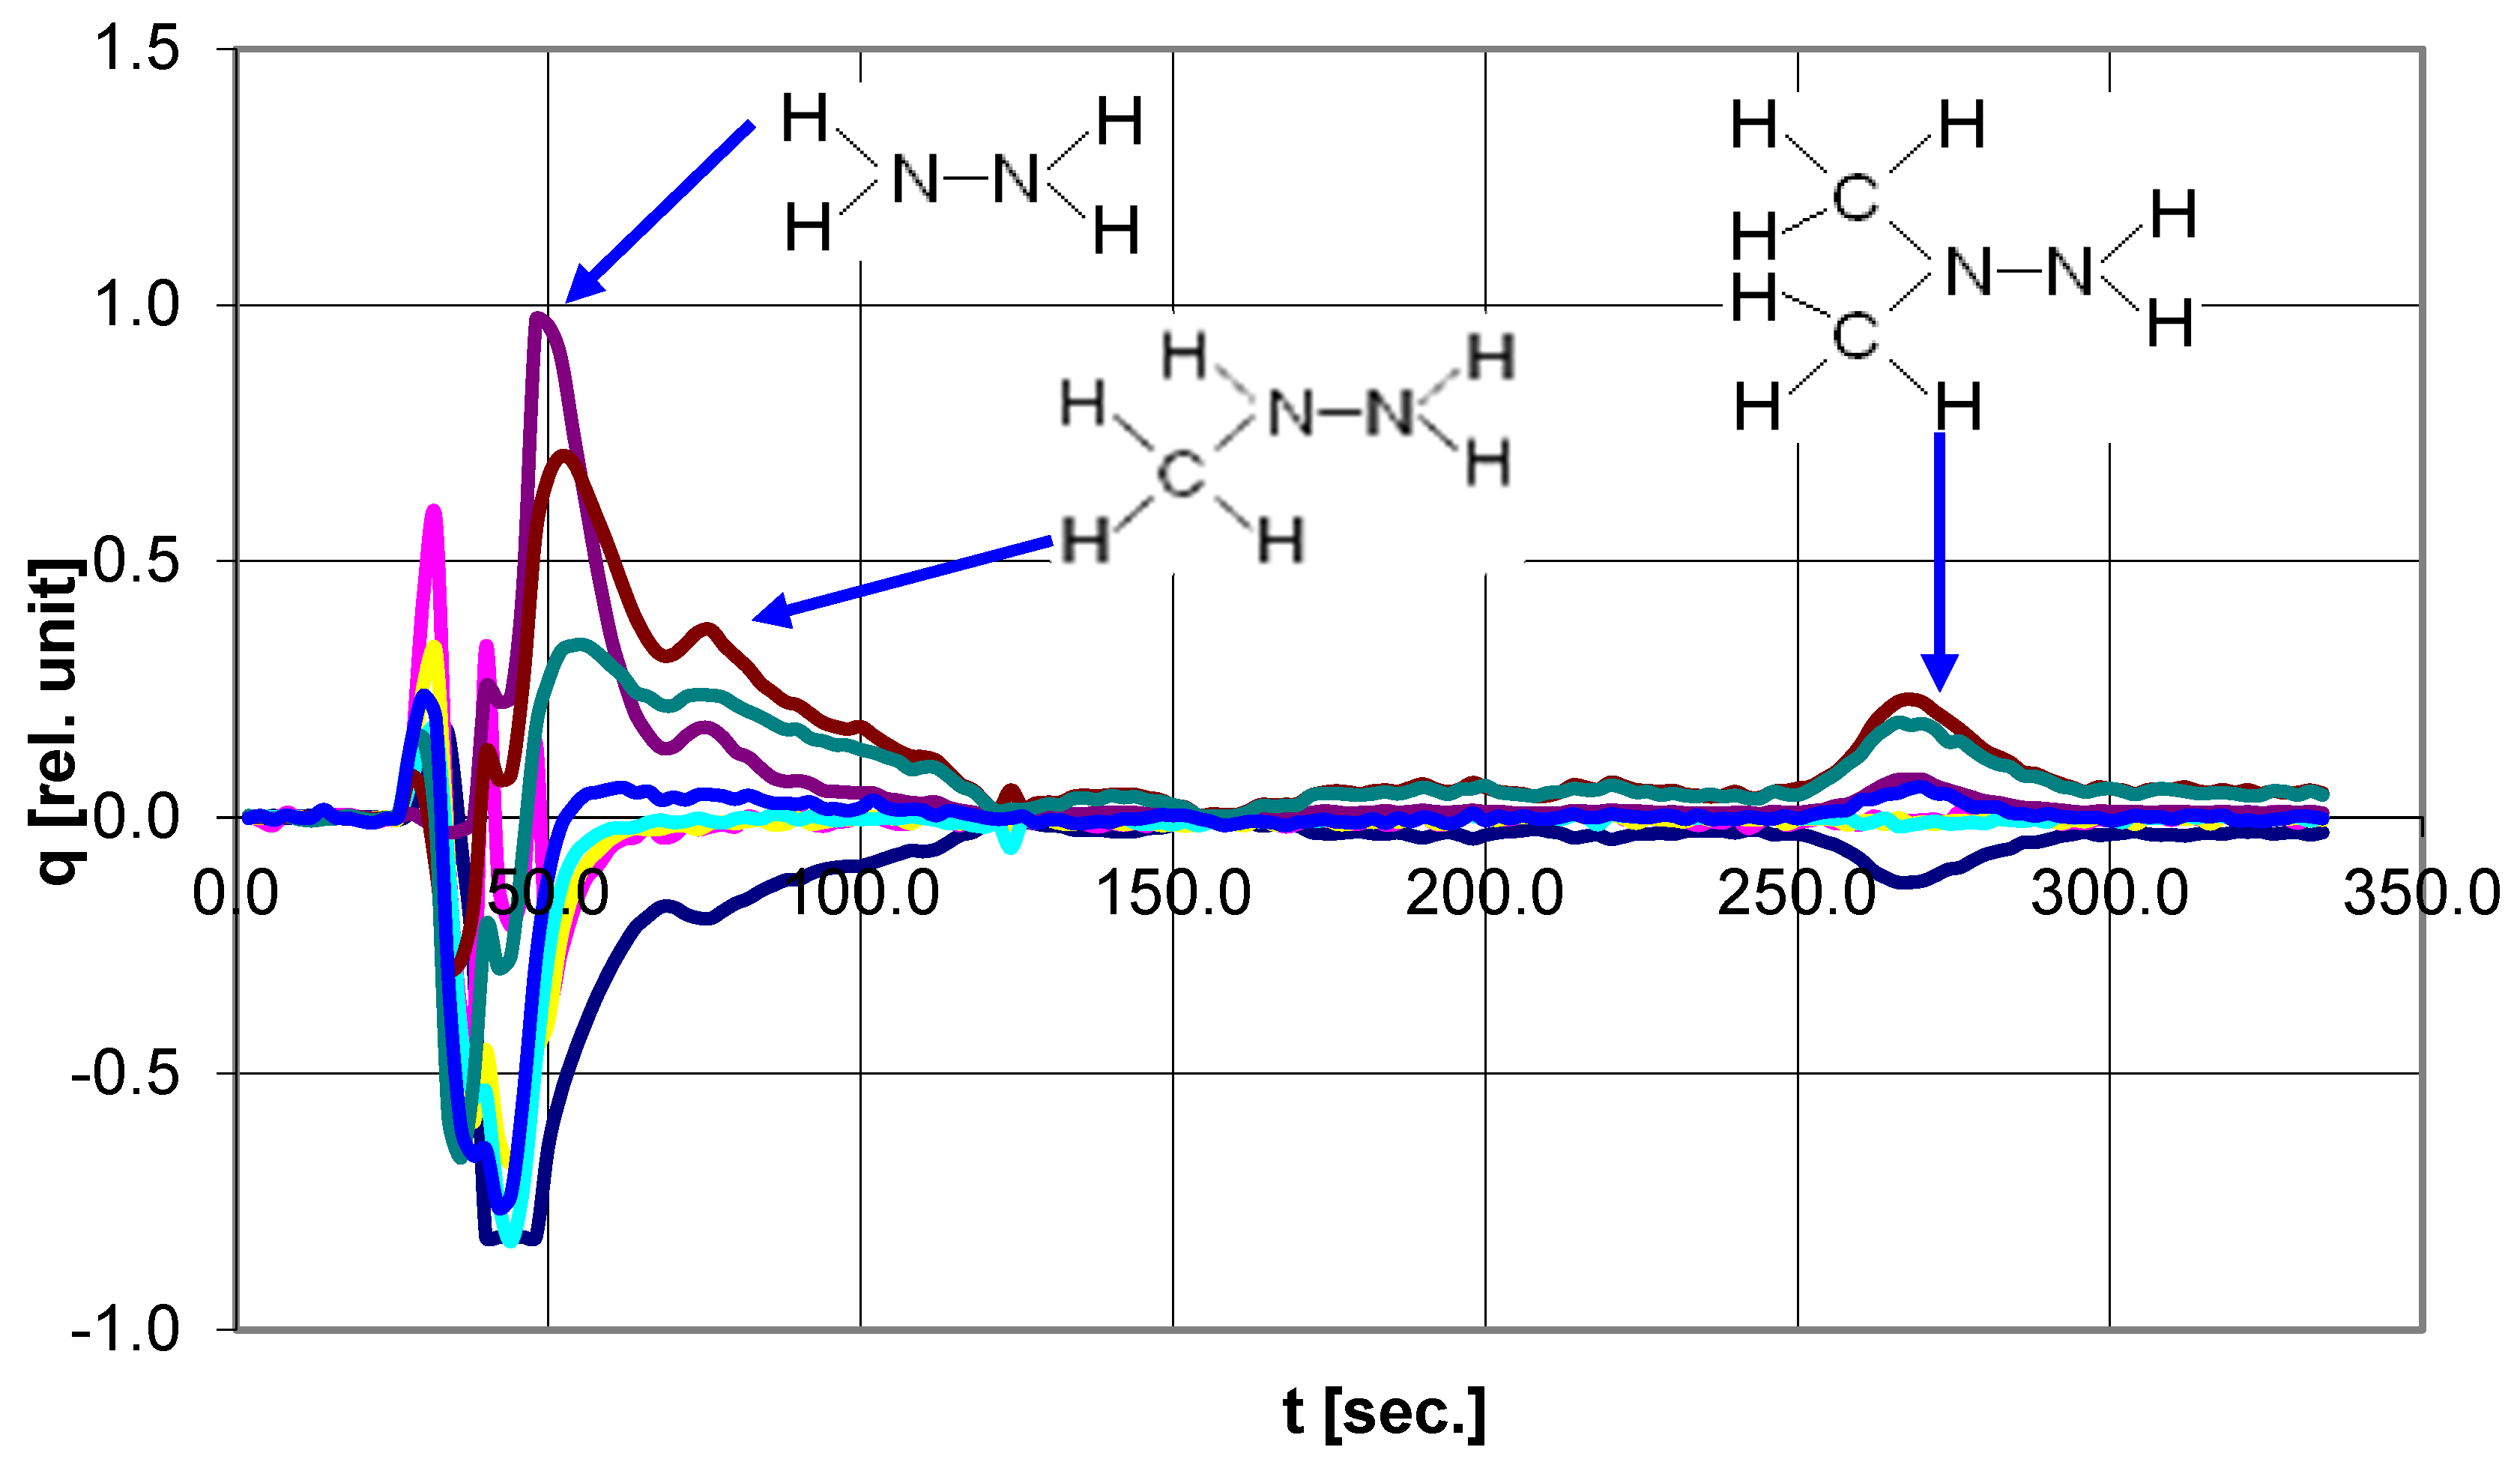
Secondly, of the numerous experiments conducted by the author on original devices of his own design from 2001 to 2010, those that best illustrate the discussed problems are presented. For example, a chromatogram was obtained using a single-channel electrochemical detector operating in scanning mode. This chromatogram is defective because the elution mode or chromatographic column was chosen incorrectly. For this reason, about 90 percent of the sample did not separate in the column. Nevertheless, this non-separated portion formed an interesting analytical signal, which shows that even without separation it is possible to reliably identify the sample by flow-through analysis.
The initial goal of the electrochemical analysis is to determine the concentration in the sample under study of one, less often several, a priori known analytes. To study multicomponent samples, other methods, such as pre-separation of the sample, have to be added to the electrochemical methods. Nevertheless, even this method will not help to determine the composition of water taken from the nearest puddle, because we simply do not know what to look for in this water, i.e., we have no a priori information. However, we can use electrochemical methods, without resorting to separation, objectively showing that the water in this puddle is different from tap water. At first glance, such a procedure seems absolutely meaningless, but it is not so.
For example, the way to solve important tasks, such as food analysis, the detection of adulterants, and the analysis of biological samples is based on revealing objective differences between the control sample and the sample under study. According to these objective differences, we can classify the samples, as biologists classify living organisms. Of course, in the example of water from a puddle, this approach does not work, because the matrix of combinations of different substances and their concentrations has an almost infinite dimension, hence, there is no a priori information. On the contrary, the a priori information is quite enough to solve the problem of classification of samples of known composition. For this purpose, it is enough to obtain information about the differences between the sample and the standard by means of electrochemical analysis, to the extent necessary to classify the sample. The degree of detail of such classification depends only on the amount of information obtained.
Such an approach to electrochemical analysis would have seemed unrealistic yesterday. However, now all the prerequisites for its implementation have already been created.
In particular, the classification of samples according to the analytical signal can be performed by self-learning neural networks, which successfully solve similar problems in medical diagnostics, the prediction of various phenomena and processes, linguistics, and other fields.
The methods of electrochemical analysis presented in the article can be used to obtain a highly informative analytical signal. The methods are rather unusual, although they are based on the traditional technique of chronopotentiometry with current control of a constant value with current inversion in the given values of the potential of the working electrode.
The main difference between these methods and similar ones is that the analytical signal is a sequence of time intervals. Time is the only physical quantity that mankind has learned to measure with the highest accuracy over the widest range of values. Therefore, the accuracy of measurement and the dynamic range of measurement methods are limited only by the permissible duration of the analysis.
The high informativity of the methods is due to the fact that each time interval records a given change in the potential of the working electrode, thereby characterizing a certain stage of the electrochemical process. Such a mode of process control, which allows obtaining maximum information, is called adaptive. Each recorded time interval is an independent measurement. Since several thousand such intervals are recorded, the amount of information in the analytical signal is actually totaled.
The resulting digital analytical signal covers the entire potential range of biologically relevant electrochemical processes. Such a signal can serve as an objective electrochemical image of the sample. Objectivity is confirmed by the reproducibility of the signal under identical conditions and the property of mutual unambiguity with the sample composition. Of course, we cannot reproduce the sample by such a signal, because any information process is not reversible.
The author sees the greatest prospects of the proposed approach in medical diagnostics because one of the serious problems complicating the process of digitalization of medicine is the digitization of a huge array of medical test results.
This approach has a negative side as well; it is a formal “detachment” of the electrochemist from the interpretation of analysis results. However, in the author’s opinion, this will only benefit the common cause, since some subjectivism in the interpretation of the results of electrochemical analyses has been inherent in electrochemistry since its birth. It is sufficient to recall Alessandro Volta with his main measuring instrument. The author himself used his own tongue as a child when evaluating the performance of batteries for a flashlight.
Supplementary Materials
The following supporting information can be downloaded at: https://www.mdpi.com/article/10.3390/electrochem3040043/s1, Video S1: 3D chromatogram.mp4; Some special features of our techniques.pdf.
Funding
The development of an HPLC electrochemical detector was funded by the Fund for Assistance to Small Innovative Enterprises in Science and Technology (FASIE), Russian Federation. Start-2004 program, Project 5104.
Institutional Review Board Statement
Not applicable.
Informed Consent Statement
Not applicable.
Data Availability Statement
In this study did not report any data.
Acknowledgments
The author is grateful to Irina Novikova for the authentic translation of the manuscript from Russian into English and for several valuable comments made during the translation process.
Conflicts of Interest
The author declares no conflict of interest.
References
- Kazakov, Y.; Tarasov, A.; Alyoshina, L.; Brainina, K.H. Interplay between antioxidant activity, health and disease. Biointerface Res. Appl. Chem. 2020, 10, 4893–4901. [Google Scholar] [CrossRef]
- Kazakov, Y.; Khodos, M.; Vidrevich, M.; Brainina, K.H. Potentiometry as a Tool for Monitoring of Antioxidant Activity and Oxidative Stress Estimation in Medicine. Crit. Rev. Anal. Chem. 2018, 49, 150–159. [Google Scholar] [CrossRef] [PubMed]
- Sokolkov, S. Evolution of the analytical signal in electrochemistry from electrocapillary curve to a digital electrochemical pattern of a multicomponent sample. Electrochem. Sci. Adv. 2022, e2100212. [Google Scholar] [CrossRef]
- Scott, A.C. Active and Nonlinear Wave Propagation in Electronics; John Wiley & Sons Inc.: Hoboken, NJ, USA, 1970. [Google Scholar]
- Scott, A.C. The electrophysics of nerve fiber. Rev. Mod. Phys. 1975, 47, 487–553. [Google Scholar] [CrossRef]
- Crowley, J.M. Electrical Breakdown of Bimolecular Lipid Membranes as an Electrochemical Instability. Biophys. J. 1973, 13, 711–724. [Google Scholar] [CrossRef] [Green Version]
- Partenskii, M.; Jordan, P. Squishy capacitor model for electrical double layers and the stability of charged interfaces. Phys. Rev. E 2009, 80, 011112. [Google Scholar] [CrossRef] [PubMed]
- Duda, C.T.; Kissinger, P.T. Determination of biogenic amines, their metabolites, and other neurochemicals by liquid chromatography/electrochemistry. In Methods in Neurotransmitter and Neuropeptide Research. In Techniques in the Behavioral and Neural Sciences; Elsevier: Amsterdam, The Netherlands, 1993; Volume 11, Part 1, pp. 41–82. [Google Scholar] [CrossRef]
- Acworth, I.N.; Bowers, M. An introduction to HPLC-based electrochemical detection: From single electrode to mufti-electrode arrays. In Progress in HPLC; Acworth, I.N., Naoi, M., Parvez, S., Parvez, S., Eds.; VSP: Utrecht, The Netherlands, 1996. [Google Scholar]
- Leontovich, M.A. Introduction to Thermodynamics, Statistical Physics; Nauka: Moscow, Russia, 1983. [Google Scholar]
- Maxwell, J.C. Theory of Heat; Dover Publication: Mineola, NY, USA, 1871; pp. 308–309. [Google Scholar]
- Scilard, L. On the decrease of entropy in a thermodynamic system by the intervention of intelligent beings. Syst. Res. Behav. Sci. 1964, 9, 301–310. [Google Scholar] [CrossRef]
- Brillouin, L. Science and Information Theory; Academic Press Inc. Publishers: New York, NY, USA, 1956. [Google Scholar]
- Poplavsky, R.P. Thermodynamics of Information Processes; Nauka: Moscow, Russia, 1981. [Google Scholar]
- Bo, S.; Del Giudice, M.; Celani, A. Thermodynamic limits to information harvesting by sensory systems. J. Stat. Mech. Theory Exp. 2015, 2015, P01014. [Google Scholar] [CrossRef] [Green Version]
- Inzelt, G. Crossing the bridge between thermodynamics and electrochemistry. From the potential of the cell reaction to the electrode potential. ChemTexts 2014, 1, 1–11. [Google Scholar] [CrossRef]
- Brainina, K.H.; Bukharinova, M.; Stozhko, N.; Sokolkov, S.; Tarasov, A.; Vidrevich, M. Electrochemical Sensor Based on a Carbon Veil Modified by Phytosynthesized Gold Nanoparticles for Determination of Ascorbic Acid. Sensors 2020, 20, 1800. [Google Scholar] [CrossRef] [Green Version]
- Barker, G.C.; Jenkins, I.L. Square-wave polarography. Analyst 1952, 77, 685–696. [Google Scholar] [CrossRef]
- Sokolkov, S.; Zagorodnyuk, P. Portable Electrochemical Analyzers. State of Art and Prospects. Russ. Chem. J. (J. Mendeleev Russ. Chem. Soc.) 2001, 45, 5–6. [Google Scholar]
- Sokolkov, S.V.; Zagorodnyuk, P.N.; Karzhenkov, A.N.; Syrsky, A.V. Electrochemical Analysis Method. PCT WO 02/46736, 13 June 2002. [Google Scholar]
- Svendsen, C. Multi-electrode array detectors in high-performance liquid chromatography: A new dimension in electrochemical analysis. Analyst 1993, 118, 123–129. [Google Scholar] [CrossRef]
- Sokolkov, S.V. Electrochemical Analysis Method. PCT WO 2007/035130 A1, 29 March 2007. [Google Scholar]
Figure 1.
The nature of the change in the main parameters of the analytical signal with an increase in the size of the working electrode [8] (p. 50, Figure 6), adapted with the permission from ref. [8], Elsevier, 1993.

Figure 2.
Graphs of the dependence of the amplitude of the current peak (13) and the Faraday charge flowing through the working electrode (17).
Figure 2.
Graphs of the dependence of the amplitude of the current peak (13) and the Faraday charge flowing through the working electrode (17).

Figure 3.
The change of the working electrode potential during time intervals is shown schematically.
Figure 3.
The change of the working electrode potential during time intervals is shown schematically.

Figure 4.
Initial analytical signal of analyzer “ASC-2000”. Matrices of time intervals (a,c)—anodic prosses, (b,d)—cathodic prosses.
Figure 4.
Initial analytical signal of analyzer “ASC-2000”. Matrices of time intervals (a,c)—anodic prosses, (b,d)—cathodic prosses.


Figure 5.
Diagram illustrating the technology of obtaining 3D HPLS chromatograms [20] using a multi-electrode array electrochemical detector. A chronoamperometry technique is used. Each of the eight working electrodes has a given potential (u1–u8).
Figure 5.
Diagram illustrating the technology of obtaining 3D HPLS chromatograms [20] using a multi-electrode array electrochemical detector. A chronoamperometry technique is used. Each of the eight working electrodes has a given potential (u1–u8).

Figure 6.
3D chromatogram obtained with one coulometric cell operating in a cyclic mode (scan mode).
Figure 6.
3D chromatogram obtained with one coulometric cell operating in a cyclic mode (scan mode).

Figure 7.
2D chromatogram obtained by scanning coulometry.

Publisher’s Note: MDPI stays neutral with regard to jurisdictional claims in published maps and institutional affiliations. |
© 2022 by the author. Licensee MDPI, Basel, Switzerland. This article is an open access article distributed under the terms and conditions of the Creative Commons Attribution (CC BY) license (https://creativecommons.org/licenses/by/4.0/).
Share and Cite
MDPI and ACS Style
Sokolkov, S.V. Electrochemical Digitization of Biological Fluids Samples. Electrochem 2022, 3, 653-667. https://doi.org/10.3390/electrochem3040043
AMA Style
Sokolkov SV. Electrochemical Digitization of Biological Fluids Samples. Electrochem. 2022; 3(4):653-667. https://doi.org/10.3390/electrochem3040043
Chicago/Turabian StyleSokolkov, Sergey V. 2022. "Electrochemical Digitization of Biological Fluids Samples" Electrochem 3, no. 4: 653-667. https://doi.org/10.3390/electrochem3040043