Article

Nonperturbative Generation of Harmonics by Nanometer-Scale Localized Electronic States on the Surface of Bulk Materials and Nano-Films

1
Quantum Metrology Group, Institute for Atomic and Subatomic Physics—E141, TU Wien, Stadionallee 2, 1020 Vienna, Austria
2
Micro and Nanofabrication Clean Room, Institute of Microelectronics of Barcelona, IMB-CNM (CSIC), Campus UAB, Cerdanyola, 08193 Barcelona, Spain
3
Group of Heterostructures for Optics and Optoelectronics, Institute of Materials Science of Madrid (CSIC), Cantoblanco, 28049 Madrid, Spain
*
Author to whom correspondence should be addressed.
Optics 2023, 4(1), 246-257; https://doi.org/10.3390/opt4010017
Submission received: 7 February 2023 / Revised: 8 March 2023 / Accepted: 9 March 2023 / Published: 13 March 2023
(This article belongs to the Special Issue Opto-Thermo-Mechanical Interactions in Nano-Objects and Metasurfaces)

Abstract

:
The generation of high-order harmonics in solid crystals has received considerable attention recently. Using a driver laser with 0.8 µm wavelength and 28 fs ultrashort pulses, we present experimental results, accompanied with theoretical considerations, suggesting that the actual sources of the harmonics are nanometer-sized localized and transient electronic states on the surface of the materials when the laser intensity is in the non-perturbative regime. Adaptation of the bond model of the harmonic generation into the non-perturbative regime and including the quantum features of the process provide a localized excitation approach that correctly describes the measured polarization dependence of the harmonic signal, reflecting the microscopic surface structure and symmetries of the examined materials.

Graphical Abstract

1. Introduction

Generating high-order harmonics using different solid materials is triggering high interest because of the large variety of candidate crystalline materials as compared to noble gases. Additionally, forming nanostructures on the surface of the material can further enhance the efficiency of harmonic generation [1,2,3]. Beyond serving as a source, the process of harmonic generation can be exploited to study the materials themselves [4,5,6]. However, the exact origin of the generated harmonics, namely, emerging either from processes at the surface or from inside the material (bulk), is an interesting topic under debate. Several experiments were performed to address this question with controversial outcomes: some publications argue the bulk origin [7,8,9,10] while others argue on the side of the surface origin [11,12]. Unfortunately, the distinction between perturbative or non-perturbative regimes of harmonic generation, which is determined by the laser intensity applied, namely being in the GW/cm2 or in the TW/cm2 regimes, has been frequently ignored in these considerations; however, it is of utmost relevance [13].
In this paper, we first shortly summarize the arguments on the side of the bulk and surface origin of harmonic generation, respectively. After that, we discuss the differences between the perturbative and non-perturbative generation of the harmonics and present a simple semiclassical theory to describe the non-perturbative generation of harmonics with nanometer-sized localized electronic states on the surface. This theory also points to the importance of the applied laser wavelength. Finally, we present experimental results, which can be well described by the generation of harmonics on the surface of bulk materials and nano-films.

2. Arguments for Surface or Bulk Generation of Harmonics

The experiments performed to address the origin of the high harmonic (HH) generation in solids can be coarsely summarized to yield three main observations: the harmonics are stronger when the laser focus is in the surface area of the materials; the generated harmonics spatially propagate together with the fundamental laser beam; the dependence of HH yield on the laser polarization carries information about the structural symmetry of the materials.

2.1. Strong Harmonic Signal from the Surface Area

The first observations of the phenomena of 3rd (H3) and 5th (H5) harmonics generation in solids [14,15] were interpreted as the harmonics being generated on the surface of the material or on the interface between two materials. Later, the surface origin was debated [7], and generation of H3 within a thin surface layer was explained similarly to perturbative second harmonic (H2) and H3 generation [16,17]. In that study, a thin Si wedge-shaped layer between SiO2 was used, and the thickness dependence of the H3 signal was compared with calculations of the bulk and surface contributions. The conclusion, however, is controversial. First, perturbative theory of surface H2 was adopted. Secondly, the surface contribution was fitted to the measurement at large material thickness, contrary to the expectation that the bulk contribution should decrease (and surface contribution dominate) with decreasing material thickness.
In several experiments, z-scans were performed, and maxima of harmonic signals located at the surfaces/interfaces were observed, which alone does not contradict the hypothesis of a bulk origin of the generation. For perturbative generation of the harmonics, the Gouy phase contribution of the tightly focused laser beam can produce such effects as argued in [8,18,19]. In our experiment [11], the harmonic signals were measured within a large dynamic range of up to five orders of magnitude at non-perturbative peak laser intensities of ~1 TW/cm2. The measurements were compared with both bulk and surface calculations, and the bulk model diverted the measurements if the harmonic intensity decreased by more than one order of magnitude, while the surface model correctly reproduced the measurements within the full five orders of magnitude intensity range.
The problem was also addressed in [10] by comparing harmonic signals from free standing and substrate-supported nano-membranes. If the harmonics originated from the bulk, no difference should have been observed; if the harmonics originated from the surfaces, an about two-times smaller signal should have been observed in the case of substrate supported sample. Essential differences were measured; however, no straightforward conclusion has been drawn, probably because the measurements were performed at ~1 GW/cm2 perturbative intensities to avoid damaging the sample.

2.2. Co-Propagation of Harmonic Beam with the Fundamental Laser Beam

We measured the harmonics at different large oblique angles of incidence and found that the harmonic beam propagates colinearly with the fundamental laser beam [12]. Similar co-propagation of the laser and the harmonic beam is observed in the measurements presented in this study. In [12], the harmonics were observed even when the harmonic beams should undergo total reflection on the surface. This anomaly can be easily explained by assuming a surface origin of the harmonics. Others observed some differences [19] in the propagation directions. In that experiment, a lens was used for imaging the beams to a camera, and the chromatic aberration of the lens could cause a similar effect. Such an experimental artefact was also observed in our measurements. Using a more reliable method [20], beams were found to co-propagate. If bulk generation is assumed, the co-propagating beams are in contradiction with the Snell’s law of refraction. To overcome this contradiction, it was assumed [20] that beam dispersion and the law of refraction do not have to be considered for the case of thin surface layers in the tens of nanometer range, where these harmonics are assumed to be generated as the consequence of such short phase matching and absorption lengths. These assumptions were considered and applied without a supporting theory. Such thin films are frequently characterized by optical methods, and using thin films, wavelength selective multilayer mirrors are successfully realized. In most of the other experiments, a near-normal-incident laser beam was applied, when this phenomenon did not occur or was ignored [9] at oblique angles.

2.3. Polarization Dependence of the Harmonic Signal

The surface or bulk origin of the harmonic generation can also be studied and addressed by measuring the dependence of the harmonic signal yield on the laser polarization. Such measurements were performed on nanofilms [10] but at ~1 GW/cm2 perturbative intensity. Pronounced anomalies in the polarization patterns were found in the nonperturbative regime on GaAs samples [13]. In our measurements, we found that, assuming a surface/interface origin, such deviations from the bulk symmetry can be easily explained.

3. Role of Localized States on the Surface

3.1. Phenomenological Comparation of Perturbative and Non-Perturbative HH Generation

The non-perturbative nature of high harmonic generation based on atoms, solids [1,2,9,11,13] or even optomechanical systems [21] can manifest itself in two features: 1st the appearance of the plateau followed by a sharp cutoff in the spectrum and 2nd the deviation from the perturbative scaling law of the harmonic intensities. The second feature is the center of our attention in this study. We shortly compare the perturbative and non-perturbative generation of harmonics to establish a base for introducing a simple semiclassical model of non-perturbative harmonic generation. In the perturbative case, the illuminating laser collectively polarizes the atoms (or chemical bonds) in the crystal as illustrated in Figure 1a. If the laser field is strong enough to produce nonlinear polarization, but it is not too strong (remains in the GW/cm2 regime or below), then the electric field dependence of the polarization can be expressed using a Taylor series [22], and the electric field amplitude of the q-th harmonic is given by:
E q χ ( q ) E 1 q
where the angular frequency of the q-th harmonic is ω q = q ω 1 , and obviously q = 1 means the fundamental laser’s angular frequency, laser field, etc. The nonlinear susceptibility can be calculated from the susceptibility tensor and the unit vectors of the electric fields: χ ( q ) = e ^ q T χ ( q ) e ^ 1 · · e ^ 1 . Equation (1) means that the harmonic intensity is proportional to the q-th power of the laser intensity: I q I 1 q . However, when strong laser fields were applied, the experiments observed a different power dependence [4,11,13,23,24,25,26,27], namely I q I 1 r with typically r   q . This anomaly can be explained phenomenologically by assuming an intensity dependent susceptibility:
χ ( q ) ( I 1 ) χ 0 ( q ) + χ np ( q ) I 1 p
When the intensity is small, the first term dominates, and when the intensity is large, the second term is the dominant one, separating the perturbative and non-perturbative regimes:
Perturbative :   I q [ χ 0 ( q ) ] 2 I 1 q ,  
Non - perturbative :   I q [ χ np ( q ) ] 2 I 1 r ,   r = 2 p + q .
The experiments [4,11,13,23,24,25,26,27] show that p can be positive or negative, and r should not be an integer. The form of Equation (4) is commonly used to describe non-perturbative harmonic generation in solid, albeit the rank (r) can be different for different intensities; it still can be well applied in limited intensity ranges. A more accurate description of the non-perturbative process should still be established.

3.2. Photon–Atom Balance in Crystals

The above-mentioned description of HH generation is based on the assumption that the atoms/bonds are collectively polarized in the solid material as illustrated in Figure 1a, which is a very successful approach to describe perturbative generation of harmonics. However, if one compares the atomic density with the photon density, a problem arises. Under typical experimental condition, as they are used below, at ~1 TW/cm2 laser intensity, 28 fs pulse duration and 0.8 µm wavelength, the photon density is ~108 photons/µm3, while the atomic density of a usual solid crystal is ~1010 atoms/µm3. It means few photons for every 100 atoms. Especially, if we consider that only a small fraction of the photons (~10−3 conversion efficiency for H3) produce a conversion to harmonics, the interaction would be better understood by assuming that individual atoms/bonds are excited and radiate, as illustrated in Figure 1b. Below, we will show that this individual (or localized) excitation approach, which expresses the quantum nature of the process, is better suited to describe non-perturbative HH generation.

3.3. HH Generation from Localized States

In the illustrated case of Figure 1b, in the strong laser field, the incident laser photons excite atoms or bonds usually in multiphoton processes. Using ultrashort pulse at the femtosecond time scale, the electrons are in a short-lived transient state, and the electrons physically remain in the vicinity of the excitation and can be represented as localized wave packets. Such localized states or wave packets can be, e.g., conduction band-edge wave functions [28] or dangling bonds [29,30,31]. In the strong laser field, the electrons are easily moved into the continuum, accelerated by the laser field, and recombine similarly to gases [32]. In gases, at suitable atomic density and laser intensity, the surrounding atoms can affect the harmonic generation process [33]. In solids, the periodic field of the crystal plays an important role. To understand the generation of harmonics in crystalline solids, transitions between the localized state and the continuum need to be accounted for. The harmonic field is generated by the oscillating dipoles; therefore, the corresponding transition dipole moment [32] should be calculated using the wave functions of the localized state Ψ l and the continuum Ψ c :
d c l = e Ψ c | x | Ψ l
In the present analysis, the one-dimensional case is considered for simplicity, with the x-coordinate parallel to the surface of the material and to the laser polarization. The electrons in the continuum, after undergoing strong field or tunnel ionization, are free and can be described by a plane wave carrying momentum p = k and normalized to one unit cell with lattice constant a and reciprocal lattice constant G = π / a :
Ψ c ( x ) = 1 a e i k x
In the continuum, the electrons are accelerated by the laser field, which in our case is polarized in x-direction. The accelerated electrons, after gaining energies and following different trajectories, can recombine. If the local static electric field of the neighbor atoms is not too strong compared to the electric field of the laser beam, the electrons move mainly parallel to the laser field, and we can assume the system as one-dimensional for simplicity.
The electron in the ground state is in the valence band and can be described using a delocalized, static wave function in the form of a one-dimensional cosine function [34,35]. The zero of the coordinate system is chosen to locate at a space-charge maximum (atom or bond) and normalized to one unit cell. This means that the wave function extends over many neighbor atoms. Then, the electron is excited into a localized state Ψ l ( x ) , which is limited to few neighbor atoms and can be described by a sine function by adding an exponential decay [36]:
Ψ l ( x ) = i A G 2 a e γ | x | ( e i G x c . c . )
with A G = a γ . Note that Equation (7) also describes the case of a delocalized wave function with γ = 0 and A G = 1 . One can even consider any periodic wave function with its Fourier series summed over all possible G:
Ψ l ( x ) = i 2 a G A G e γ | x | ( e i G x c . c . )
Then, the transition dipole moment reads:
d c l ( k ) = i e a 2 G A G 0 [ e [ γ + i ( G + k ) ] x e [ γ i ( G k ) ] x c . c . ] x d x
Due to the integrals in Equation (9) being Laplace transforms, one obtains four complex terms, which can be further simplified to two:
d c l ( k ) = 4 e a π 2 G A G [ ( γ / G ) ( 1 + k / G ) [ ( γ / G ) 2 + ( 1 + k / G ) 2 ] 2 + ( γ / G ) ( 1 k / G ) [ ( γ / G ) 2 + ( 1 k / G ) 2 ] 2 ]
As one can see from the calculations in [28], conduction band-edge wavefunctions are localized exclusively on the surface and oriented perpendicular to the surface, while they are delocalized inside the material. Other localized wave functions like dangling bond are also dominantly located on the surface. Inside the material (bulk), where the wave functions are mainly delocalized, γ 0 , or more generally a γ 1 , and the transition dipole far from resonances ( k ± G ).
d c l b u l k ( k ) d c l s u r f a c e ( k )
Consequently, the transition dipole for localized states on the surface is much larger than that for the delocalized states inside the crystal, meaning much weaker harmonics from inside a bulk crystal.
How much the electronic wave function remains localized during the acceleration in the continuum is strongly dependent on the wavelength and pulse duration of the laser used for harmonic generation. This effect will be treated in the Section 5 “Discussion”.

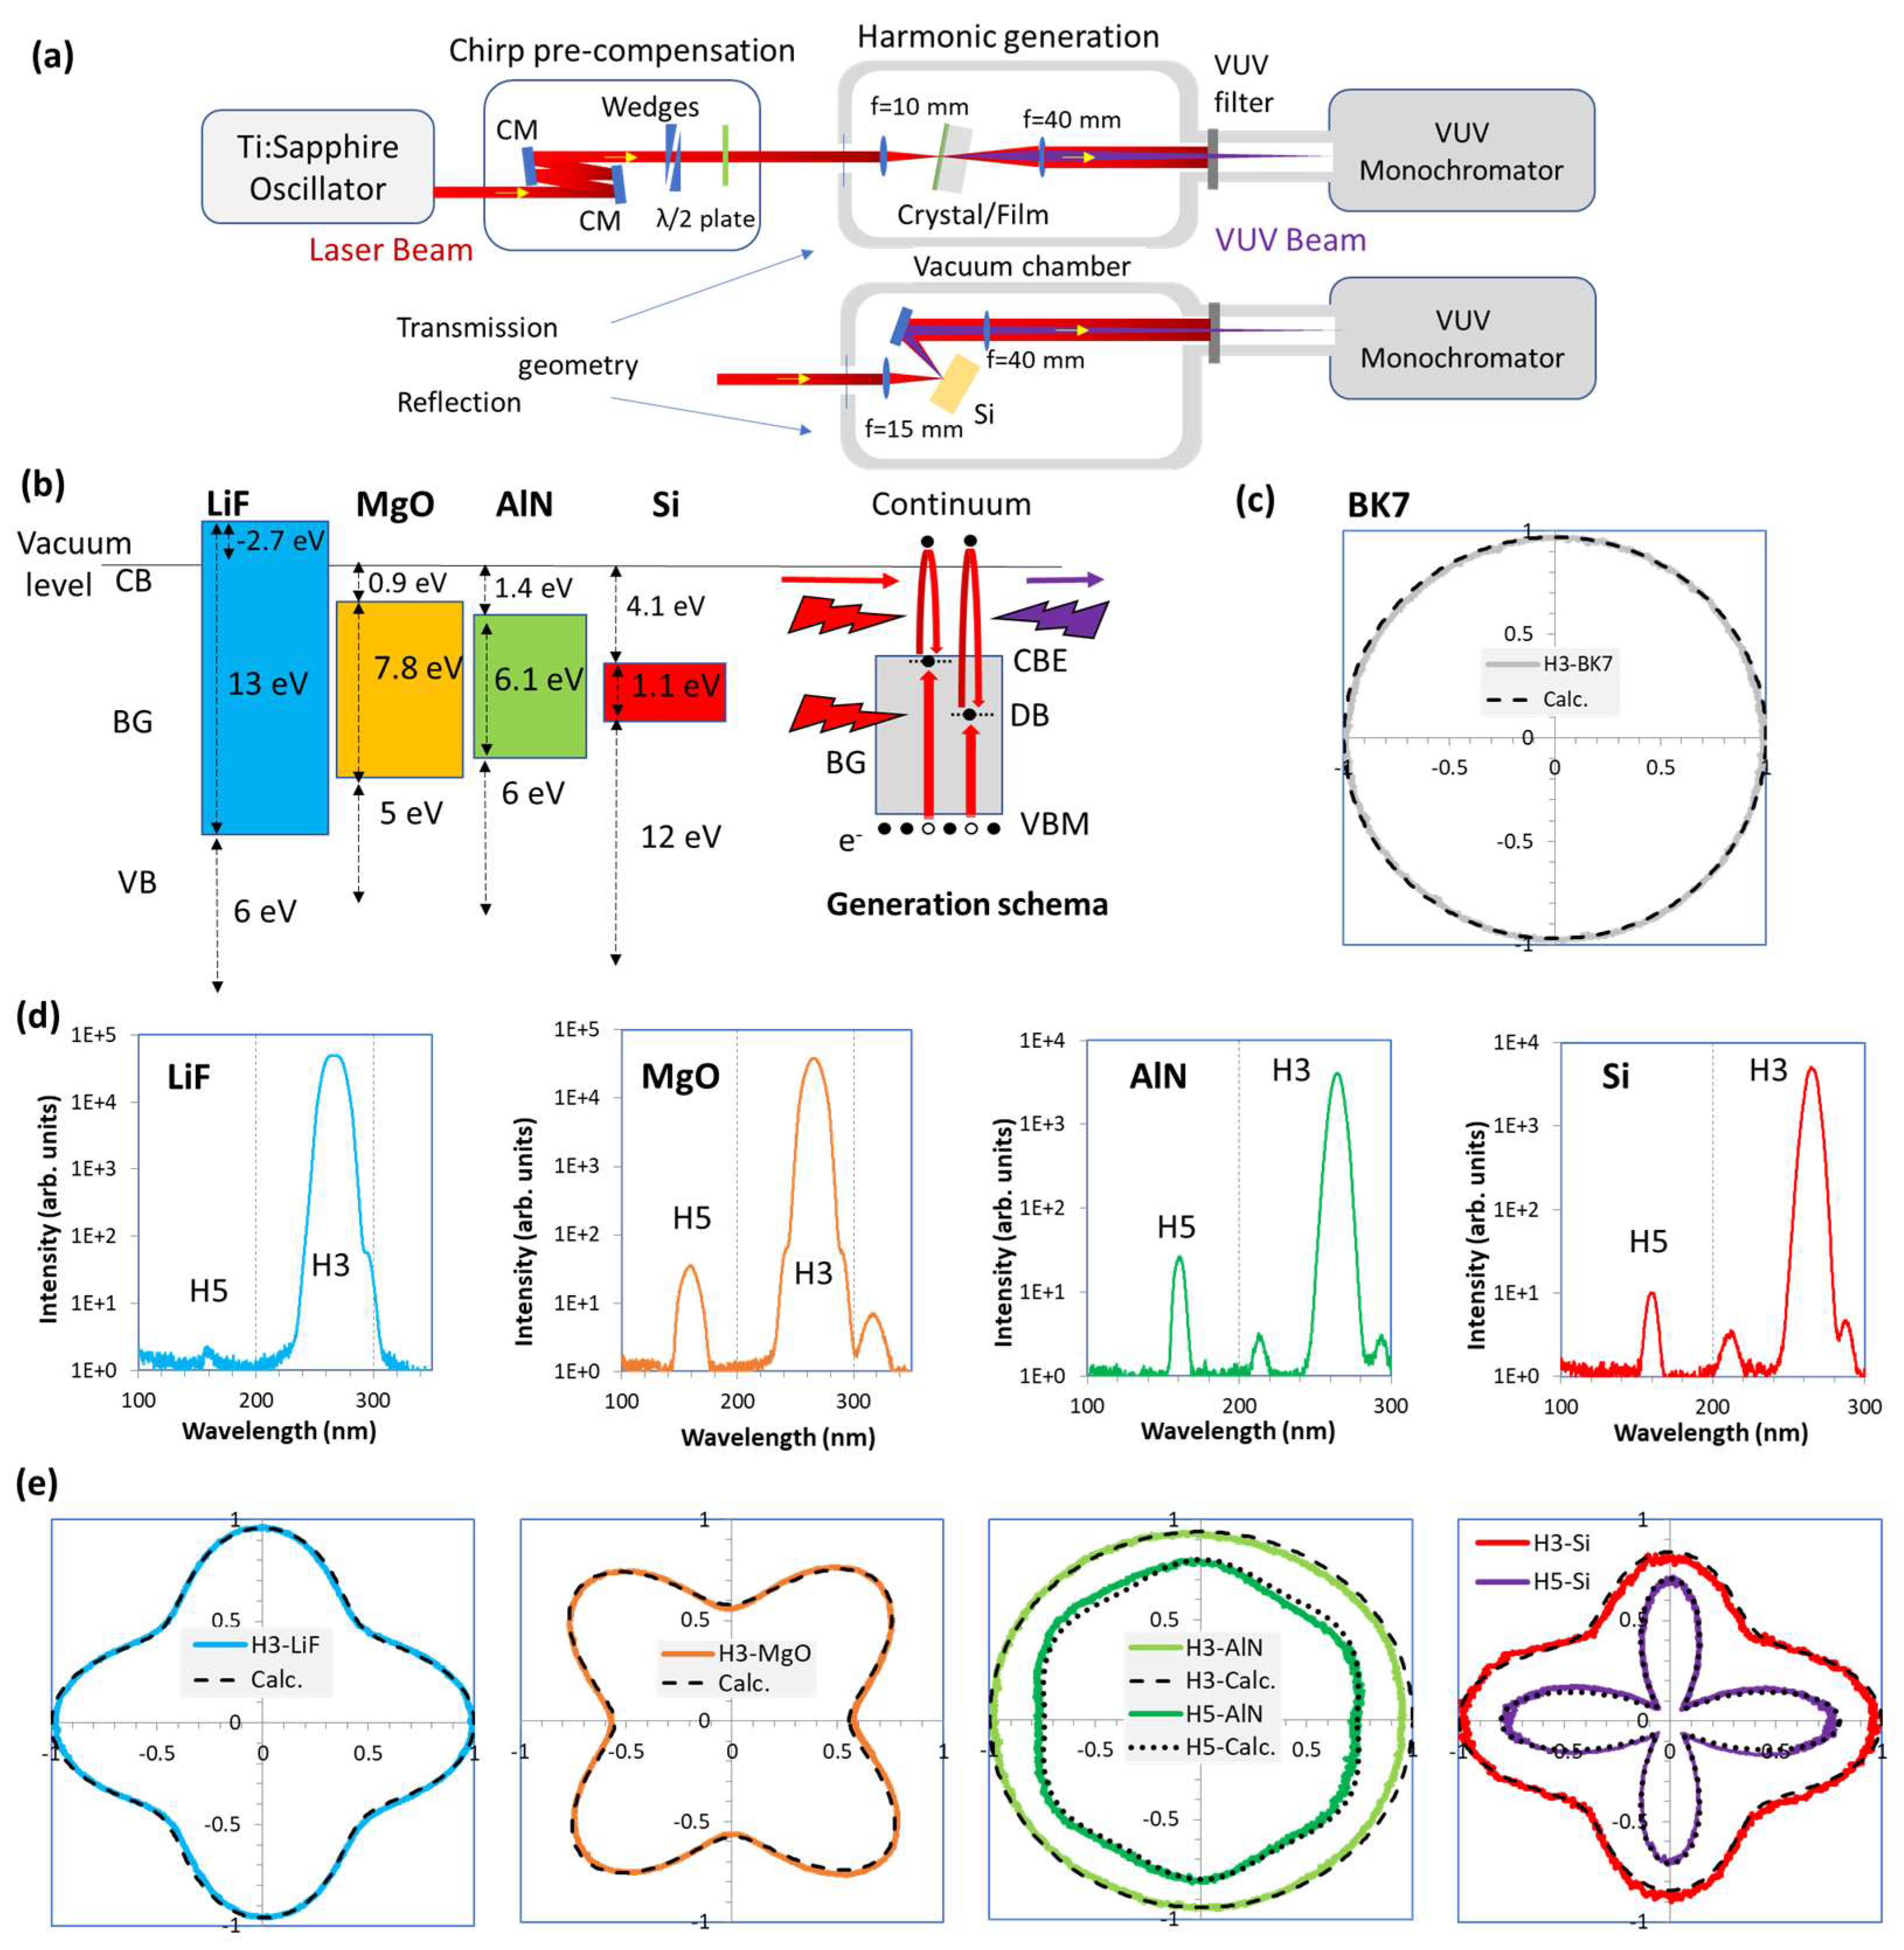
4. Experimental Results

4.1. Adaptation of Bond Model to Non-Perturbative HH Generation

By stepping beyond the phenomenological description of the non-perturbative HH generation given by Equation (4), it is possible to gain a deeper understanding of the process. A suitable way to handle individual/localized excitations can be the adaptation of the bond model of the harmonic generation [37,38,39]. This model is built for describing perturbative harmonic generation, but it can be easily adopted and extended to the non-perturbative case. The bond model assumes that the system (in our case the crystal) consists of charges (electrons), which are localized in bonds. The incident laser field can anharmonically polarize these bonds only in their representative directions, and consequently the polarization of the bonds depends on the relative polarization direction of the laser field. The polarized bonds radiate as dipoles according to their directions, and the superposition of these radiated fields produces the field of the harmonics. It is not necessary to know the susceptibility tensor but only the directions of the bonds. A harmonic generated due to the anharmonic polarization of the bonds can be expressed as:
E q j d j ( b ^ j e ^ 1 ) = j q j ( b ^ j e ^ 1 ) q + 1 E 1 q .
where b ^ j and e ^ 1 denote unit vectors giving the directions of the bond j and the electric field, and q j is the q-th order hyperpolarizability of bond j. The scalar product ( b ^ j e ^ 1 ) = cos ( ε β j ) is dependent only on the difference of the laser polarization direction ε and the direction of the bond β. This can be easily generalized and adopted for the non-perturbative case by assuming that the charges are localized in atoms or bonds and that there are directions indexed by j, in which these atoms or bond can be polarized most strongly. In that case, the Equation (12) can be written for non-perturbative HH generation as:
E q E 1 r j r j | cos ( ε β j ) | r ( + 1 ) ,
where r should not be an integer number, as mentioned for Equation (4). The power of the cosine can be “r” or “r+1” depending on the strength of the crystal potential. If the crystal potential can force the electron to move along, then the dipole is d j b ^ j , and the power is “r+1”, similar to the perturbative case. However, if the laser field is suitably strong and determines the motion of the electron, then the dipole is directed into the direction of the laser field, d j e ^ 1 , and because ( e ^ 1 e ^ 1 ) = 1 , the power is “r”. We assume the second case as default under our experimental conditions. It is important to note that this simple description of the non-perturbative HH generation assumes that the atom/bond polarizabilities are the same for positive or negative electric field (centrosymmetric) and that the polarization direction of the harmonic is the same as that of the laser field. Consequently, it can be applied only for odd-order harmonics; however, the bond model can be used for even-order harmonics as well, as can be seen in [37,38,39] using a somewhat more complex formalism.

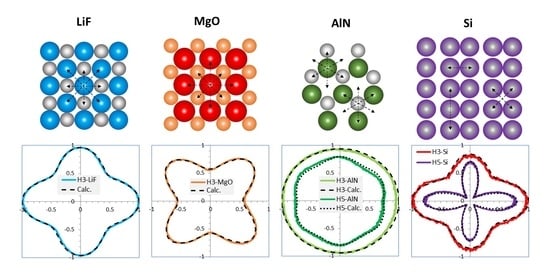
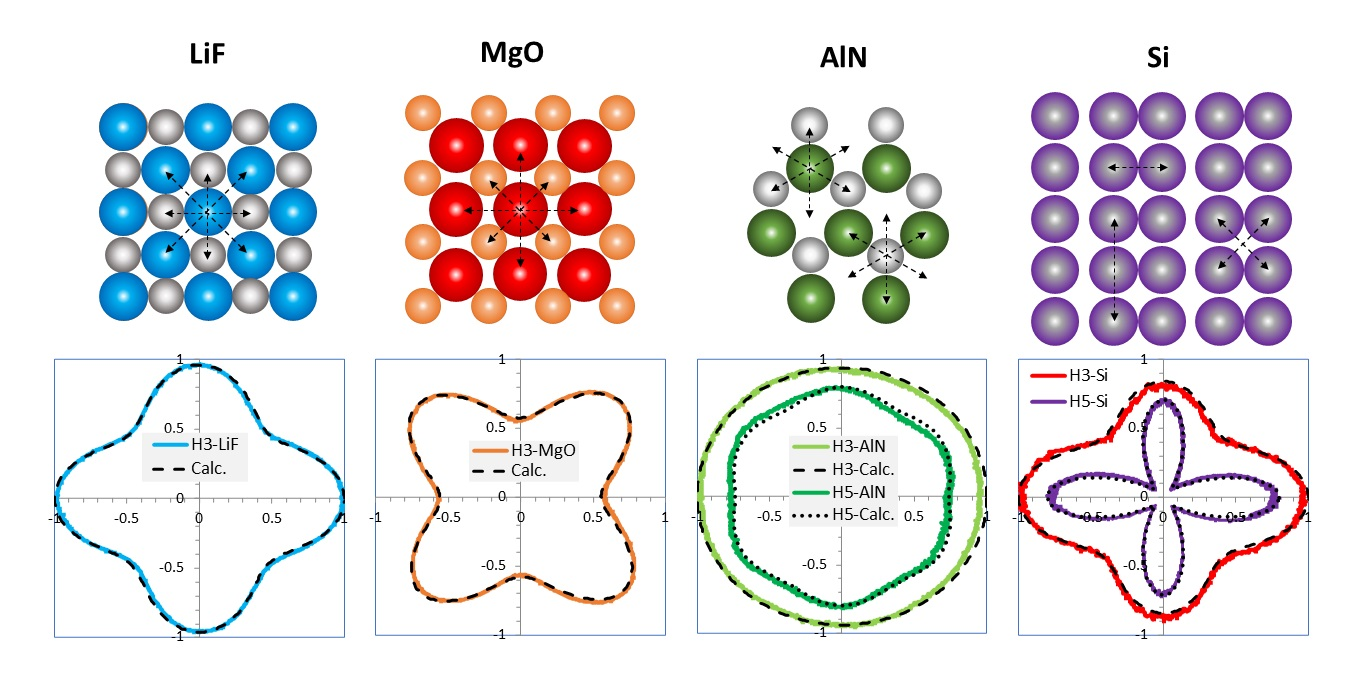
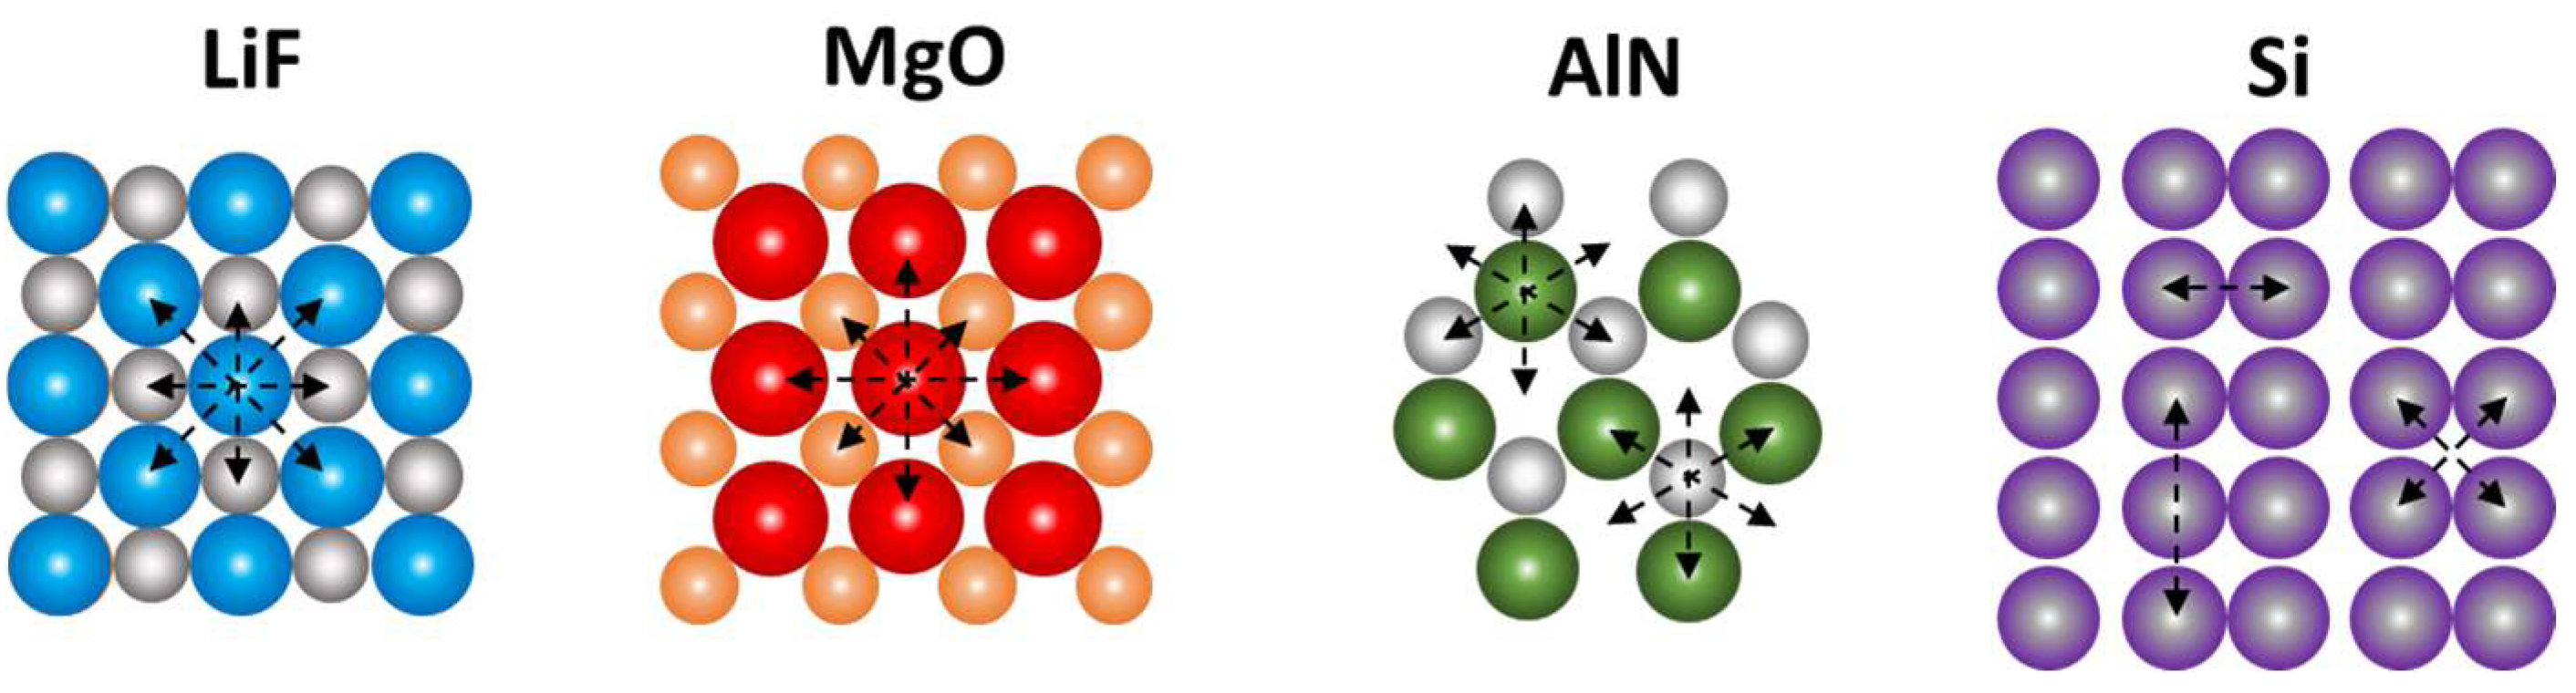
4.2. Application of Bond Model for I–VII, II–VI, III–V and IV–IV Crystals

The first experimental series were performed using LiF, MgO and Si crystals and AlN nanofilm (100-nm-thick) grown on sapphire substrate. The band–gap structures of these are shown in Figure 2b with the excitation processes. The parameters of the band structures are taken from [40,41,42,43,44,45,46]. The laser to drive the HH generation was a Ti:sapphire oscillator delivering 28 fs ultrashort pulses at 0.8 µm wavelength at 108 MHz repetition rate. The pulses were tightly focused by a lens (f = 10 mm) to reach a near 1 TW/cm2 intensity in the focus. The experimental setup is presented in Figure 2a. The output pulses of the oscillator were negatively chirped using chirp mirrors and a BK7 wedge pair to pre-compensate the material dispersion of the window of the vacuum chamber and the focusing lens to obtain a compressed short pulse in the focus for the optimal generation of the harmonics. The crystals LiF and MgO and the AlN film were placed into the focus, and the harmonics were generated on the front surface as presented in Figure 2a. Choosing the front surface is crucial to get correct information about the polarization dependence, because any birefringence or optical activity of the crystal or substrate can distort the polarization of the incident laser beam and corrupt the measurement. The spectra were measured using a McPherson 234/302 scanning VUV spectrograph. Si is not transparent at 0.8 µm, thus the harmonics were measured in reflection geometry.
To measure the polarization dependence of the generated harmonics, a half-wave plate was placed into the laser beam, and the polarization direction was scanned due to a motorized rotation stage, and the signal of the selected harmonic was measured after the monochromator. For reference, a BK7 glass plate was used, which is an amorphous material and should not exhibit any polarization dependence. From BK7 glass, it was not possible to produce the 5th harmonic (H5), only the 3rd harmonic (H3), and the polarization dependence of the H3 signal together with the calculated one (dashed line) is plotted in Figure 2c. As expected, there is strictly no polarization dependence measured; only a small ellipticity can be observed in vertical direction. This can be caused by several reasons: the crystal surface was not placed in normal incidence but under ~10° to avoid back reflection of the laser beam into the oscillator; the half-wave plate had some imperfection because of the relatively broad spectrum of the laser; or the monochromator grating has a small polarization dependence. The ellipticity was considered in the calculation with a factor 0.96, and a corresponding correction was made in every following measured case.
The measured spectra of the generated harmonics in Figure 2d consist of strong H3 at 267 nm for every measured material. In the case of LiF, H5 at 160 nm can just be recognized. For MgO, H5 is stronger. For AlN film and for Si, the signals were strong enough to perform spectral measurement with better resolution. It is even so for Si, when reflection geometry was used and consequently it was not possible to set 10° angle of incidence, only 20°, and a lens with longer focal length (f = 15 mm) was used resulting in lower laser intensity. For LiF and MgO, because of the weak H5, it was only possible to measure the polarization dependence of H3. Both are cubic crystals, m3m group 225, and surfaces were in (001) direction. The crystal structures of the surface are presented in Figure 3. The measured polarization curves can be seen in Figure 2e. To calculate the polarization curves (black dashed lines), Equation (13) is used; it is assumed that the electrons of F and O atoms participate, and polarizabilities contribute mainly to the direction of nearest neighbor atoms and somewhat less contribute to the directions of the next neighbor atoms. The justification will be given in the section “Discussion”. In the case of AlN and Si, the signals were strong enough to measure a polarization dependence for both H3 and H5. The surface of the AlN film is oriented in (0001) direction; it is a hexagonal crystal structure 63 m group 186. Every atom has three nearest neighbors contributing only to the signal, and only these are used to calculate the polarization signal. The calculated signals fit well to the measured ones, and the hexagonal structure from H5 is well recognizable. Si has a cubic crystal structure; m3m group 227 and the measured sample surface are oriented to (001). Calculating also with the nearest neighbors, the measured polarization curves of H3 and H5 are well reproduced. The parameters used in the calculations are listed in Table 1.

5. Discussion

Considering the measurements presented in Figure 2 and the values in Table 1, one can observe that the signal strength of the generated harmonics is determined mainly by the nearest neighbor atoms, and the second neighbors play a minor role, if any. This can be expected if one assumes the non-perturbative individual excitation scheme as presented in Figure 1b and estimates the electron motion in the continuum. The amplitude of the periodic motion of an electron in a laser field is:
x 0 = e E 1 m * ω 1 2
Considering the experimental parameters of a laser wavelength of 0.8 µm, electric field amplitude of the laser beam E 1 = 2.75   V / nm at 1 TW/cm2 laser intensity and an electron effective mass of m * 0.3 m e , one gets x 0 0.3   nm . This is about the distance of the neighbor atoms in a usual solid, meaning that the electron motion is mainly affected by the nearest atoms of its origin. It is in very good agreement with our model to describe the polarization measurements. In Figure 3, we illustrate the crystal structures and the directions considered in the calculations to model the polarization dependence of the harmonic signals.
LiF, MgO: The cases of LiF and MgO are similar. Both crystals and their surfaces have cubic structure constructed from the two types of atoms. The difference is only that the MgO is rotated by 45°. We assume that these are ionic crystals and that the source of electron for HH generation originates from the F or O2− atoms. However, choosing any atom as the origin of the harmonic source, the nearest neighbors are the other type of atoms in perpendicular directions. They determine the main shape of the polarization curves. The second neighbors are of the same type of atoms; they play a smaller but still essential role with relative factors of 0.63 for LiF and 0.33 for MgO.
AlN thin film (0001) was grown on sapphire substrate (0001) using 650 W RF sputtering at room temperature and at 5 × 10⁻³ mbar pressure of nitrogen gas. The film thickness is 100 nm, and it was characterized by X-ray diffraction. The estimated grain size is 67 nm, which is sufficiently large not to affect HH generation when only near-neighbors contribute. AlN surface has a three-fold symmetry with both Al and N atoms being arranged in hexagonal structures, as illustrated in Figure 3 with Al and N atoms being placed at somewhat different heights. Choosing any of the atoms, there are three nearest neighbors of the other type of atoms in a three-fold symmetry. They fully and equally determine the shape of the polarization curve, and the second neighbors play no roles. AlN is the only examined material, which has an “r+1” rank, which suggests a very strong effect of the crystal field. Additionally, AlN produced the strongest H5. The reason of this distinction can be that the electron moves here in the conduction band instead of the continuum or because this was a thin film while others were bulk crystals. Further studies are needed to understand this behavior.
Si substrate: P-type (boron) was used, with characteristics of 10–20 Ωcm, 500-μm-thick and two sides polished. The surface of Si is somewhat more complex; pairs of Si atoms form surface bonds in line [30,47,48] parallel with the surface, and dangling bonds occur in large density [30,47]. These surface bond and atoms (dangling bonds) can be polarized, and the nearest neighbors can contribute, as illustrated in Figure 3. Consequently, the polarizability is somewhat different in vertical and horizontal direction, which can be observed in the measurement in Figure 2e.
We must note, as becomes obvious from Equation (14), that the wavelength of the driving laser strongly affects the phenomenon of the HH generation in solid crystals. Using a laser with 10-times longer wavelength, e.g., 8 µm instead of 0.8 µm, the amplitude of the electron motion is 100-times larger, and atoms up to 100-neighbor distance can affect the generation process. In that case, a γ 1 and the localized states on the surface cannot be further considered as really localized but delocalized, similarly to the bulk case, and consequently, Equation (11) is not applicable. Additionally, resonances can occur approaching the long wavelength limit, and even the bulk contribution of the harmonic signal can be the dominant one. However, when the wavelength of the driving laser is suitably short (as in the case of our experiments), only nearest neighbor atoms affect the generation of the harmonics, and consequently the actual sources of the harmonics are nanometer-sized localized states on the surface of the materials. Our presented measurements strongly support this claim. The presented results give us a particular tool to explore nearest neighbors and to probe bond orientations and surface symmetries.
Considering the transmission loss of the optical elements and the VUV filter, the diffraction efficiency of the grating in the monochromator and the sensitivity of the detector, we estimated the generated harmonic powers. Using about 0.8 W laser power from the oscillator, the powers of H3 were in the 1–10 µW range, and the strongest H3 was observed from Si. For H5, the powers were in the 0.1–1 nW range, and the strongest H5 was observed from AlN film. During our measurements, we observed no saturation of the harmonic signals. Further improvement of the harmonic power and conversion efficiency can be expected, and the saturation of the harmonics can be reached, if using larger power laser oscillators or using tighter focusing. Using resonant metasurfaces [1,2,3,49,50] or optomagnonics cavities [51], the non-perturbative regime and saturation can occur even at GW/cm2 powers as a consequence of the field enhancement.

Author Contributions

Conceptualization, J.S., E.S. and T.S.; Formal analysis, E.C., L.M.-d.-O. and M.Z.; Investigation, J.S. and E.S.; writing—original draft preparation, J.S.; writing—review and editing, E.S., E.C., L.M.-d.-O., M.Z. and T.S.; Supervision, T.S.; funding acquisition, T.S. and E.C.; All authors have read and agreed to the published version of the manuscript.

Funding

This work is part of the ThoriumNuclearClock project that has received funding from the European Research Council (ERC) under the European Union’s Horizon 2020 research and innovation programme (Grant agreement No. 856415). Work has been performed within the project 20FUN01 TSCAC, which has received funding from the EMPIR programme co-financed by the Participating States and from the European Union’s Horizon 2020 research and innovation programme. We acknowledge support from the Österreichische Nationalstiftung für Forschung, Technologie und Entwicklung (AQUnet project). Spanish ICTS Network “MICRONANOFABS”, partially funded by FEDER funds through “MINATEC-PLUS-2” project FICTS2019-02-40.

Institutional Review Board Statement

Not applicable.

Informed Consent Statement

Not applicable.

Data Availability Statement

Data, presented in the publication are available from the corresponding author at reasonable request.

Conflicts of Interest

The authors declare no conflict of interest.

References

  1. Vampa, G.; Ghamsari, B.G.; Mousavi, S.S.; Hammond, T.J.; Olivieri, A.; Lisicka-Skrek, E.; Naumov, A.Y.; Villeneuve, D.M.; Staudte, A.; Berini, P.; et al. Plasmon-enhanced high-harmonic generation from silicon. Nat. Phys. 2017, 13, 659–662. [Google Scholar] [CrossRef]
  2. Zograf, G.; Koshelev, K.; Zalogina, A.; Korolev, V.; Hollinger, R.; Choi, D.-Y.; Zuerch, M.; Spielmann, C.; Luther-Davies, B.; Kartashov, D.; et al. High-Harmonic Generation from Resonant Dielectric Metasurfaces Empowered by Bound States in the Continuum. ACS Photonics 2022, 9, 567–574. [Google Scholar] [CrossRef]
  3. Xu, L.; Kamali, K.Z.; Huang, L.; Rahmani, M.; Smirnov, A.; Camacho-Morales, R.; Ma, Y.; Zhang, G.; Woolley, M.; Neshev, D.; et al. Dynamic Nonlinear Image Tuning through Magnetic Dipole Quasi-BIC Ultrathin Resonators. Adv. Sci. 2019, 6, 1802119. [Google Scholar] [CrossRef] [PubMed] [Green Version]
  4. Gao, Y.; Lee, H.; Jiao, J.; Chun, B.J.; Kim, S.; Kim, D.-H.; Kim, Y.-J. Surface third and fifth harmonic generation at crystalline Si for non-invasive inspection of Si wafer’s inter-layer defects. Opt. Express 2018, 26, 32812–32823. [Google Scholar] [CrossRef]
  5. Qin, R.; Chen, Z.-Y.; Chen, S. High harmonic studies of structural phase transitions in silicon. Comput. Mater. Sci. 2021, 197, 110621. [Google Scholar] [CrossRef]
  6. Reinhoffer, C.; Pilch, P.; Reinold, A.; Derendorf, P.; Kovalev, S.; Deinert, J.-C.; Ilyakov, I.; Ponomaryov, A.; Chen, M.; Xu, T.-Q.; et al. High-order nonlinear terahertz probing of the two-band superconductor MgB2: Third- and fifth-order harmonic generation. Phys. Rev. B 2022, 106, 214514. [Google Scholar] [CrossRef]
  7. Saeta, P.N.; Miller, N.A. Distinguishing surface and bulk contributions to third-harmonic generation in silicon. Appl. Phys. Lett. 2001, 79, 2704–2706. [Google Scholar] [CrossRef] [Green Version]
  8. Levy, U.; Silberberg, Y. Second and third harmonic waves excited by focused Gaussian beams. Opt. Express 2015, 23, 27795–27805. [Google Scholar] [CrossRef]
  9. Vampa, G.; Liu, H.; Heinz, T.F.; Reis, D.A. Disentangling interface and bulk contributions to high-harmonic emission from solids. Optica 2019, 6, 553–556. [Google Scholar] [CrossRef]
  10. Yi, G.; Jeon, S.; Kwon, Y.W.; Park, J.; Nguyen, D.A.; Sandeep, C.S.S.; Hwang, W.S.; Hong, S.W.; Kim, S.; Kim, Y.-J. Enhanced third harmonic generation in ultrathin free-standing β-Ga2O3 nanomembranes: Study on surface and bulk contribution. Nanoscale 2022, 14, 175–186. [Google Scholar] [CrossRef]
  11. Seres, J.; Seres, E.; Serrat, C.; Schumm, T. Non-perturbative generation of DUV/VUV harmonics from crystal surfaces at 108 MHz repetition rate. Opt. Express 2018, 26, 21900–21909. [Google Scholar] [CrossRef] [PubMed] [Green Version]
  12. Seres, J.; Seres, E.; Serrat, C.; Schumm, T. High harmonic generation in AlN due to out-of-surface electron orbitals. OSA Contin. 2021, 4, 47. [Google Scholar] [CrossRef]
  13. Sekiguchi, F.; Yumoto, G.; Hirori, H.; Kanemitsu, Y. Polarization anomaly in high harmonics in the crossover region between perturbative and extreme nonlinearity in GaAs. Phys. Rev. B 2022, 106, L241201. [Google Scholar] [CrossRef]
  14. Tsang, T.Y.F. Optical third-harmonic generation at interfaces. Phys. Rev. A 1995, 52, 4116–4125. [Google Scholar] [CrossRef] [PubMed]
  15. Tsang, T. Third- and fifth-harmonic generation at the interfaces of glass and liquids. Phys. Rev. A 1996, 54, 5454–5457. [Google Scholar] [CrossRef]
  16. Heinz, T.F. Nonlinear Surface Electromagnetic Phenomena; Ponath, H.E., Stegeman, G., Eds.; North–Holland: Amsterdam, The Netherlands, 1991; Volume 29, pp. 353–416. ISBN 9780444600523. [Google Scholar]
  17. Lüpke, G.; Bottomley, D.J.; Van Driel, H.M. Second- and third-harmonic generation from cubic centrosymmetric crystals with vicinal faces: Phenomenological theory and experiment. J. Opt. Soc. Am. B 1994, 11, 33–44. [Google Scholar] [CrossRef]
  18. Barad, Y.; Eisenberg, H.; Horowitz, M.; Silberberg, Y. Nonlinear scanning laser microscopy by third harmonic generation. Appl. Phys. Lett. 1997, 70, 922–924. [Google Scholar] [CrossRef] [Green Version]
  19. Yi, G.; Lee, H.; Jiannan, J.; Chun, B.J.; Han, S.; Kim, H.; Kim, Y.W.; Kim, D.; Kim, S.-W.; Kim, Y.-J. Nonlinear third harmonic generation at crystalline sapphires. Opt. Express 2017, 25, 26002–26010. [Google Scholar] [CrossRef]
  20. Kim, H.; Han, S.; Kim, Y.W.; Kim, S.; Kim, S.-W. Generation of Coherent Extreme-Ultraviolet Radiation from Bulk Sapphire Crystal. ACS Photonics 2017, 4, 1627–1632. [Google Scholar] [CrossRef] [Green Version]
  21. Xiong, H.; Si, L.-G.; Lü, X.-Y.; Yang, X.; Wu, Y. Carrier-envelope phase-dependent effect of high-order sideband generation in ultrafast driven optomechanical system. Opt. Lett. 2013, 38, 353–355. [Google Scholar] [CrossRef] [Green Version]
  22. Boyd, R.W. Nonlinear Optics, 3rd ed.; Elsevier: Amsterdam, The Netherlands, 2008; ISBN 9780080485966. [Google Scholar]
  23. Uchida, K.; Mattoni, G.; Yonezawa, S.; Nakamura, F.; Maeno, Y.; Tanaka, K. High-Order Harmonic Generation and Its Unconventional Scaling Law in the Mott-Insulating Ca2RuO4. Phys. Rev. Lett. 2022, 128, 127401. [Google Scholar] [CrossRef]
  24. Possmayer, T.; Tilmann, B.; Maia, L.J.Q.; Maier, S.A.; Menezes, L.D.S. Second to fifth harmonic generation in individual β-barium borate nanocrystals. Opt. Lett. 2022, 47, 1826–1829. [Google Scholar] [CrossRef] [PubMed]
  25. Hussain, M.; Lima, F.; Boutu, W.; Merdji, H.; Fajardo, M.; Williams, G.O. Demonstration of nonperturbative and perturbative third-harmonic generation in MgO by altering the electronic structure. Phys. Rev. A 2022, 105, 053103. [Google Scholar] [CrossRef]
  26. Imasaka, K.; Shinohara, Y.; Kaji, T.; Kaneshima, K.; Ishii, N.; Itatani, J.; Ishikawa, K.L.; Ashihara, S. High harmonic generation from GaSe in a deep-UV range well above the bandgap. Opt. Contin. 2022, 1, 1232. [Google Scholar] [CrossRef]
  27. Kaassamani, S.; Auguste, T.; Tancogne-Dejean, N.; Liu, X.; Boutu, W.; Merdji, H.; Gauthier, D. Polarization spectroscopy of high-order harmonic generation in gallium arsenide. Opt. Express 2022, 30, 40531. [Google Scholar] [CrossRef]
  28. Georgescu, A.B.; Ismail-Beigi, S. Surface Piezoelectricity of (0001) Sapphire. Phys. Rev. Appl. 2019, 11, 064065. [Google Scholar] [CrossRef] [Green Version]
  29. Rowland, B.; Fisher, M.; Devlin, J.P. Probing icy surfaces with the dangling-OH-mode absorption: Large ice clusters and microporous amorphous ice. J. Chem. Phys. 1991, 95, 1378. [Google Scholar] [CrossRef]
  30. McEllistrem, M.; Allgeier, M.; Boland, J.J. Dangling Bond Dynamics on the Silicon (100)-2×1 Surface: Dissociation, Diffusion, and Recombination. Science 1998, 279, 545–548. [Google Scholar] [CrossRef]
  31. Aarts, I.M.P.; Gielis, J.J.H.; van de Sanden, M.C.M.; Kessels, W.M.M. Probing hydrogenated amorphous silicon surface states by spectroscopic and real-time second-harmonic generation. Phys. Rev. B 2006, 73, 045327. [Google Scholar] [CrossRef] [Green Version]
  32. Vampa, G.; Brabec, T. Merge of high harmonic generation from gases and solids and its implications for attosecond science. J. Phys. B 2017, 50, 083001. [Google Scholar] [CrossRef]
  33. Chevreuil, P.-A.; Brunner, F.; Thumm, U.; Keller, U.; Gallmann, L. Breakdown of the single-collision condition for soft x-ray high harmonic generation in noble gases. Optica 2022, 9, 1448–1457. [Google Scholar] [CrossRef]
  34. Seres, E.; Seres, J.; Serrat, C.; Namba, S. Core-level attosecond transient absorption spectroscopy of laser-dressed solid films of Si and Zr. Phys. Rev. B 2016, 94, 165125. [Google Scholar] [CrossRef] [Green Version]
  35. Kittel, C. Introduction to Solid State Physics, 8th ed.; John Wiley & Sons, Inc.: Hoboken, NJ, USA, 2005; ISBN 0-471-41526-X. [Google Scholar]
  36. Inglesfield, J.E. Surface electronic structure. Rep. Prog. Phys. 1982, 45, 223–284. [Google Scholar] [CrossRef]
  37. Powell, G.D.; Wang, J.-F.; Aspnes, D.E. Simplified bond-hyperpolarizability model of second harmonic generation. Phys. Rev. B 2002, 65, 205320. [Google Scholar] [CrossRef]
  38. Hardhienata, H.; Priyadi, I.; Alatas, H.; Birowosuto, M.D.; Coquet, P. Bond model of second-harmonic generation in wurtzite ZnO(0002) structures with twin boundaries. J. Opt. Soc. Am. B 2019, 36, 1127–1137. [Google Scholar] [CrossRef]
  39. Hardhienata, H.; Faci, S.; Alejo-Molina, A.; Priatama, M.R.; Alatas, H.; Birowosuto, M.D. Quo Vadis Nonlinear Optics? An Alternative and Simple Approach to Third Rank Tensors in Semiconductors. Symmetry 2022, 14, 127. [Google Scholar] [CrossRef]
  40. Lapiano-Smith, D.A.; Eklund, E.A.; Himpsel, F.J.; Terminello, L.J. Epitaxy of LiF on Ge(100). Appl. Phys. Lett. 1991, 59, 2174–2176. [Google Scholar] [CrossRef]
  41. Takeda, E.; Zukawa, T.; Tsujita, T.; Yoshino, K.; Morita, Y. Annealing process for recovery of carbonated (Mg,Ca)O protective layer for plasma discharge device. Jpn. J. Appl. Phys. 2018, 57, 096001. [Google Scholar] [CrossRef]
  42. Lee, J.W. Kinetic Energy Distribution of Auger Electrons of MgO, CaO, SrO and BaO Induced by Auger Neutralization of He+, Ne+, Ar+ and Xe+ Ions. New Phys. Sae Mulli. 2017, 67, 1168–1173. [Google Scholar] [CrossRef]
  43. Sun, H.; Castanedo, C.G.T.; Liu, K.; Li, K.-H.; Guo, W.; Lin, R.; Liu, X.; Li, J.; Li, X. Valence and conduction band offsets of β-Ga2O3/AlN heterojunction. Appl. Phys. Lett. 2017, 111, 162105. [Google Scholar] [CrossRef] [Green Version]
  44. Xu, Y.-N.; Ching, W.Y. Electronic, optical, and structural properties of some wurtzite crystals. Phys. Rev. B 1993, 48, 4335–4351. [Google Scholar] [CrossRef] [PubMed]
  45. Shao, G. Work Function and Electron Affinity of Semiconductors: Doping Effect and Complication due to Fermi Level Pinning. Energy Environ. Mater. 2021, 4, 273–276. [Google Scholar] [CrossRef]
  46. Chelikowsky, J.R.; Cohen, M.L. Electronic structure of silicon. Phys. Rev. B 1974, 10, 5095–5107. [Google Scholar] [CrossRef] [Green Version]
  47. Samarin, S.; Artamonov, O.M.; Suvorova, A.A.; Sergeant, A.D.; Williams, J.F. Measurements of insulator band parameters using combination of single-electron and two-electron spectroscopy. Solid State Commun. 2004, 129, 389–393. [Google Scholar] [CrossRef]
  48. Uda, T.; Shigekawa, H.; Sugawara, Y.; Mizuno, S.; Tochihara, H.; Yamashita, Y.; Yoshinobu, J.; Nakatsuji, K.; Kawai, H.; Komori, F. Ground state of the Si(001) surface revisited—Is seeing believing? Prog. Surf. Sci. 2004, 76, 147–162. [Google Scholar] [CrossRef]
  49. Tong, W.; Gong, C.; Liu, X.; Yuan, S.; Huang, Q.; Xia, J.; Wang, Y. Enhanced third harmonic generation in a silicon metasurface using trapped mode. Opt. Express 2016, 24, 19661–19670. [Google Scholar] [CrossRef]
  50. Shcherbakov, M.R.; Neshev, D.N.; Hopkins, B.; Shorokhov, A.S.; Staude, I.; Melik-Gaykazyan, E.V.; Decker, M.; Ezhov, A.A.; Miroshnichenko, A.E.; Brener, I.; et al. Enhanced Third-Harmonic Generation in Silicon Nanoparticles Driven by Magnetic Response. Nano Lett. 2014, 14, 6488–6492. [Google Scholar] [CrossRef] [PubMed]
  51. Liu, Z.-X.; Li, Y.-Q. Optomagnonic frequency combs. Photonics Res. 2022, 10, 2786–2793. [Google Scholar] [CrossRef]
Figure 1. Illustration of the perturbative and non-perturbative interaction of the laser beam with an atomic lattice. (a) In the perturbative case, the interaction can be well described as collective nonlinear polarization, (b) while in the non-perturbative case, the quantum nature is dominant, and the interactions occur as localized excitation/ionization of the atoms or chemical bonds. Red arrows illustrate the branch of exciting laser photons, and black dots represent electrons moving on trajectories, reaching the neighboring atoms.
Optics 04 00017 g001
Figure 2. (a) Experimental setup using transmission geometry for the measurements of LiF, MgO, AlN and reflection geometry for Si. (b) Band gap (BG) positions of the used crystals (thin film) and the excitation scheme containing excitation from the delocalized valence band maximum (VBM) to the continuum through localized dangling bonds (DB) or localized conduction band edge (CBE) states. (c) Reference polarization measurement using amorphous BK7 glass. (d) Measured harmonic spectra containing H5 and H3 lines. (e) Measured polarization dependence of the harmonic intensities (color lines) and the calculations (black dashed and dotted lines).
Optics 04 00017 g002
Figure 3. Illustration of the crystal surface structures and the directions of the considered polarizabilities for the calculations in Figure 2d.
Optics 04 00017 g003
Table 1. Used parameters to calculate the polarization curves of Figure 2e using Equation (13).
rRankβj (°)αrj
LiF (001)H34.6 1r0; 90; 45; 1351; 1; 0.63; 0.63
MgO (001)H33.6r0; 90; 45; 1350.33; 0.33; 1; 1
AlN (0001)H33r+130; 90; 1501; 1; 1
H53.5
Si (001)H34r0; 90, 45; 1351; 0.92; 0.5; 0.5
H551; 0.96; 0; 0
1 Value from earlier measurements [11].
Disclaimer/Publisher’s Note: The statements, opinions and data contained in all publications are solely those of the individual author(s) and contributor(s) and not of MDPI and/or the editor(s). MDPI and/or the editor(s) disclaim responsibility for any injury to people or property resulting from any ideas, methods, instructions or products referred to in the content.

