Article

Contour Measurement of Object with Arbitrary Surface Using Two-Dimensional Shearography with Source Displacement

School of Instrumentation Science and Opto-Electronics Engineering, Beijing Information Science and Technology University, Beijing 100192, China
*
Author to whom correspondence should be addressed.
Optics 2022, 3(4), 352-363; https://doi.org/10.3390/opt3040031
Submission received: 21 July 2022 / Revised: 7 September 2022 / Accepted: 19 September 2022 / Published: 22 September 2022
(This article belongs to the Section Engineering Optics)

Abstract

:
A two-dimensional (2D) shearography with source displacement is proposed to measure object contours. Using a dual-shear shearographic setup with two movable laser sources, the full-field slopes along a pair of orthogonal shear directions were obtained. The contour was then obtained by performing 2D integration of the surface slopes. Theoretical derivations and experimental results are presented to demonstrate the performance of the proposed method. The experimental results show that contour of objects with various types of surfaces, such as spherical and hyperbolic paraboloid surfaces, can be effectively measured. The measurement of the contour aids in the precision measurement of strain and the precision location of defects.

1. Introduction

Composite materials are widely used in many industrial fields due to their high strength and low weight. Non-destructive testing and strain measurement are of great significance to the risk assessment of composite materials [1]. Digital shearography is an optical technique for full-field measurement of displacement derivatives. It has been recognized as one of the most effective methods for testing composite materials [2,3]. During digital shearography measurement, phase maps are recorded before and after loading of composite materials. Displacement derivatives are then calculated based on the relationship between the phase difference and the displacement derivative. Finally, the strain measurement and non-destructive testing are realized based on the obtained displacement derivatives [4]. When strains of curved objects are measured by digital shearography, it will produce significant errors due to the difference between the normal direction of the object surface and the measurement direction of the digital shearography. In this case, the object contour needs be used for strain correction, so simultaneous measurement of contour and displacement derivative aids in the improvement of strain measurement accuracy [5]. In non-destructive testing of composite materials, simultaneous measurement of contour and displacement derivative also helps to accurately determine the surface coordinates of defects inside the materials. The contour of the object can be obtained using other techniques such as structured light profilometry and digital image correlation, while the displacement derivative is measured by digital shearography [6,7]. However, the combination of the two different techniques results in low measurement efficiency and complex optical arrangement. Application of digital shearography to simultaneously measure the contour and displacement derivative of objects is of great application value. Measuring the displacement derivative with digital shearography has been well developed, but there are challenges in measuring contour effectively with digital shearography.
Traditionally, digital shearography has been used to measure the surface slope of objects [8]. Unlike measurement of the displacement derivative, slope measurement with digital shearography is a single-state measurement. In this case, the interferometric phase of digital shearography is modulated by changing the optical path instead of loading the object. The methods of optical path modulation mainly include refractive medium change [9], dual-wavelength modulation [10], object rotation [11], and source displacement [12]. In the refractive-medium-change method, the object is immersed in liquid medium. The use of liquid medium makes this method less practical. In the dual-wavelength-modulation technique, a tunable laser is generally used as a light source [10]. The laser wavelength modulation reduces light-source quality, extends measurement time, and ultimately reduces measurement performance. In the object-rotation method, the object is placed on a rotating platform and two images are recorded before and after a small rotation of the platform [11]. This method is unsuitable for large objects. The source-displacement technique obtains correlation fringe patterns or phase maps after the source moves along a direction that is perpendicular to the illumination direction [12]. The displacement of the source can be easily controlled by a displacement stage. The influences of parameters such as the illumination angle and the magnitude of the source displacement on the slope have been well discussed [13].
With the aforementioned methods, only the one-dimensional (1D) slope of the object surface along the shear direction is measured. The slope orthogonal to the shear direction is not determined [13,14]. In general, based on the 1D surface slope, the contour of a rotationally symmetrical object, such as a spherical object, can be obtained by means of integration, but the contours of widespread objects with arbitrary surfaces cannot be determined [15,16,17]. To measure the contour of an object with an arbitrary surface, at least two slopes along different directions should be provided. Dual-shear digital shearography has been proposed to measure the displacement derivatives along two shear directions, but they cannot be used to measure slopes directly [18,19,20,21]. Moreover, the use of multiple beam splitters in their optical setups results in low light efficiency.
A two-dimensional (2D) digital shearography with source displacement is introduced in this article. Two dual-source and dual-shear digital shearographic setups with source displacement are proposed to measure the slopes of object surface along two perpendicular shear directions during a single measurement. A 2D integration method is then used to convert the slopes to the contour of object with arbitrary surface.

2. Methods

2.1. One-Dimensional Digital Shearography with Source Displacement

A schematic of surface slope measurement by shearography is illustrated in Figure 1. The system is composed of a movable laser source, a Michelson-type device, a phase shifter, and an imaging device. An object is illuminated by an expanded laser beam which is from the movable laser source. The diffused reflection light enters into the beam splitter in the Michelson-type device. The transmitted beam strikes the mirror M2 which is attached to a piezoelectric transducer (PZT) which acts as the phase shifter, and the reflected beam strikes the mirror M1 which has a small inclination angle with the optical axis. Through the reflection of the two mirrors, a set of misaligned images is formed. The overlapping parts of the two images form an interferogram at the detector plane of the imaging device. Phase maps are then obtained by the phase-shift technique with which the PZT produces precisely designed movements and introduces known phase shifts in the time series to obtain phase information [2]. The displacement of the laser source lies in the same plane with the illumination angle θ and is perpendicular to the illumination direction. P1 and P2 represent the two positions before and after the displacement of the source. During the measurement, the light source moves parallel from P1 to P2 and then the phase distribution Δ is obtained by subtracting the phase corresponding to one position from the phase corresponding to the other position.
The relationship between the phase Δ and optical path difference L is expressed as follows:
Δ = 2 π λ L
where λ is the laser wavelength. The change of the optical path difference is caused by the displacement of the light source, yielding phase maps Δ that are expressed as follows [13]:
Δ = 2 π δ x Λ x sin θ λ R z x
where δx is the shear amount in the X direction, Λx is the magnitude of source displacement along the direction perpendicular to the illumination, R is the distance from the laser source to the measured object, and ∂z/∂x is the surface slope along the X direction.

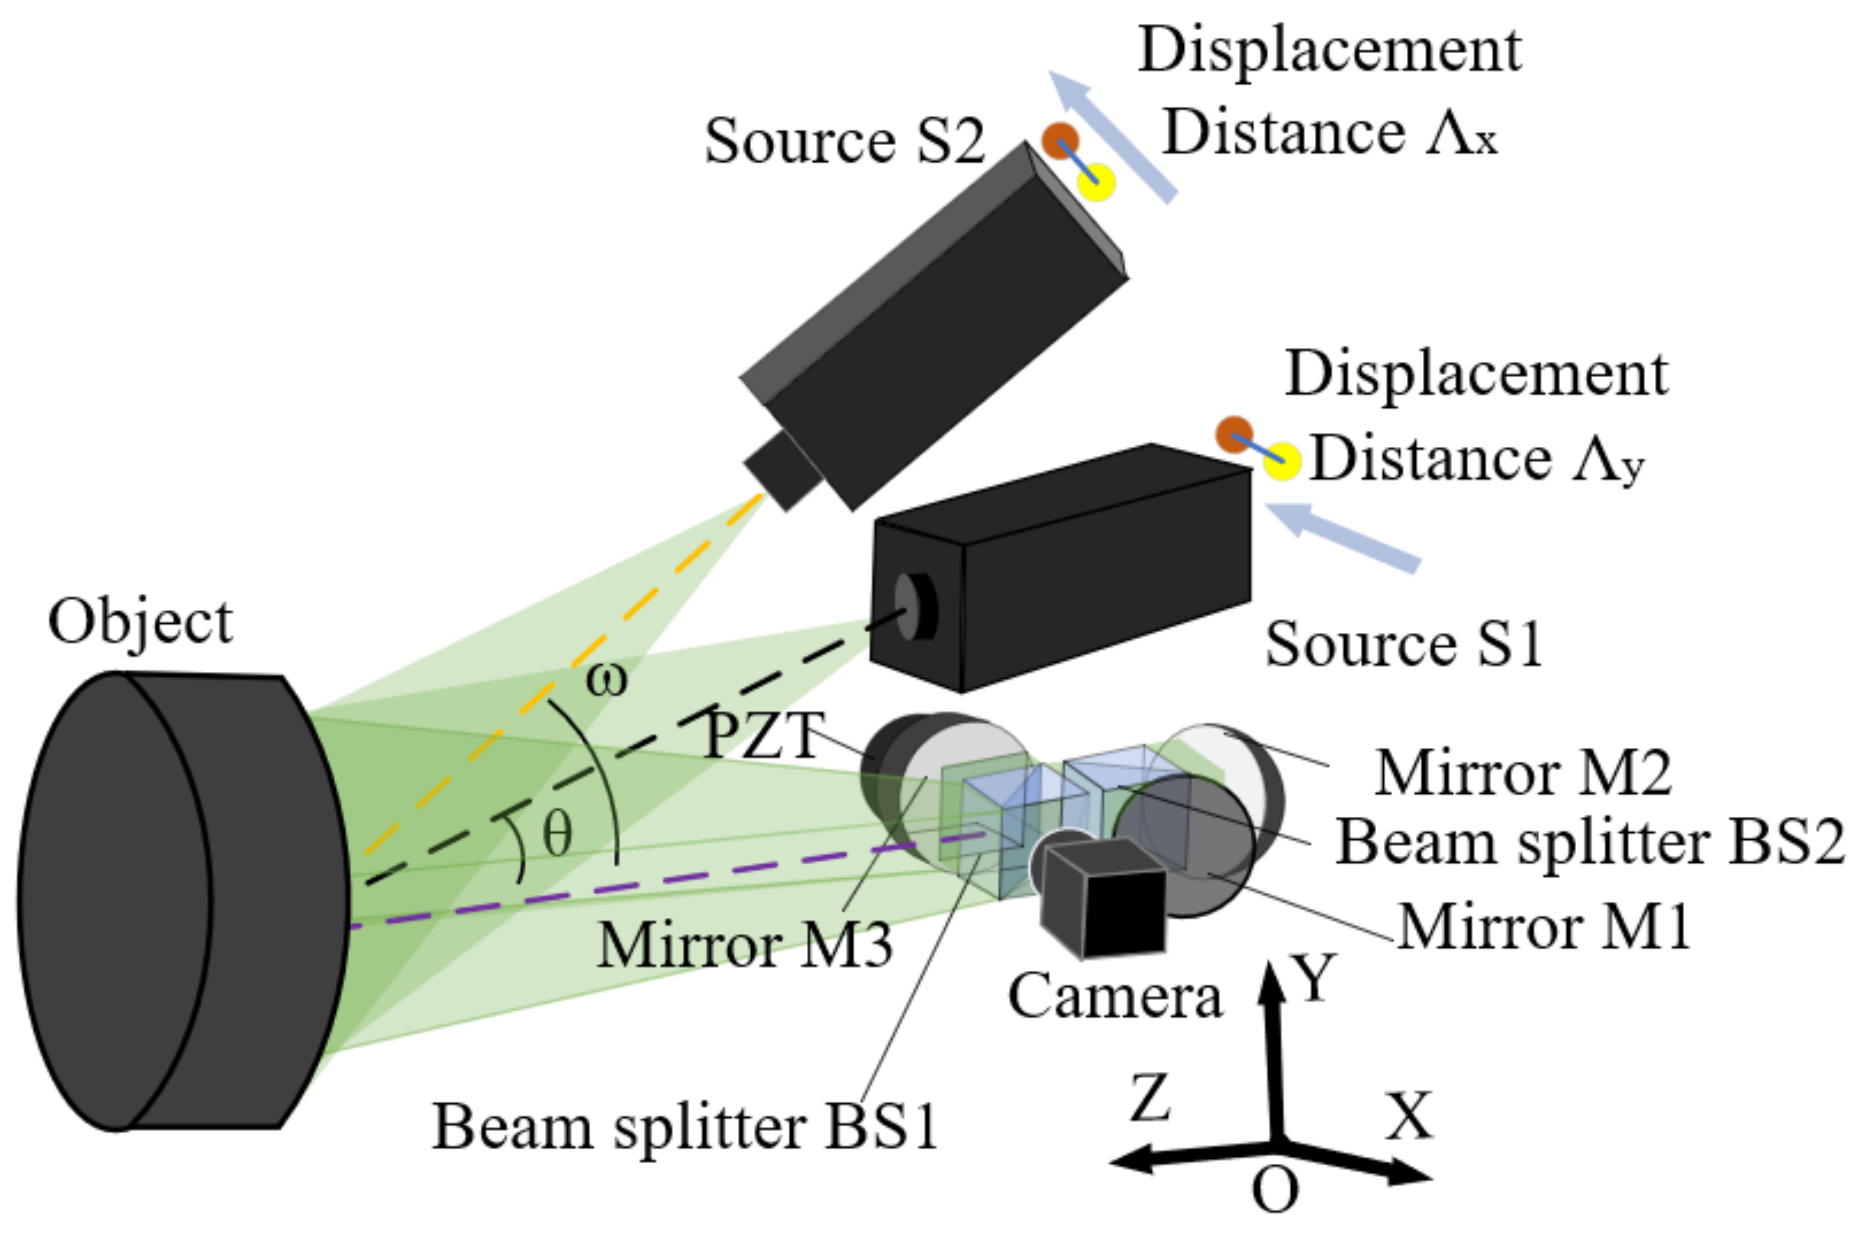
2.2. Two-Dimensional Digital Shearography with Source Displacement

The optical setup of the 2D digital shearography with source displacement is shown in Figure 2. The laser sources S1 and S2 are in the XOZ plane and YOZ plane, respectively. The two illumination angles are adjusted to be the same to simplify the subsequent calculations. The displacements of the two light sources both lie in the same plane as their respective illumination angle and are orthogonal to their respective illumination direction. Similar to the 1D digital shearography, during the measurement, the two light sources move parallel from the first position to the second position. The shearing setup of the system contains two beam splitters BS1 and BS2, and three mirrors M1, M2, and M3 to introduce image shearing in different shearing directions. The object is illuminated, in turn, by the two expanded laser beams from the two laser sources. The scattered light from the object surface is divided into two beams through the beam splitter BS1. The transmitted light is divided into two beams by BS2, and then is reflected by the mirrors M1 and M2, respectively. The reflected light from BS1 is reflected by the PZT-driven mirror M3. The balance of light intensity is achieved by the specific beam-splitting ratio of BS1. Finally, interferograms are formed at the detector plane. The mirrors M1 and M2 have a small angle of inclination in the XOZ and YOZ planes, respectively. The shearing amount can be controlled by adjusting the inclination angles of M1 and M2. The optical path can be switched by shutters which are located in front of M1 and M2, so the sheared images in different directions are generated in turn.
An alternative type of 2D digital shearography with source displacement is shown in Figure 3. Two lasers with wavelengths of 532 nm and 660 nm act as the laser sources. One laser source (named S1’) is in the XOZ plane and the other (named S2’) is in the YOZ plane. Their illumination angles are the same size. The imaging device used here is a color camera. The shearing device is composed of a beam splitter, two mirrors, and a dichroic filter. The dichroic filter, which can transmit green light and reflect red light, is placed between the beam splitter BS1′ and the mirror M2′. The filter is tilted in the X direction to introduce a sheared image formed by the red light. The other sheared image is formed by the green light which is reflected by the mirrors M1′ and M2′. The mirror M2′ has a small inclination angle in the YOZ plane. The two images are captured simultaneously by the color camera and recorded in the corresponding color channels. Consequently, the 2D slopes are obtained simultaneously.
The displacements of light sources S1 and S2 (or S1’ and S2’) yield two phase maps with which the slopes in both the X and Y directions are obtained after the calculations described by Equation (2) and
Δ y = 2 π δ y Λ y sin ω λ R z y
where δy is the shear amount in the Y direction, Λy is the displacement magnitude of source S2 or S2’, ω is the angle between the illumination direction and the viewing direction, and ∂z/∂y is the surface slope along the Y direction.
Compared with the two dual-shear shearographic setups in Refs. [18,19], the two proposed optical setups have few beam splitters, so they are much simpler and more robust, and the utilization efficiency of light energy is much higher. Moreover, the proposed dual-shear shearographic setups can be combined with the 2D source displacement method, so it is possible to measure the surface slopes ∂z/∂x and ∂z/∂y, rather than measuring the displacement gradients ∂w/∂x and ∂w/∂y, as described in the literature.

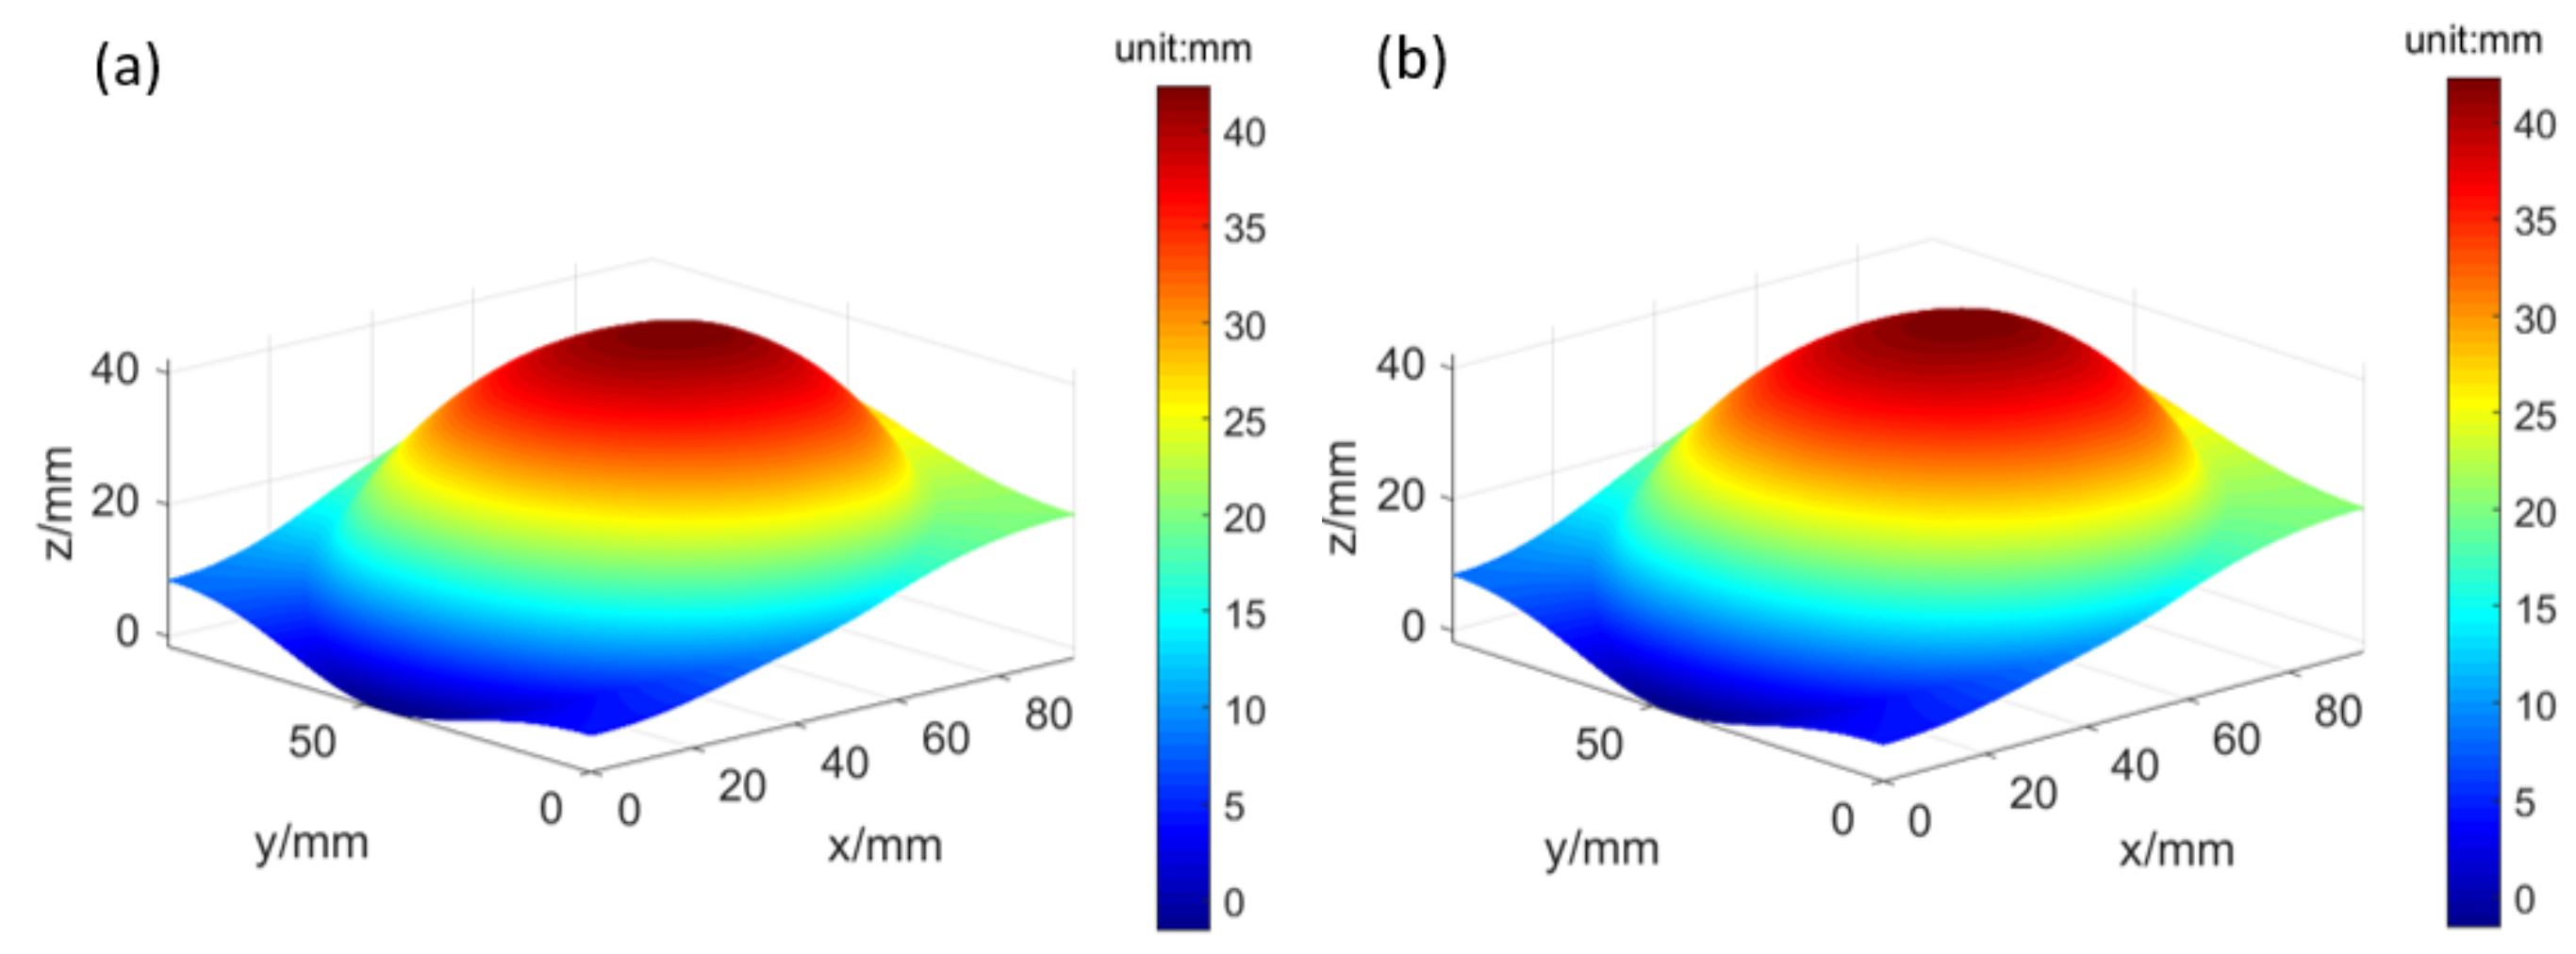
2.3. Reconstruction of the Contour by the 2D Integration

The numerical integration method is a common method to restore the surface contour. Defining Z(x0,y0) as the initial point, then the object contour Z(x,y) is expressed as follows:
Z x , y = f x + g y + c
where f(x) and g(x) are real value functions and c is a constant term. Integrating along the x direction results in
Z ( x , y ) = x 0 x z x d x + Z ( x 0 , y 0 )
The real value function g(y) has not been determined when the integration is only along the x direction. Another shearing interferogram in the y direction should be provided to achieve the correct calculations.
Two-dimensional integration methods are widely applied to reconstruct the height or wavefront from the measured gradient data in slope metrology [22,23]. The main idea of the 2D integration method is to construct a grid mode based on the relationship between each surface data point and the surrounding slope data points. Then the height at every point will be solved by finite-difference-based least-squares integration methods. The grid mode is shown in Figure 4. In the M × N network, the black dots are the estimating shape data points. The horizontal arrows indicate measured slope in the x direction and the vertical arrows represent measured slope in the y direction. The horizontal spacing between adjacent measurement points is expressed as Δ X = x m , n + 1 x m , n , and the vertical spacing is expressed as Δ Y = y m + 1 , n y m , n .
The relationships between the estimated points and the measured slopes can be expressed as follows:
z x m , n = Z m , n + 1 Z m , n Δ X , m 1 , M , n 1 , N 1
z y m , n = Z m + 1 , n Z m , n Δ Y , m 1 , M 1 , n 1 , N
The 2D slopes measured by the 2D digital shearography with source displacement are used as input to the model described by Figure 4 and Equations (6) and (7). There are M × N unknowns and M N 1 + M 1 N equations, so the solution requirements of Equations (6) and (7) are met. For convenience, Equations (6) and (7) are transformed to matrix form:
Z m , n + 1 Z m , n = z x m , n X m , n + 1 X m , n ,   m 1 , M , n 1 , N 1 ,
Z m + 1 , n Z m , n = z y m , n Y m + 1 , n Y m , n ,   m 1 , M 1 , n 1 , N .
The estimated point matrix on the left side of Equations (8) and (9) can be expressed by a coefficient matrix D and a matrix Z which is to be solved. The right side of the equations is represented by a matrix G. The relationship between the matrices is expressed as follows:
D Z = G
or
Z = D 1 G
where:
D = D x D y ,
D x = 1 0 0 1 0 0 0 1 0 0 1 0 0 0 1 0 0 1 ;   D y = 1 1 0 0 0 0 1 1 0 0 0 0 0 0 1 1 ;  
Z = Z 1 , 1 Z 2 , 1 · · · Z m , n ;   and   G = z x 1 , 1 ( x 1 , 2 x 1 , 1 ) z x 1 , 2 ( x 1 , 3 x 1 , 2 ) z x m , n ( x m , n x m , n 1 ) z y 1 , 1 ( y 2 , 1 y 1 , 1 ) z y 2 , 1 ( y 3 , 1 y 2 , 1 ) z y m , n ( y m , n y m 1 , n ) .

3. Results and Discussion

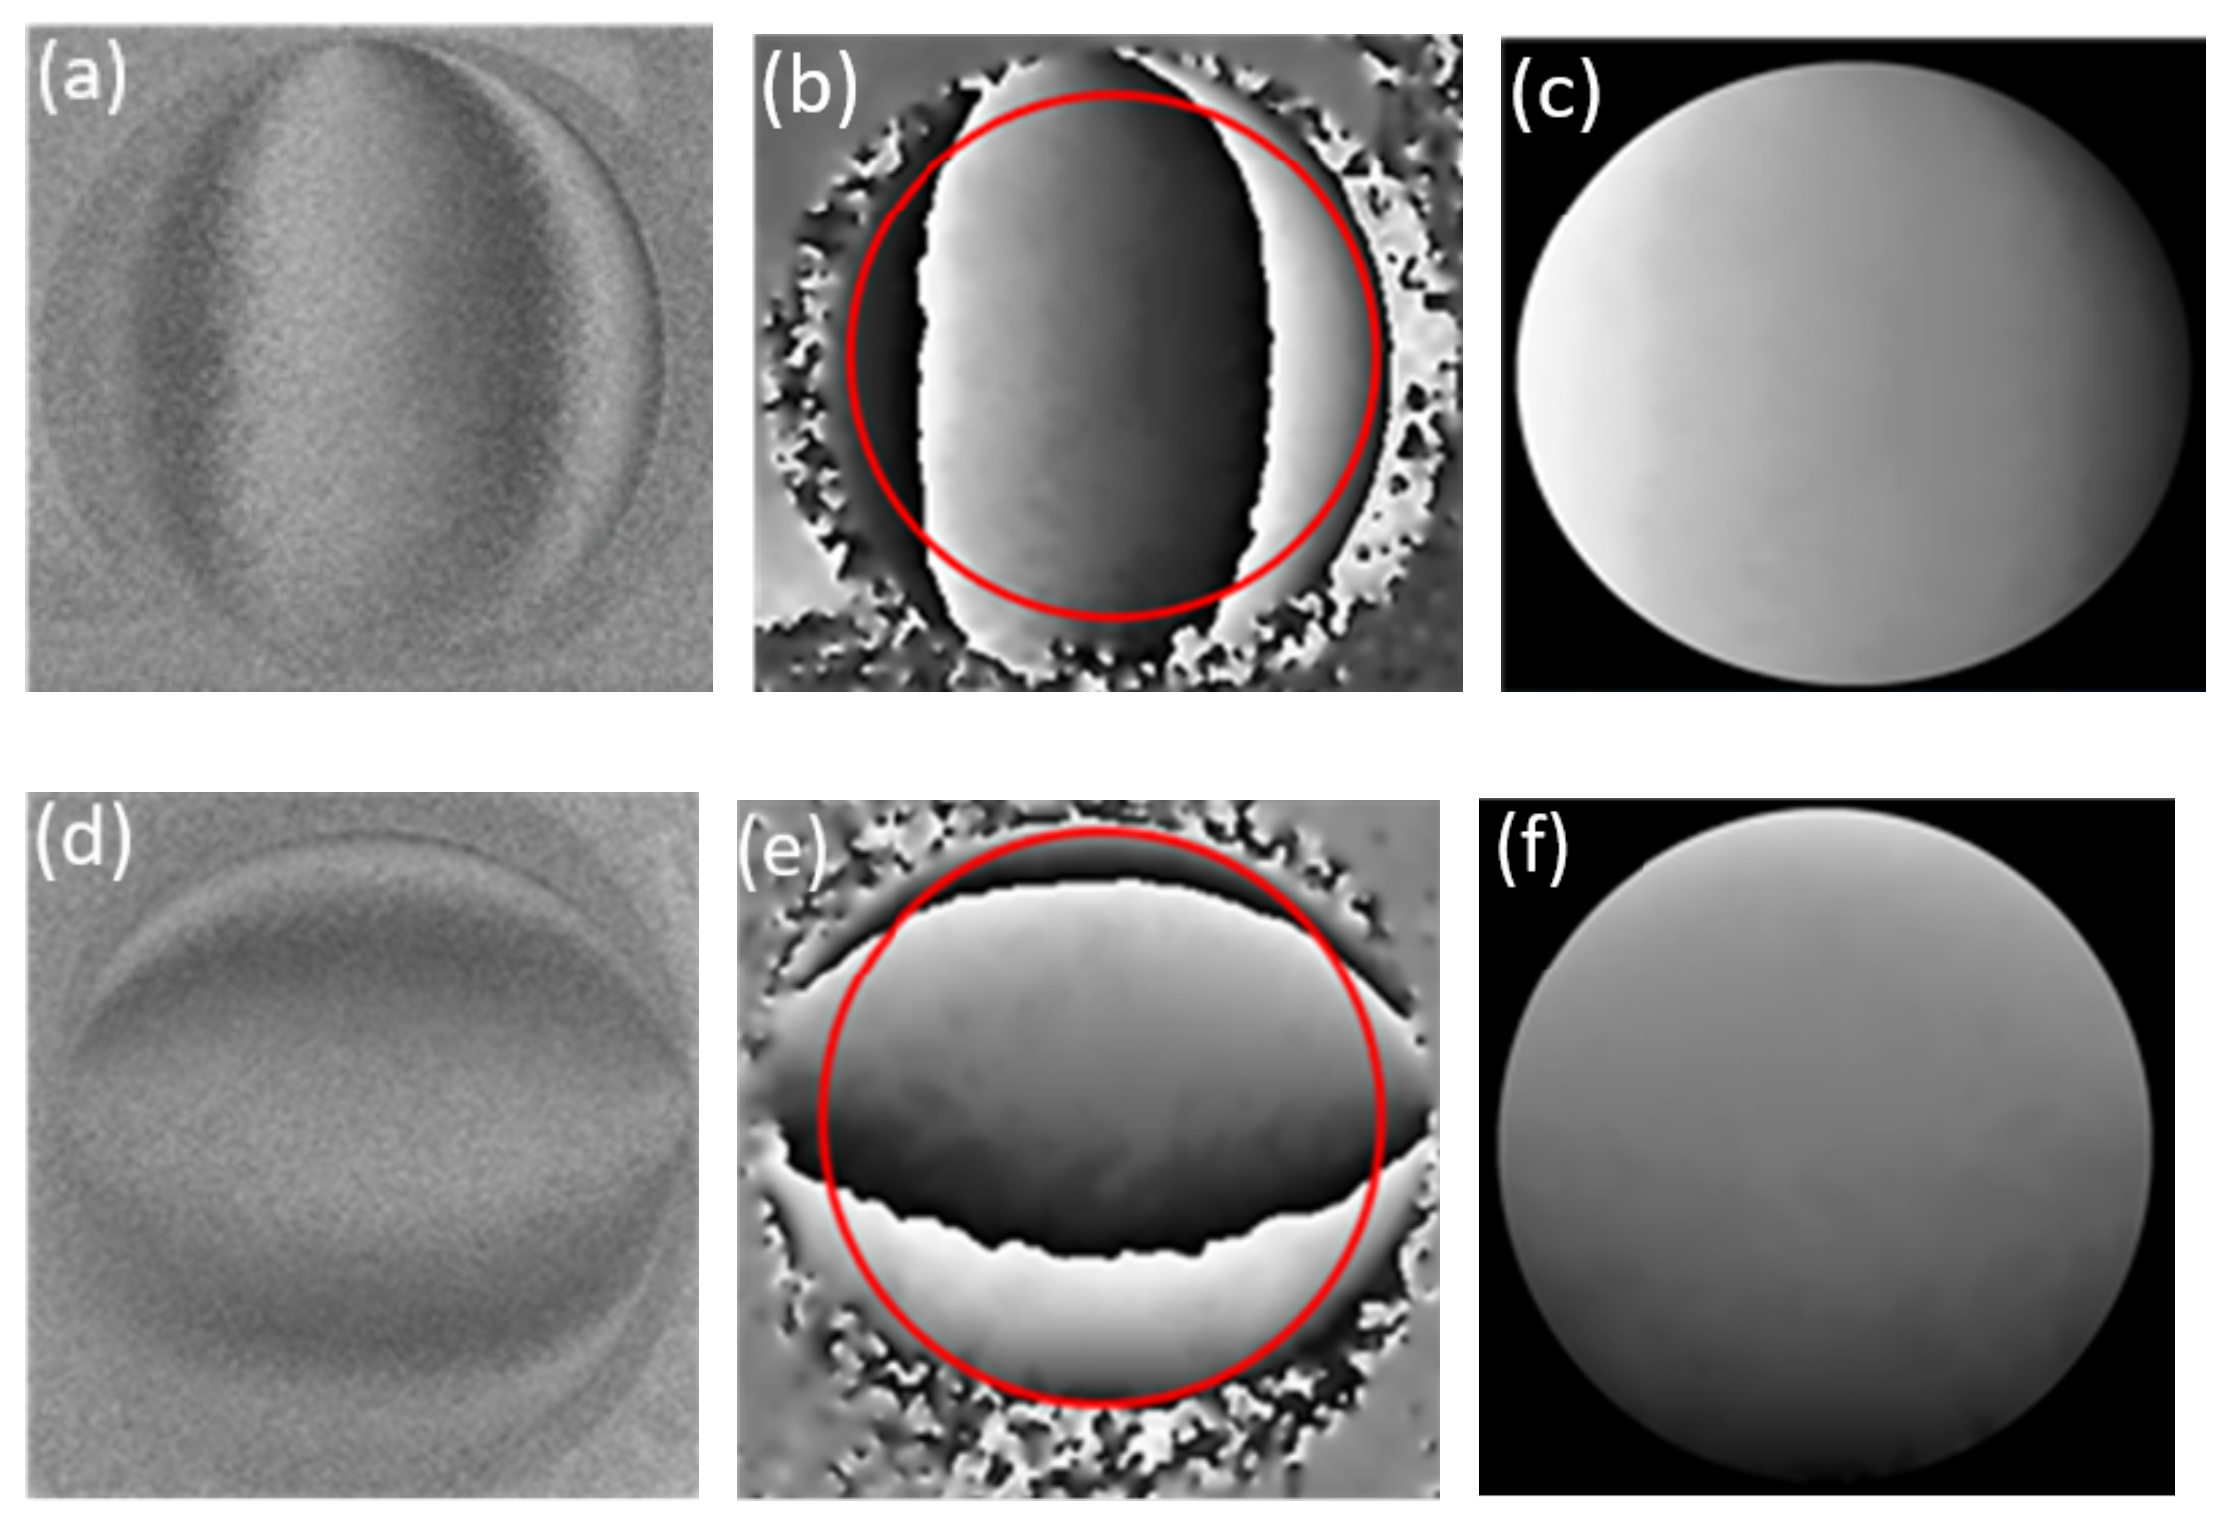
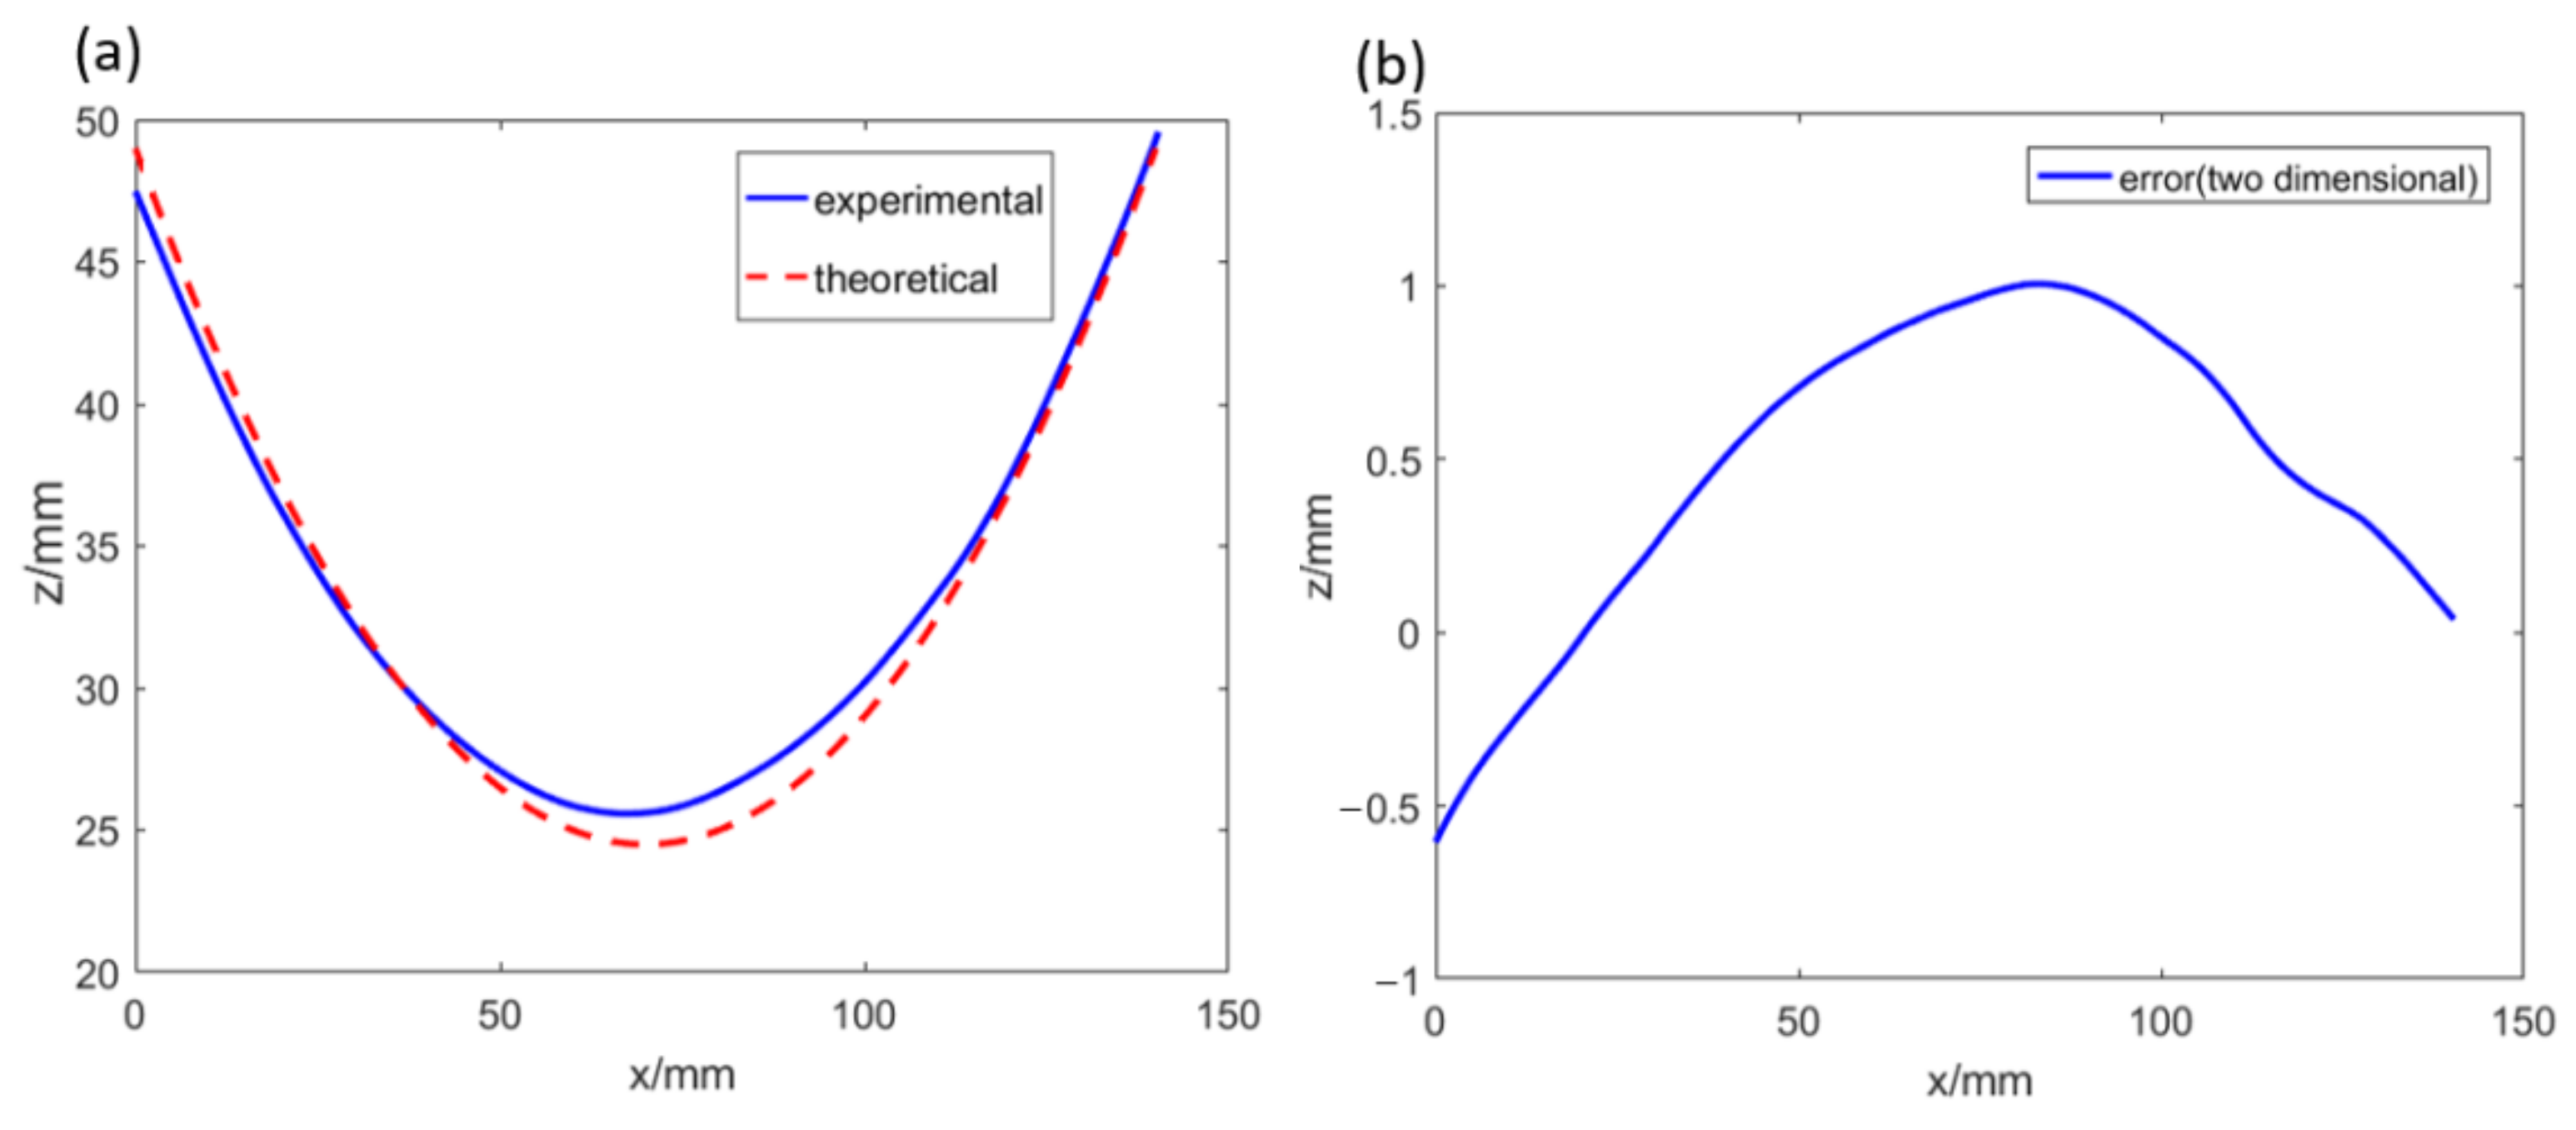
3.1. Contour Measurement

An experimental setup was built according to the optical setup depicted in Figure 2. Sheared speckle interferograms were captured by a black-and-white industrial camera with 2464 × 2056 pixels (CatchBEST Co., Ltd., Beijing, China, MU3S500M). The lasers with a central wavelength of 532 nm and an output power of 200 mW (Changchun New Industries Optoelectronics Tech. Co., Ltd., Changchun, China, MSL-FN-532) were used as the illumination source. In our experiments, the laser illumination layout which is depicted in Figure 2 was carried out because it led to ease of experimental system building and simplicity of the mathematic model. The illumination angles of the laser beams were about 30°. The shear amounts in the X and Y directions were both 10 mm. In the experiments, two objects with a spherical surface and a hyperbolic paraboloid surface, as shown in Figure 5, were measured by the proposed 2D digital shearography with source displacement and the traditional 1D digital shearography, respectively.
The first object to be measured was a ball with a diameter of 120 mm coated with reflective material. The displacement amounts of the light sources S1 and S2 were both 0.15 mm. The phases of the sheared speckle interferograms were extracted by the phase-shift method. The phase difference corresponding to the slope along the X direction, shown in Figure 6a, was obtained by subtracting the phase difference distribution before the displacement of the source S1 from it after the source displacement. The other phase difference distribution in the Y direction is shown in Figure 6d. The noise on the raw phase maps was reduced by the mean filter with a filter window of 3 × 3 after the sudden phase change of 2π on the two raw phase maps was eliminated by performing sine and cosine transformation, and then the wrapped phase maps were obtained by performing the arctangent operation. The filtering process ran iteratively many times until a smooth wrapped phase map was obtained. The filtered wrapped phase maps are shown in Figure 6b,e. Due to the off-axis illuminations, shadows will appear in some areas of the phase maps. The overlapped area in the two filtered phase maps was chosen for further processing. This area is identified in Figure 6b,e with red circles with diameters of 95 mm. The phase maps of the region of interest were unwrapped and the results are shown in Figure 6c,f, respectively.
Based on the obtained phases, the surface contour was measured after the calculation described by Equations (8) and (9). The result is shown in Figure 7a. Another result obtained using the traditional 1D digital shearography is shown in Figure 7b for comparison. It can be seen from Figure 7 that the two methods can both be used to correctly measure the ball, a rotationally symmetrical object.
The cross-sectional height distributions of contour along the X direction and through the vertices of the height maps shown in Figure 7 are illustrated in Figure 8a. The dotted black curve and solid blue curve represent the cross-sectional height distributions measured by the traditional 1D digital shearography with source displacement and the proposed approach, respectively. The shape of the ball was relatively perfect, so the theoretical cross-sectional height distribution of the ball contour, represented by a red dashed line in Figure 8a, could be used as a standard. As shown in Figure 8b, the maximum error of the measurement results of the proposed method was 0.82 mm and the standard deviation was 0.46 mm, while the maximum error of the traditional method was −0.97 mm and the standard deviation was 0.76 mm. The measurement results obtained by the two methods were both consistent with the theoretical results. However, the measurement results obtained by the proposed method were closer to the theoretical results and the corresponding curves were smoother than the results obtained by the traditional method. This is because the numerical integration method needs to integrate according to the integration path and thus causes error accumulation, while the 2D integration method does not require an integration path but is only related to adjacent data points. In the proposed method, the main error source is the miscalibration of the displacement of the light sources. If the displacement of the light sources can be accurately calibrated, the accuracy of contour measurement can be much improved.
The tested object with a hyperbolic paraboloid surface was a resin sheet coated with reflective material. The measurement area was 140 mm × 140 mm. The filtered and unwrapped phase maps of raw phase maps are shown in Figure 9.
The contour of the object with a hyperbolic paraboloid surface was also measured by the proposed method and by traditional 1D digital shearography. The result obtained by the 2D digital shearography with source displacement is shown in Figure 10a and the result obtained by the traditional 1D digital shearography is shown in Figure 10b. It can be seen that the result obtained by the proposed method was correct but the result obtained by the traditional method was totally wrong, because the traditional method does not have the ability to measure the contours of objects with quadric surfaces.
The measurement results obtained by the proposed method were compared with the theoretical results. The cross-sectional height distribution of contour along the X direction and through the midpoint of the Y-axis in Figure 10a is plotted in Figure 11a. It is represented by a blue solid curve while the theoretical contour line is represented by a red dashed curve. The difference between the experimental measurement result and the theoretical result, called the measurement error, is shown in Figure 11b. The maximum error of the measurement results of the proposed method was 1.1 mm and the standard deviation was 0.52 mm. The experimental measurement results are basically consistent with the theoretical results. Figure 12 shows the full-field distribution of the measurement error.
The sticking point of shearography measurement is to obtain clear and high-quality fringe patterns in the phase map. According to Equations (2) and (3), there is a linear relationship between the phase and the displacement of the light source. When the displacement of the source increases, the fringes in the phase maps become denser. Since the filtering of phase map is based on pixels, denser fringes will cause large phase errors during the filtering. Therefore, when the surface slope of the object is large, a relatively small amount of source displacement should be carried out to keep the fringe density appropriate. Otherwise, a camera with more pixels should be used for image acquisition.

3.2. Non-Destructive Testing Applications

There were three prefabricated defects in the object with a hyperbolic paraboloid surface, shown in Figure 13. Coordinate values of these defects in a Cartesian coordinate system were determined directly by the digital shearography when the object was subjected to a thermal load and the laser source kept stationary. However, in practical applications, the surface distance of the defect from a particular location, rather than its coordinates, is used to locate the defect. Therefore, if the object has a curved surface, the coordinates of the defects should be converted to the surface distances to particular locations in conjunction with the contour information based on the expressions:
P x = n = 1 N x n x n 1 2 + Z n Z n 1 2 P y = m = 1 M y m y m 1 2 + Z m Z m 1 2
where Px and Py are the distances of the defect to particular locations along the X and Y directions, respectively, and xn and ym are the coordinates of the defect.
Combining the contour shown in Figure 10a with the coordinates of the defects, the curvilinear distances of the defect from the edge of the object were determined. The distances of the three defects to the left and right sides are shown in Figure 14. The maximum horizontal and vertical positioning error was 1.2 mm.
At present, the location of defects using the traditional digital shearography is mostly aimed at planar objects [24,25,26]. When curved objects are inspected, the precise location of defects is difficult. Using the proposed method, the contour of the object is obtained simultaneously, thus the defects can be easily located.

4. Conclusions

A 2D digital shearography with source displacement for contour measurement is presented. The method can be used to measure both surface displacement derivatives and surface contours of various objects. When the displacement derivative is measured, the object under test should be loaded but the laser source of the shearography should be kept stationary. When the contour is measured, the object is not loaded but the laser source should be moved during the measurement. In strain measurements and non-destructive testing on composite materials, the displacement derivatives and contours can be determined by the proposed 2D digital shearography. Based on the displacement derivatives and contours, the strain can be measured more accurately and the locations of defects inside the materials are expressed in a more appropriate form.
The proposed method solves the problem of the traditional method being only able to measure the surface contour of rotationally symmetrical objects. It greatly expands the scope of application of contour measurement. For objects commonly found in engineering, this method is capable of making efficient measurements. However, for objects with completely discontinuous surfaces, the measurement of their contour is still difficult due to the blocking of the path of phase unwrapping. It is necessary to change the way the phase is unwrapped and the way the light source moves, so that the contour measurement of the surface discontinuous object can be achieved. In the experiments, the objects were coated with reflective material to increase reflectivity. These reflection coatings are not necessary when the output power of the lasers is large enough. Digital shearography is suitable for a variety of objects with diffuse reflective surfaces, which makes the method proposed in this article widely applicable.

Author Contributions

Conceptualization, M.Y. and S.W.; methodology, M.Y. and S.W.; software, M.Y.; validation, M.Y., S.W. and W.L.; formal analysis, M.Y., S.W. and J.S.; investigation, M.Y.; resources, S.W., W.L. and J.S.; data curation, M.Y.; writing—original draft preparation, M.Y.; writing—review and editing, S.W.; visualization, M.Y.; supervision, S.W.; project administration, S.W.; funding acquisition, S.W. and W.L. All authors have read and agreed to the published version of the manuscript.

Funding

This research was funded by the National Natural Science Foundation of China, grant numbers 52075045, 52075044 and the Natural Science Foundation of Beijing Municipality, China, grant number 4212047.

Data Availability Statement

The simulated and experimental data that support the works of this study are available from the corresponding authors on reasonable request.

Conflicts of Interest

The authors declare that they have no competing interests.

References

  1. Talreja, R. Damage and fatigue in composites—A personal account. Compos. Sci. Technol. 2008, 68, 2585–2591. [Google Scholar] [CrossRef]
  2. Zhao, Q.; Dan, X.; Sun, F.; Wang, Y.; Wu, S.; Yang, L. Digital shearography for NDT: Phase measurement technique and recent developments. Appl. Sci. 2018, 8, 2662. [Google Scholar] [CrossRef]
  3. Yusof, M.Y.; Loganathan, T.M.; Burhan, I.; Wan, S.; Zakaria, N. Shearography technique on inspection of advanced aircraft composite material. IOP Conf. Ser. Mater. Sci. Eng. 2019, 554, 012009. [Google Scholar] [CrossRef]
  4. Márquez, F.P.G.; Chacón, A.M.P. A review of non-destructive testing on wind turbines blades. Renew. Energy 2020, 161, 998–1010. [Google Scholar] [CrossRef]
  5. Groves, R.M.; James, S.W.; Tatam, R.P. Full surface strain measurement using shearography. Proc. SPIE 2001, 4448, 142–152. [Google Scholar]
  6. Sam, V.; Dirckx, J. Real-time structured light profilometry: A review. Opt. Lasers Eng. 2016, 87, 18–31. [Google Scholar]
  7. Anisimov, A.G.; Serikova, M.G.; Groves, R.M. 3D shape shearography technique for surface strain measurement of free-form objects. Appl. Opt. 2019, 58, 498–508. [Google Scholar] [CrossRef]
  8. Sirohi, R. Shearography and its applications—A chronological review. Light Adv. Manuf. 2022, 3, 1–30. [Google Scholar] [CrossRef]
  9. Hung, Y.Y.; Turner, J.L.; Tafralian, M.; Hovanesian, J.D.; Taylor, C.E. Optical method for measuring contour slopes of an object. Appl. Opt. 1978, 17, 128–131. [Google Scholar] [CrossRef]
  10. Huang, J.R.; Tatam, R.P. Optoelectronic shearography: Two wavelength slope measurement. Proc. SPIE 1995, 2544, 300–308. [Google Scholar]
  11. He, Y.M.; Tay, C.J.; Shang, H.M. Digital phase-shifting shearography for slope measurement. Opt. Eng. 1999, 38, 1586–1590. [Google Scholar]
  12. Tay, C.J.; Shang, H.M.; Poo, A.N.; Luo, M. Measurements of surface coordinates and slopes by shearography. Opt. Laser Technol. 1992, 24, 209–213. [Google Scholar] [CrossRef]
  13. Groves, R.M.; James, S.W.; Tatam, R.P. Shape and slope measurement by source displacement in shearography. Opt. Lasers Eng. 2004, 41, 621–634. [Google Scholar] [CrossRef]
  14. Anand, A.; Groves, R.M.; Schwab, X.; Pedrini, G.; Osten, W. Fresnel wavefront propagation model for shearography shape measurement. Proc. SPIE 2007, 6617, 219–226. [Google Scholar]
  15. Riley, M.E.; Gusinow, M.A. Laser beam divergence utilizing a lateral shearing interferometer. Appl. Opt. 1997, 16, 2753–2756. [Google Scholar] [CrossRef] [Green Version]
  16. Servin, M.; Cywiak, M.; Davila, A. Lateral shearing interferometry: Theoretical limits with practical consequences. Opt. Express 2007, 15, 17805–17818. [Google Scholar] [CrossRef]
  17. Deepan, B.; Quan, C.; Tay, C.J. Determination of slope, curvature, and twist from a single shearography fringe pattern using derivative-based regularized phase tracker. Opt. Eng. 2016, 55, 121707. [Google Scholar] [CrossRef]
  18. Xie, X.; Lee, C.P.; Li, J.; Zhang, B.; Yang, L. Polarized digital shearography for simultaneous dual shearing directions measurements. Rev. Sci. Instrum. 2016, 87, 083110. [Google Scholar] [CrossRef]
  19. Wang, Y.; Gao, X.; Xie, X.; Wu, S.; Liu, Y.; Yang, L. Simultaneous dual directional strain measurement using spatial phase-shift digital shearography. Opt. Lasers Eng. 2016, 87, 197–203. [Google Scholar] [CrossRef]
  20. Wang, S.; Dong, J.; Pöller, F.; Dong, X.; Lu, M.; Bilgeri, L.M.; Jakobi, M.; Salazar-Bloise, F.; Koch, A.W. Dual-directional shearography based on a modified common-path configuration using spatial phase shift. Appl. Opt. 2019, 58, 593–603. [Google Scholar] [CrossRef]
  21. Barrera, E.S.; Fantin, A.V.; Willemann, D.P. Multiple-aperture one-shot shearography for simultaneous measurements in three shearing directions. Opt. Lasers Eng. 2018, 111, 86–92. [Google Scholar] [CrossRef]
  22. Huang, L.; Xue, J.; Gao, B.; Zuo, C.; Idir, M. Spline based least squares integration for two-dimensional shape or wavefront reconstruction. Opt. Lasers Eng. 2017, 91, 221–226. [Google Scholar] [CrossRef]
  23. Li, W.; Bothe, T.; Kopylow, C.V.; Jueptner, W. Evaluation methods for gradient measurement techniques. Proc. SPIE 2004, 5457, 300–311. [Google Scholar]
  24. Wei, Y.; Ding, L.; Han, Y.; Luo, Y.; Su, Z.; Zhang, D. Characterizing defects in materials with fusion of thermography and shearography. Measurement 2021, 182, 109736. [Google Scholar] [CrossRef]
  25. Banakar, F.; Akbari, D. Investigation of Digital Shearography for Defect Detection in Different Materials. Nondestruct. Test. Technol. 2019, 2, 8–22. [Google Scholar]
  26. Francis, D.; Tatam, R.P.; Groves, R.M. Shearography technology and applications: A review. Meas. Sci. Technol. 2010, 21, 10200. [Google Scholar] [CrossRef] [Green Version]
Figure 1. One-dimensional digital shearography with source displacement.
Optics 03 00031 g001
Figure 2. Two-dimensional digital shearography with source displacement.
Optics 03 00031 g002
Figure 3. Two-dimensional color shearography with source displacement.
Optics 03 00031 g003
Figure 4. Grid model in 2D integration.
Optics 03 00031 g004
Figure 5. Two objects under test, including (a) a ball and (b,c) an object with a hyperbolic paraboloid surface. The front view and side view of the hyperbolic paraboloid object are shown.
Optics 03 00031 g005
Figure 6. The phase maps corresponding to the ball under test, including (a) the raw phase map, (b) the filtered phase map, (c) the unwrapped phase map in the X direction, (d) the raw phase map, (e) the filtered phase map, and (f) the unwrapped phase map in the Y direction. The overlapped area in the phase maps is identified with red circles.
Optics 03 00031 g006
Figure 7. The height maps of the ball contour obtained using (a) the proposed 2D digital shearography with source displacement and (b) the traditional 1D digital shearography with source displacement.
Optics 03 00031 g007
Figure 8. Cross-sectional height distributions of contour and the measurement error. (a) Height distributions of contour and (b) error distributions.
Optics 03 00031 g008
Figure 9. The phase maps corresponding to the object with a hyperbolic paraboloid surface, including (a) the filtered phase map, (b) the unwrapped phase map in the X direction, (c) the filtered phase map, and (d) the unwrapped phase maps in the Y direction.
Optics 03 00031 g009
Figure 10. The height maps of the contour of an object with a hyperbolic paraboloid surface obtained using (a) the proposed 2D digital shearography with source displacement and (b) the traditional 1D digital shearography with source displacement.
Optics 03 00031 g010
Figure 11. Comparison of outputs obtained by experiment and calculation: (a) height distributions of contour and (b) error distributions.
Optics 03 00031 g011
Figure 12. The full-field distribution of the measurement error.
Optics 03 00031 g012
Figure 13. Three defects in the object with a hyperbolic paraboloid surface.
Optics 03 00031 g013
Figure 14. The surface distances of the defects to the edges.
Optics 03 00031 g014
Publisher’s Note: MDPI stays neutral with regard to jurisdictional claims in published maps and institutional affiliations.

