Article

Fatigue Damage of Short Fibre-Reinforced Thermoplastics in Crashworthiness Simulation

by
Christian Witzgall
* and
Sandro Wartzack
Engineering Design, Friedrich-Alexander-Universität Erlangen-Nürnberg, 91058 Erlangen, Germany
*
Author to whom correspondence should be addressed.
Appl. Mech. 2023, 4(4), 1188-1205; https://doi.org/10.3390/applmech4040061
Submission received: 20 September 2023 / Revised: 26 November 2023 / Accepted: 28 November 2023 / Published: 30 November 2023
(This article belongs to the Collection Fracture, Fatigue, and Wear)

Abstract

:
Service loads repeatedly stress components on a regular basis and lead to fatigue damage in the material. In the case of components made of short fibre-reinforced thermoplastics, which are also crash-relevant in addition to only bearing service loads, however, a significant deterioration in mechanical properties can be observed after fatigue damage has been introduced. This is where the approach presented in this paper comes in: in order to enable a realistic simulation of such components in their used conditions, the material data are assigned depending on previously determined damage. The approach, which combines the domains of highly dynamic and cyclic experiments as well as different types of numerical simulations, is tested for its performance in the present paper. For this purpose, component tests are carried out on cross-rib beams, which serve to validate the method. The novelty and uniqueness of this paper lies in the linking of fatigue life and crashworthiness considerations for short fibre-reinforced thermoplastics, which, in this case, is raised to a new level by considering the component level for the first time.

1. Introduction

1.1. Motivation

The competing demands of occupant protection and weight reduction present a challenge to automotive product developers. Fibre-reinforced plastics have been increasingly used in vehicles since the turn of the century, with the aim of replacing metallic components to achieve these conflicting objectives. Due to their high specific stiffness and strength and energy absorption capacities, these lightweight materials are also accepted for crash-relevant components [1,2].
Short fibre-reinforced thermoplastics are particularly common in the automotive industry and can be manufactured in large quantities at a low cost by injection moulding [3,4]. They are used in applications such as engine mounts, bumpers, and door systems, i.e., those that must support payloads during normal vehicle operation, but they also have failure and energy absorption characteristics that are important for occupant safety in the event of a collision. Therefore, these components must be accurately designed to take into account both their crash characteristics and service load scenarios.
However, a comparative crash test of used cars equipped with airbags carried out by the Swiss Dynamic Test Center [5] showed that factors such as mileage and age of the car can affect crash safety. In this test, used cars that are 12 years old are subjected to the same conditions as new cars before they are launched on the market. One of the cars tested with a particularly high mileage shows a significantly higher occupant load, which the car owners claim is “due to the ageing of the car as a whole”, even though there is no discernible deterioration in the safety of several of the cars tested. It is not possible to predict these changes, which are also caused by mechanical stresses during the life of the vehicle, if only the new condition is taken into account.
VDI Guideline 2223, which deals with the methodical design of technical products, also calls for the analysis and evaluation of the scaled overall design: “The entire life cycle of the product must be considered and the design must be checked for compliance with the requirements (…)”. This directive is the source of motivation for this work [6]. Therefore, a method for the determination and prediction of crash-relevant material properties of short fibre-reinforced thermoplastics with prior service histories is to be provided in the current study. This should provide the computational engineer with a tool to evaluate the effects of short-term dynamic stresses even under service conditions, even though stress levels are far below the amounts found in hertzian contacts, e.g., [7].
Due to the overall high industrial importance of vehicle construction and the paramount need for occupant safety and injury prevention, the term “crash” will be used in this context and throughout this work, especially in context of simulation [8]. It should be made clear that the procedures described here can of course be applied to other areas of application, where the use of short fibre-reinforced thermoplastics and the consideration of high strain rates are relevant, such as all types of enclosures where strengths are relevant in drop tests [9].

1.2. State of the Art and Prior Work

The anisotropy of the material’s behaviour caused by the fibre reinforcement should be taken into account in the so-called integrative simulation [10]. It is essential to consider the manufacturing process in order to obtain the knowledge necessary to understand the state of the fibre distribution. An overview of the stages in the integrated simulation process is shown in Figure 1: First, CAD modelling is used to determine the shape of the part, following the standard guidelines for manufacturing the design of the injection moulded parts. Once the geometry has been defined, the injection moulding process is simulated, which may require consideration of different sprue placements and changing process parameters. The process simulation provides details of the fibre orientation [11] of the component as well as geometric aberrations caused by warpage and shrinkage. The following structural simulation uses the knowledge of the fibre orientation, and mapping is required to ensure the transfer of information from the process simulation to the structural simulation [12]. The structural simulation includes information such as stresses, strains, and deformations, as well as an analysis of the component’s behaviour under service loads. At this stage, if necessary, the individual fatigue strength of the component is also investigated. The final phase is the crash simulation, which also uses the fibre orientation data from the injection mould simulation. No account is taken of previous strains caused by service loads.
However, especially with fibre-reinforced plastics, there is a loss of performance over the service life if cyclically recurring loads cause damage in the material [13]. The damage progress of short fibre-reinforced thermoplastics behaves in a strongly non-linear manner and is characterised by different effects over the course of the service life. Horst and Spoormaker describe four different phases in [14]:
-
Onset of local weakening as a result of cyclic deformation, especially starting from the places of greatest stress intensity, the fibre ends.
-
Beginning of crack formation.
-
Stable crack growth due to cyclic loading. Different effects are to be distinguished, such as separation at the interfaces between fibres and matrix, deformation, and fracture of the matrix between the fibres, fibre pull-out, and fibre breakage.
-
Unstable crack growth that leads to the destruction of the material, comparable to the failure in the tensile test.
Thus, the measured residual strength, here in the static case, decreases after increasing fatigue damage induced, as Figure 2 shows [15]. Similar assessments has been published in [16,17,18]. The characteristics of the fatigue behaviour are influenced by fibre orientation, test frequency, temperature [19], or humidity [20].
The term fatigue damage is used here to refer to the loss of stiffness in the material, according to the definitions given by Mao and Mahadevan [21]. The definition of damage relates the Young’s modulus in the n th cycle, E n to the Young’s modulus of the virgin specimen, E 0 . E f describes the last remaining stiffness before fracture of the material:
D n = E 0 E n E 0 E f
A direct correspondence between damage parameter and residual strength for laminates experiencing static loading is evident in van Paepegem and Degrieck’s research featured below [22,23], which supports the methods of Shokrieh and Lesard [24,25]. Van Paepegem and Degrieck define the damage parameter through the loss of stiffness [26], also referred to as a tensorial quantity in certain sections [27]. Van Paepegem [28] notes that the degradation of material parameters in fibre-reinforced plastics tends to focus on stiffness in the direction of reinforcement. However, parameters such as transverse contraction (sometimes referred to as the “ugly duckling” by van Paepegem in this context) or shear stiffness are often overlooked, despite experimental evidence supporting their importance. In summary, it can be stated that research on the degradation of materials and their residual strength predominantly focuses on continuous fibre-reinforced laminates.
This is where the mfkFatiCrash approach comes in. It is undeniable that recurring operational loads cause damage to the material, and this causes a deterioration of the properties. This reduction in stiffness and residual strength from the service loads must be taken into account in a suitable way to enable a reliable prediction of the component behaviour in overload and crash situations. As the name mfkFatiCrash suggests, it is a combination of the institute’s name KTmfk and the terms fatigue damage and crashworthiness. The approach is to calculate the damage that occurs during the service life of the component and to map it into a subsequent crash simulation. This method offers the clear advantage that, for the simulation of components in a used condition, material data of a brand-new state are not used as before.
In our own work on the short fibre-reinforced thermoplastic PBT GF30, the fatigue behaviour of the material on tension rods was determined. Thereupon, samples were specifically pre-damaged and examined for their residual strength, which showed significant decreases [29,30]. This is shown in Figure 3, where experimental results of damaged specimen are compared with the average of virgin specimen: you can see how the residual strength of a short fibre-reinforced thermoplastic is reduced by orders of magnitude of up to around 40% after it has been mechanically stressed with a preceding fatigue damage.
Along with the reduction in residual strength, a corresponding reduction in the maximum tolerable elongation can be observed in the pre-damaged material, i.e., its behaviour becomes more brittle and is less characterised by plasticity. This is also reflected in effects such as buckling, which make a significant contribution to energy absorption in the crash. With a reduced deformation capability, considerably less energy can be absorbed here.
Figure 4 additionally shows the comparison of the test curves with the simulated material behaviour, represented as a surface plot from sampling damage steps of 0.02. In the previous work of the authors, an approach could be created in this way, which, on the one hand, allows an estimation of the fatigue life and the fatigue damage and, on the other hand, a prediction of the corresponding material behaviour.

1.3. Problem Statement and Aims of Work

In the previous section, the production, the material properties, and the resulting demanding material modelling of short fibre-reinforced thermoplastics in crash simulation were explained. The so-called integrative simulation manages to take the fibre distribution in the component and the resulting anisotropy exactly into account by considering the manufacturing process. Effects such as strain rate dependence in the non-linear, plastic range of deformation and in failure can be taken into account by including high-dimensional characterisation tests. The possibilities of simulating short fibre-reinforced thermoplastic components in short-term dynamic events such as drop tests of consumer goods or vehicle crashes can be considered very far-reaching. The determination of the characteristic values required for this is based on as-new samples, which, to a certain extent, have no history at all.
In contrast, studies of the fatigue behaviour of short fibre-reinforced thermoplastics and fibre-reinforced plastics in general show a distinctly non-linear damage behaviour, which is accompanied by a continuous loss of stiffness over the service life. With increasing service life, it can be further observed that the residual strength of the fibre-reinforced plastic decreases. To address this problem, a coupon-level approach was developed to describe the damage increase in the material and to determine the loss of residual strength through experimental analysis. On the other hand, by integrating it into the simulation, the possibility is created to predict just this material degradation and residual strength for any state of pre-damage.
The aims of this paper are therefore the following: on the one hand, the approach addressed is to be explained in more detail for the reader. Then, the steps performed on simple tension rods are to be transferred to a more sophisticated, three-dimensional geometry in order to validate the suitability of the approach for use in the simulation of representative components. The novelty and uniqueness of this paper lies in the linking of fatigue life and crashworthiness considerations for short fibre-reinforced thermoplastics, which, in this case, is raised to a new level by considering the component level [31] for the first time in this context.

2. Materials and Methods

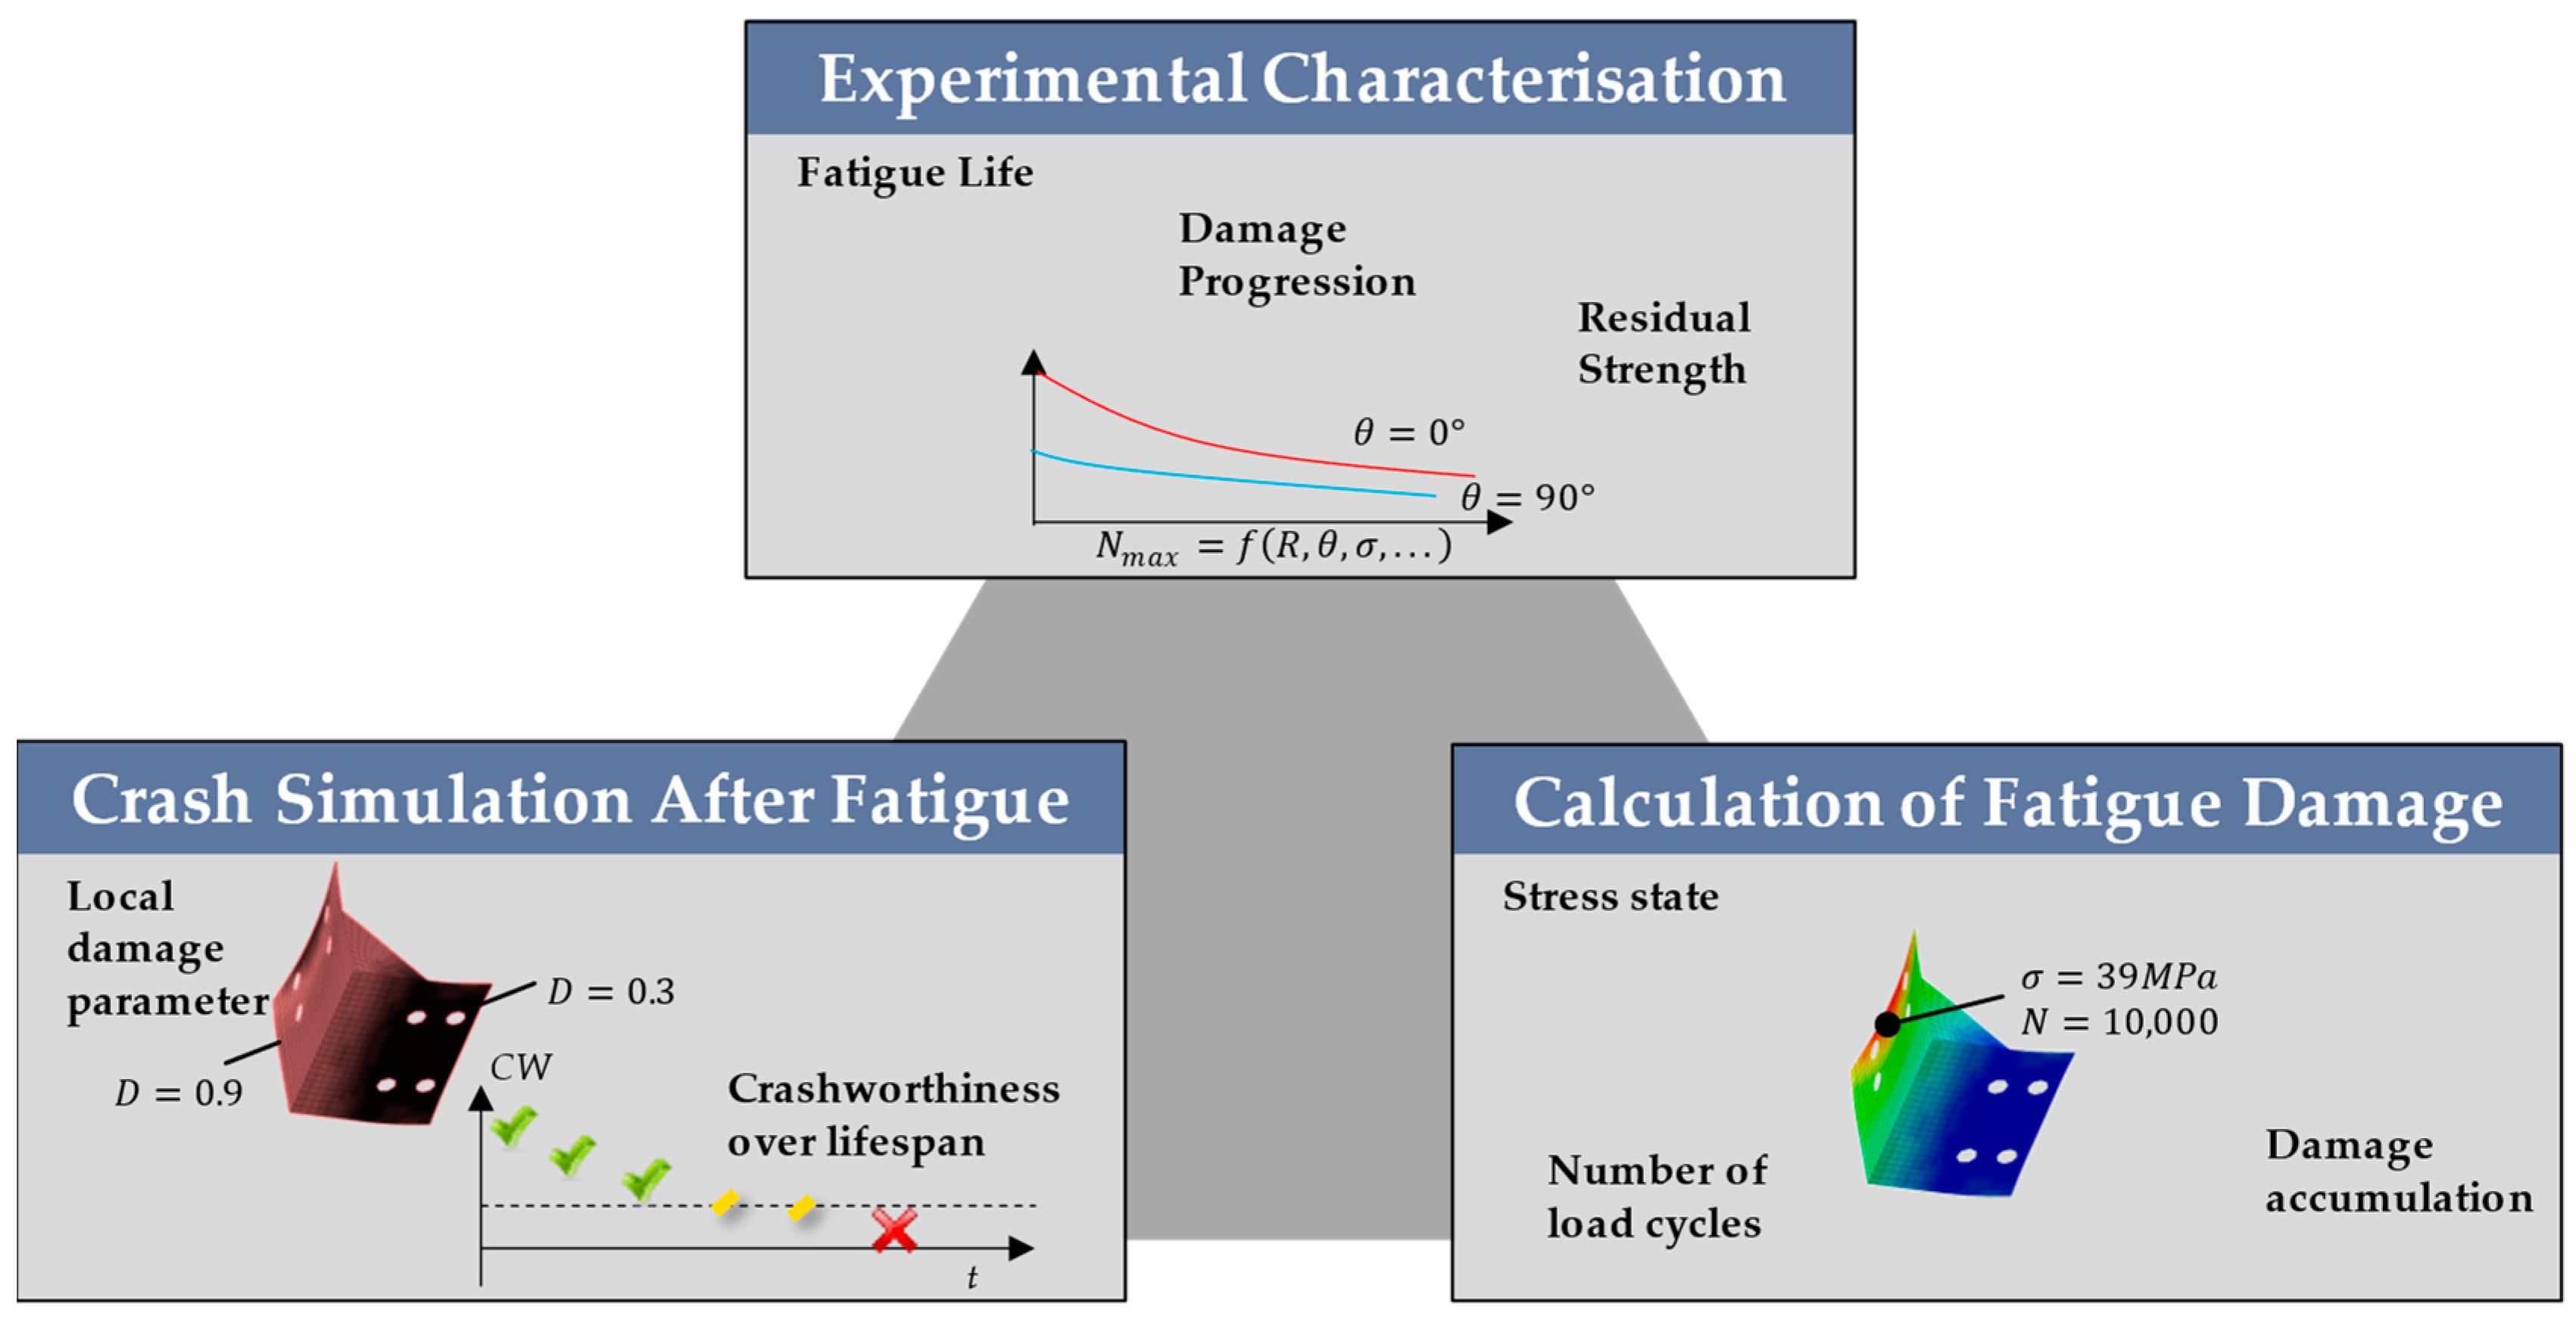
2.1. mfkFatiCrash: Considering Fatigue Damage in Crash Simulation

In this section, we explicate a process for taking material degradation into account when simulating crashes involving short fibre-reinforced thermoplastics. As illustrated in Figure 5, the calculation approach encompasses several key stages, starting with the experimental determination of characteristic values. In this step, it is necessary to conduct static, cyclic, and high velocity experiments to obtain information about the anisotropic stiffness and strength characteristics of the material under static and dynamic impact load applications. Additionally, cyclic experiments provide the necessary characteristic values for the direction-dependent fatigue strength and damage progression over the service life [32]. In the subsequent stage, damage distribution within the component in question is computed based on the stresses engendered from operational loads. Oftentimes, data regarding the stress conditions of the component is obtainable during product development through simulations to guarantee functionality during use. Based on these experimental findings, the damage distribution in the component can be calculated. This knowledge of material parameters can then be transferred to the following crash simulation, taking into account the predicted local damage state.
The steps to determine fatigue damage by simulation are sketched in Figure 6: understanding the distribution of a component’s fibres is crucial in preparing to simulate short fibre-reinforced components [33], see step (1). To do so, simulating the injection moulding process and transferring the fibre orientation tensors [34,35] to the structural simulation is required. It is important to note that a mapping is necessary, as the meshing for the process simulation and the structural simulation differ. Generally, the process simulation is carried out with fine solid elements, so that several elements are available across the thickness. However, in structural and especially crash simulation, midplane meshes with shell elements are predominant. Thus, the fibre orientation tensors in the solid mesh of the process simulation are locally averaged and projected into the midplane. In this way, a material orientation is available for each shell element.
The testing procedure involves applying a solicite static load to replicate the service load scenario, enabling the elucidation of the principal stress condition (2) affecting the component. Analysis of the material behaviour of the short fibre-reinforced plastic necessitates consideration of anisotropy in the elastic range [36]. As taking into account the service load implies occurrence of no stress beyond the elastic limit or under increasing strain rates. Implicit solvers are frequently utilised in calculating the model under static conditions, with each component’s stress condition in the material coordinate system provided by the simulation.
The damage to each finite element can be determined through the use of load cycle count (3), which provides information on the damage distribution across the entire component (4). A crucial factor required for this calculation is the maximum cycles the material can sustain under the present stress state. Computation of this factor is carried out externally to the simulation environment. The damage parameter for each element is calculated as follows:
D n = 1 1 n N m a x A B
In this equation, n is the number of load cycles that actually occur, and N m a x is the maximum tolerable number of load cycles for the given stress state. A and B are material constants derived from testing of tension rods. The maximum tolerable number of load cycles is calculated using the Tsai–Hill criterion to compare actual stress levels, σ , σ , and τ , with bearable stress levels, σ , f , σ , f , and τ , f :
N max σ , σ , τ = σ σ , f 2 + σ σ , f 2 + τ τ , f 2 σ · σ σ , f 2 1 2 b
The exponent b describes the slope of the S-N curves and is derived from destructive cyclic testing. In this way, the damage D caused by the n-times load with the service load can be calculated for each element of the simulation. At the same time, this calculation step can be used to estimate the service life that can be achieved. A more thorough explanation on the approach of damage calculation can be found in [37].
In order to use material parameters in the subsequent crash simulation, which correspond to the state of existing damage, characteristic values from pre-damaged material characterization are required. These may include the residual strength as a function of the earlier introduced damage. The process of calculating the local, damage-dependent material parameters for the crash simulation is shown in Figure 7. From the calculation step described earlier, the damage for each element in the service load case’s simulation (1) is determined. As the targeted crash simulation usually has a different mesh, it may be necessary to perform mapping beforehand to transfer damage information to the relevant mesh (2). The calculation of reduced material parameters is then carried out outside the simulation platform (3). The anisotropic and orthotropic viscoplastic material model is utilised, with failure modelled through the Tsai–Hill failure criterion for short fibre-reinforced plastics. The anisotropic stiffness tensor, yield limits, yield stress curves, and failure parameters must be adjusted to account for induced damage in each element. This results in the creation of a distinct material map for each element.
As the damage was defined by the loss of stiffness, as explained before, the stiffness tensor is scaled accordingly:
C i j D = 1 D C i j , 0
The residual strength, the input for the Tsai–Hill failure model, is calculated as follows. On the one hand, the failure stress is scaled according to the prevailing strain rate using the Johnson–Cook model. The last term takes into account the consequences of fatigue damage, where the parameter p is identified as material dependent by experiments on pre-damaged material samples. For the strengths perpendicular to the fibre direction and shear, the same procedure can be followed.
σ , m a x ε ˙ , D = σ , m a x , 0 · 1 + 1 a · l o g 10 max ε ˙ , ε ˙ 0 ε ˙ 0 · 1 D p
This material definition for each element should then be transferred to the solver input deck in an appropriate manner (4). As the service load cases affect each element uniquely, the damage distribution and, consequently, the material parameters for the crash simulation will also differ correspondingly.

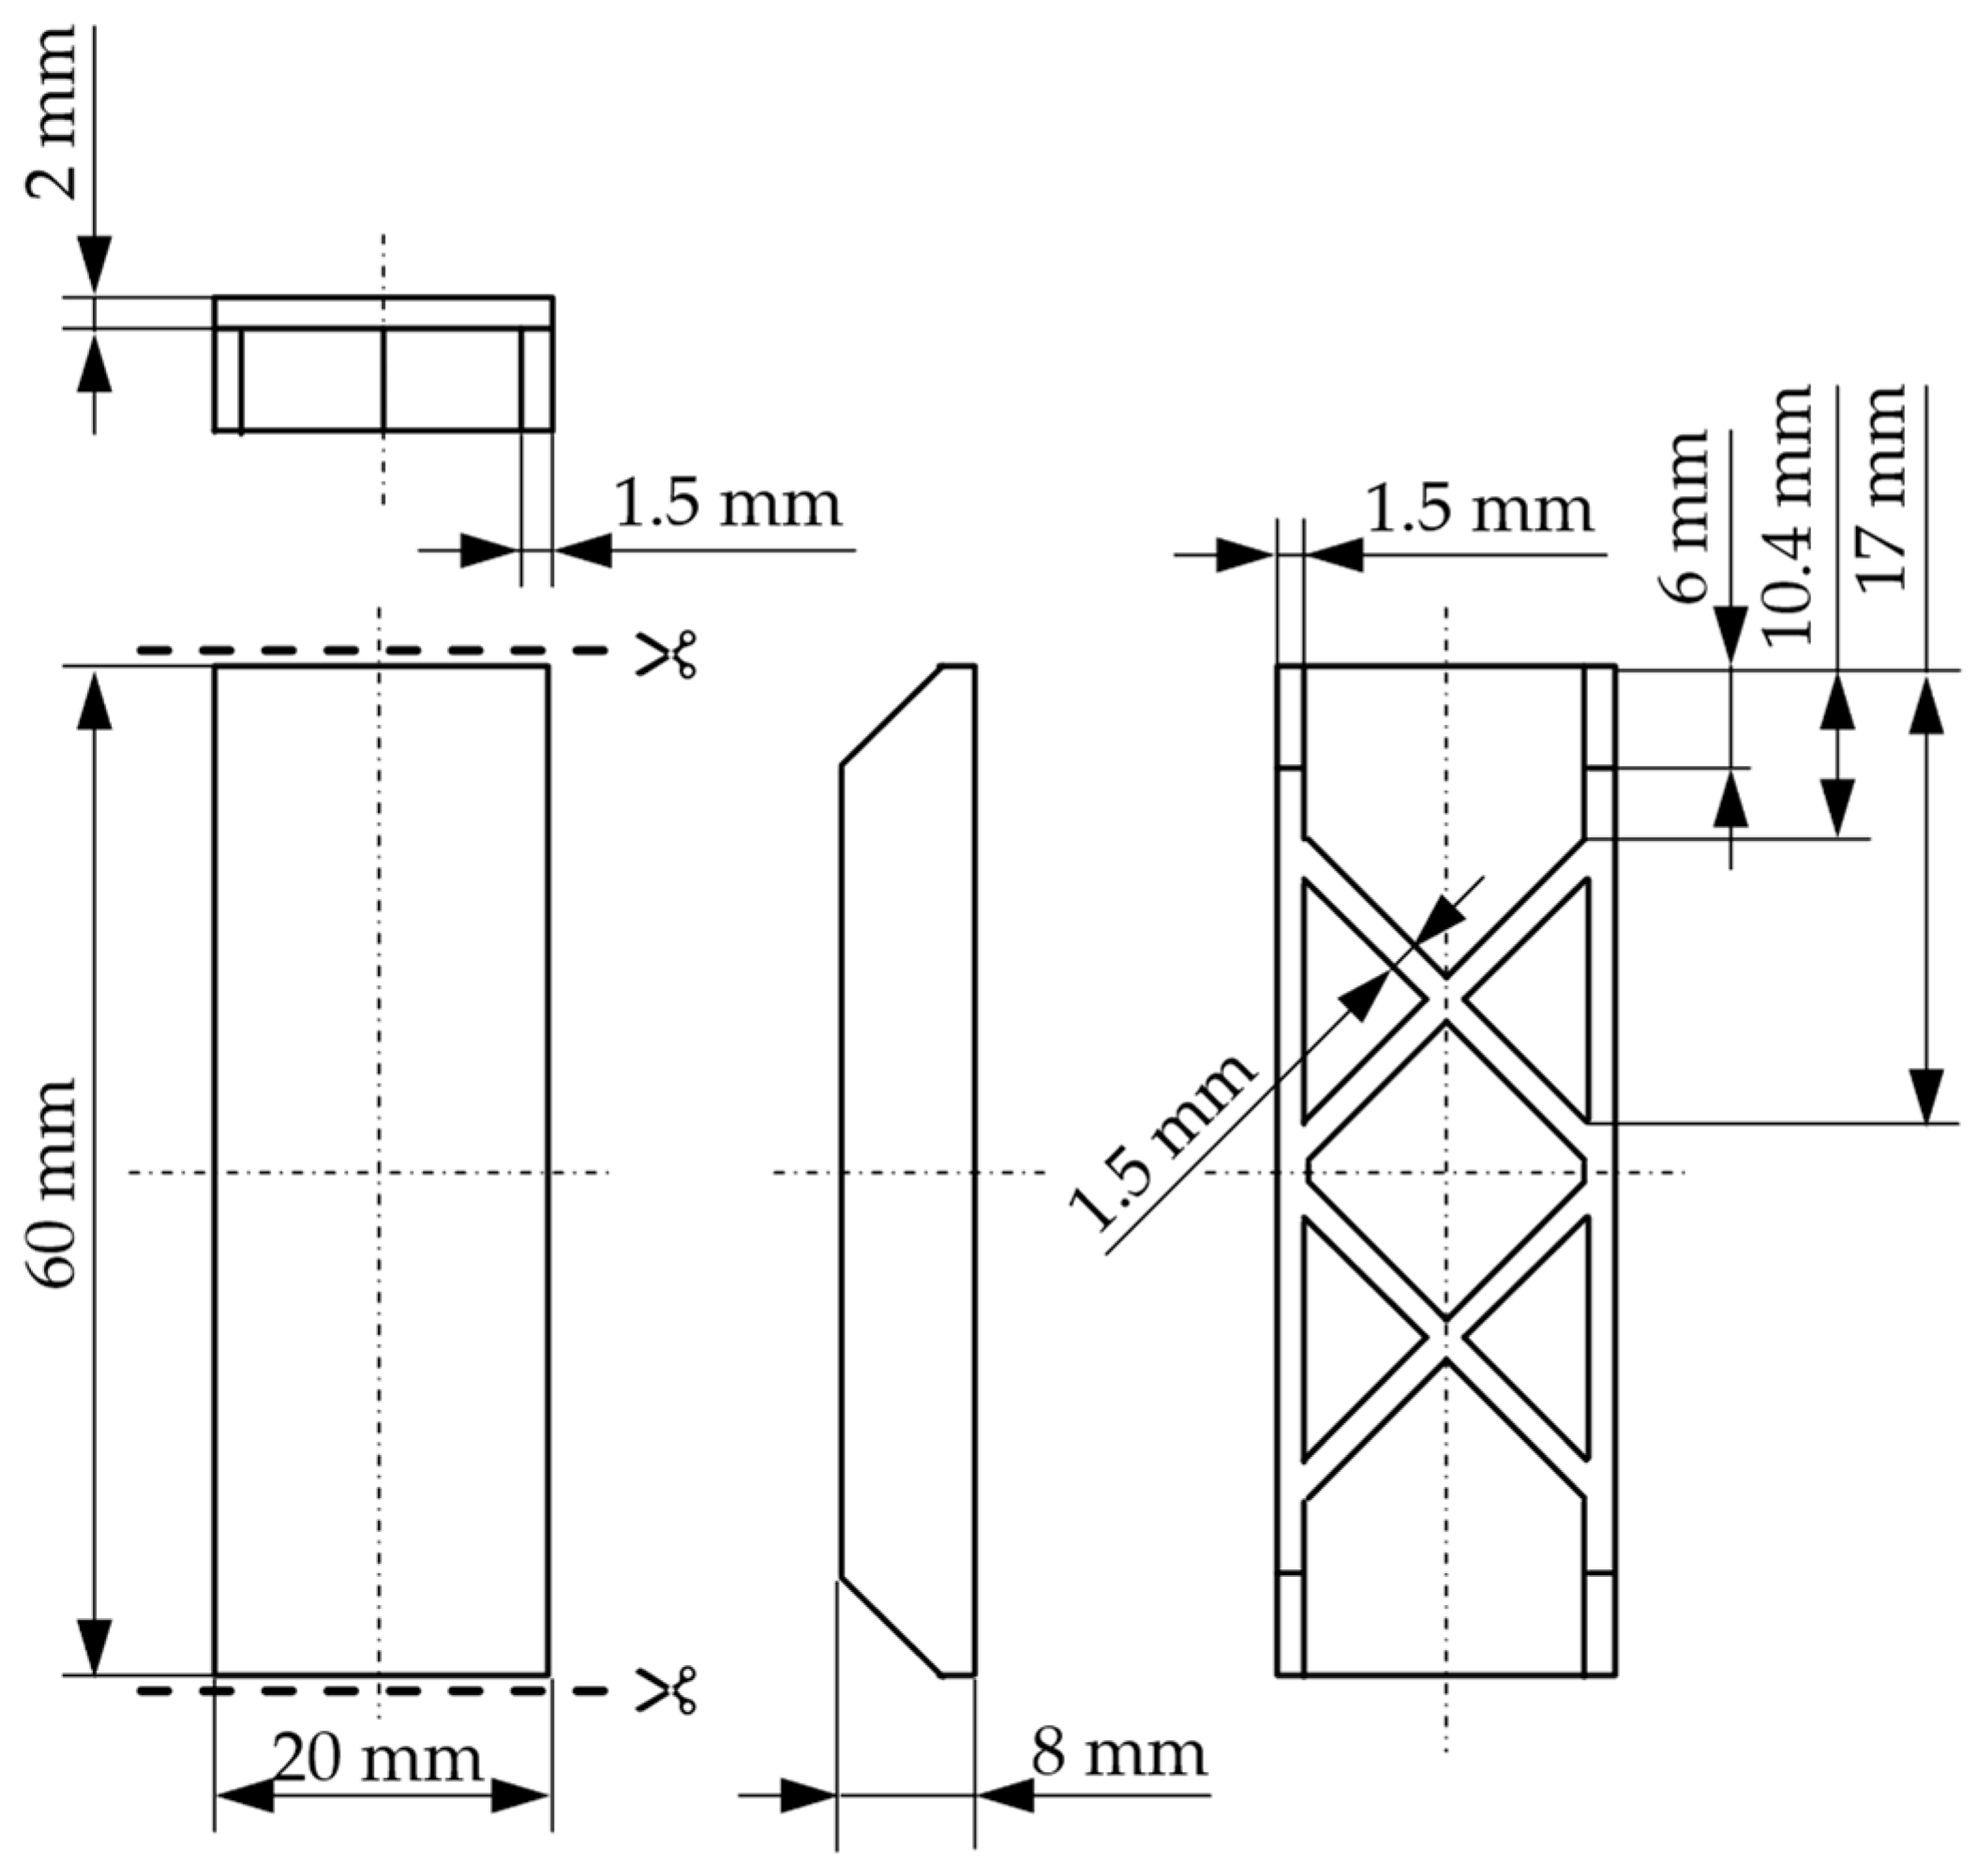
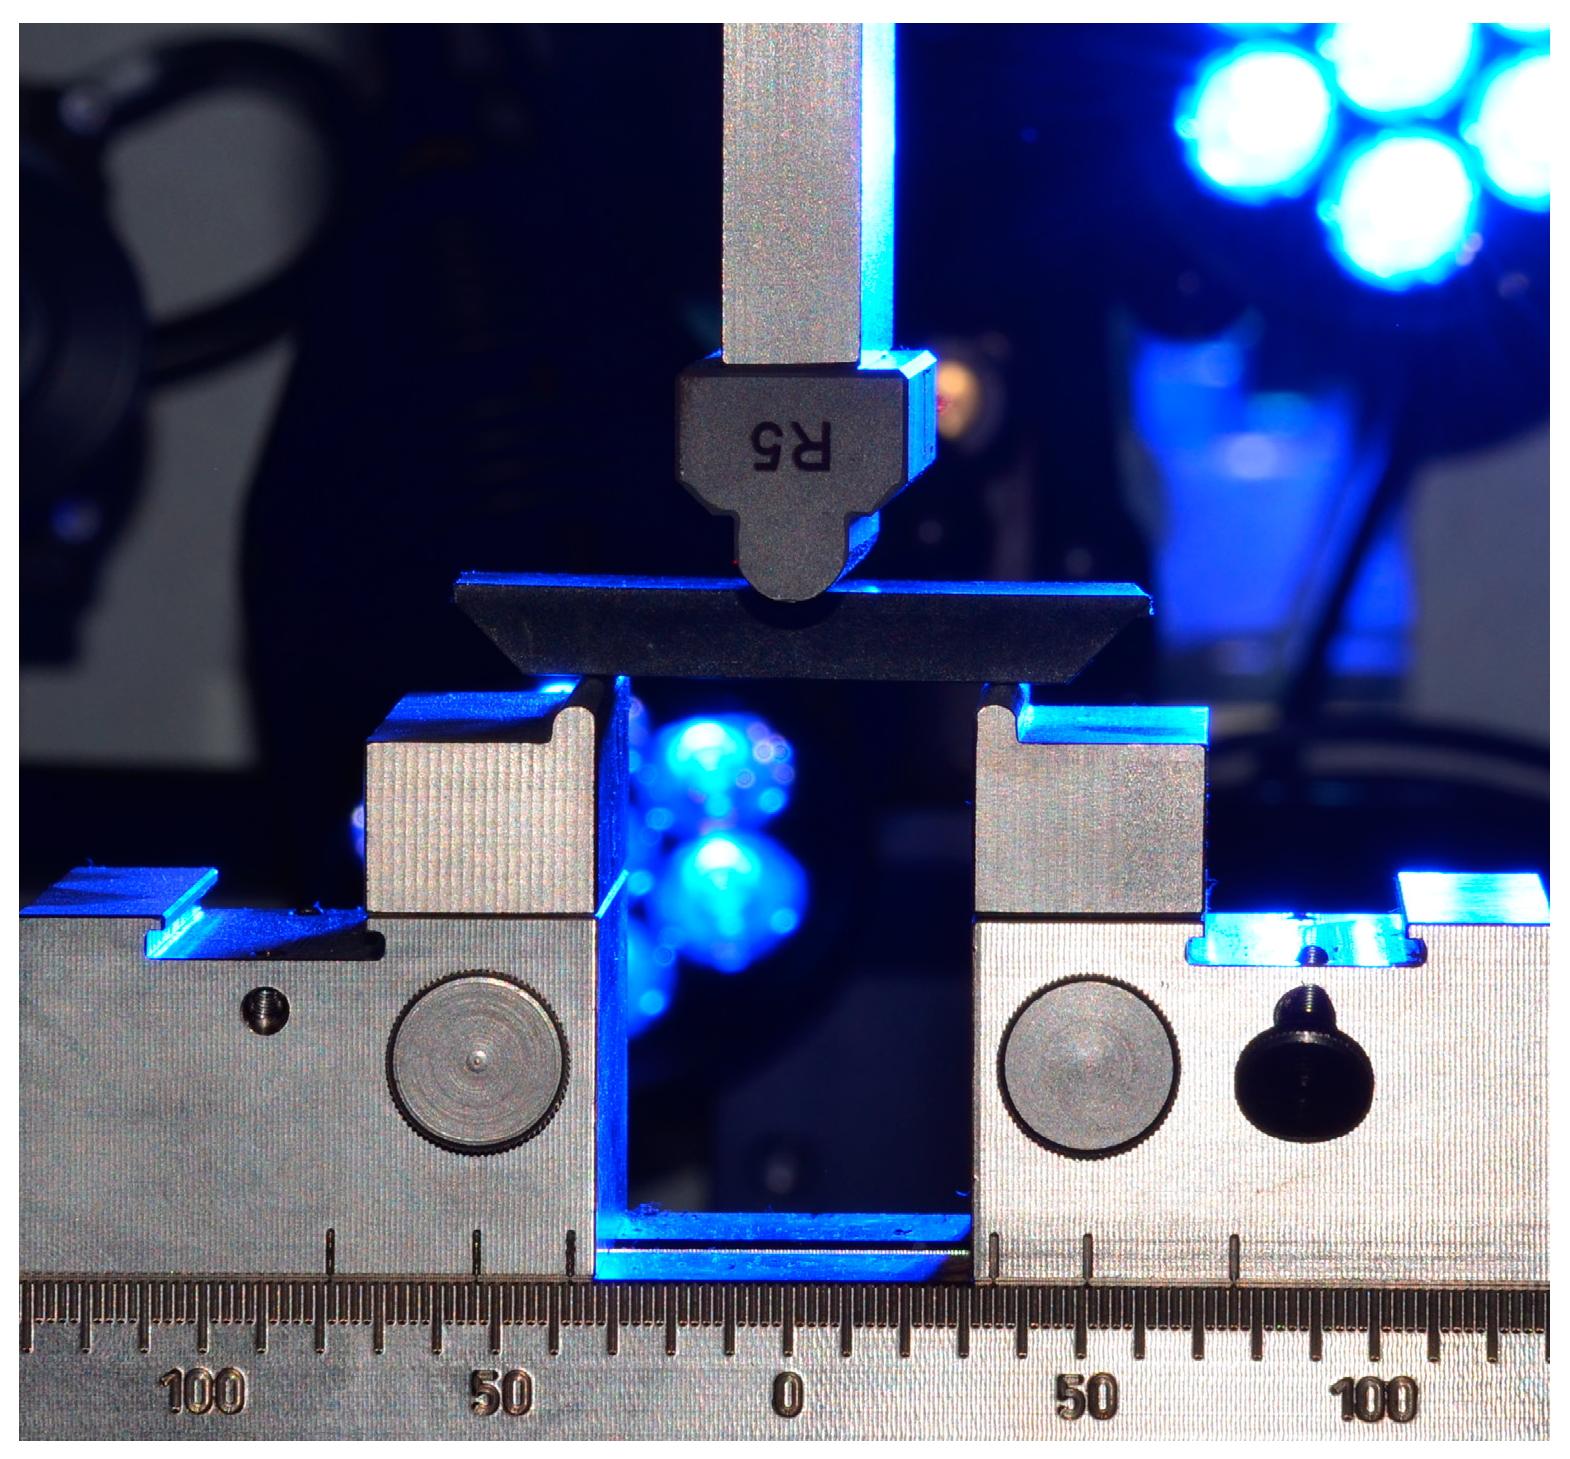
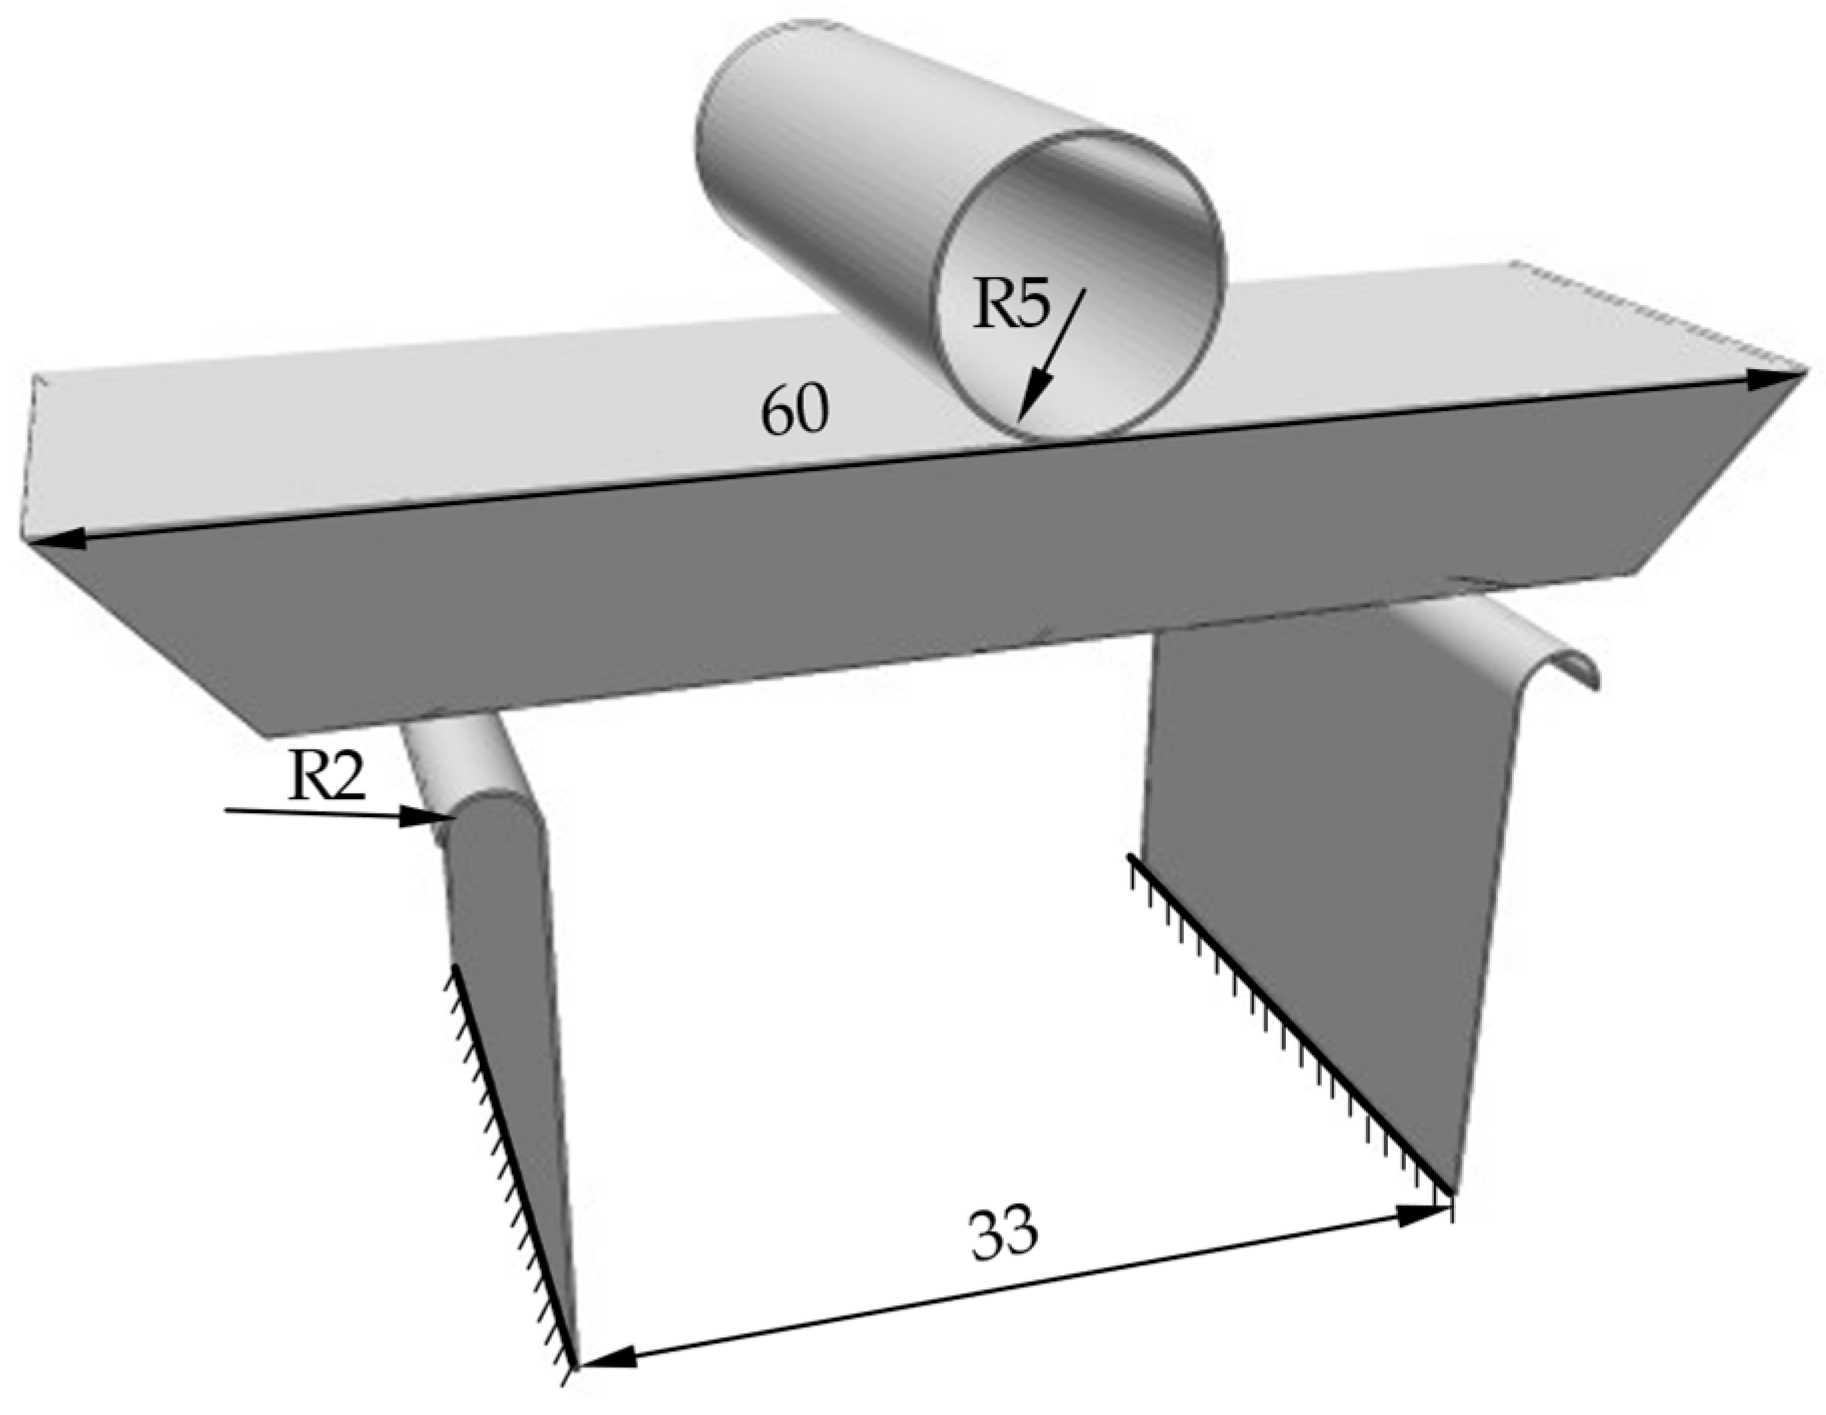
2.2. Description of Material and Specimen Geometry

The experiments conducted in this research utilised PBT GF30, a thermoplastic material empowered by E-glass fibres of short length. PBT, which stands for polybutylene terephthalate, serves as the matrix material and is fortified with 30% fibres by weight. These fibres have an average diameter of 10 µm and lengths shorter than 250 µm. This specialised thermoplastic reinforced with short fibres is famed for its superior stability owing to its low water absorption. The material has already been extensively characterised under static, highly dynamic, and cyclic conditions in previous work, so that a broad knowledge of the material behaviour is already available. The coupon-level experiments used for this are described in detail in [37,38]
The cross-ribbed beams employed for the bending experiments are constructed from a U-shaped profile, which is strengthened in the middle by two X-shaped struts (“XX-Rib”) [39]. The design is modelled on that of parts such as front beams or licence plate carriers, which likewise feature cross-ribbing on their rear sections to enhance rigidity. Figure 8 displays the dimensions of the parts, which measure 60 mm in length, 20 mm in width, and 8 mm in height. On the one hand, the testability with standard tools in testing machines is ensured due to the relatively small dimensions, whereas, on the other hand, higher strain rates can be attained at moderate test speeds.

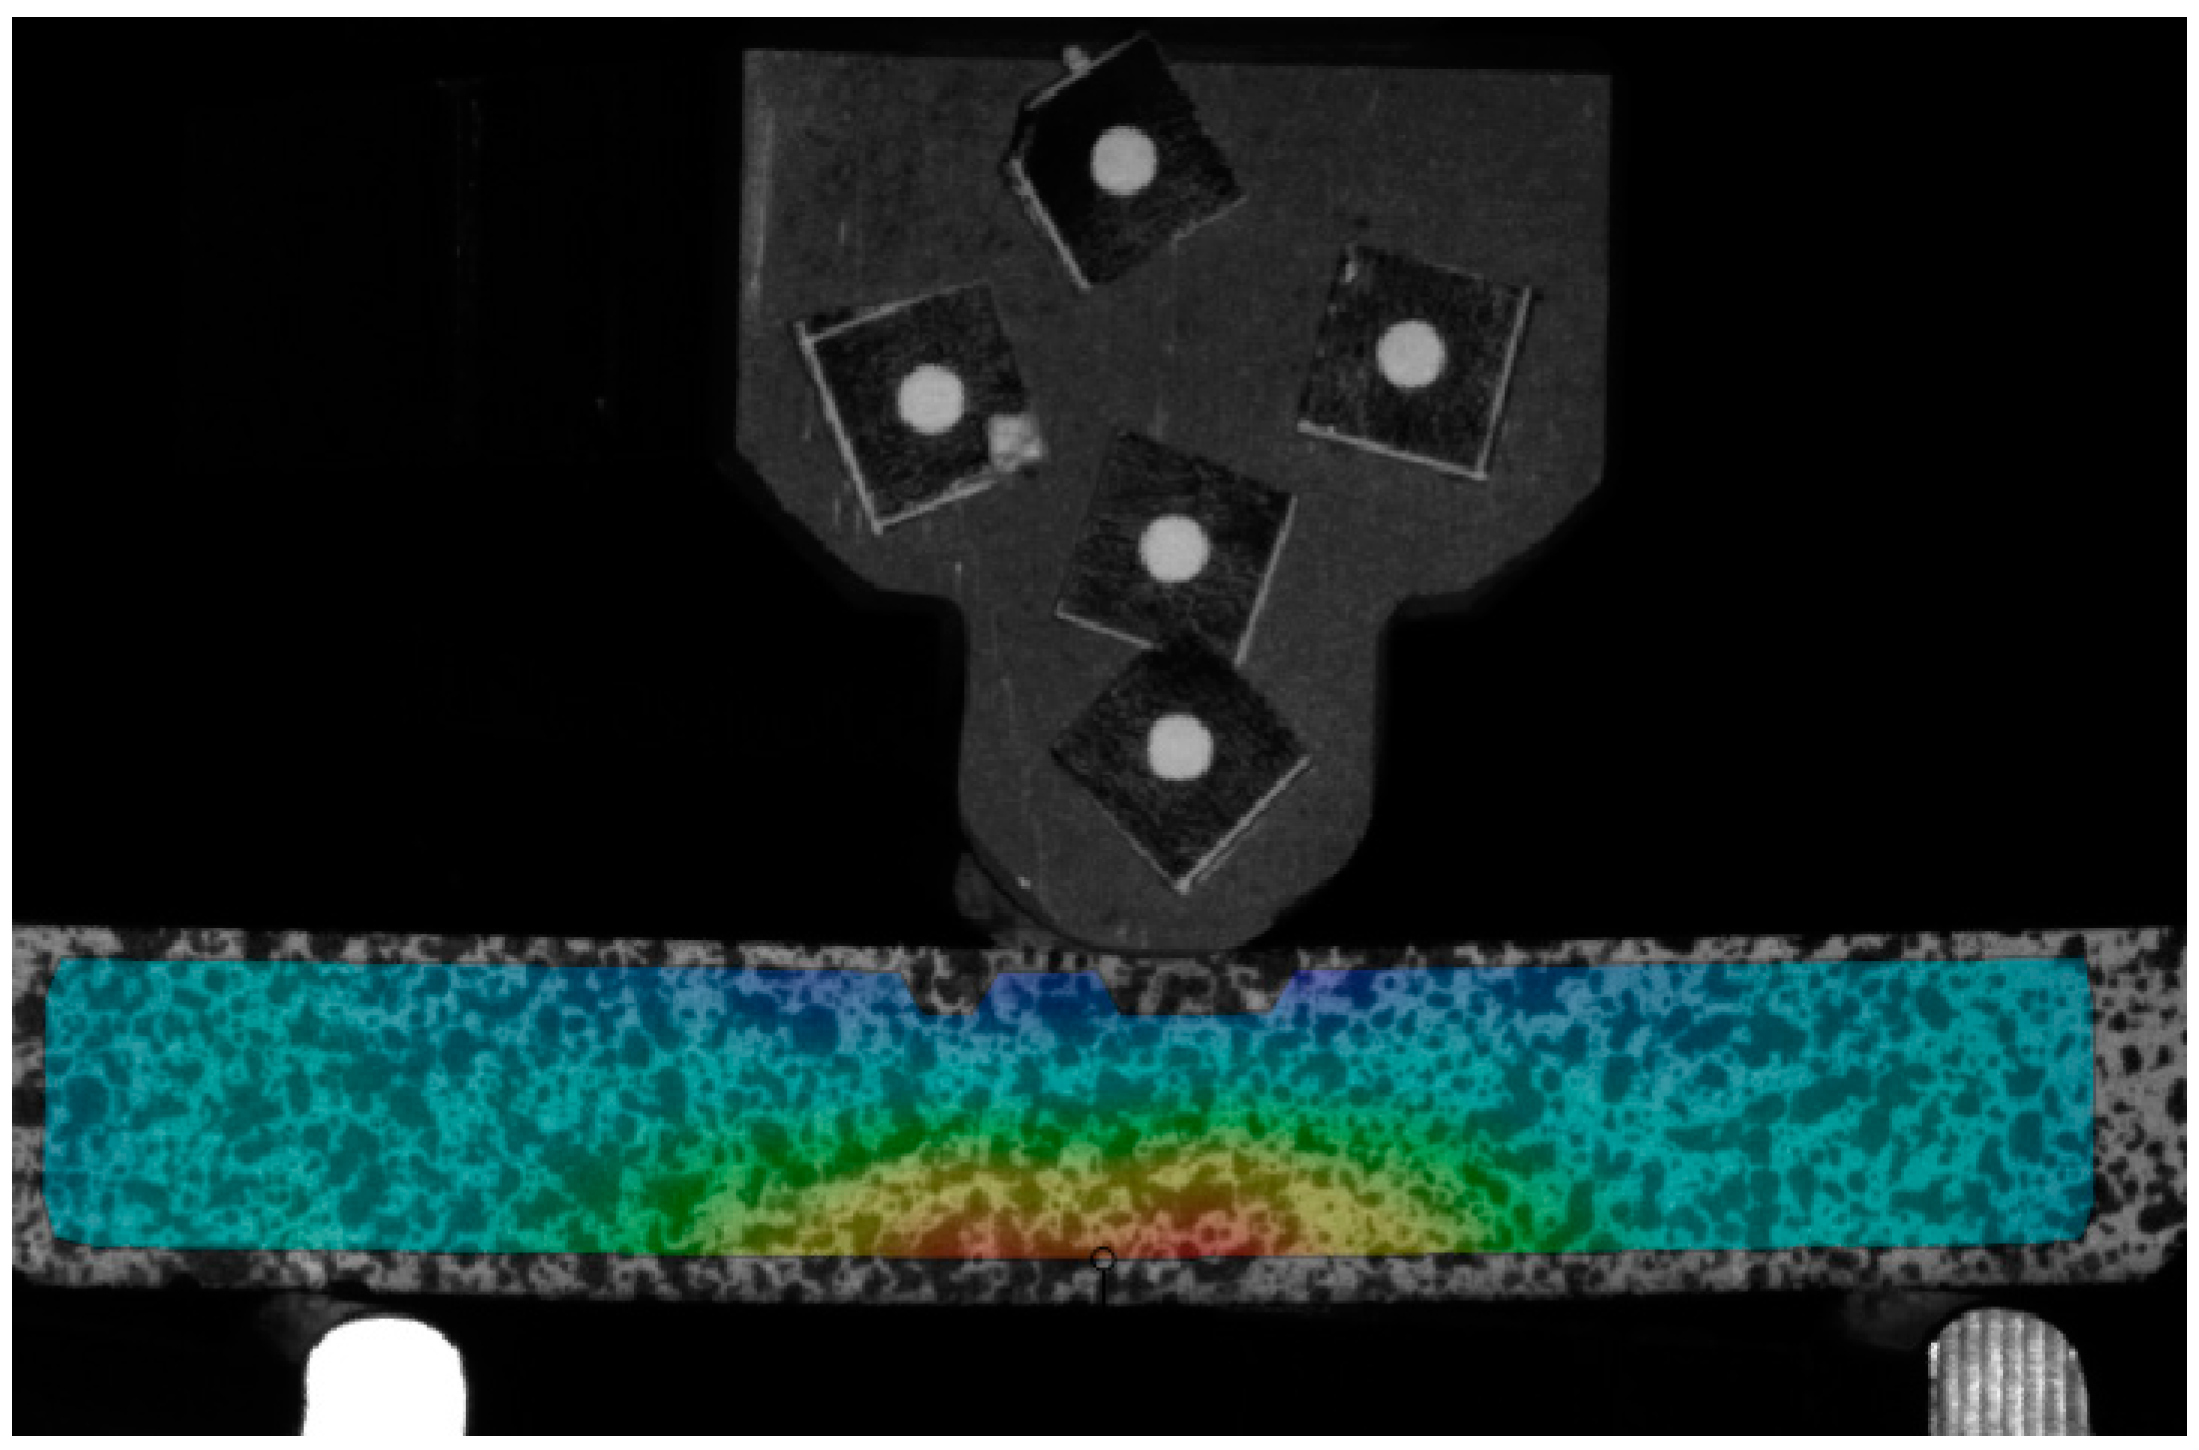
2.3. Experimental Methods

All tests on the XX-Rib are carried out as 3-point bending tests. The test setup is sketched in Figure 9: the XX-Rib is placed symmetrically on the supports with a radius of 2 mm and an inner distance of 33 mm. A bending fin with a radius of 5 mm penetrates the beam centrally from above. The force and depth of the bending fin’s penetration are measured.
The necessary experiments for the validation can be divided into cyclic and high-velocity tests. The tests to be carried out first on new samples provide information about the stiffness and strength of the short fibre-reinforced plastic components and are thus an essential basis for the following cyclic and pre-damaged experiments.
By linking the cyclic tests with the subsequent penetration test, the performance of a mechanically aged model is investigated. Based on the previously gained insights, non-destructive vibration tests are used to generate beams with deliberately induced pre-damage, which are then penetrated with elevated velocity for their remaining stiffness and residual strength. The cross-ribbed beam in the three-point bending test is loaded with a cyclic-repetitive force of 700 N at a load ratio of 0.1 and a frequency of 4 Hz in the service load case. This frequency ensures that no over proportional heating of the specimen occurs and is often found to be used in similar studies [40]. For the evaluation, Digital Image Correlation (DIC) is used [41,42,43]. An image of the DIC evaluation is shown in Figure 10, where the penetration depth of the bending fin is determined by tracking dot marks. By analysing the speckle pattern on the front of the sample, the longitudinal strain of the sample is also determined, with compression on the top and elongation on the bottom.
Both the longitudinal strain and the penetration depth are proportional to the bending stiffness of the sample. Damage can be inferred from the change in these values over the duration of the test. This is described in Equation (6) via the elongation on the lower part of the specimen.
D n = 1 ε 0 1 ε n 1 ε 0 1 ε f

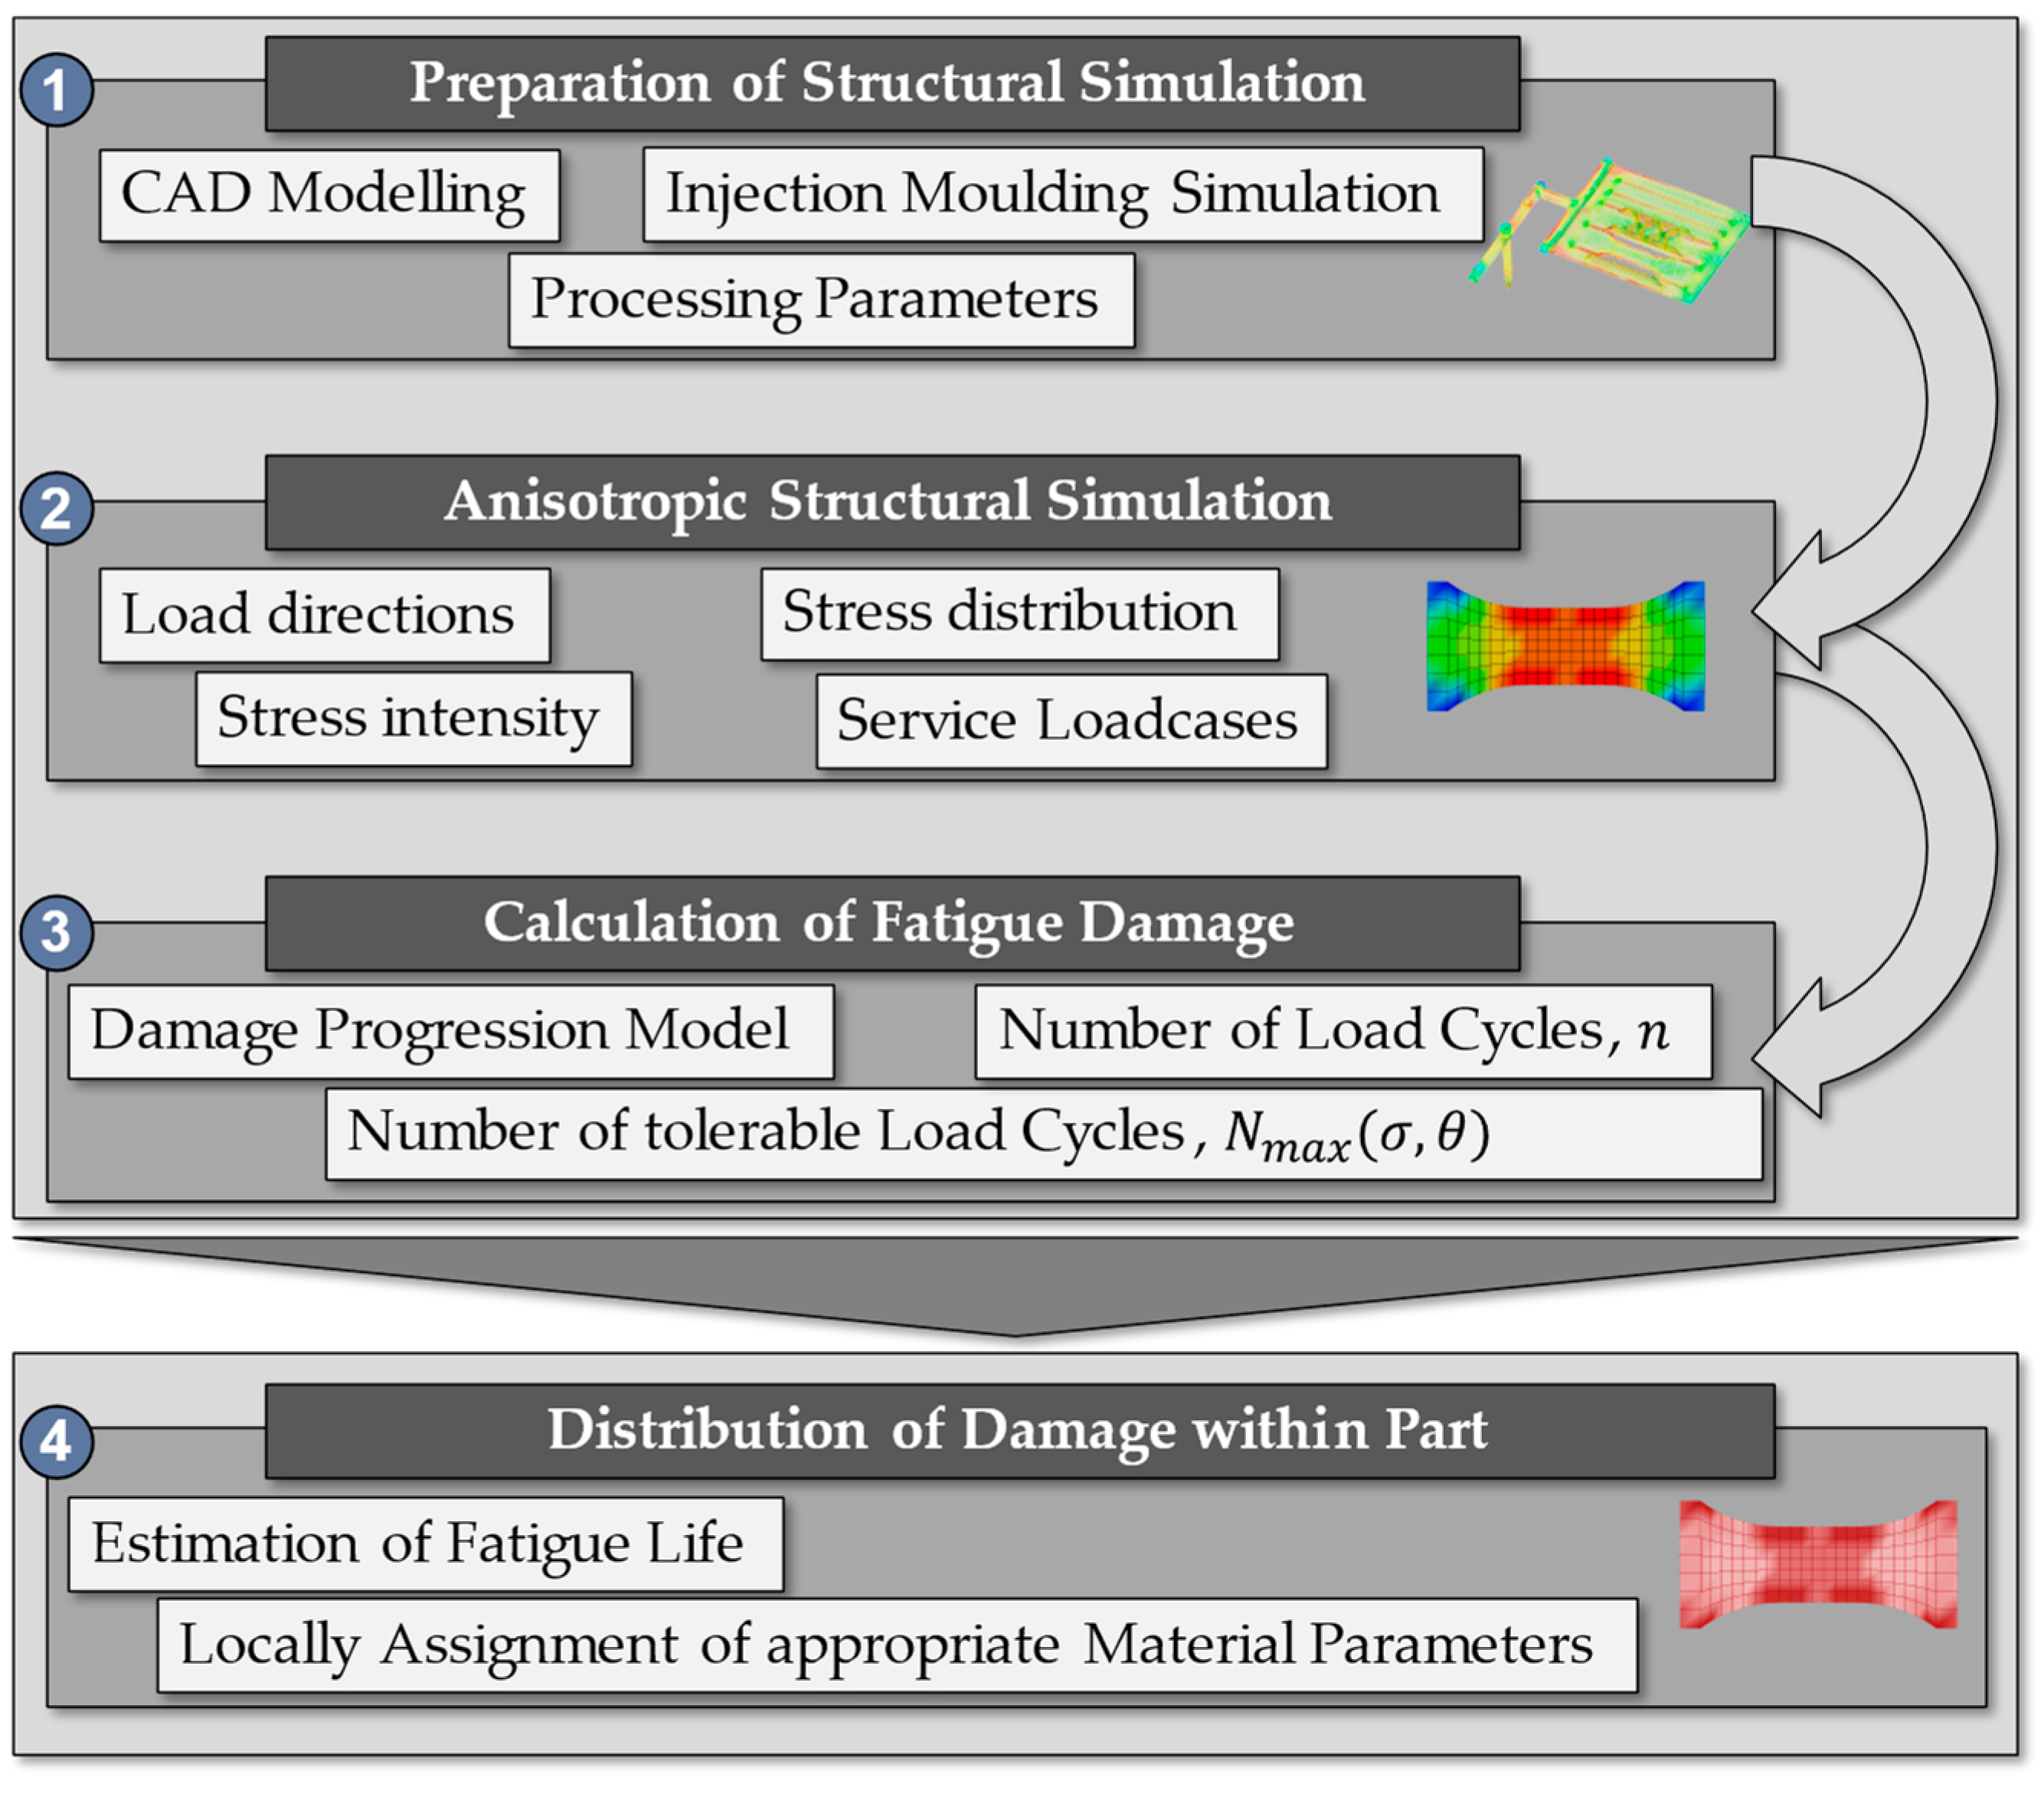
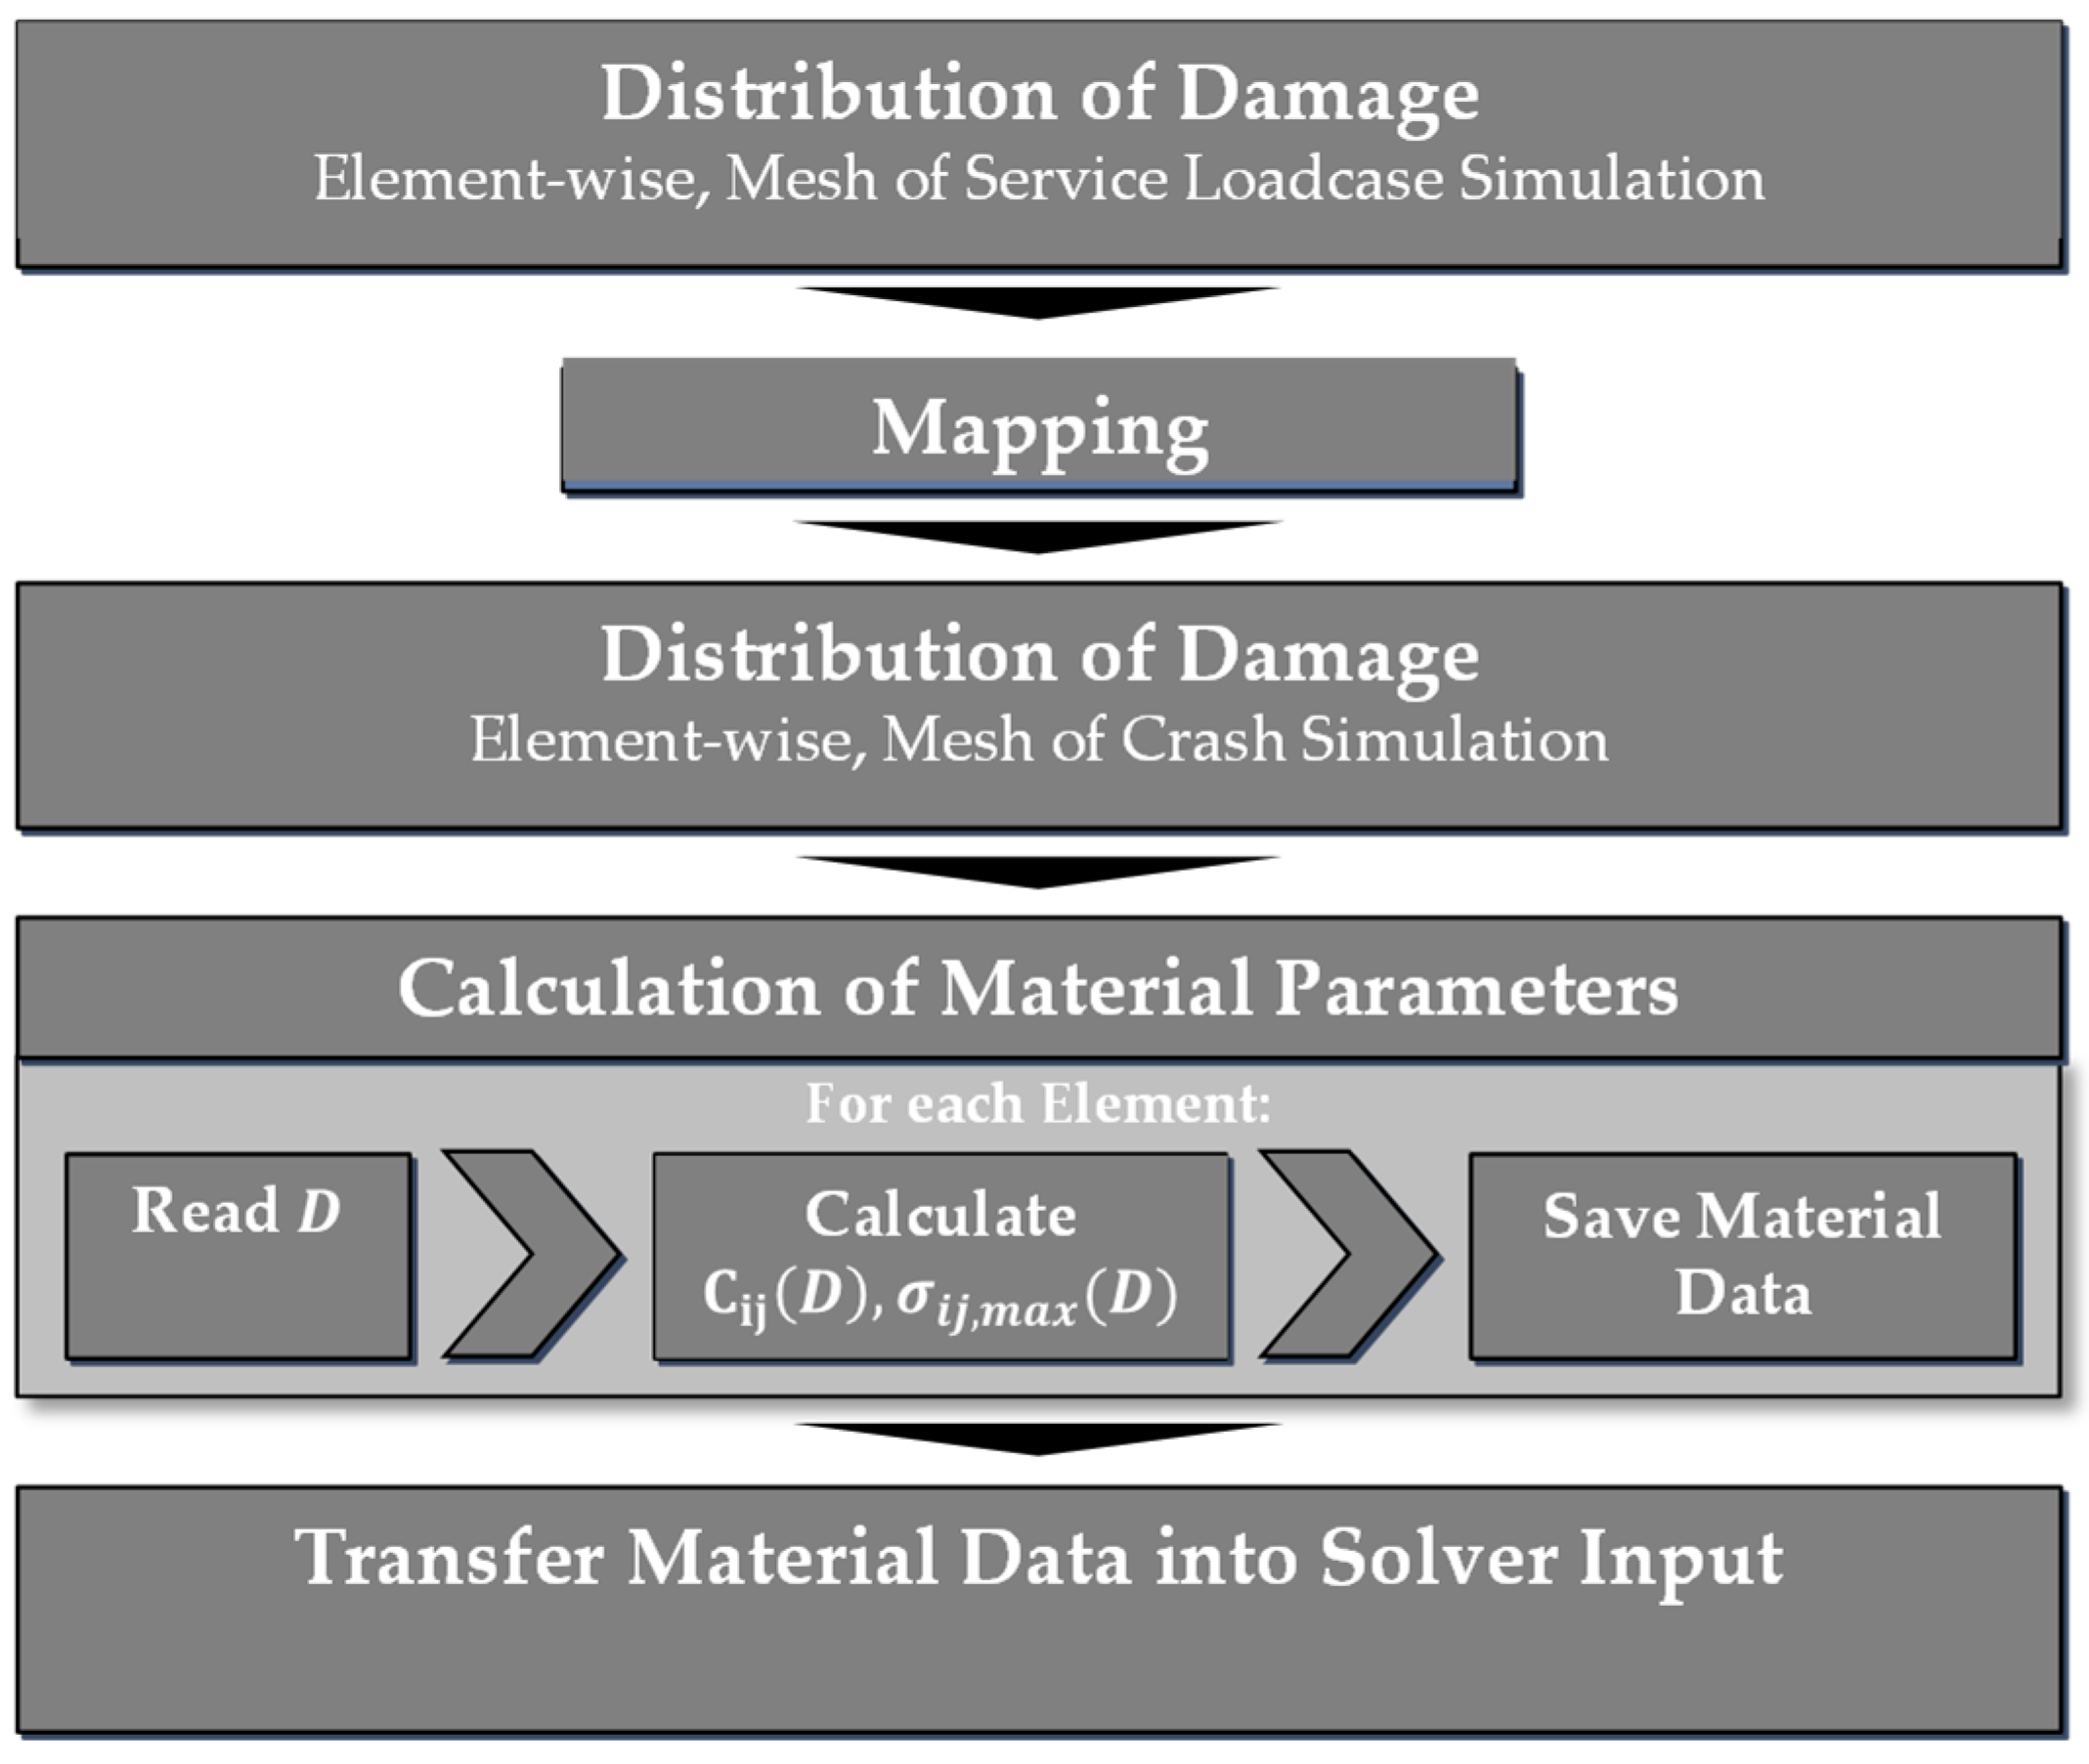
2.4. Simulation Approach

The simulations used are carried out in the software LS-DYNA R11.1.0. An attempt is made to describe the model structure as generally as possible, but certain fixed terms are designated programme specifically.
The simulation model of the 3-point bending test is shown in Figure 11. It models the steel supports as well as the bending fin by thin-walled rigid bodies with the corresponding radii. The cross-ribbed beam is finely meshed with shell elements of edge length 0.3 mm, whose element orientation is adapted to the results of the injection moulding simulation. The fineness of the mesh was determined in previous studies and checked for detrimental effects such as singularities.
The material model used is *MAT_157, an anisotropic elastic–plastic material model with consideration of strain rate dependence and anisotropic failure. Its formulation of plasticity follows Hill’s approaches, and the Tsai–Hill model is used as the failure criterion. Depending on the local fibre orientation tensor, which is obtained from the previously performed injection moulding simulation, locally different material characteristics are assigned. After calculating a fatigue damage from the service load case, the material behaviour can be adapted locally again via this interface in the same way, this time as a dependency of the prevailing damage parameter D.
In the case of the service load, the problem is solved implicitly, and the stress state for each element of the component is exported to be used in the following damage calculation according to the presented approach.
For the destructive penetration test, whether without or with consideration of the introduced damage, the simulation must be solved explicitly. This is necessary simply because of the implementation of the failure and the resulting deletion of elements, which would otherwise cause instabilities in the implicit case. In the following, the material parameters used in simulation are stated. Equation (7) shows the tensor of elasticity, and Equation (8) the plastic parameters yield stress and Lankford values used in the Hill plasticity model.
C i j = 9547 3110 3110 3110 5851 2756 3110 2756 5851 0 0 0 0 0 0 0 0 0 0 0 0 0 0 0 0 0 0 3531 0 0 0 1000 0 0 0 1000   MPa
σ y , 0 = 81.6   MPa ,   R 00 = 0.477 ,   R 45 = 0.204 ,   R 90 = 0.180

3. Results

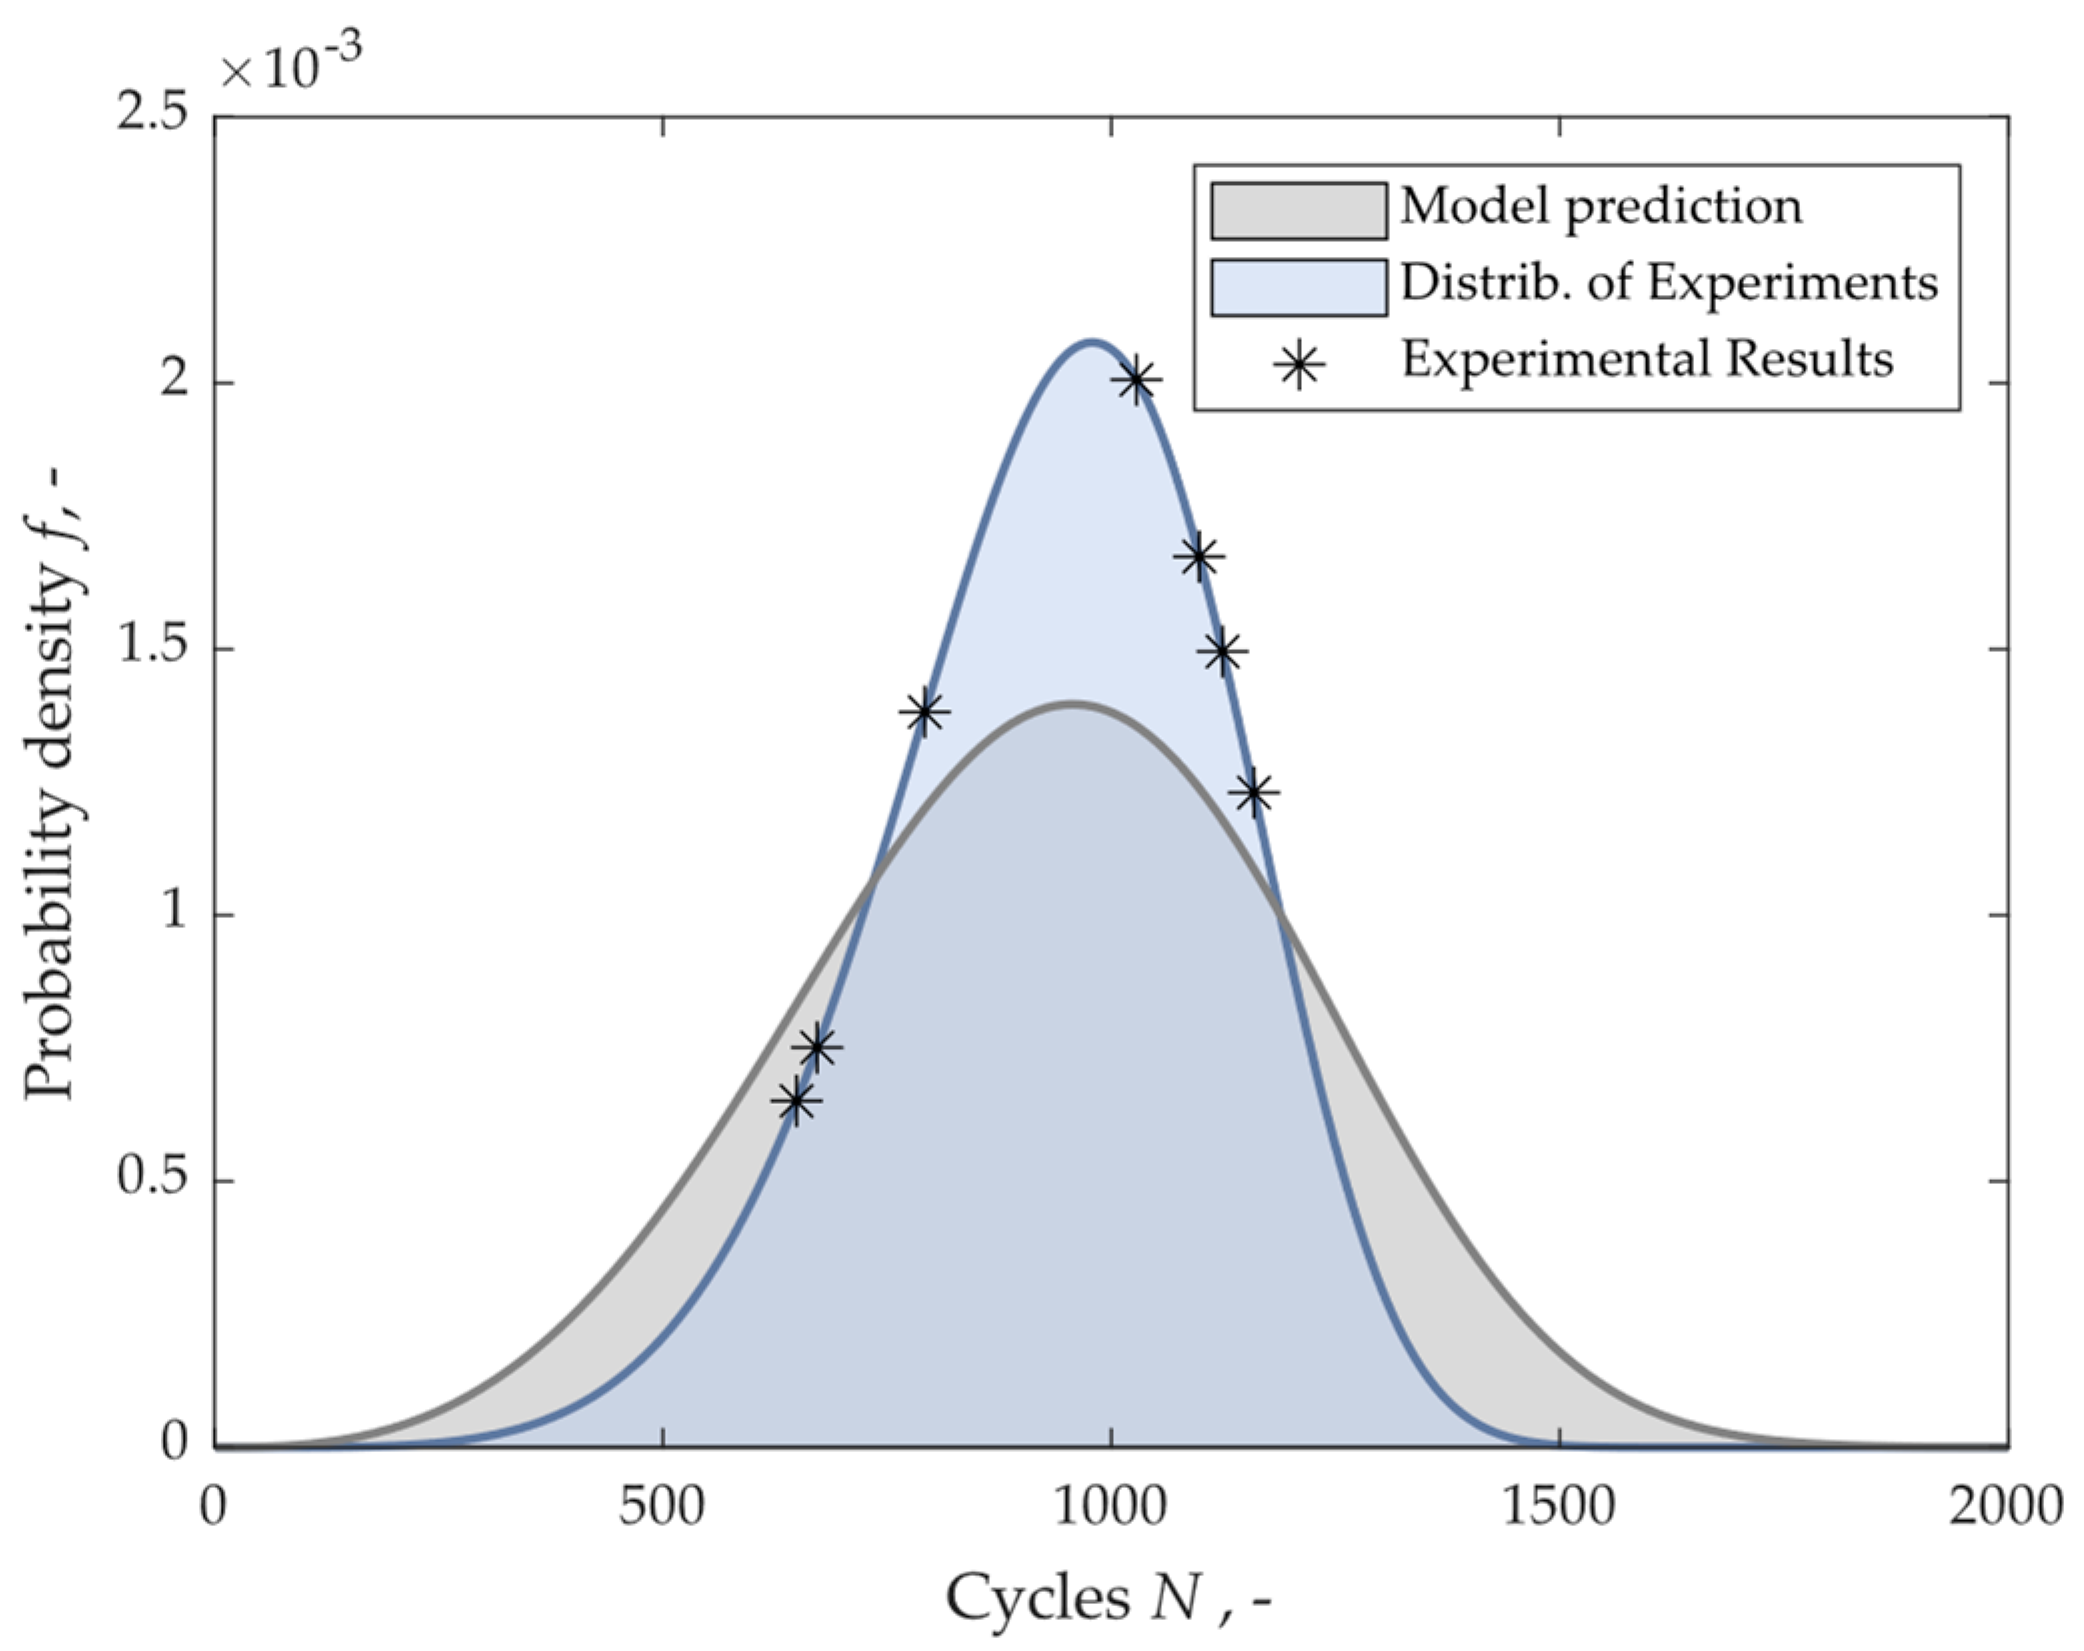
3.1. Validation of Fatigue Life Prediction

To validate the prediction of the fatigue life, on the one hand, the simulation of the service load case is considered, from whose calculated stress state a prediction of the cycles to failure is made. On the other hand, there are repeated measurements in cyclic tests that are carried out until the component fails. Both cases result in numbers of cycles that lie within a certain scattering range and which are to be compared in a suitable manner.
Table 1 displays the number of cycles the tested XX-Rib beams endured, and they range from 649 to 1159.
Based on the simulation model, the corresponding vibration cycle numbers are predicted with the help of the characteristic values for the failure probabilities 10%, 50%, and 90%. This results in a corresponding range, which is shown in Table 2. To enable a comparison between the simulatively and experimentally determined range, the corresponding failure probabilities are also calculated from the experimental values. The values, along with the relative error, are displayed in Table 2.
The distribution of the measured and predicted variables is shown in Figure 12, where the measured values for the listed probabilities of failure are entered as points. It can be seen that the model prediction predicts a wider scatter range. The probability density function is derived from the calibration of a Weibull distribution [44,45], which is very common in the modelling of cyclic tests and is used there as the distribution. All measured values lie within the prediction range of the model. It is worth mentioning here that the area under the graphs of the probability density functions is 1 in each case, therefore a wider prediction range results in a lower peak value of the probability density. Based on the described agreement between measurement and model prediction, the calculation of the maximum tolerable cycles can be considered valid. It is the basis for the following damage calculation.

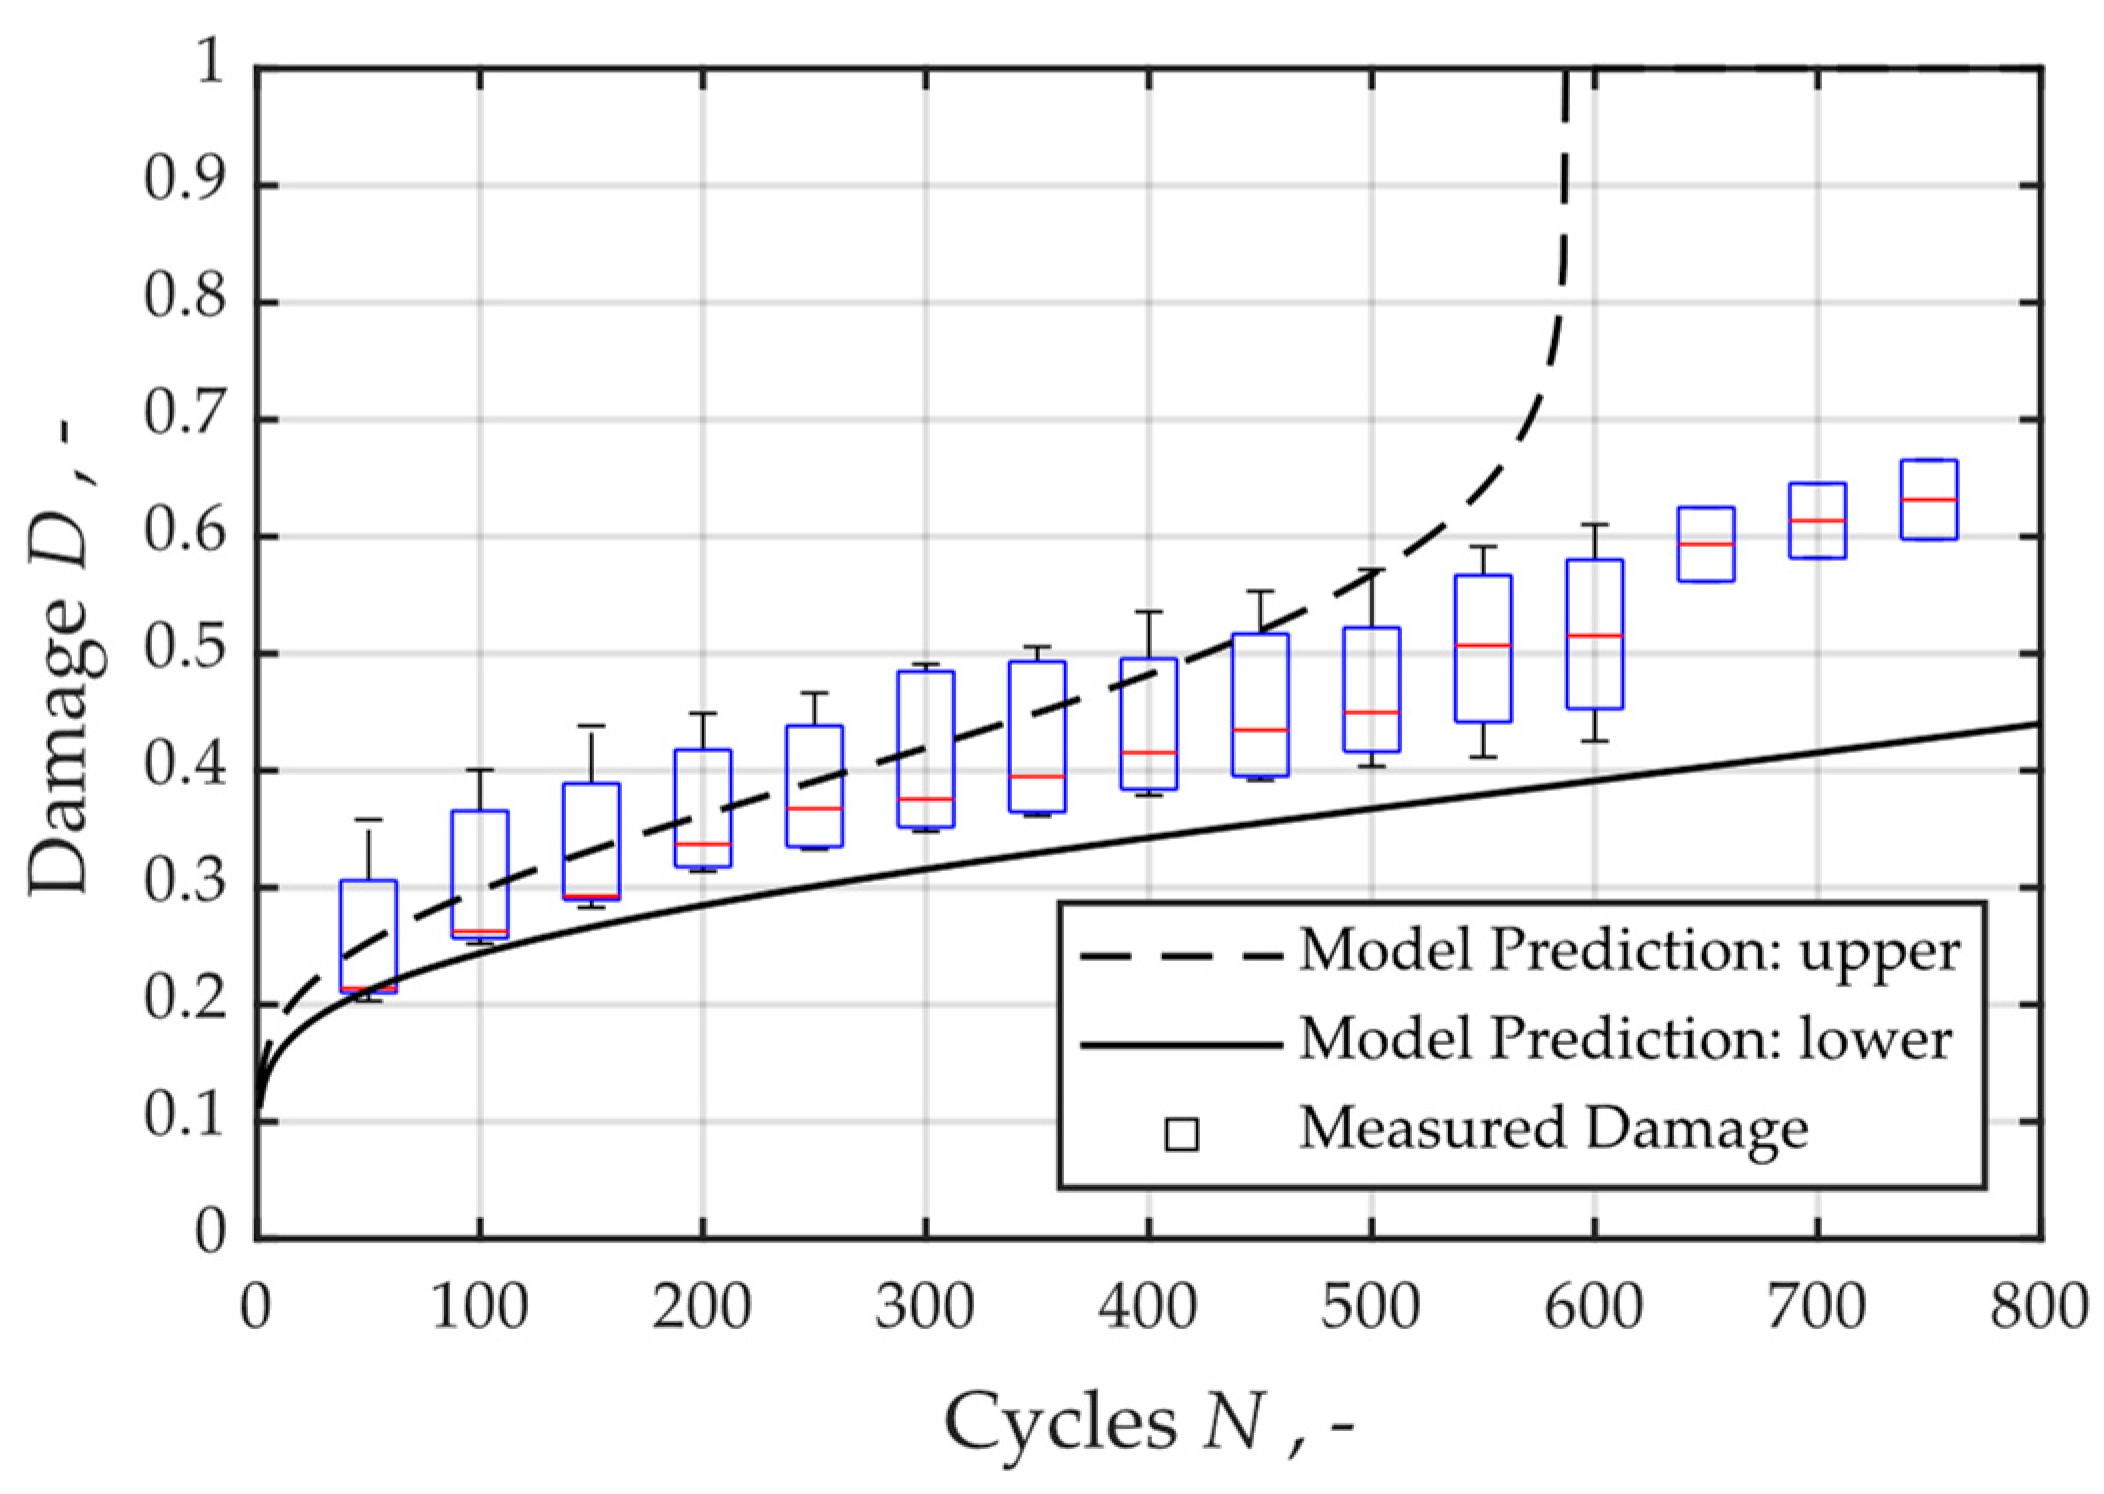
3.2. Validation of Damage Progression

To validate the increase in damage and to produce pre-damaged samples, the service load case is repeated with defined numbers of cycles. The resulting damage in the component from measurement and model prediction is compared with each other. The value of the edge fibre strain from the optical strain measurement is used to measure the damage in the experiment, which increases over the duration of the stress, i.e., with progressive loss of stiffness.
A good indicator of the loss of stiffness can be seen in Figure 13. It shows how the indentation of the bending fin increases over the test time despite the constant force limits of −70 N and −700 N.
The damage determined in the test is compared with the model prediction for D5 (upper line) and D95 (lower line) in Figure 14. The measured damage is shown in the form of boxplots at intervals of 50 oscillations, with the extrema of the measured values entered as whiskers. The median of each measurement is shown as a red line. It lies between the limits of the model prediction for all considered numbers of oscillations.
Scatter values of the measured damage that go beyond the upper limit of the model prediction are found in the range up to 350 cycles. In general, the scatter of the measured damage at the component level is larger than was the case with the previously considered tension rods. However, due to the complete agreement of the medians of the measurements with the calculated prediction, the prediction quality is assumed to be sufficiently good. The specimens damaged in this way are used for the subsequent destructive penetration tests.

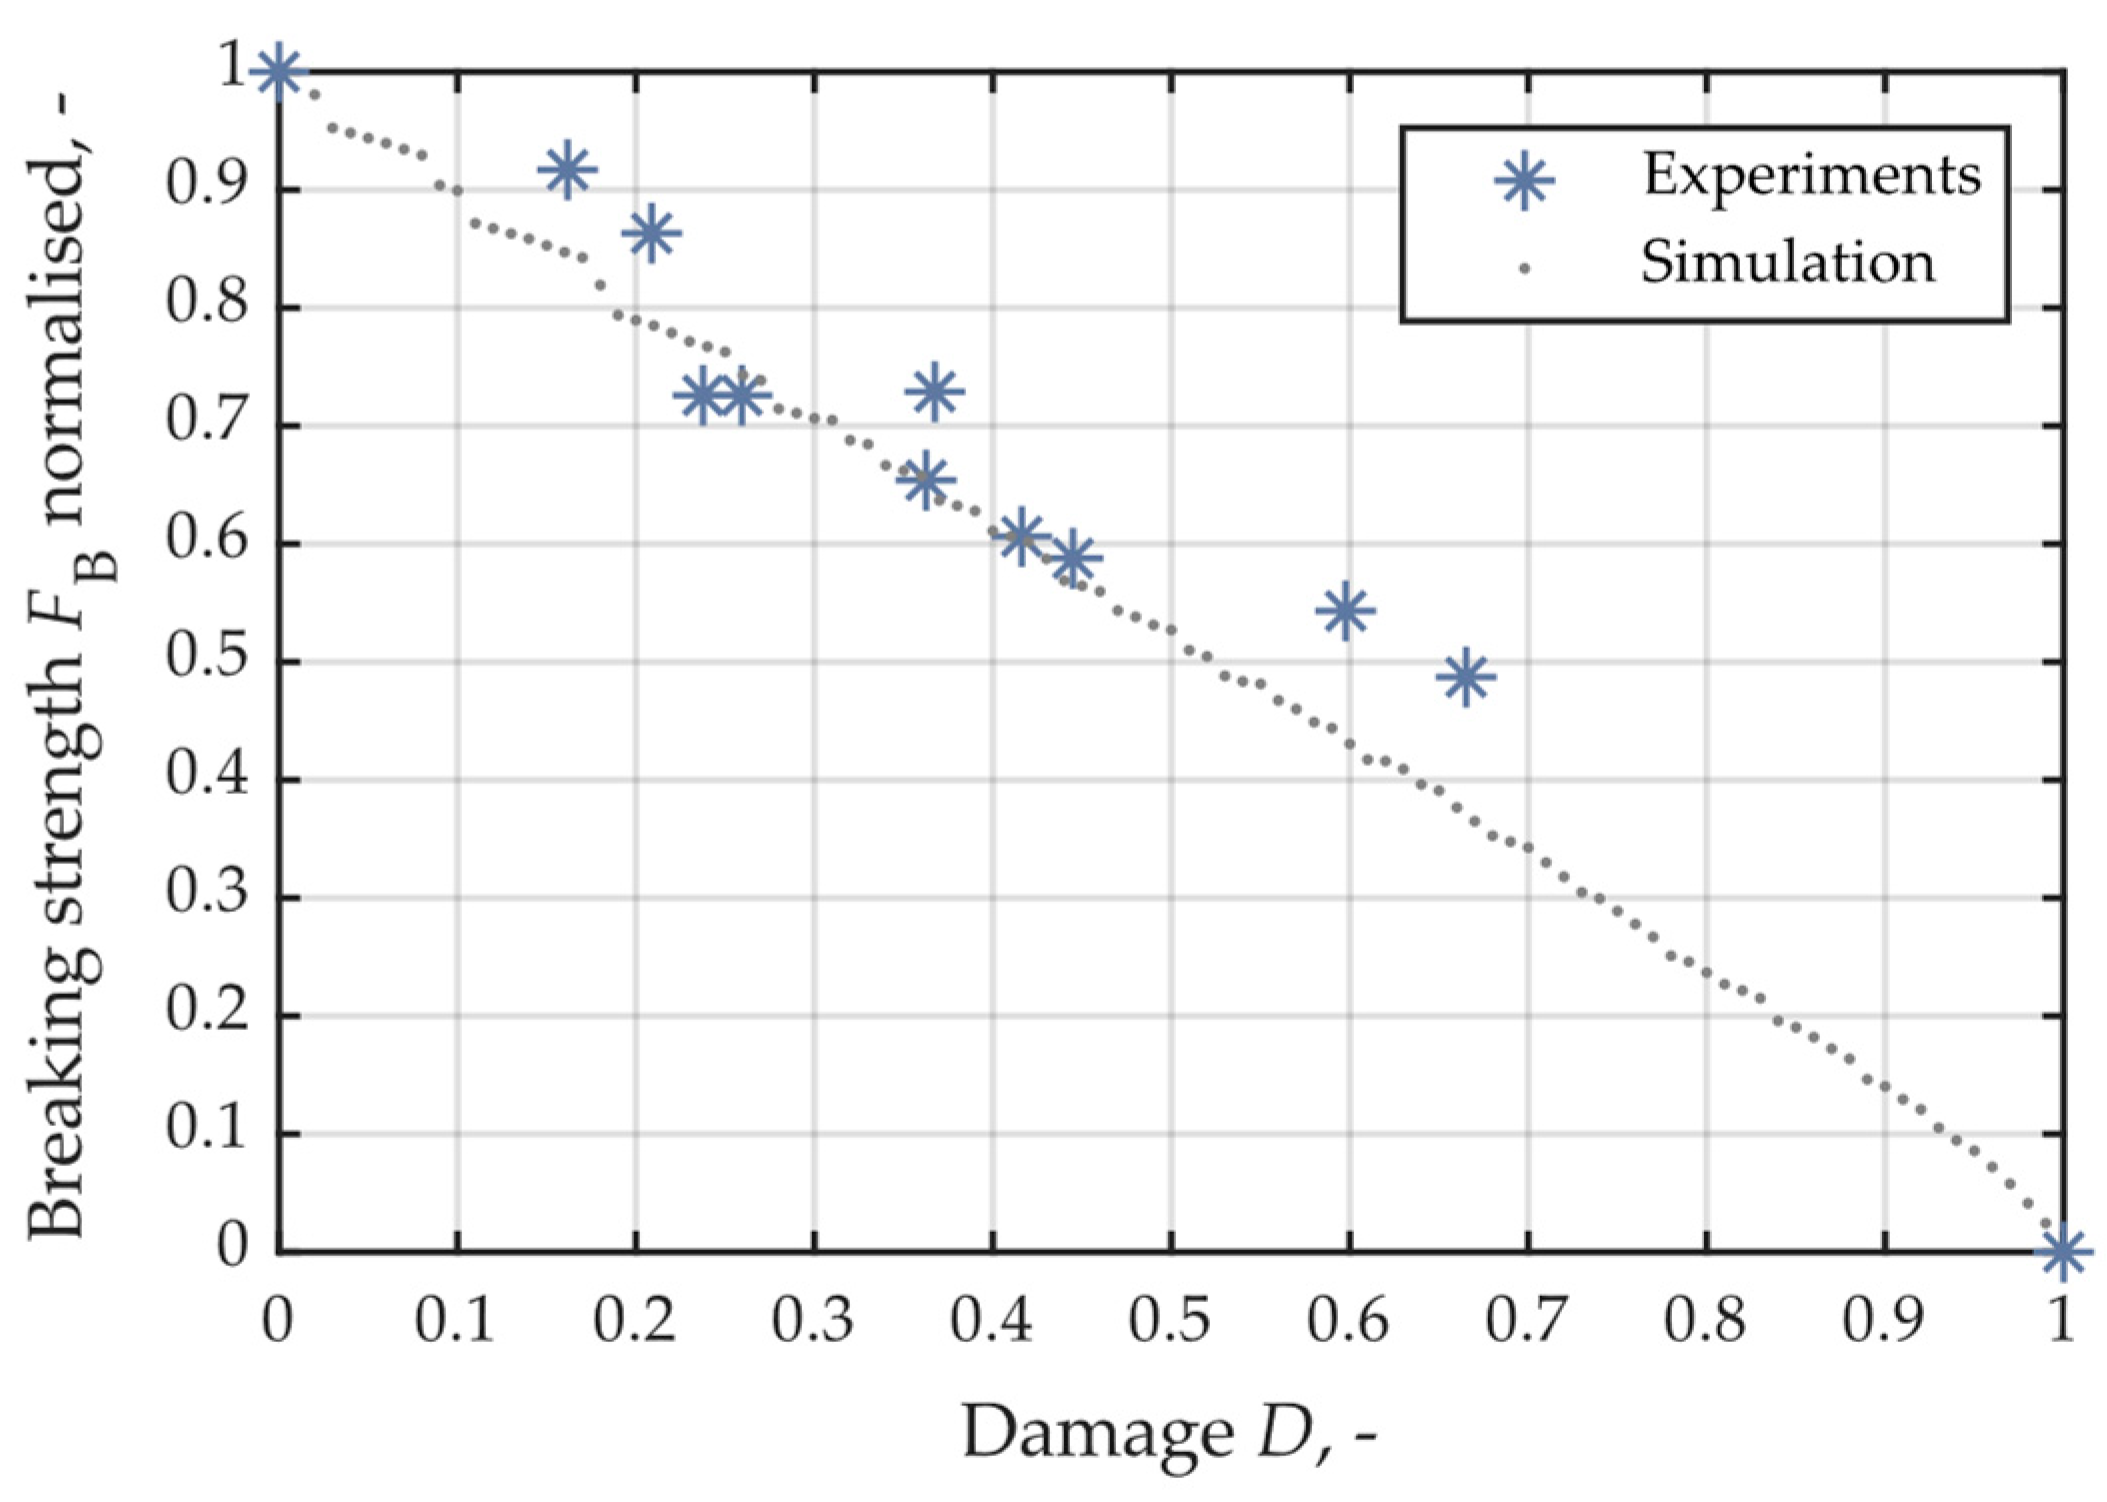
3.3. Validation of Bending Strength Prediction

To complete the scenario of an abrupt overload case after previous cyclic loading, the pre-damaged cross-rib beams are destroyed in a three-point bending test and the endured breaking force is determined-analogously; corresponding results are obtained from the simulation. In Figure 15, the determined normalised breaking forces are plotted against the damage; the expected trend in lower bearable forces with increasing damage is recognisable for both the experimentally and numerically determined results. All measured breaking forces are related to the average breaking force of an undamaged, virgin XXRib. This results in a value range that lies between 0 and 1. The results of the simulation model were calculated parametrically in steps of D = 0.02.
Similarly, all numerical values of the results from experiment and simulation are printed in Table 3 and compared with each other with regard to their relative deviation. It can be clearly seen that the error for damage values above 0.60 is too large; the model no longer seems useful here. Below that, only one sample, with D = 0.37, shows a strikingly higher damage. Otherwise, the deviations are in a pleasingly low range.
As has already been published for the investigations on tension rods [37], it also makes sense at the component level to draw a model limit at damage values of D = 0.50. For damage above this value, no reliable statement can be made. No reliable statement can be made for damage above this value. This is also due to the fact that unstable behaviour begins in areas of damage above these values, which will inevitably end with the destruction of the component. These high damage areas must therefore be avoided by suitable component design anyway. Therefore, the restriction of the model to damage values below 0.50 can be well accepted.

4. Estimation of the Modelling Approach and Conclusions

The presented approach of considering the damage caused by repeated service loads in the subsequent crash simulation was examined for its performance in this chapter. For this purpose, cross-ribbed beams were used as test specimens in order to increase the geometric complexity compared to the previously considered tension rods. The described scenario of a payload case with a subsequent overload was simulated: The cross-ribbed beams were first subjected to cyclic loading in three-point bending tests, and the model predictions were checked with regard to the maximum tolerable number of oscillations and the increase in damage. Subsequently, the remaining fracture force of pre-damaged specimens was compared in simulation and testing.
The prediction quality of the maximum tolerable number of oscillations can be considered validated for the given boundary conditions. The values actually achieved in the experiment show good agreement with the model predictions, whereby the failure of the component was equated to the failure of the first, most highly stressed element. The bending in the component results in a compressive stress on the upper side and a tensile stress on the lower side, whereby the tensile component is generally relevant for plastics. This means that the characteristic values previously determined on tensile specimens are ideally suited for the prediction.
The damage increment in the cross-rib beam was measured as loss of bending stiffness by optical measurement of both bending fin penetration and strain. On the part of the model, a damage interval is predicted that takes into account the dispersion of the yieldable vibration cycles, i.e., the occurrence of “strong” and “weak” specimens. It can be stated that the lower limit of the damage model is observed in all cases considered. The upper prediction limit is partially exceeded in the case of low oscillating play numbers. The medians of all observations lie within the model predictions, so that the predictive ability is accepted as sufficient. In general, a larger scatter can be observed in the case of the cross-ribbed beams than was the case with the tension rods.
The prediction of the fracture force of pre-damaged cross-rib specimens can be considered good in large parts. For the evaluation, scalar values of the maximum force and bending stiffness from experiment and simulation were compared. For all measured cases below a damage of D = 0.6, the acceptance criterion could be fulfilled, and a good agreement between simulation and experimental measurement could be established. For higher damage values, the prediction quality is only insufficient. The same was found earlier when considering the tension rods. The proposed model limit for damage up to D = 0.5 is therefore retained.
To classify this model limit, the non-linear damage growth of short fibre-reinforced thermoplastics should be recalled: a rapid initial damage is followed by a longer period of constant growth, which is followed by a phase of strong and unstable damage increase until final failure. This last phase of unstable growth also sets in damage values of the order D = 0.5. The range should not be reached by service load cases due to its proximity to component failure; suitable component dimensioning avoids this. Accordingly, a limitation of the modelling approaches presented in this paper to damage values below the critical growth appears to be justifiable.
It can be noted that our approach, which we have developed and evaluated so far at the level of coupon tests, also achieves very good results at the component level. In the future, it will become increasingly important to verify the usefulness and necessity of the presented approach for further material classes within the family of composites. A first indication that harmful influences of fatigue damage can be found not only in short but also in long fibre-reinforced materials could be found in [46] already. Further investigations, for example, into continuous fibre-reinforced plastics, are a logical consequence. Here, the considerably more pronounced anisotropy of the material can lead to significantly more direction-dependent effects, which may require the use of a tensor-valued damage parameter. Further challenges may lie in taking into account other parameters that influence the ageing of material, such as humidity and temperature.

Author Contributions

Conceptualization, C.W.; methodology, C.W.; software, C.W.; validation, C.W.; formal analysis, C.W.; investigation, C.W.; resources, C.W.; data curation, C.W.; writing—original draft preparation, C.W.; writing—review and editing, S.W.; visualization, C.W.; supervision, S.W.; project administration, S.W.; funding acquisition, S.W. All authors have read and agreed to the published version of the manuscript.

Funding

The testing equipment used in this research was funded by the German Research Foundation under grant number INST 90/1024-1 FUGG.

Data Availability Statement

The data presented in this study are available in the article.

Acknowledgments

The authors thankfully acknowledge the company 4a engineering, especially Peter Reithofer, for providing the sample material, as well as Marcel Sauer for his valuable work during his thesis.

Conflicts of Interest

The authors declare no conflict of interest.

References

  1. Krivachy, R.; Riedel, W.; Weyer, S.; Thoma, K. Characterisation and modelling of short fibre reinforced polymers for numerical simulation of a crash. Int. J. Crashworthiness 2008, 13, 559–566. [Google Scholar] [CrossRef]
  2. Pickett, A.K.; Haug, E.; Rückert, J. A fracture damaging law suitable for anisotropic short fibre/matrix materials in an explicit finite element code. Composites 1990, 21, 297–304. [Google Scholar] [CrossRef]
  3. Guster, C.; Pinter, G.; Mösenbacher, A.; Eichlseder, W. Evaluation of a Simulation Process for Fatigue Life Calculation of Short Fibre Reinforced Plastic Components. Procedia Eng. 2011, 10, 2104–2109. [Google Scholar] [CrossRef]
  4. Sayers, C.M. Elastic anisotropy of short-fibre reinforced composites. Int. J. Solids Struct. 1992, 29, 2933–2944. [Google Scholar] [CrossRef]
  5. Kamber, P.; Murri, R.; Gerster, B. Crashtest Gebrauchter Fahrzeuge Mit Airbag; Dynamic Test Center: Vauffelin, Switzerland, 2005; pp. 1–30. [Google Scholar]
  6. VDI 2223:2004-01; Systematic Embodiment Design of Technical Products. Beuth: Berlin, Germany, 2004.
  7. Polzer, M.; Bartz, M.; Rothammer, B.; Schulz, E.; Wartzack, S. Tribological behavior of different doped ta-C coatings for slip-rolling contacts with high hertzian contact pressure. Ind. Lubr. Tribol. 2023, 75, 748–757. [Google Scholar] [CrossRef]
  8. Jackson, K.E.; Fasanella, E.L.; Lyle, K.H. Crash Certification by Analysis—Are We There Yet? In Proceedings of the 57th American Helicopter Society International Annual Forum, Washington, DC, USA, 5 September–5 November 2001; American Helicopter Society: Alexandria, WA, USA, 2011; pp. 549–562. [Google Scholar]
  9. Schoßig, M.; Bierögel, C.; Grellmann, W.; Mecklenburg, T. Mechanical behavior of glass-fiber reinforced thermoplastic materials under high strain rates. Polym. Test. 2008, 27, 893–900. [Google Scholar] [CrossRef]
  10. Schmachtenberg, E.; Brandt, M. Mechanical Design of Injection Moulded Parts made of Short-Fibre Reinforced Thermoplastics by Means of Integrative Simulation. J. Polym. Eng. 2006, 26, 179–196. [Google Scholar] [CrossRef]
  11. Azzi, V.D.; Tsai, S.W. Anisotropic strength of composites. Exp. Mech. 1965, 5, 283–288. [Google Scholar] [CrossRef]
  12. Liebold, C.; Erhart, A.; Haufe, A. The Significance of the Production Process of FRP Parts for the Performance in Crashworthiness. In Proceedings of the 14th International LS-DYNA Users Conference, Dearborn, MI, USA, 12–14 June 2016. [Google Scholar]
  13. Gu, G.; Xia, Y.; Lin, C.-h.; Lin, S.; Meng, Y.; Zhou, Q. Experimental study on characterizing damage behavior of thermoplastics. Mater. Des. 2013, 44, 199–207. [Google Scholar] [CrossRef]
  14. Horst, J.J.; Spoormaker, J.L. Mechanisms of fatigue in short glass fiber reinforced polyamide 6. Polym. Eng. Sci. 1996, 36, 2718–2726. [Google Scholar] [CrossRef]
  15. Wu, X.-F.; Zholobko, O. Experimental Study of the Probabilistic Fatigue Residual Strength of a Carbon Fiber-Reinforced Polymer Matrix Composite. J. Compos. Sci. 2020, 4, 173. [Google Scholar] [CrossRef]
  16. Witzgall, C.; Wartzack, S. Experimental and simulative assessment of crashworthiness of mechanically aged shortfibre reinforced thermoplastics. In Proceedings of the 21st International Conference on Engineering Design (ICED 17), Vancouver, BC, Canada, 21–25 August 2017; pp. 279–287. [Google Scholar]
  17. D’Amore, A.; Grassia, L. Constitutive law describing the strength degradation kinetics of fibre-reinforced composites subjected to constant amplitude cyclic loading. Mech. Time-Depend. Mater. 2016, 20, 1–12. [Google Scholar] [CrossRef]
  18. Yang, J.N. Fatigue and Residual Strength Degradation for Graphite/Epoxy Composites Under Tension-Compression Cyclic Loadings. J. Compos. Mater. 1978, 12, 19–39. [Google Scholar] [CrossRef]
  19. Mortazavian, S.; Fatemi, A. Fatigue behavior and modeling of short fiber reinforced polymer composites including anisotropy and temperature effects. Int. J. Fatigue 2015, 77, 12–27. [Google Scholar] [CrossRef]
  20. Mortazavian, S.; Fatemi, A. Fatigue behavior and modeling of short fiber reinforced polymer composites: A literature review. Int. J. Fatigue 2015, 70, 297–321. [Google Scholar] [CrossRef]
  21. Mao, H.; Mahadevan, S. Fatigue damage modelling of composite materials. Compos. Struct. 2002, 58, 405–410. [Google Scholar] [CrossRef]
  22. van Paepegem, W.; Degrieck, J. A new coupled approach of residual stiffness and strength for fatigue of fibre-reinforced composites. Int. J. Fatigue 2002, 24, 747–762. [Google Scholar] [CrossRef]
  23. van Paepegem, W.; Degrieck, J. Coupled residual stiffness and strength model for fatigue of fibre-reinforced composite materials. Compos. Sci. Technol. 2002, 62, 687–696. [Google Scholar] [CrossRef]
  24. Shokrieh, M.M.; Lessard, L.B. Progressive Fatigue Damage Modeling of Composite Materials, Part I: Modeling. J. Compos. Mater. 2000, 34, 1056–1080. [Google Scholar] [CrossRef]
  25. Shokrieh, M.M.; Lessard, L.B. Progressive Fatigue Damage Modeling of Composite Materials, Part II: Material Characterization and Model Verification. J. Compos. Mater. 2000, 34, 1081–1116. [Google Scholar] [CrossRef]
  26. van Paepegem, W.; Degrieck, J. Effects of Load Sequence and Block Loading on the Fatigue Response of Fiber-Reinforced Composites. Mech. Adv. Mater. Struct. 2002, 9, 19–35. [Google Scholar] [CrossRef]
  27. van Paepegem, W.; Degrieck, J. Modelling damage and permanent strain in fibre-reinforced composites under in-plane fatigue loading. Compos. Sci. Technol. 2003, 63, 677–694. [Google Scholar] [CrossRef]
  28. van Paepegem, W. Fatigue damage modelling of composite materials with the phenomenological residual stiffness approach. In Fatigue Life Prediction of Composites and Composite Structures; Elsevier: Amsterdam, The Netherlands, 2010; pp. 102–138. [Google Scholar]
  29. Witzgall, C.; Wartzack, S. Validation of an approach for the simulation of short fiber reinforced thermoplastics in early design phases. In Proceedings of the DFX 2015: Proceedings of the 26th Symposium Design for X, Herrsching, Germany, 7–8 October 2015; pp. 63–74. [Google Scholar]
  30. Witzgall, C.; Wartzack, S. An investigation of mechanically aged short-fiber reinforced thermoplastics under highly dynamic loads. In Proceedings of the DFX 2016: Proceedings of the 27th Symposium Design for X, Herrsching, Germany, 5–6 October 2016; pp. 135–146. [Google Scholar]
  31. Rouchon, J. Certification of large airplane composite structures. Recent progress and new trends in compliance philosophy. ICAS Congr. Proc. 1990, 2, 1439–1447. [Google Scholar]
  32. Bernasconi, A.; Davoli, P.; Basile, A.; Filippi, A. Effect of fibre orientation on the fatigue behaviour of a short glass fibre reinforced polyamide-6. Int. J. Fatigue 2007, 29, 199–208. [Google Scholar] [CrossRef]
  33. McNally, D. Short Fiber orientation and its Effects on the Properties of Thermoplastic Composite Materials. Polym.-Plast. Technol. Eng. 1977, 8, 101–154. [Google Scholar] [CrossRef]
  34. Advani, S.G.; Tucker, C.L. The Use of Tensors to Describe and Predict Fiber Orientation in Short Fiber Composites. J. Rheol. 1987, 31, 751–784. [Google Scholar] [CrossRef]
  35. Folgar, F.; Tucker, C.L. Orientation Behavior of Fibers in Concentrated Suspensions. J. Reinf. Plast. Compos. 1984, 3, 98–119. [Google Scholar] [CrossRef]
  36. Mortazavian, S.; Fatemi, A. Effects of fiber orientation and anisotropy on tensile strength and elastic modulus of short fiber reinforced polymer composites. Compos. Part B Eng. 2015, 72, 116–129. [Google Scholar] [CrossRef]
  37. Witzgall, C.; Giolda, J.; Wartzack, S. A novel approach to incorporating previous fatigue damage into a failure model for short-fibre reinforced plastics. Int. J. Impact Eng. 2022, 18, 104155. [Google Scholar] [CrossRef]
  38. Witzgall, C.; Huber, M.; Wartzack, S. Consideration of cyclic material degradation in the crash simulation of short-fibre-reinforced thermoplastics. Konstruktion 2020, 2020, 78–82. [Google Scholar] [CrossRef]
  39. Reithofer, P.; Jilka, B.; Fertschej, A. Considering the local anisotropy—Simulation process chain for short and long fibre reinforced thermoplastics. In Proceedings of the CARHS Automotive CAE Grand Challenge, Hanau, Germany, 5–6 April 2017. [Google Scholar]
  40. Bernasconi, A.; Kulin, R.M. Effect of frequency upon fatigue strength of a short glass fiber reinforced polyamide 6: A superposition method based on cyclic creep parameters. Polym. Compos. 2009, 30, 154–161. [Google Scholar] [CrossRef]
  41. Chu, T.C.; Ranson, W.F.; Sutton, M.A.; Peters, W.H. Applications of digital-image-correlation techniques to experimental mechanics. Exp. Mech. 1985, 25, 232–244. [Google Scholar]
  42. Pan, B. Digital image correlation for surface deformation measurement: Historical developments, recent advances and future goals. Meas. Sci. Technol. 2018, 29, 82001. [Google Scholar] [CrossRef]
  43. Peters, W.H.; Ranson, W.F. Digital imaging techniques in experimental stress analysis. Opt. Eng. 1982, 21, 427–431. [Google Scholar] [CrossRef]
  44. Weibull, W. The Phenomenon of Rupture in solids. In Ingeniörsvetenskapsakademiens Handlingar; Ingeniörsvetenskapsakademiens: Stockholm, Sweden, 1939; pp. 1–55. [Google Scholar]
  45. Weibull, W. Fatigue Testing and Analysis of Results; Pergamon Press: Oxford, UK; Elsevier: Oxford, UK, 1961. [Google Scholar]
  46. Witzgall, C.; Gadinger, M.; Wartzack, S. Fatigue Behaviour and Its Effect on the Residual Strength of Long-Fibre-Reinforced Thermoplastic PP LGF30. Materials 2023, 16, 6174. [Google Scholar] [CrossRef]
Figure 1. Process chain of simulating short fibre-reinforced thermoplastics.
Applmech 04 00061 g001
Figure 2. Distribution of residual strength after different numbers of cycles.
Applmech 04 00061 g002
Figure 3. Stress–strain diagrams for virgin and damaged samples of PBT GF30.
Applmech 04 00061 g003
Figure 4. Stress-strain prediction of simulation (surface) in comparison to experimental measurements (lines).
Applmech 04 00061 g004
Figure 5. Main steps of the mfkFatiCrash method.
Applmech 04 00061 g005
Figure 6. Simulative determination of fatigue damage caused by service load cases.
Applmech 04 00061 g006
Figure 7. Steps to calculate locally differing material parameters in dependency of prior fatigue damage.
Applmech 04 00061 g007
Figure 8. Dimensions of the specimen geometry “XX-Rib”.
Applmech 04 00061 g008
Figure 9. Test rig for 3-point bending tests.
Applmech 04 00061 g009
Figure 10. DIC overlay of longitudinal strain on XX-Rib surface.
Applmech 04 00061 g010
Figure 11. Numerical simulation model to simulate the 3-point bending tests of XX-Ribs.
Applmech 04 00061 g011
Figure 12. Model prediction of fatigue life vs. actual measurements of failure.
Applmech 04 00061 g012
Figure 13. Increasing indentation of bending fin over the course of cyclic testing.
Applmech 04 00061 g013
Figure 14. Model prediction of fatigue damage vs. actual measurements of stiffness loss.
Applmech 04 00061 g014
Figure 15. Comparison of normalised breaking strength in experiments and simulation.
Applmech 04 00061 g015
Table 1. Cycles to failure for XX-Ribs under service load case.
Number of Cycles Endured
6496727921028109811241159
Table 2. Comparison of measurement and model prediction for different failure probabilities.
P f = 10 % P f = 50 % P f = 90 %
Experiment6499081269
Model Prediction5959251282
Relative Error, N Messung N Modell N Messung +8%−2%−1%
Table 3. Comparison of experimental and simulative results.
Damage00.160.240.260.370.420.450.600.67
Breaking strength, N1028861779755647611574437371
1017932737737741616597552495
Stiffness, MPa1295110612161201100710601042631546
1281119811501173115310681085796729
Relative error, %1.1−8.35.42.3−14.5−0.8−4.1−26.1−33.5
Disclaimer/Publisher’s Note: The statements, opinions and data contained in all publications are solely those of the individual author(s) and contributor(s) and not of MDPI and/or the editor(s). MDPI and/or the editor(s) disclaim responsibility for any injury to people or property resulting from any ideas, methods, instructions or products referred to in the content.

