Article

Effect of Laser Peening with a Microchip Laser on Fatigue Life in Butt-Welded High-Strength Steel

1
Major in Systems Engineering, Graduate School of Systems Engineering, Kindai University, Higashihiroshima 739-0042, Japan
2
Department of Architecture, Faculty of Engineering, Kindai University, Higashihiroshima 739-0042, Japan
3
Institute for Molecular Science, National Institutes of Natural Sciences, Okazaki 444-8585, Japan
*
Author to whom correspondence should be addressed.
Appl. Mech. 2021, 2(4), 878-890; https://doi.org/10.3390/applmech2040051
Submission received: 1 September 2021 / Revised: 7 October 2021 / Accepted: 11 October 2021 / Published: 20 October 2021
(This article belongs to the Collection Fracture, Fatigue, and Wear)

Abstract

:
Laser peening introduces compressive residual stresses on the surfaces of various materials and is effective in enhancing fatigue strength. Using a small microchip laser, with energies of 5, 10, and 15 mJ, the authors applied laser peening to the base material of an HT780 high-strength steel, and confirmed compressive residual stresses in the near-surface layer. Laser peening with a pulse energy of 15 mJ was then applied to fatigue samples of an HT780 butt-welded joint. It was confirmed that laser peening with the microchip laser prolonged the fatigue life of the welded joint samples to the same level as in previous studies with a conventional laser.

1. Introduction

Steel structures as used in industry and in social infrastructure, such as bridges, buildings, power plants, energy storage, and transportation, are important social capital stock in Japan. Much of this social capital stock was constructed during Japan’s rapid growth in the 20th century, and is approaching the end of its design life. Its renovation and maintenance have become an urgent matter. In particular, with the increases in traffic volume and weight in recent years, cracks have been found in highway bridges that far exceed the expected number and length. The importance of improving fatigue strength by replacement, repair or reinforcement of steel bridges is widely recognized.
Of the various methods (shot peening [1,2,3,4,5], hammer peening [6,7], ultrasonic impact treatment [8,9], laser peening [5,10], cavitation peening [3,4,5], water jet peening [5], etc.) employed for improving the fatigue strength, the authors have focused on laser peening. Laser peening has been identified as a technique for preventing fatigue cracks. Laser peening generates high-pressure plasma by irradiating a material covered with a transparent medium, such as water. It employs a laser with a pulse width of several nano-seconds, and increases the strength of the material surface using its impact force [10]. A photograph of this irradiation is shown in Figure 1.
It is known that laser peening is effective in preventing SCC (stress corrosion cracking) because high compressive residual stress is generated on the surface of materials. It is used as a preventive maintenance measure for SCC of core shrouds of BWRs (boiling water reactors) [11], and on the inner and outer surfaces of bottom mounted instrumentation nozzles of PWRs (pressurized water reactors) [12]. The treatment can be carried out with high reliability in the laser peening, because the irradiation condition of every pulse can be controlled exactly. Since the irradiation position can be automatically and strictly controlled by a computer, there is no chance of leaving untreated area, and since it is continuously processed with a small irradiation laser spot, the adaptability to complicated objects and local regions is also high. In addition, it is reported that the effect of laser peening is deeper than that of shot peening [13].
Fatigue tests have been carried out on austenitic stainless steel [14,15,16], aluminum alloy [17,18,19], titanium alloy [19], and marine steel [20] with a view to improving fatigue strength by generating compressive residual stress. However, no such research other than our work had been carried out on structural steel, which is frequently used for large structures such as bridges and buildings, or on the applicability of the technique to the weld zone. In the welded part of the structure, fatigue cracks are generated mainly by stress concentration at the toe, etc. This stress concentration is known to significantly depend on shape but not on the strength of the base metal. This indicates that although the tensile strength of high-strength steel is higher than that of mild steel, the fatigue strength of a welded structure employing high-strength steel does not differ greatly from that of a welded structure of mild steel. Thus, the fatigue strength at the welded part substantially reduces the advantage of using high-strength steel.
As a matter of basic research, to examine whether laser peening is applicable to welds in large structures such as bridges, the authors previously examined the laser peening conditions for structural steels by residual stress measurement and hardness testing. The authors established the change of surface residual stress, depth direction distribution of residual stress, hardness distribution, and surface roughness of four structural steels of varying strengths. As a result, in the case of structural steel of 400 N/mm2 grade or higher, it was shown that a sufficiently large compressive residual stress was generated at a pulse energy of 200 mJ, a spot diameter of 0.8 mm, and an irradiation density of 36 pulses/mm2. At the weld zone, the change of residual stress due to laser peening was examined by using a test specimen, to which laser peening was applied to the toe, where the rib was boxing welded. The residual stress at the weld zone changed greatly under laser peening, from tension to compression. Further, the closer the weld zone was to the toe, the greater the change [21].
In addition, fatigue strength was examined by fatigue tests on butt-welded joint specimens, and it was shown that the improvement in fatigue strength due to laser peening was large. The main factor in this improvement was the generation of compressive residual stress [22]. In the fatigue tests of the test specimens in which the rib was boxing welded, it was confirmed that improvements in fatigue strength due to laser peening took place not only in ordinary steel but also in HT780 high-strength steel [23].
In this way, the generation of large compressive residual stress and the improvement in fatigue strength by laser peening have already been demonstrated. In order to apply this laser peening easily to large structures, it is necessary to develop a compact and portable laser peening system. In order to do this, laser peening must be conducted at a lower pulse energy than before.
In the Impulsing Paradigm Change through Disruptive Technologies Program (ImPACT), “Ubiquitous Power Laser for Achieving a Safe, Secure, and Longevity Society” [24], led by the Japanese government’s Cabinet Office, a high-power advanced microchip laser was developed. The objective was a pulse energy of 20 mJ, as shown. At present, the technology transfer is being carried out for its commercialization, and demonstration lasers have been produced. A portable laser peening device, adaptable in the field, can be realized by using such a microchip laser. Once field laser peening becomes possible, it can be used not only for new construction but also for the reinforcement of existing structures. The effect of tensile stress due to the deadweight generated after the construction of structures can be eliminated, and improvements in fatigue strength can be expected.
The authors examined how the generated residual stress and fatigue strength changed when the pulse energy was reduced to 20 mJ, 10 mJ, and 6 mJ, using a conventional laser, and selected the optimum laser peening conditions. Then, a fatigue test was conducted to confirm whether the fatigue strength improved under the selected conditions [25], and moreover, fatigue tests on large specimens were carried out to ascertain whether low-power laser peening is effective in actual structures [26]. Based on these results, this paper sets out the laser peening conditions under which compressive residual stress is generated, even when it is performed using a microchip laser. In addition, this paper aims to establish whether fatigue strength is improved by generated compressive residual stress by fatigue tests.

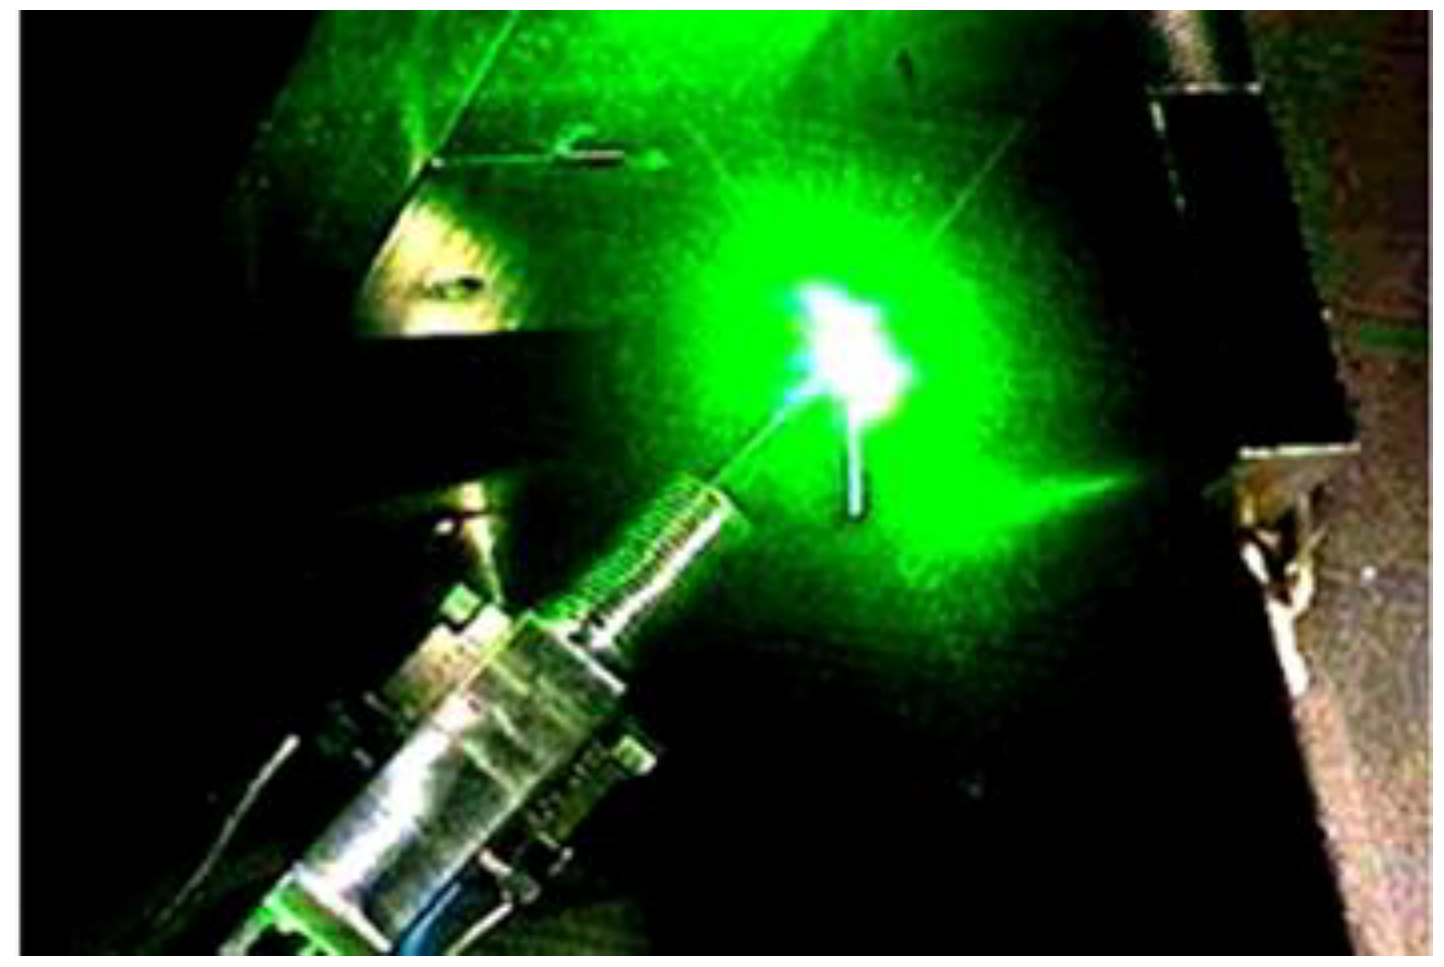
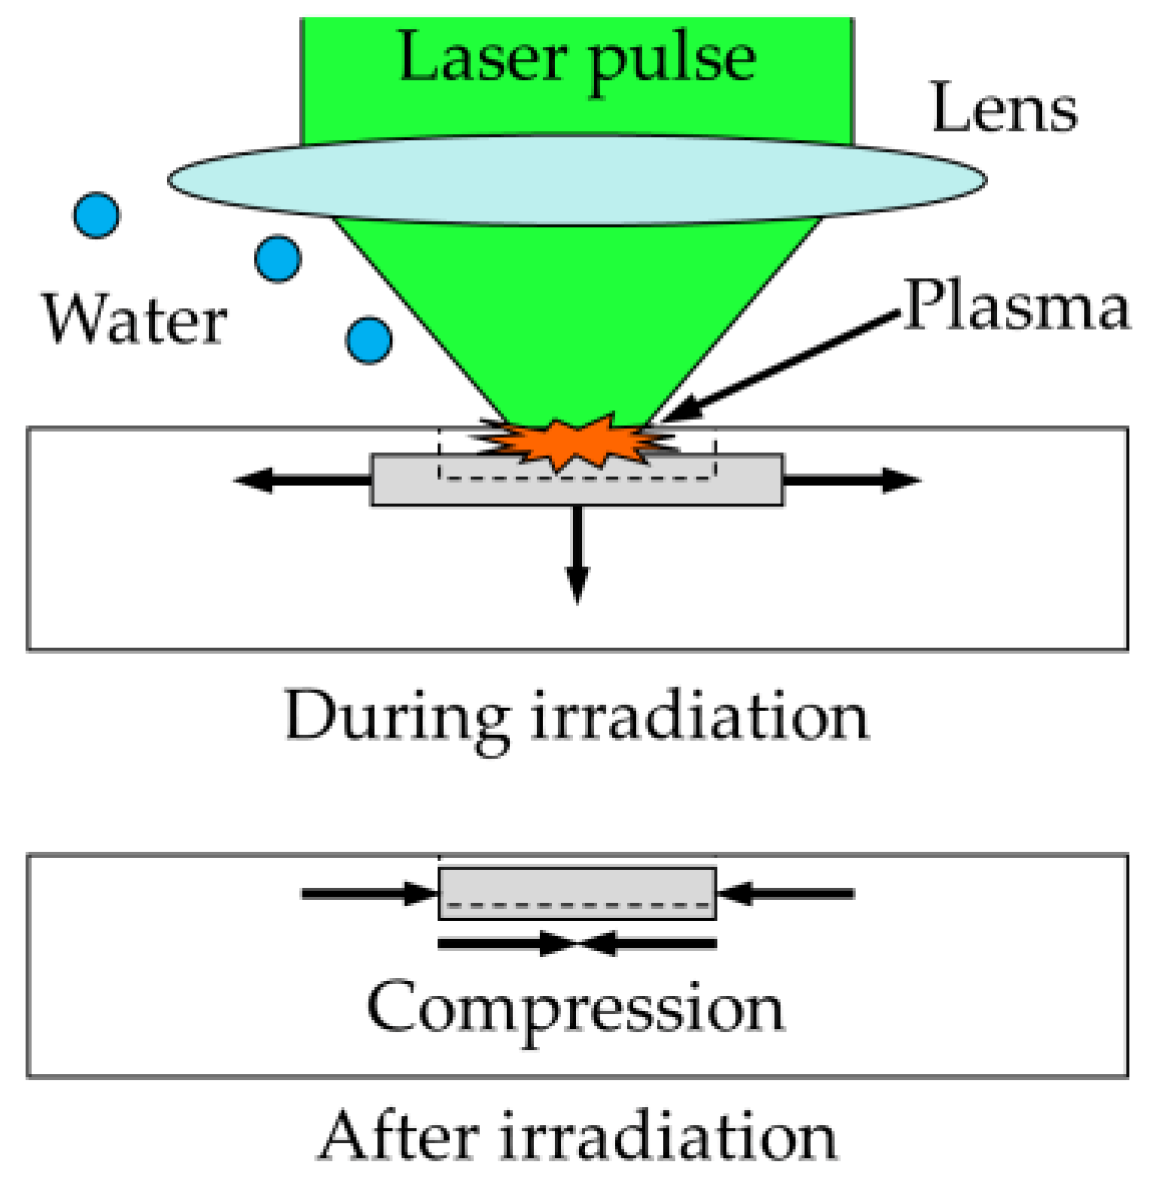
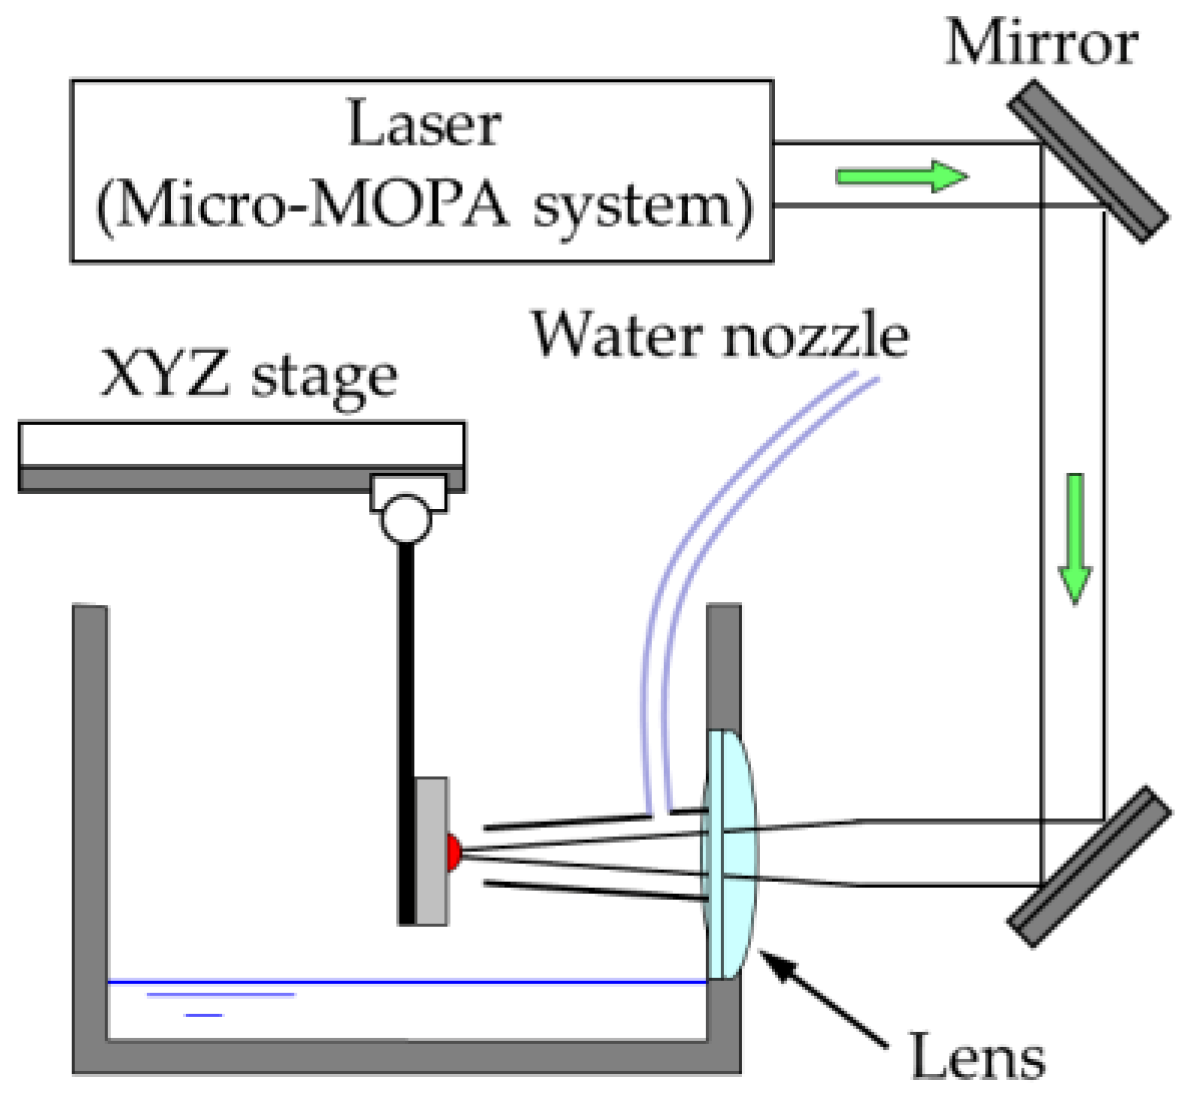
2. Laser Peening Process

The mechanism of residual stress generation by laser peening used in this study is schematically shown in Figure 2 [10]. When a material placed in water is irradiated with an intense laser pulse exceeding the ablation threshold, the surface layer of the material becomes a plasma and a high-pressure plasma is generated on the surface. The inertia of the water prevents the expansion of the plasma, and the laser energy is concentrated in a narrow region. As a result, the pressure of the plasma is multiplied 10–100 times compared with that in air and reaches several GPa. A shock wave is generated by this pressure, and it propagates in the material. Plastic deformation is generated by the dynamic stress of the shock wave, and a compressive residual stress is generated on the surface of the material by the constraint from the surrounding undeformed part. By continuously irradiating the object with the laser pulse while moving either the laser or the specimen, compressive residual stress can be uniformly generated on the surface.
The test specimens were usually submerged in water in our experiments, but the submerging real structures such as bridges is difficult. In such cases, the use of a nozzle-type laser peening is considered, in which laser irradiation is conducted while injecting water from a nozzle to form a water film covering the surface of the targeted position. The usefulness of this method has been confirmed elsewhere [21].

3. Confirmation of Compressive Residual Stress Generation

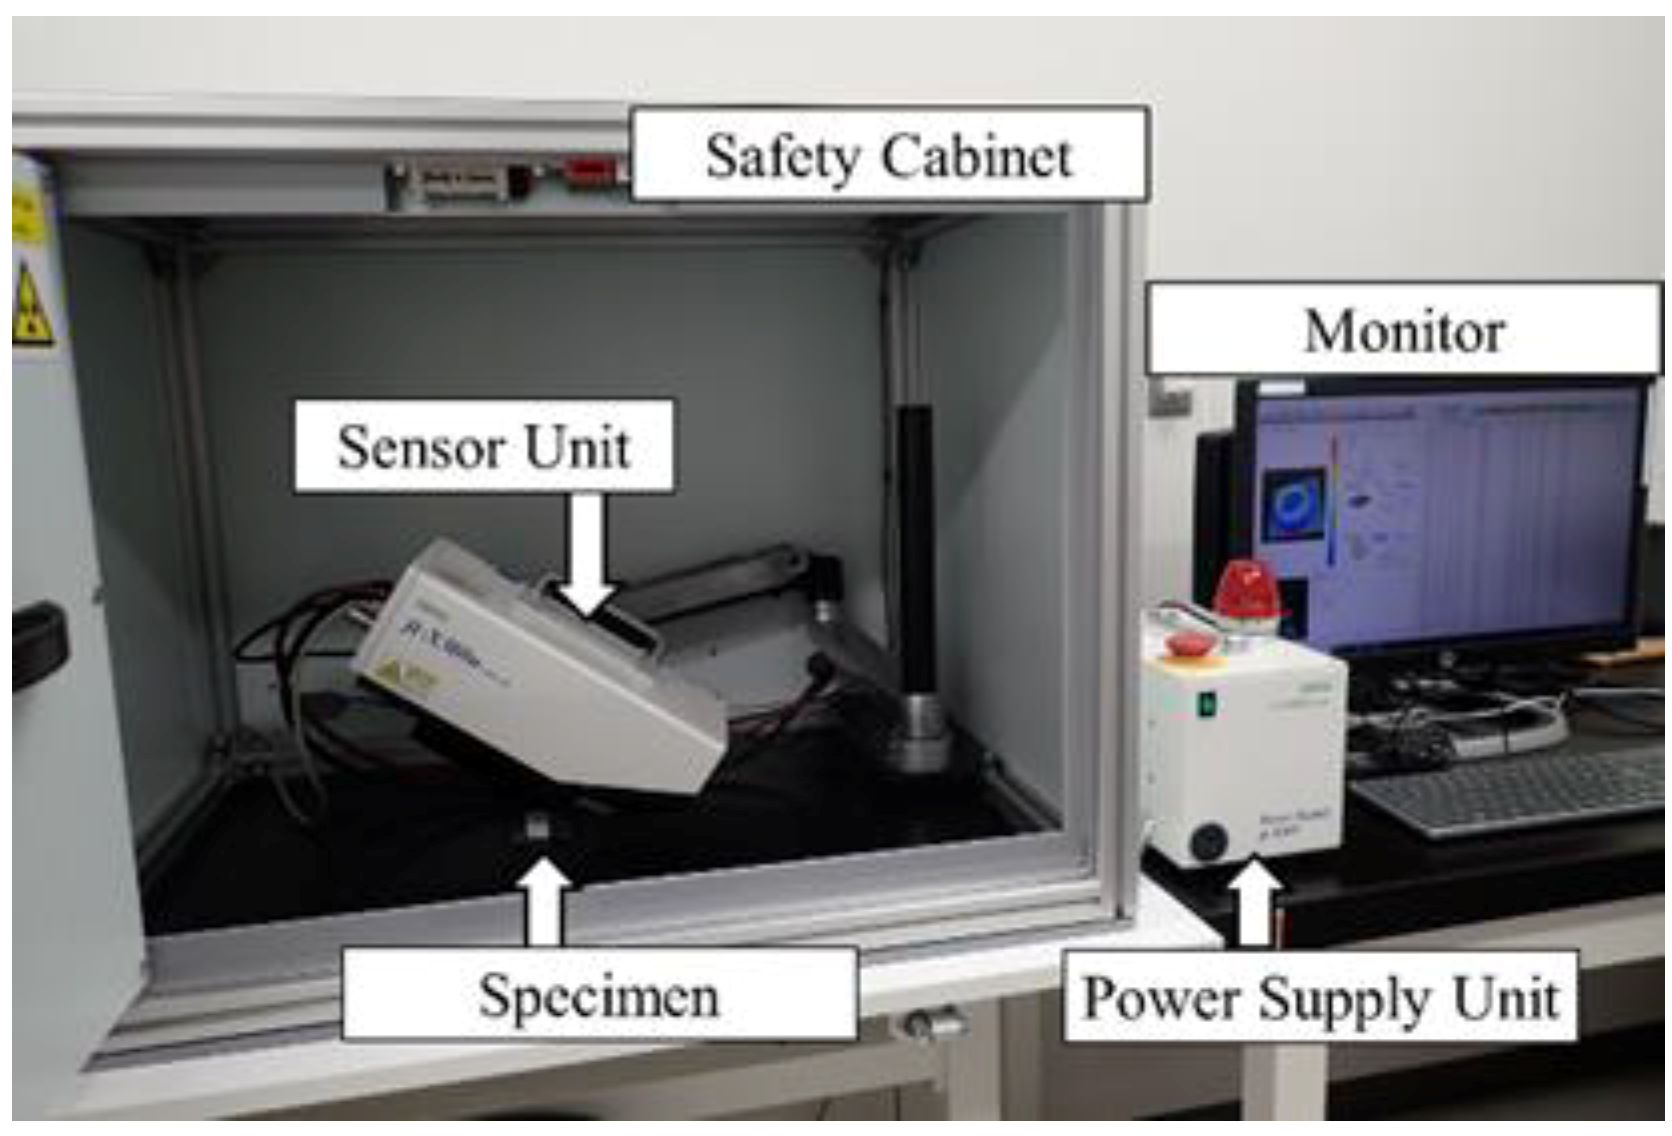
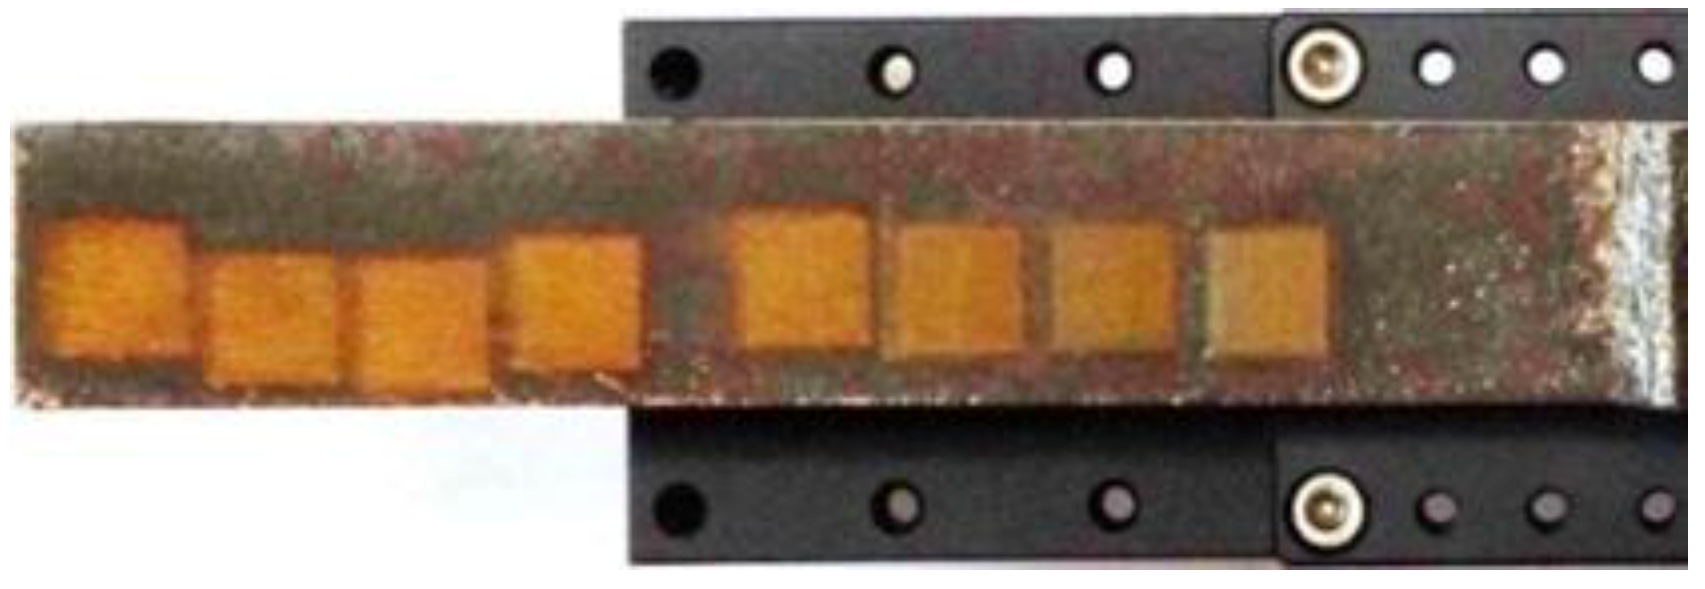
3.1. Experiment Overview

Laser peening was applied to HT780 specimens (σu = 812 MPa, σy = 745 MPa) using a microchip laser to generate compressive residual stresses. Table 1 lists the mechanical properties and chemical compositions of the steel. The irradiated pulse energies were fixed at 38 mJ, 15 mJ, 10 mJ, and 5 mJ. The wavelength of the microchip laser was 1064 nm in the near infrared, therefore, the absorption loss of laser pulse energies was taken into consideration. Laser peening was performed by changing the irradiation spot diameter as shown in Table 2. Figure 3 schematically shows the irradiation setup. The laser pulse is irradiated at a 0.1 mm pitch while the stage on which the test specimen is mounted is moved. The line under 0.1 mm is irradiated by folding back after a total movement of 8 mm. By repeating this procedure, an area of 8 mm × 8 mm was processed. The irradiation frequency was 10 Hz, and the duration of processing was about 10 min.
The surface residual stress was measured by the X-ray diffraction method (XRD, the cos α method, collimator diameter: 1 mm), using Cr-Kα (17 kV, 2.0 mA) as an X-ray source. The cosα method utilizes the whole Debye–Scherrer ring recorded on a detector taken by single exposure of X-rays, and shear stresses are determined simultaneously [26]. Figure 4 shows a photograph of an X-ray Residual Stress Analyzer. The distribution of residual stress in the thickness direction was estimated by repeating residual stress measurements using XRD and electrolytic polishing. In this estimation, the stress is measured at the concave bottom surface after local polishing (about φ6 mm) of the surface to be measured, and it is regarded as the approximate stress at the depth position in the unpolished state. The exact residual stress distribution is not obtained because the residual stress is redistributed by polishing. However, when the electrolytic polishing is shallow, the error due to the polishing is small, as shown by comparison with residual stress measured nondestructively by synchrotron radiation [27].
Figure 5 shows a photograph of the test specimen. It is known that the residual stress generated by laser peening differs between the direction parallel and perpendicular to the moving direction of the laser (the moving direction of the stage in irradiating the laser). Residual stress was measured in two directions: σξ is the residual stress component in the moving direction of the stage when irradiating the laser, and ση is the residual stress component in the perpendicular direction.

3.2. Surface Residual Stress Measurement Results

Table 2 shows the measurement results of surface residual stress. For reference, Table 2 also shows the laser peening conditions in the previous studies using a conventional large laser (with pulse energies of 20 mJ, 10 mJ, and 6 mJ) and the surface residual stress measurement result. Note that the previous studies used a laser wavelength of 532 nm.

3.2.1. Pulse Energy of 38 mJ

At a spot diameter of 0.36 mm, σξ and ση were −271 MPa and −364 MPa, respectively, which were the largest compressive residual stresses in each case.

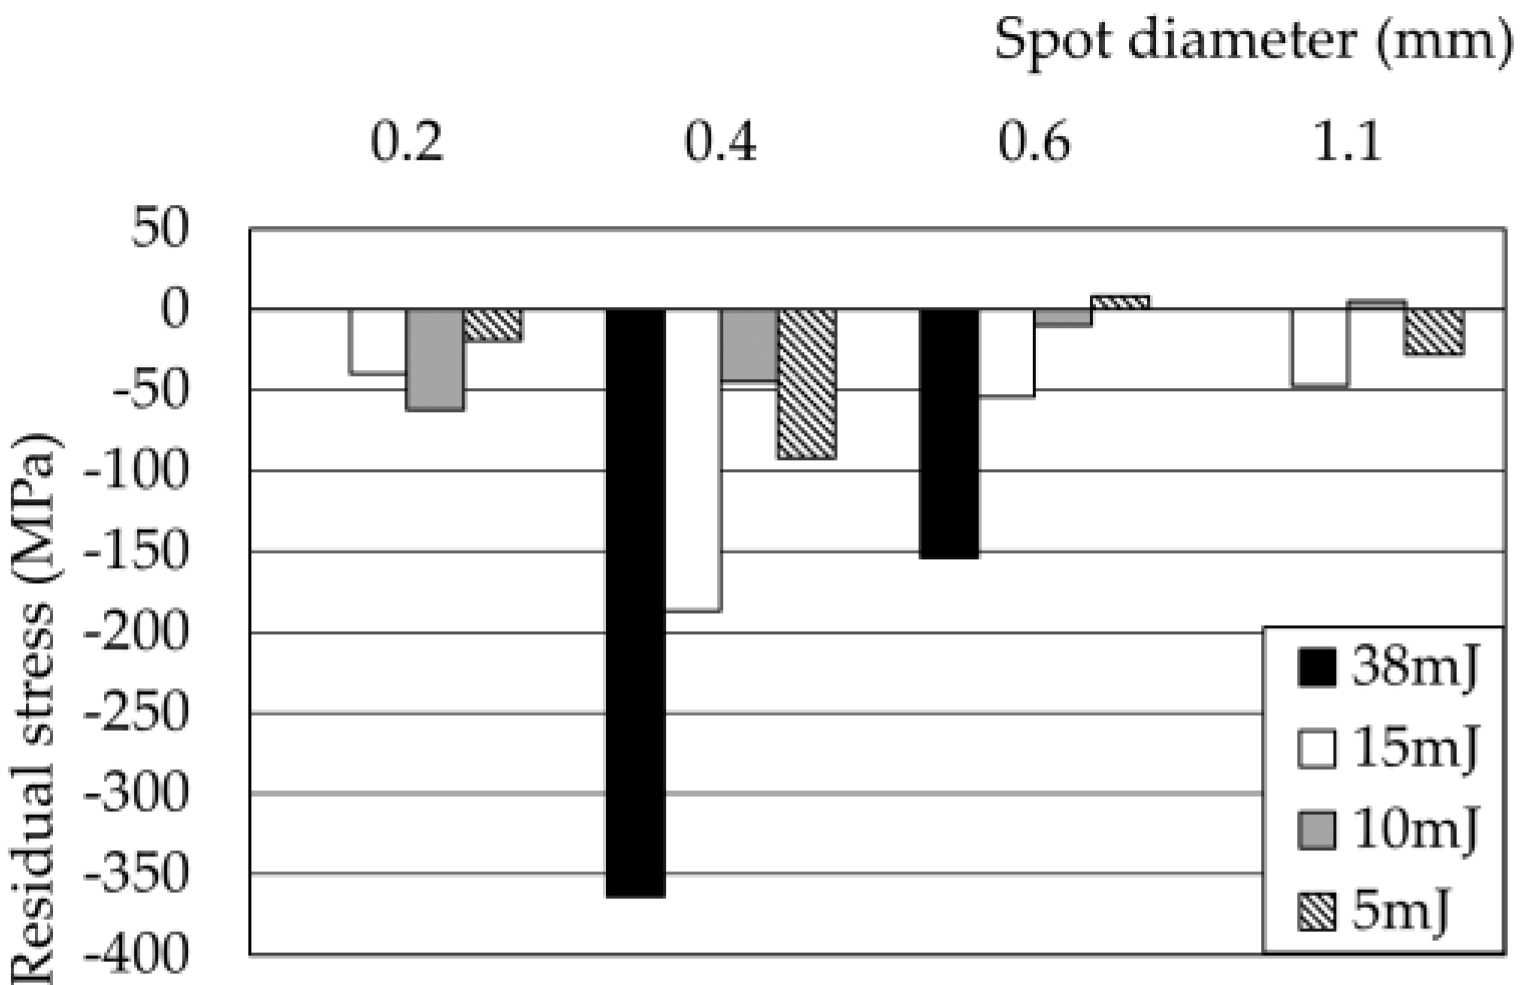
3.2.2. Pulse Energy of 15 mJ

At a spot diameter of 0.22 mm, σξ was −62 MPa, and the largest compressive residual stress was generated for σξ. At a spot diameter of 0.37 mm, ση was −187 MPa, and the largest compressive residual stress was generated for ση.

3.2.3. Pulse Energy of 10 mJ

At a spot diameter of 0.67 mm, the compressive residual stress was −65 MPa for σξ. The largest compressive residual stress was generated for σξ, and almost no compressive residual stress was generated for ση. At a spot diameter of 0.19 mm, ση was −62 MPa and the largest compressive residual stress was generated in ση.

3.2.4. Pulse Energy of 5 mJ

Compressive residual stress was generated at spot diameters of 0.17 mm and 0.34 mm. At the latter diameter, ση was −92 MPa and a larger compressive residual stress was generated than a pulse energy of 10 mJ.

3.3. Residual Stress Depth Distribution

Figure 6, Figure 7, Figure 8 and Figure 9 compare the distributions of residual stress in the thickness direction under pulse energies of 38 mJ, 15 mJ, 10 mJ, and 5 mJ. In the figures, the result (NP) of the test specimen without laser peening is also shown. These are residual stress components in the ση direction, but the tendency is similar in the σξ direction.

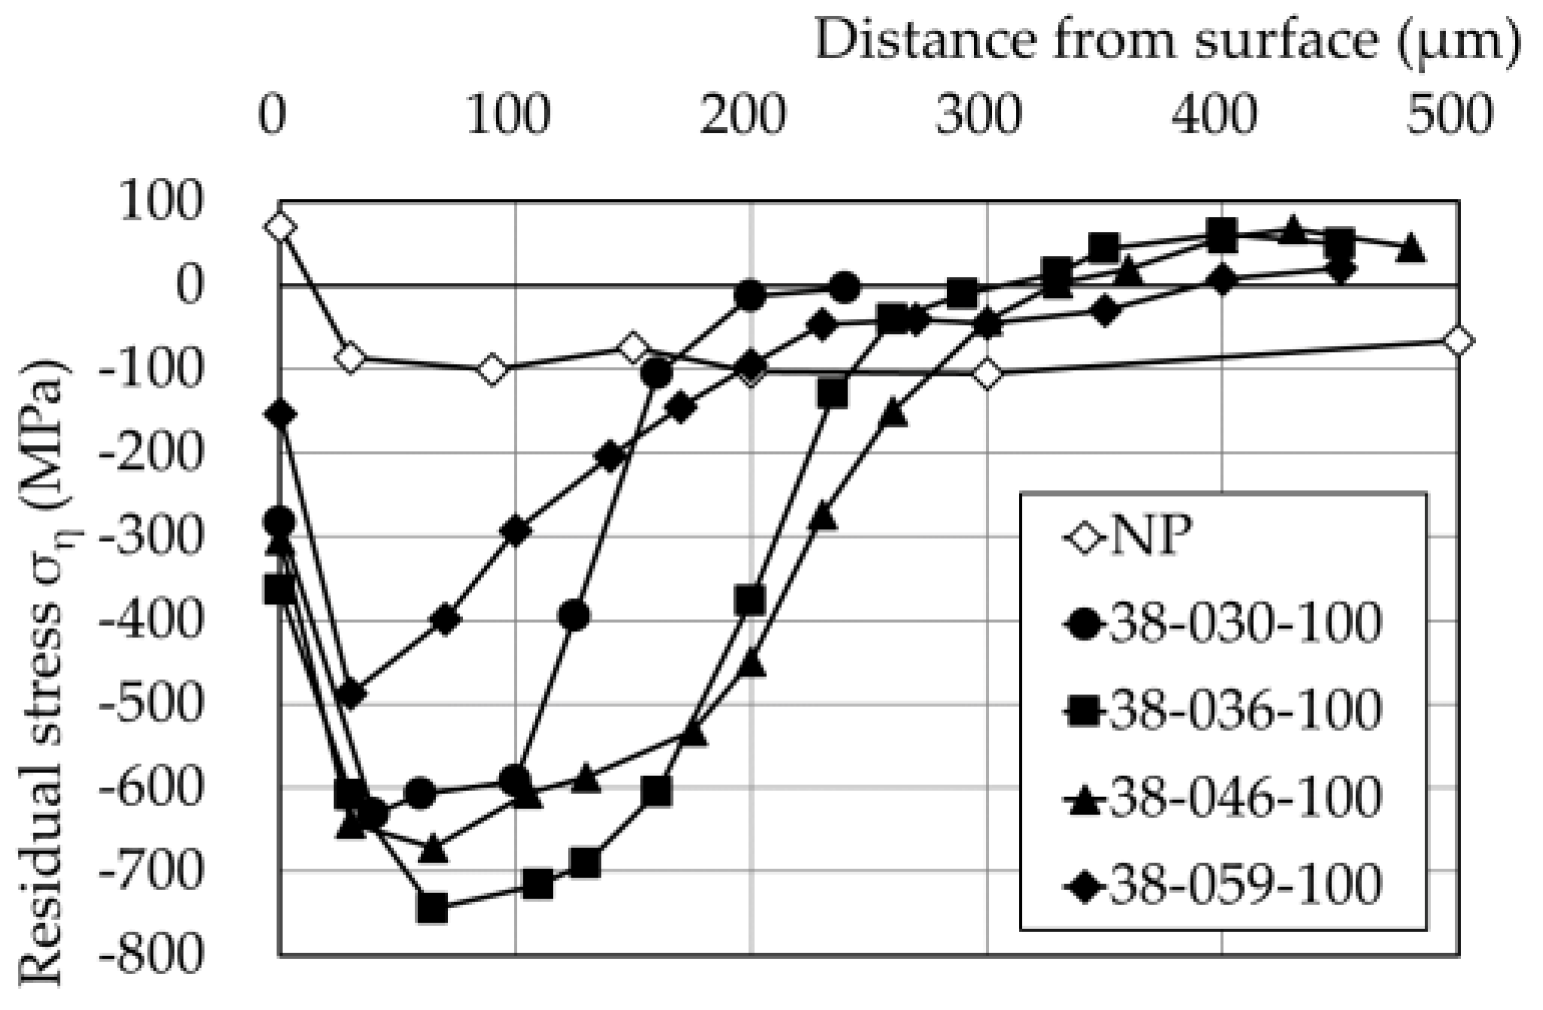
3.3.1. Pulse Energy of 38 mJ

At a spot diameter of 0.36 mm, the peak was observed at around 40–100 μm depth, the compressive residual stress was generated to around 300 μm depth, and the value of the maximum residual stress was the largest. At a spot diameter of 0.46 mm, compressive residual stress was generated up to 300 μm, and the generation depth of residual stress was the deepest.

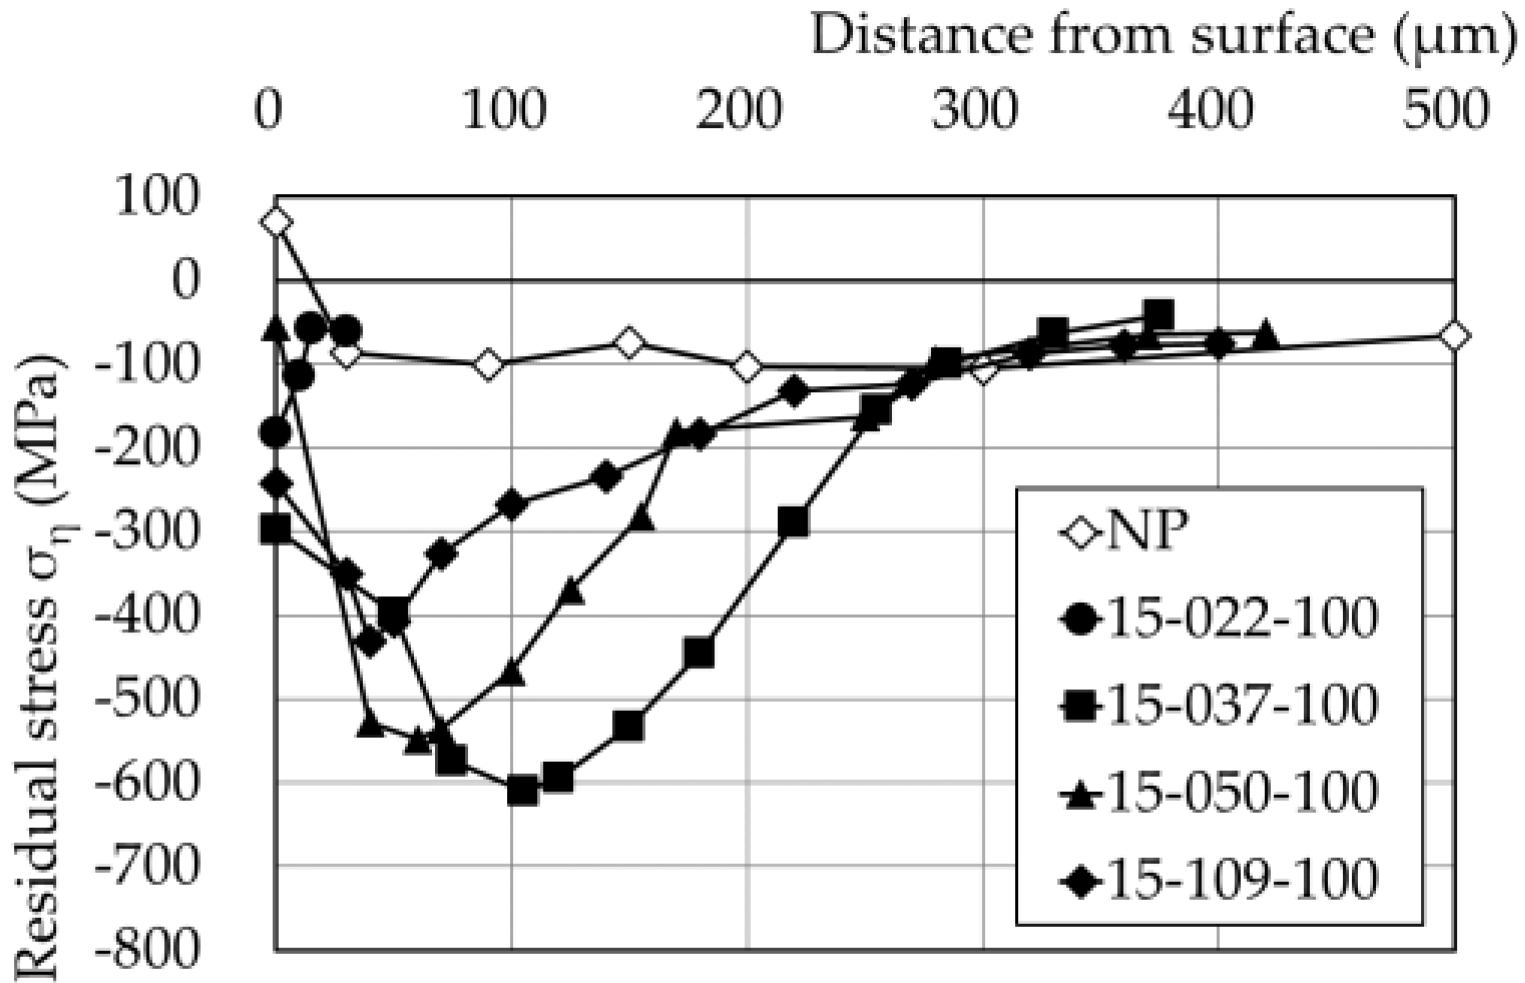
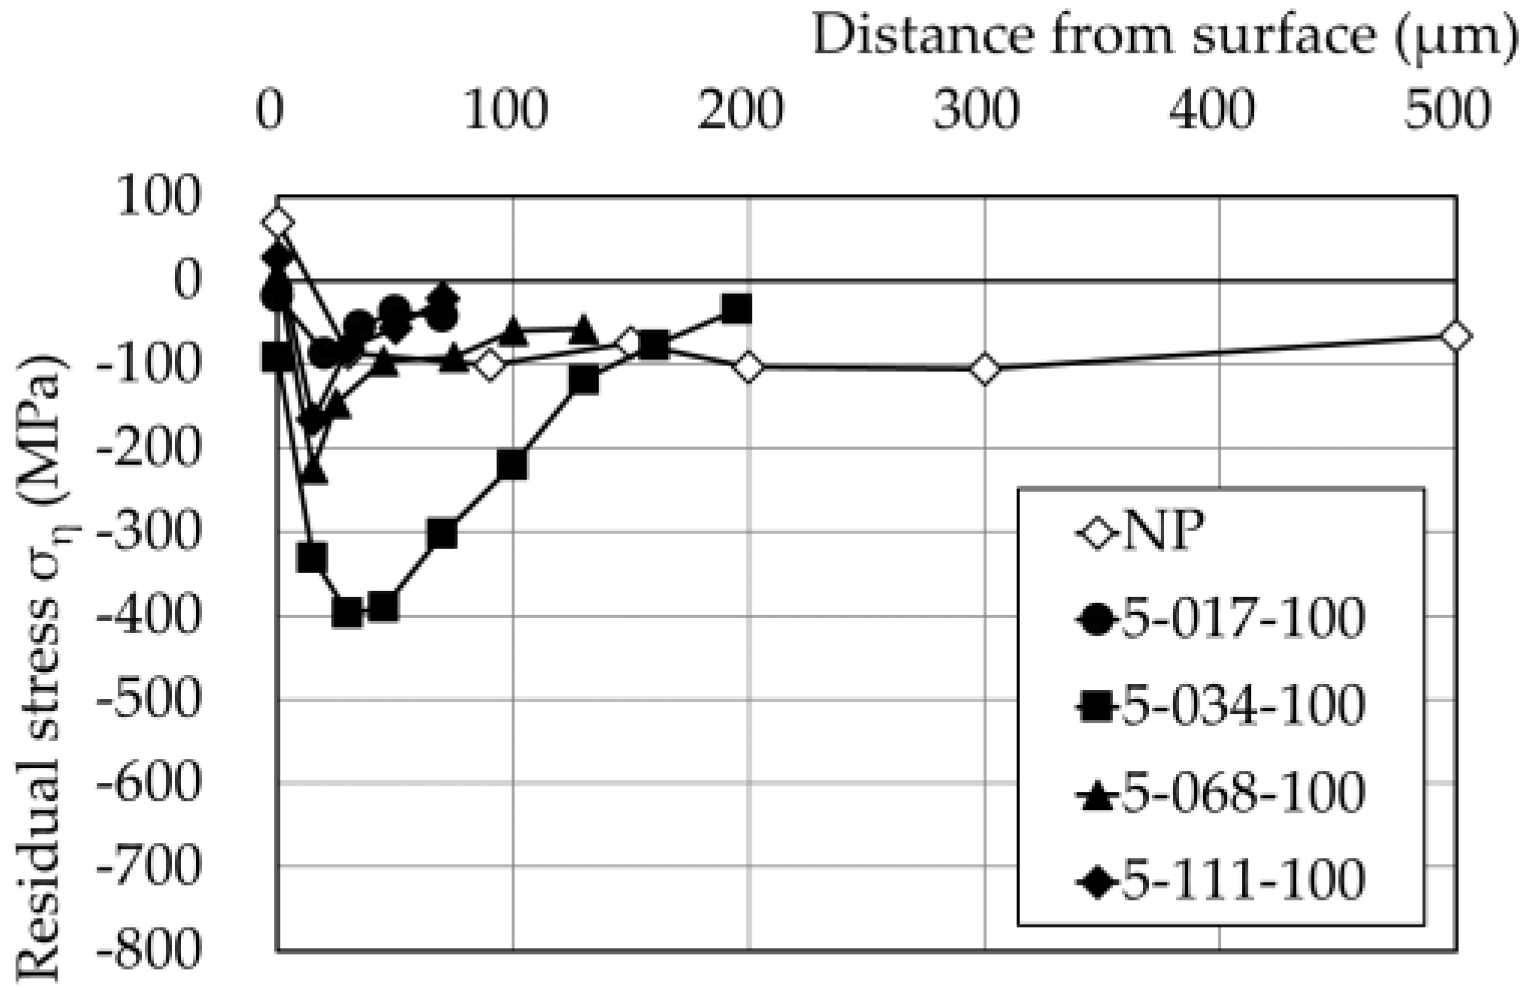
3.3.2. Pulse Energy of 15 mJ

At a spot diameter of 0.37 mm, the peak was around 50–100 μm depth, the compressive residual stress was generated to around 300 μm depth, the value of the maximum residual stress was the largest, and the generation depth of the residual stress was the deepest. The maximum residual stress values were larger at spot diameters of 0.50 and 1.09 mm, and the generation depths of the residual stress were deeper. Hardly any compressive residual stress was generated at the spot diameter of 0.22 mm.

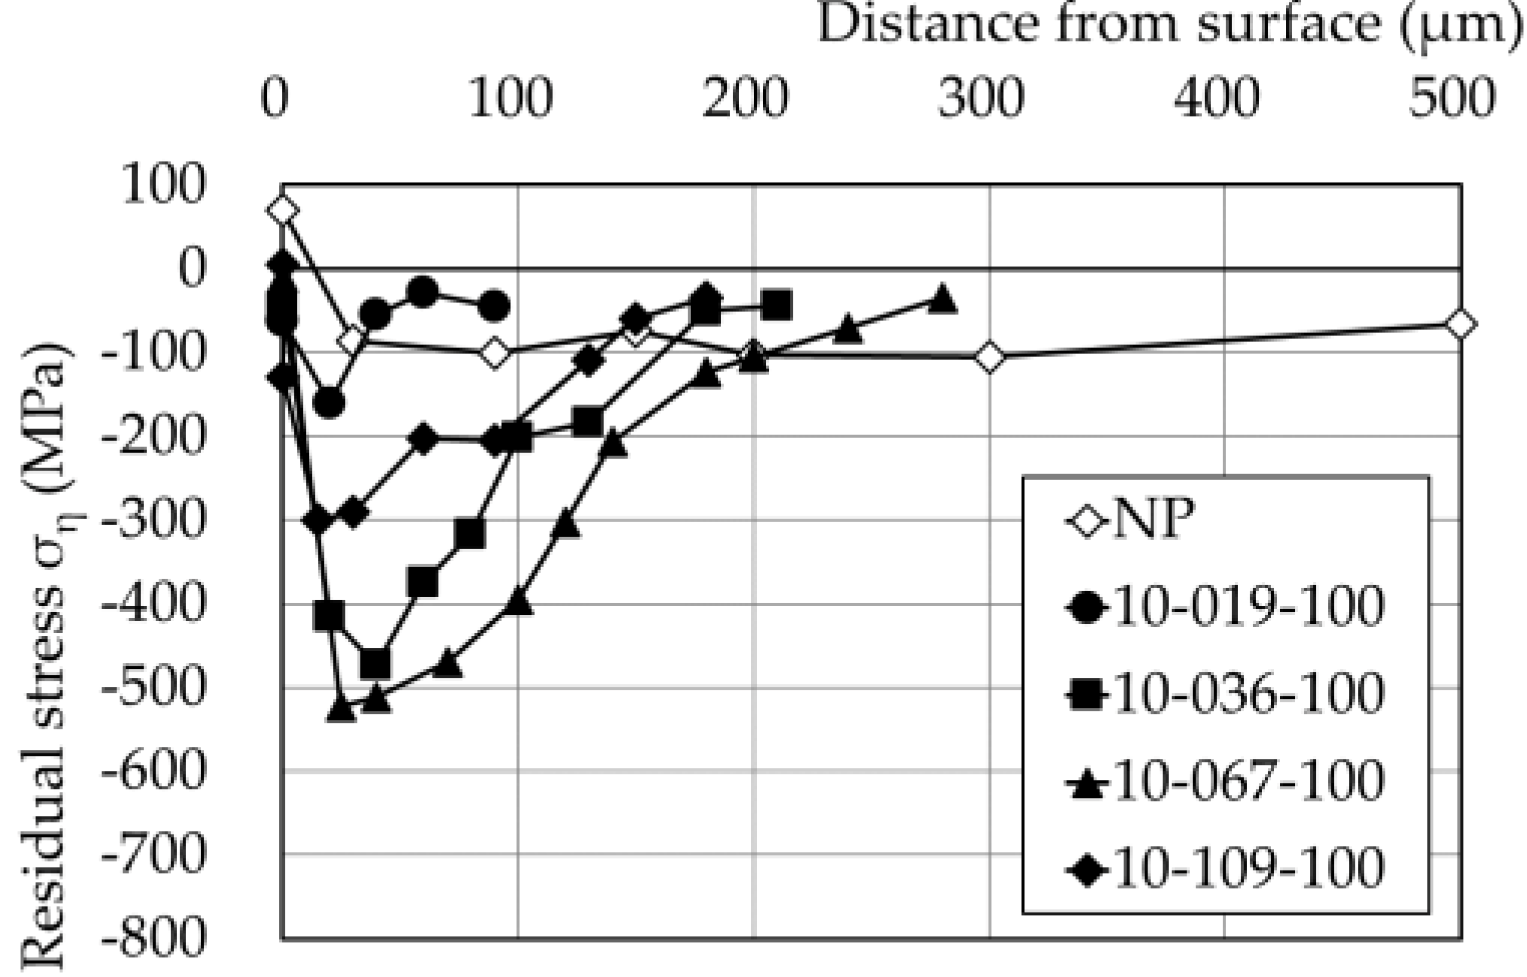
3.3.3. Pulse Energy of 10 mJ

At a spot diameter of 0.67 mm, the peak was around 25 μm, the compressive residual stress was generated to around 240 μm, the value of the maximum residual stress was the largest, and the generation depth of the residual stress was the deepest. The maximum residual stress values were larger at spot diameters of 0.36 mm and 1.09 mm, and the generation depths of the residual stress were deeper. Hardly any compressive residual stress was generated at the spot diameter of 0.19 mm.

3.3.4. Pulse Energy of 5 mJ

At a spot diameter of 0.34 mm, the peak was around 30 μm, the compressive residual stress was generated to around 160 μm, the value of the maximum residual stress was the largest, and the generation depth of the residual stress was the deepest. Hardly any compressive residual stress was generated at spot diameters of 0.17 mm, 0.68 mm, and 1.11 mm.

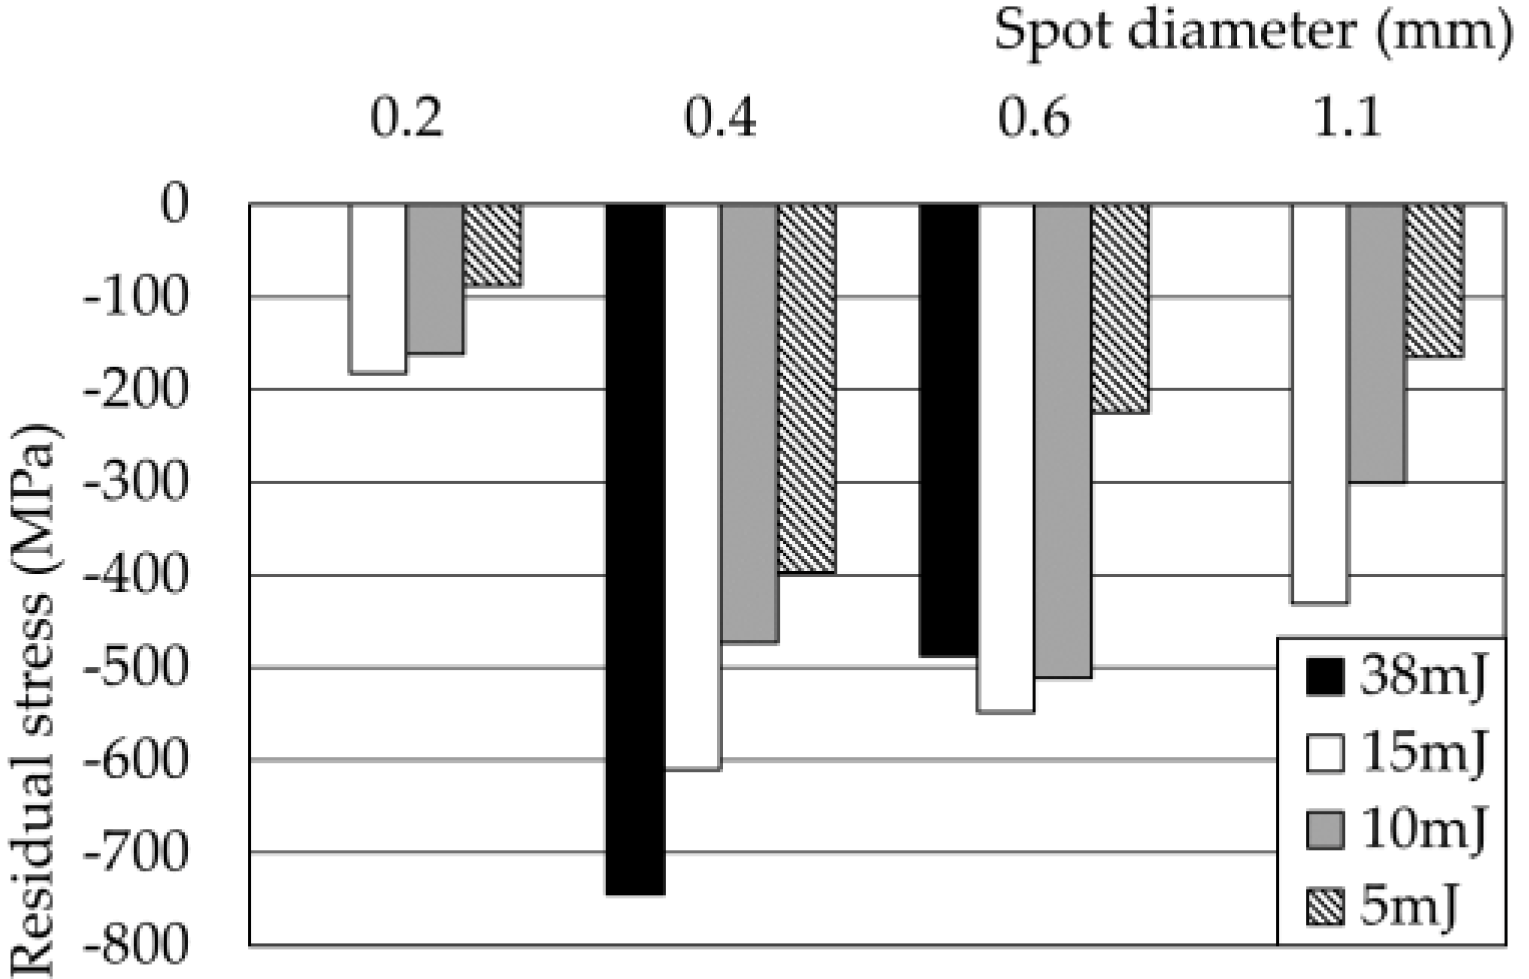
3.4. Spot Diameter and Residual Stress

In laser peening, it is known that the plasma pressure when a material is irradiated with a laser is approximately proportional to the half-power of the irradiation density (W/m2) of laser pulse [10]. Therefore, at constant pulse energy, the smaller the spot diameter is, the more high-pressure plasma is produced, which is advantageous in inducing plastic deformation. On the other hand, water breakdown tends to occur as the spot diameter decreases. In this event the energy of the laser is absorbed, and the effect becomes small. Therefore, when the pulse energy is fixed, the spot diameter has some effective range. When the pulse energy was in the range of 5–15 mJ, the effective spot diameter range was approximately 0.2–1.2 mm, so the experiment was conducted in that range.
Figure 10 compares the surface residual stresses at each spot diameter with pulse energies of 38 mJ, 15 mJ, 10 mJ, and 5 mJ, and Figure 11 compares the maximum compressive residual stresses. As shown in Table 2, since the spot diameter differs slightly for each pulse energy, the approximate values of 0.2 mm, 0.4 mm, 0.6 mm, and 1.1 mm are shown in Figure 10 and Figure 11. Only at pulse energy of 38 mJ, the spot diameters of 0.36 mm and 0.60 mm are shown. At pulse energies of 38 mJ, 15 mJ, and 5 mJ, the surface residual stress and the maximum compressive residual stress were at their largest at a spot diameter of 0.35 mm. At a pulse energy of 10 mJ, the surface residual stress was at its largest at a spot diameter of 0.2 mm, and the maximum compressive residual stress was at its largest at a spot diameter of 0.6 mm. However, even when the spot diameter is 0.35 mm, the maximum compressive residual stress is large. The range of suitable spot diameters is considered to be 0.35–0.6 mm.

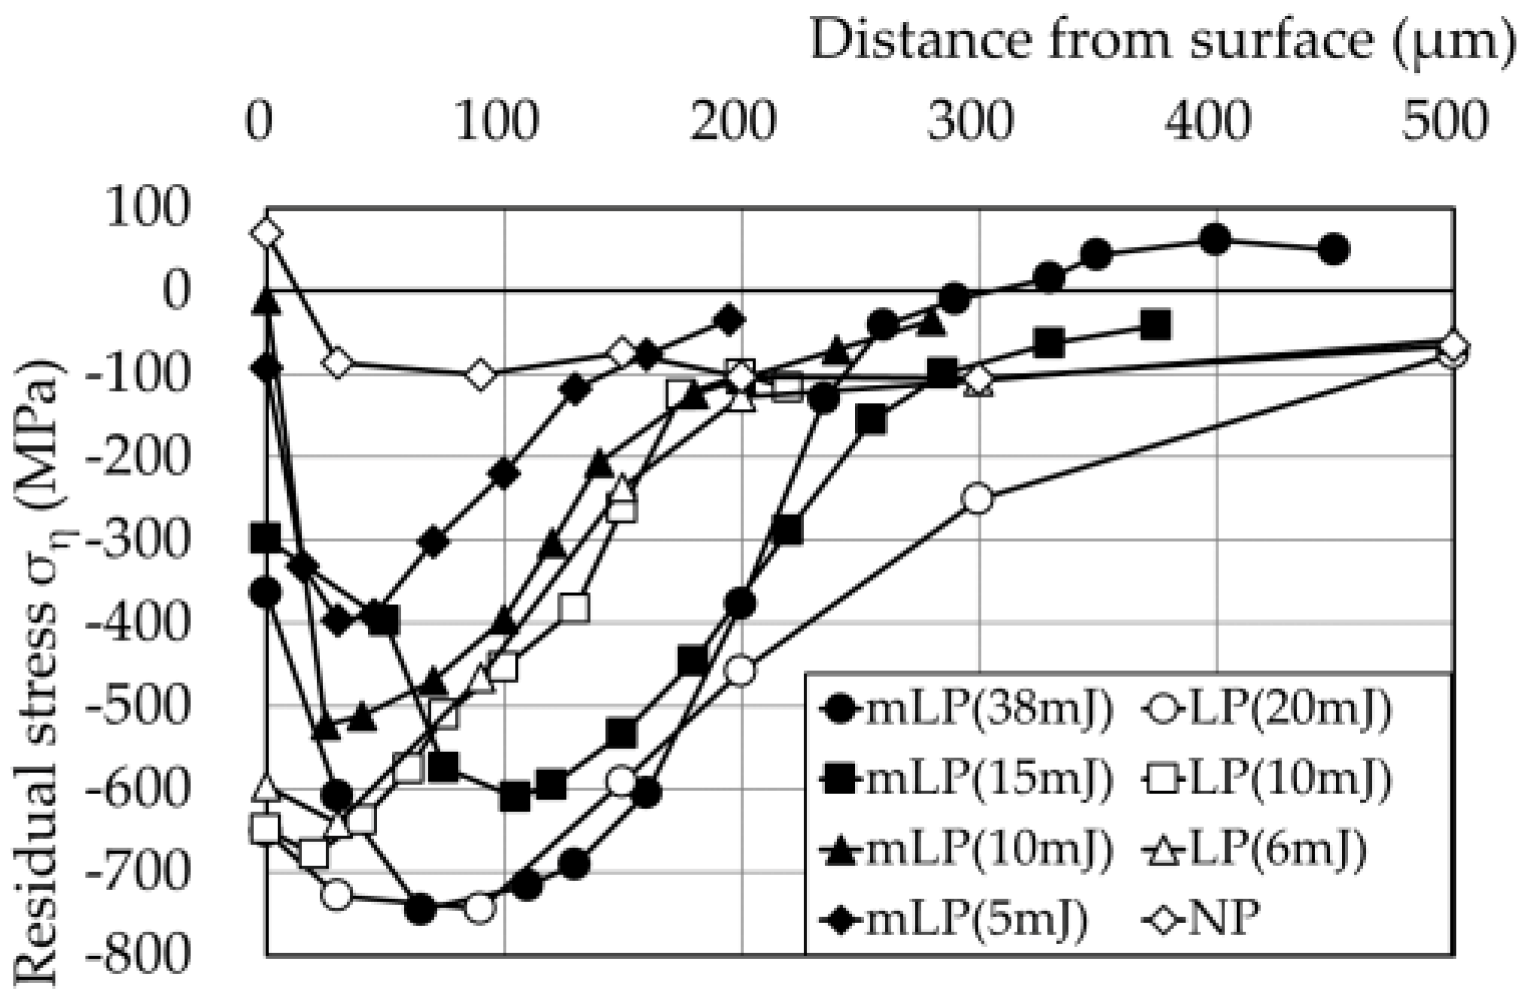
3.5. Comparison with Previous Studies

From the results in the previous section, for the pulse energy of 38 mJ, a spot diameter of 0.36 mm was chosen; for a pulse energy of 15 mJ, a spot diameter of 0.37 mm; for a pulse energy of 10 mJ, a spot diameter of 0.67 mm; and for a pulse energy of 5 mJ, a spot diameter of 0.34 mm. Figure 12 compares the distribution of residual stress in the thickness direction under each condition with the results of pulse energies of 20 mJ, 10 mJ, and 6 mJ obtained in the previous study. In the figure, the present result is shown as mLP (38 mJ, 15 mJ, 10 mJ, 5 mJ), and the result of the previous studies is shown as LP (20 mJ, 10 mJ, 6 mJ). There is a large difference in the surface residual stress. This might be due to the influence of mill scale on the surface of the specimen, but further investigation is required.
The maximum residual stress and the generation depth of residual stress are smaller than those in the previous studies. In this paper, only the spot diameter was examined, and not the irradiation density. The irradiation density of the laser (the energy of the laser irradiated per unit area) is as little as approximately one-half of that in the previous studies. Therefore, it is necessary to examine in future the laser irradiation conditions in terms of the irradiation density which will be equivalent to or greater than that of the previous studies.

4. Fatigue Test

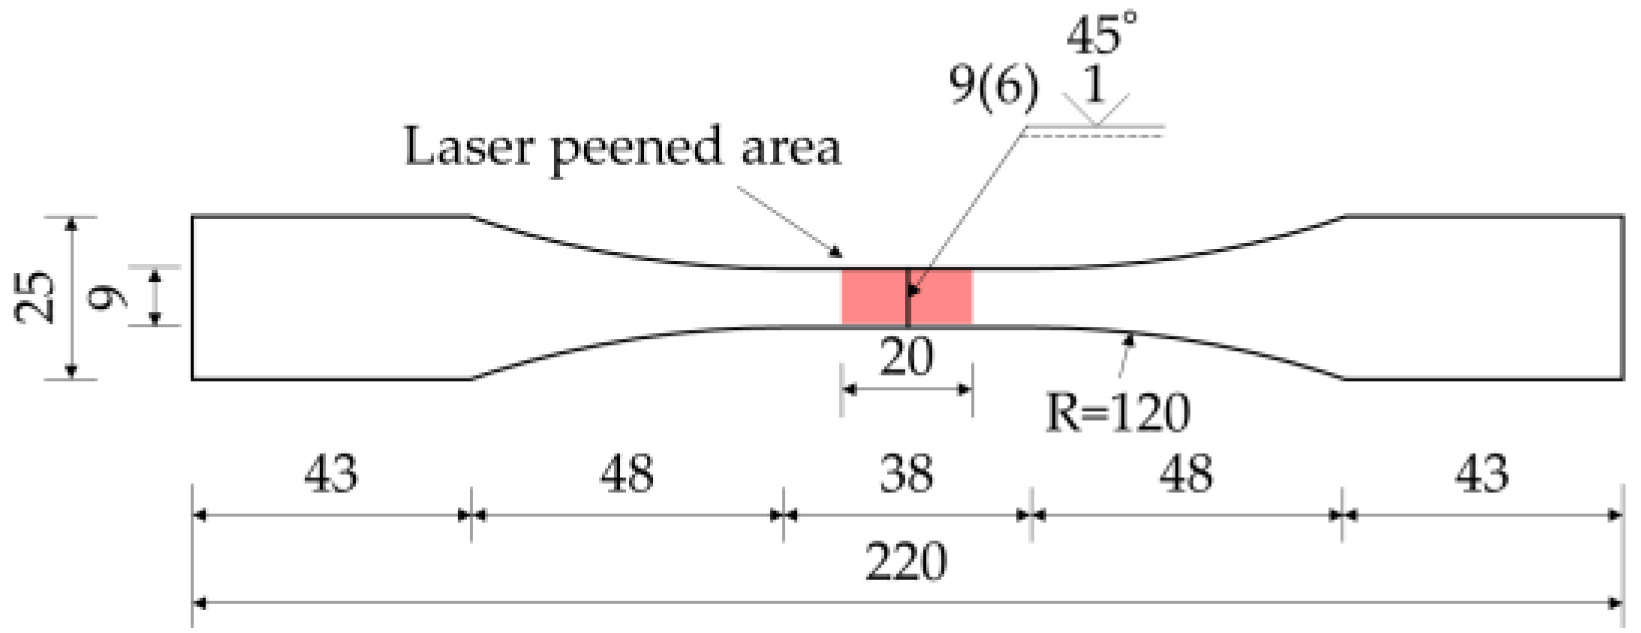
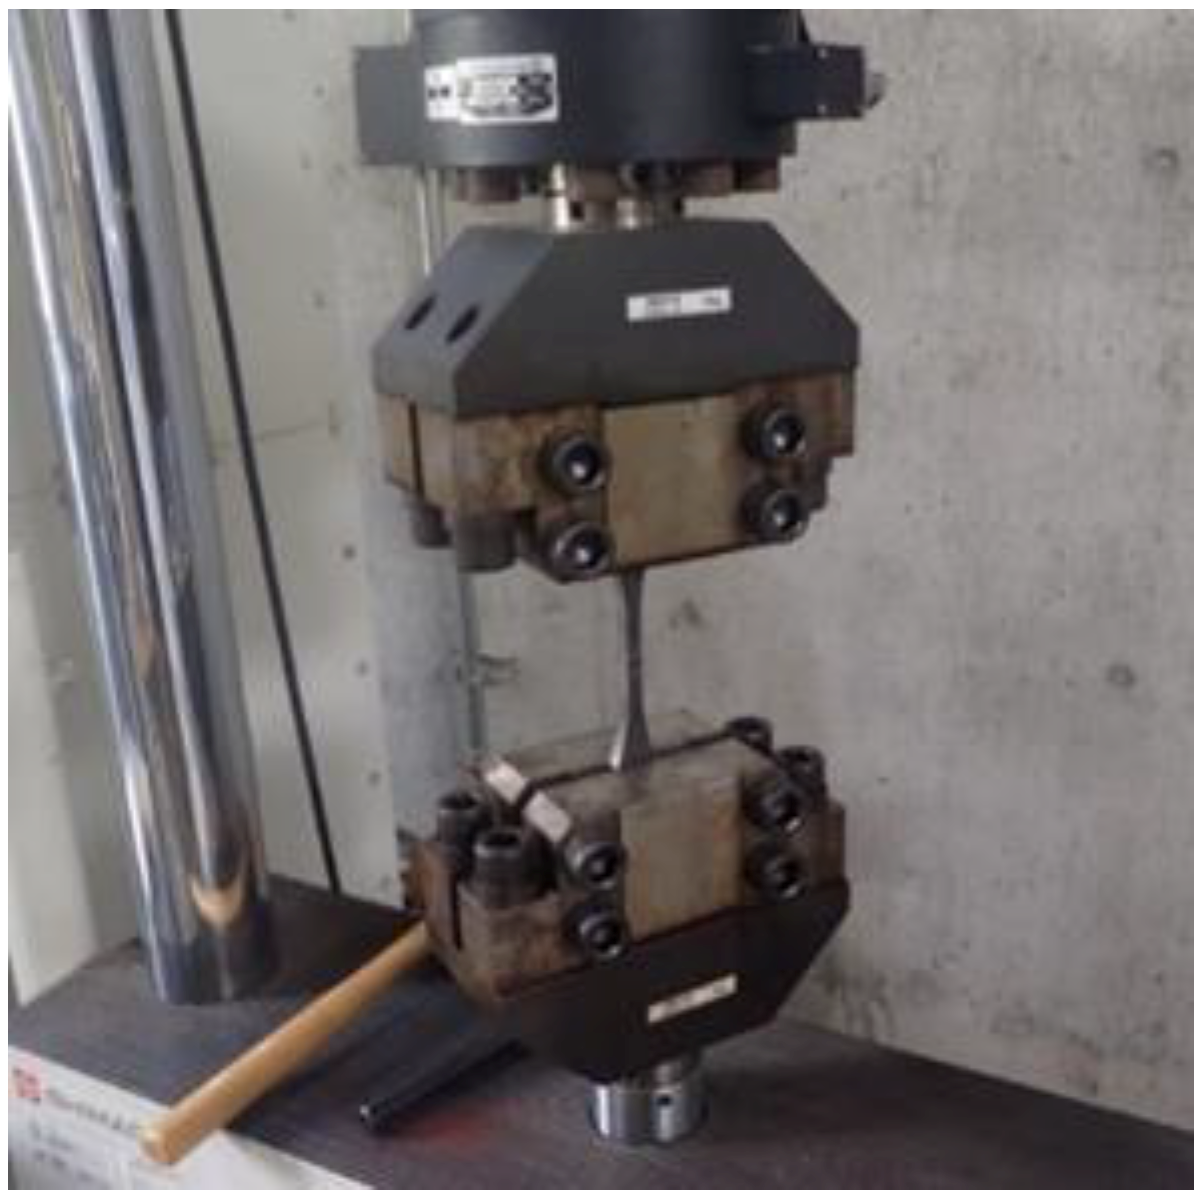
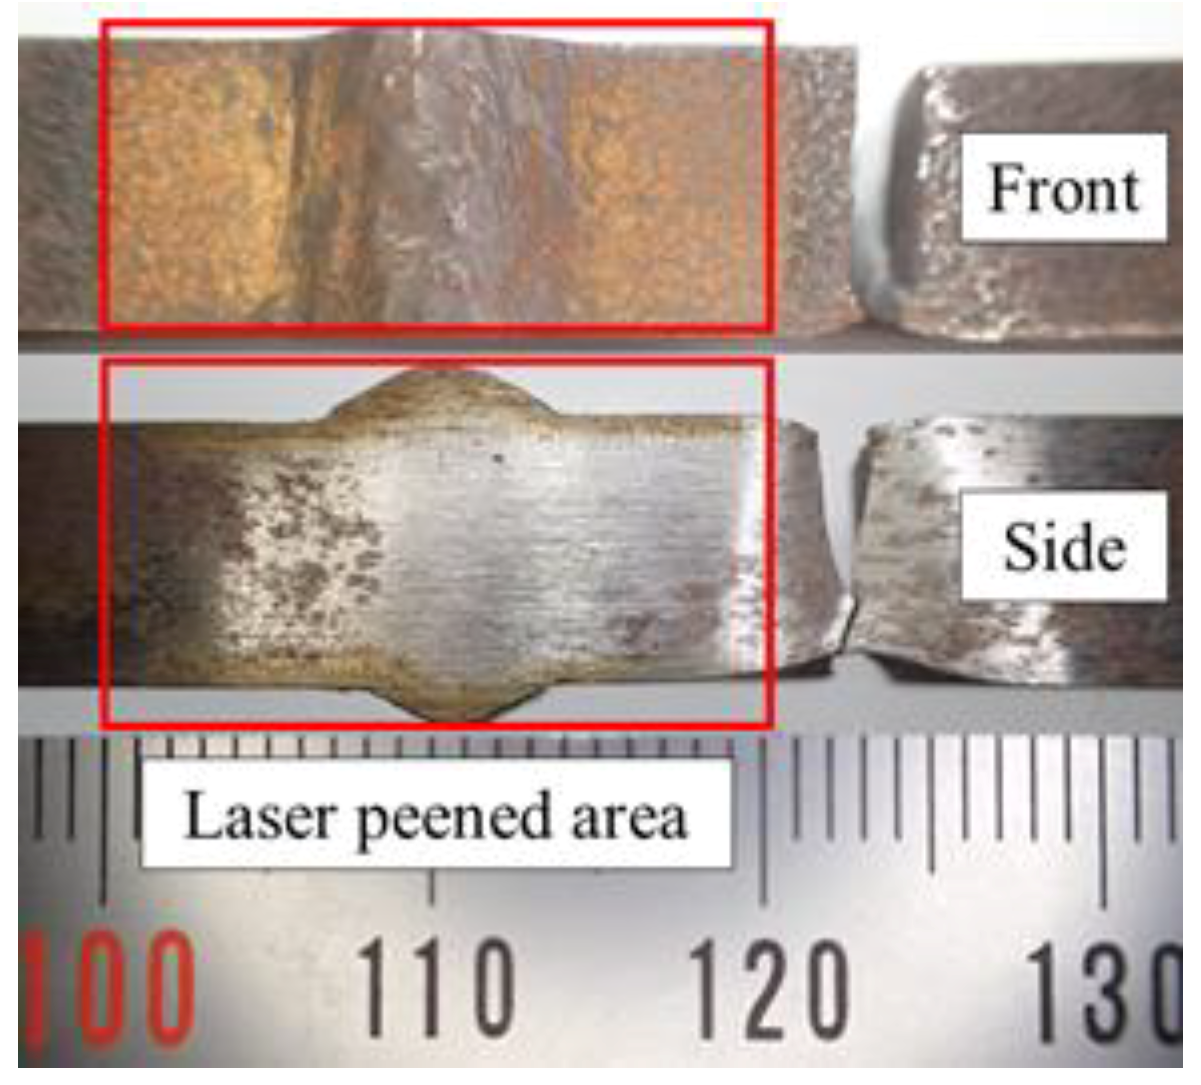
4.1. Experiment Overview

The fatigue tests were carried out in order to examine whether fatigue strength is improved by the generated compressive residual stress. The laser pulse energy of 15 mJ chosen in the previous chapter was adopted for laser peening. The test specimen was a steel plate of 9 mm thickness, which was welded by V-groove butt welding, sawn into a 30 mm width and finished to a prescribed size by machining. HT780 (σu = 833 MPa, σy = 764 MPa) was used for the plate. The welding method was gas-shielded arc welding using carbon dioxide. Solid wire of 780 MPa grade steel was used as welding material, with two layers on the front and one layer on the back. The welding conditions on the front side were a welding current of 200–210 A, a welding voltage of 23–25 V, and a welding speed of 2 mm/s. The welding conditions on the back side were a welding current of 240 A, a welding voltage of 25 V, and a welding speed of 2 mm/s. The rise of excess metals was around 2 mm. Figure 13 shows the shape and dimensions of the test specimen.
Laser peening was applied for four specimens around 9 mm in width and 20 mm in length, including the weld toe of both sides of the test specimens. For comparison, three specimens without laser peening (NP) were also tested. Figure 14 shows the fatigue test. The testing machine is a 100 kN uniaxial fatigue testing machine. The stress range was in two levels of Δσ = 250 MPa and 300 MPa, and stress ratio was 0.1. The censored limit was set at 107 cycles, for comparison with the previous studies.
Table 3 shows the measurement results of surface residual stress at the weld toe of the test specimen with the confidence intervals after the ± symbols. With laser peening, the surface residual stress was around −450 MPa. Compared with the case without laser peening, a large compressive residual stress was generated at the weld toe.

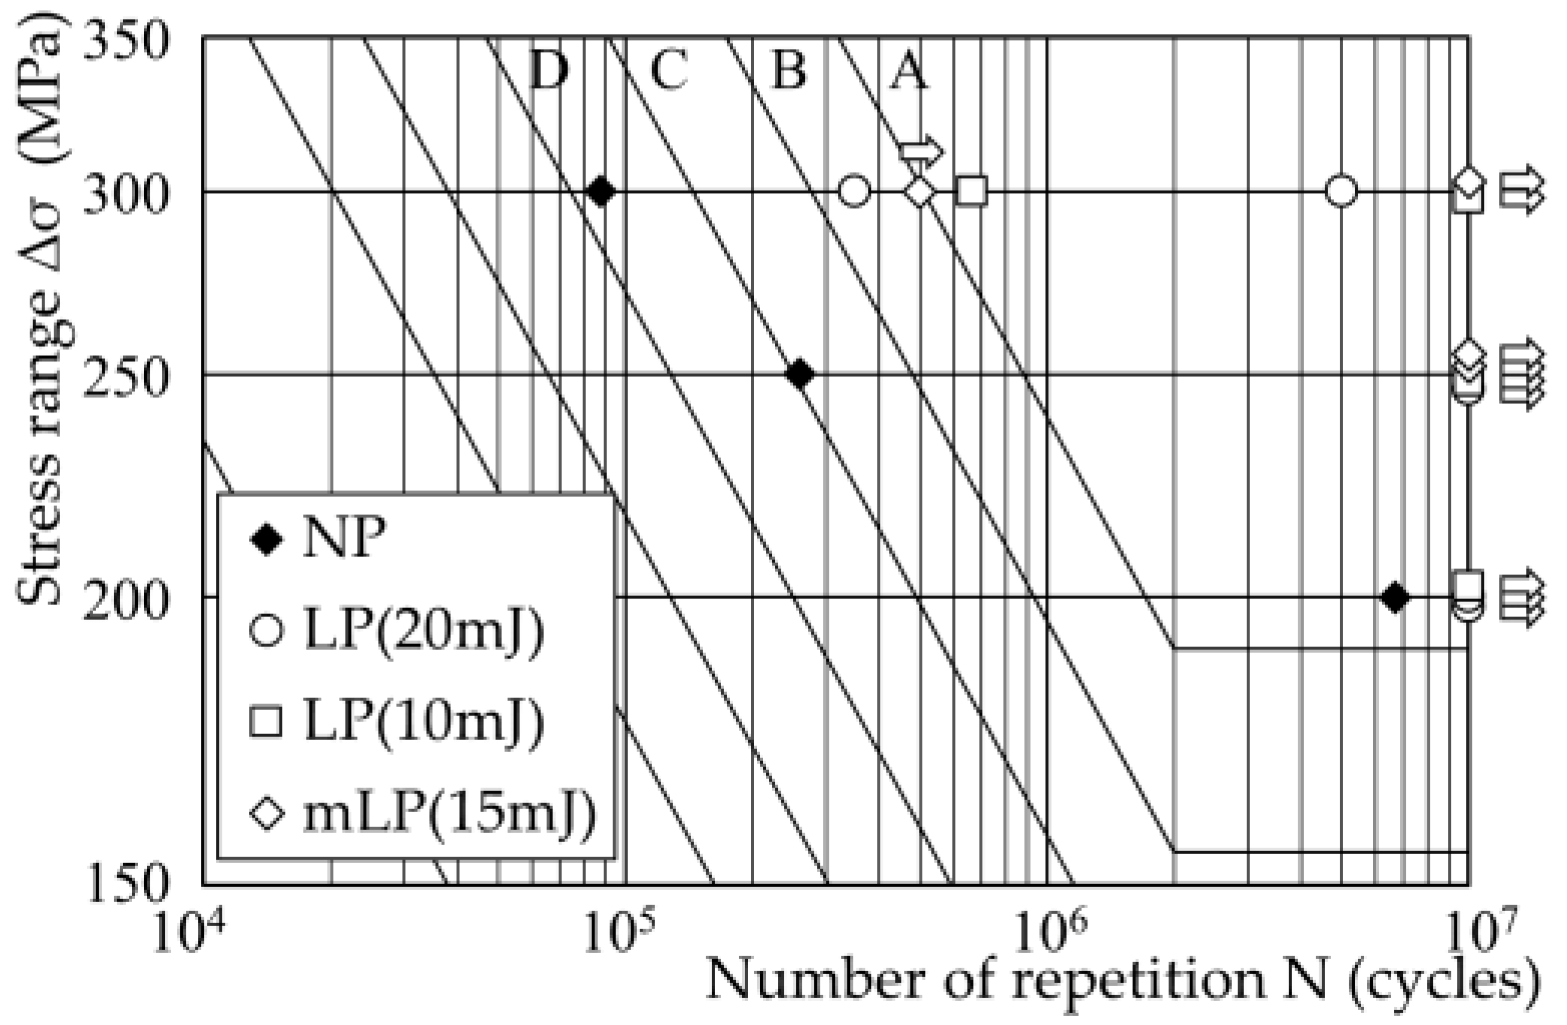
4.2. Experiment Results

A plot of the test results is shown in Figure 15. The present result is shown as mLP (15 mJ), and the result of the test specimen without laser peening is displayed as NP. The result of the previous studies is also shown as LP (10 mJ) and LP (20 mJ). The number of repetition cycles for the NPs were about 2.6 × 10⁵ cycles for Δσ = 250 MPa and about 9 × 10⁴ cycles for Δσ = 300 MPa. Both fractured from the weld toe on the front side. In the case of mLP with Δσ = 250 MPa, the two specimens did not break and reached the censored limit. In the case of Δσ = 300 MPa, one specimen was fractured at about 5.0 × 10⁵ cycles from the boundary between the area where laser peening was applied and the unapplied part on the front side, as shown in Figure 16. Another specimen reached the censored limit. In Figure 15, it is shown that these values are exceeded by adding arrow marks to those that reached the censored limit and those that were broken outside the laser peening area. For reference, the specimens in previous studies broke at the weld toe.
These results on mLP are equivalent to the previous studies results with a conventional large laser, and it can be said that there is a large improvement in fatigue strength. As a result, it was found that laser peening using a microchip laser was effective in improving fatigue strength.

5. Conclusions

The authors carried out laser peening with a microchip laser at pulse energies of 15 mJ, 10 mJ, and 5 mJ on an HT780, and evaluated the distribution of generated residual stress in the plate thickness direction and the fatigue life of a butt-welded joint with and without laser peening. The following conclusions were drawn.
  • The laser peening conditions were identified in which compressive residual stress is generated at pulse energies of 15 mJ, 10 mJ, and 5 mJ.
  • The fatigue life of a butt-welded joint subjected to laser peening at a pulse energy of 15 mJ was prolonged, becoming equivalent to the fatigue life at pulse energies of 20 mJ and 10 mJ applied by a large conventional laser in the previous studies.
Since the test specimen used in this study was small, it may not lead to improved fatigue strength by the dimensional effect in real structures. It is necessary to assess the fatigue strength improvement effect on a large test specimen, considering the application to real structures in future. In addition, the laser peening conditions in which large and deep compressive residual stress is generated will be selected, and the effect will be confirmed in various joints, including large test specimens.

Author Contributions

Conceptualization, Y.S. (Yoshihiro Sakino) and Y.S. (Yuji. Sano); data curation, Y.S. (Yoshihiro Sakino) and Y.S. (Yuji. Sano); formal analysis, T.K.; funding acquisition, Y.S. (Yoshihiro Sakino); investigation, T.K. and Y.S. (Yoshihiro Sakino); methodology, Y.S. (Yoshihiro Sakino) and (Yuji. Sano); project administration, Y.S. (Yoshihiro Sakino) and Y.S. (Yuji. Sano); resources, Y.S. (Yoshihiro Sakino); supervision, Y.S. (Yoshihiro Sakino) and Y.S. (Yuji. Sano); validation, Y.S. (Yoshihiro Sakino) and Y.S. (Yuji. Sano); visualization, T.K; writing—original draft, T.K.; writing—review & editing, Y.S. (Yoshihiro Sakino) and Y.S. (Yuji. Sano). All authors have read and agreed to the published version of the manuscript.

Funding

This work was partially supported by Foundation Research (B) of JSPS (project number 19H02228). The fatigue test was supported by the Steel Research Laboratory of JFE Steel Corporation.

Institutional Review Board Statement

Not applicable.

Informed Consent Statement

Not applicable.

Data Availability Statement

Data set available on request to corresponding authors.

Conflicts of Interest

The authors declare no conflict of interest.

References

  1. De Los Rios, E.R.; Walley, A.; Milan, M.T.; Hammersley, G. Fatigue crack initiation and propagation on shot-peened surfaces in A316 stainless steel. Int. J. Fatigue 1995, 17, 493–499. [Google Scholar] [CrossRef]
  2. Chung, Y.-H.; Chen, T.-C.; Lee, H.-B.; Tsay, L.-W. Effect of Micro-Shot Peening on the Fatigue Performance of AISI 304 Stainless Steel. Metals 2021, 11, 1408. [Google Scholar] [CrossRef]
  3. Soyama, H.; Takeo, F. Comparison between cavitation peening and shot peening for extending the fatigue life of a duralumin plate with a hole. J. Mater. Process. Technol. 2016, 227, 80–87. [Google Scholar] [CrossRef]
  4. Takahashi, K.; Osedo, H.; Suzuki, T.; Fukuda, S. Fatigue strength improvement of an aluminum alloy with a crack-like surface defect using shot peening and cavitation peening. Eng. Fract. Mech. 2018, 193, 151–161. [Google Scholar] [CrossRef]
  5. Soyama, H. Comparison between the improvements made to the fatigue strength of stainless steel by cavitation peening, water jet peening, shot peening and laser peening. J. Mater. Process. Technol. 2019, 269, 65–78. [Google Scholar] [CrossRef]
  6. Anami, K.; Miki, C.; Tani, H.; Yamamoto, H. Improving fatigue strength of welded joints by hammer peening and TIG-dressing. Doboku Gakkai Ronbunshu 2000, 17, 67–78. [Google Scholar] [CrossRef] [Green Version]
  7. Ishikawa, T.; Shimizu, M.; Tomo, H.; Kawano, H.; Yamada, K. Effect of compression overload on fatigue strength improved by ICR treatment. Int. J. Steel Struct. 2013, 13, 175–181. [Google Scholar] [CrossRef]
  8. Roy, S.; Fisher, J.W.; Yen, B.T. Fatigue resistance of welded details enhanced by ultrasonic impact treatment (UIT). Int. J. Fatigue 2003, 25, 1239–1247. [Google Scholar] [CrossRef]
  9. Mori, T.; Shimanuki, H.; Tanaka, M. Influence of Steel Static Strength on Fatigue Strength of Web-Gusset Welded Joints with UIT. J. JSCE 2015, 3, 115–127. [Google Scholar] [CrossRef] [Green Version]
  10. Sano, Y.; Mukai, N.; Okazaki, K.; Obata, M. Residual stress improvement in metal surface by underwater laser irradiation. Nucl. Instrum. Methods Phys. Res. Sect. B Beam Interact. Mater. At. 1997, 121, 432–436. [Google Scholar] [CrossRef]
  11. Sano, Y. Quarter Century Development of Laser Peening without Coating. Metals 2020, 10, 152. [Google Scholar] [CrossRef] [Green Version]
  12. Sims, W.; Elias, V. Laser peening for long term operation. Nucl. Plant J. 2018, 36, 54–56. [Google Scholar]
  13. Rankin, J.E.; Hill, M.R.; Hackel, L.A. The effects of process variations on residual stress in laser peened 7049 T73 aluminum alloy. Mater. Sci. Eng. A 2003, 349, 279–291. [Google Scholar] [CrossRef] [Green Version]
  14. Irizalp, S.G.; Koroglu, B.K.; Sokol, D. Influence of Laser Peening with and without Coating on the Surface Properties and Stress Corrosion Cracking Behavior of Laser-Welded 304 Stainless Steel. Met. Mater. Trans. A 2021, 52, 3302–3316. [Google Scholar] [CrossRef]
  15. Peng, W.W.; Ling, X. Prevention of Stress Corrosion Cracking in Welded Joint of Type 304 Stainless Steel by Laser Peening. Key Eng. Mater. 2007, 353, 1704–1707. [Google Scholar] [CrossRef]
  16. Lu, J.Z.; Zhang, W.Q.; Jing, X.; Wu, L.J.; Luo, K.Y. Microstructural evolution in the welding zone of laser shock peened 316 L stainless steel tube. J. Laser Appl. 2017, 29, 012007. [Google Scholar] [CrossRef]
  17. Peyre, P.; Fabbro, R.; Merrien, P.; Lieurade, H.P. Laser shock processing of aluminium alloys. Application to high cycle fatigue behaviour. Mater. Sci. Eng. A 1996, 210, 102–113. [Google Scholar] [CrossRef]
  18. Kallien, Z.; Keller, S.; Ventzke, V.; Kashaev, N.; Klusemann, B. Effect of Laser Peening Process Parameters and Sequences on Residual Stress Profiles. Metals 2019, 9, 655. [Google Scholar] [CrossRef] [Green Version]
  19. Bovid, S.; Kattoura, M.; Clauer, A.; Vivek, A.; Daehn, G.; Niezgoda, S. Pressure amplification and modelization in laser shock peening of Ti-6Al-4V and AA7085 with adhesive-backed opaque overlays. J. Mater. Process. Technol. 2022, 299, 117381. [Google Scholar] [CrossRef]
  20. Ahmad, B.; Fitzpatrick, M.E. The effect of laser shock peening on hardness and microstructure in a welded marine steel. J. Eng. 2015, 2015, 115–125. [Google Scholar] [CrossRef]
  21. Sakino, Y.; Sano, Y.; Kim, Y. Application of laser peening without coating on steel welded joints. Int. J. Struct. Integr. 2011, 2, 332–344. [Google Scholar] [CrossRef]
  22. Sakino, Y.; Sano, Y.; Sumiya, R.; Kim, Y.-C. Major factor causing improvement in fatigue strength of butt welded steel joints after laser peening without coating. Sci. Technol. Weld. Join. 2012, 17, 402–407. [Google Scholar] [CrossRef]
  23. Sakino, Y.; Yoshikawa, K.; Sano, Y.; Sumiya, R. Effect of Laser Peening on Improving Fatigue Strength of Welded Rib of High-Strength Steel. Q. J. Jpn. Weld. Soc. 2016, 34, 20–25. [Google Scholar] [CrossRef] [Green Version]
  24. Zheng, L.; Kausas, A.; Taira, L.Z.A.K.A.T. Drastic thermal effects reduction through distributed face cooling in a high power giant-pulse tiny laser. Opt. Mater. Express 2017, 7, 3214–3221. [Google Scholar] [CrossRef]
  25. Sakino, Y.; Sano, Y. Investigations for Lowering Pulse Energy of Laser-peening for Improving Fatigue Strength. Q. J. Jpn. Weld. Soc. 2018, 36, 153–159. [Google Scholar] [CrossRef] [Green Version]
  26. Tanaka, K. The cosα method for X-ray residual stress measurement using two-dimensional detector. Mech. Eng. Rev. 2019, 6, 18-00378. [Google Scholar] [CrossRef] [Green Version]
  27. Akiniwa, Y.; Kimura, H. Determination of Residual Stress Distribution in Severe Surface Deformed Steel by Shot Peening. Mater. Sci. Forum 2008, 571, 15–20. [Google Scholar] [CrossRef]
Figure 1. Underwater laser peening.
Applmech 02 00051 g001
Figure 2. Mechanism of residual stress improvement by laser irradiation.
Applmech 02 00051 g002
Figure 3. Schematic diagram of laser peening.
Applmech 02 00051 g003
Figure 4. Photograph of residual stress measurement.
Applmech 02 00051 g004
Figure 5. Specimen for residual stress measurement.
Applmech 02 00051 g005
Figure 6. Residual stress depth distribution (38 mJ).
Applmech 02 00051 g006
Figure 7. Residual stress depth distribution (15 mJ).
Applmech 02 00051 g007
Figure 8. Residual stress depth distribution (10 mJ).
Applmech 02 00051 g008
Figure 9. Residual stress depth distribution (5 mJ).
Applmech 02 00051 g009
Figure 10. Comparison of surface residual stress.
Applmech 02 00051 g010
Figure 11. Comparison of maximum residual stress.
Applmech 02 00051 g011
Figure 12. Comparison of residual stress depth distribution.
Applmech 02 00051 g012
Figure 13. Butt-welded specimen for fatigue test.
Applmech 02 00051 g013
Figure 14. Photo of fatigue test.
Applmech 02 00051 g014
Figure 15. Results of fatigue test.
Applmech 02 00051 g015
Figure 16. Photo of specimen after fatigue test.
Applmech 02 00051 g016
Table 1. Mechanical property and chemical composition.
Mechanical PropertiesChemical Compositions (%)Ceq
σYσUδYRCSiMnPSNiCrMoVB
(MPa)(MPa)(%)(%)×10−2×10−3×10−2×10−3×10−2
HT7807648332192222914992216101151
Welding wire *71083024-838125911222-63---
Ceq = C + Si/64 + Mn/6 + Ni/40 + Cr/5 + Mo/4 + V/14. *: catalogue value.
Table 2. Laser peening conditions and results of residual stress measurements.
Laser Peening ConditionSurface Residual StressLaser Type
Pulse EnergySpot DiameterIrradiation DensityPulse WidthFreQUENCYσξση
(mJ)(mm)(Pulse/mm2)(ns)(Hz)(MPa)(MPa)
380.301001.510−238−283Microchip
laser
(MOPA)
0.36−271−364
0.46−205−304
0.59−125−154
150.221000.710−62−40Microchip
laser
(MOPA)
0.37−45−187
0.50−10−54
1.095−47
100.191000.710−17−62Microchip
laser
(MOPA)
0.36−41−45
0.67−65−10
1.09−215
50.171000.710−28−19Microchip
laser
(MOPA)
0.34−34−92
0.68−558
1.11−9128
200.40180860−302−662Conventional
Nd:YAG
laser
100.25216−411−765
60.26144−320−597
Table 3. Result of residual stress measurement.
Surface Residual Stress (MPa)
Without laser peeningWith laser peening
25 ± 10−455 ± 6
Publisher’s Note: MDPI stays neutral with regard to jurisdictional claims in published maps and institutional affiliations.

