1. Introduction
Bone is a naturally occurring composite material whose constituent phases are hierarchically organised to provide a highly optimised structure that exhibits high stiffness and excellent resistance to fracture while also being lightweight for efficient movement. The complex structural arrangement of bone gives rise to anisotropic, rate-dependent failure behaviour, which varies significantly depending on tissue composition and architecture [
1,
2,
3]. This presents significant challenges in the development of surgical cutting instruments, which are required to generate sufficient forces to penetrate bone tissue while minimising the risk of thermo-mechanical damage to the surrounding tissue. The biomechanics of cutting processes is further complicated by the range of complex interactions taking place at the tool–bone interface, particularly when three-dimensional cutting processes such as sawing (James et al., 2014), drilling [
4] and burring [
5] are considered. Currently, instrument designers rely heavily on empirical-based strategies to understand tool–bone interactions, with significant amounts of prototyping and validation experiments required throughout the design process. Both experimental and computational models of two-dimensional orthogonal cutting are widely used as a platform to investigate the influence of key cutting parameters, such as tool geometry, cutting depth and/or feed rate, on overall cutting performance [
6,
7,
8,
9,
10]. However, the vast majority of these studies have focussed on cutting process in cortical bone, and to date, there is a distinct lack of studies examining the biomechanics of cutting in trabecular bone [
11].
Trabecular bone is a highly porous cellular structure composed of a complex microarchitecture, with its mechanical properties depending on numerous factors, including age, sex, species and anatomic site [
12,
13,
14]. Due to the inherent variability in trabecular bone mechanics, many experimental studies exploit commercially available trabecular bone analogue materials for biomechanical testing of cutting and drilling operations [
15,
16]. Synthetic bone substitutes are an attractive alternative to animal bone and cadaveric bone due to their availability, uniformity, low inter-specimen variability, reproducibility and clean testing environment. The most widely used synthetic substitute for trabecular bone comprises “cellular-rigid” and “solid-rigid” polyurethane (PU) foams that have been designed to replicate the cellular structure and mechanical properties as the tissue itself. Malak and Anderson [
8] used these PU foams of varying density and cell size (Sawbones, Pacific Research Labs, Malmö, Sweden) to carry out a detailed experimental investigation of the role of cutting parameters on overall cutting performance under orthogonal cutting conditions. Key features were identified, in particular that smaller tool rake angles and larger cutting depths produced larger cutting forces and more discontinuous chip formation, while higher rake angles at lower cutting depths tended towards more continuous chip formation. It was later demonstrated that many similar trends were observed when bovine trabecular bone was considered [
9]. While these experimental studies have identified key functional properties of tool performance and resulting chip formation, they fail to provide a detailed understanding of tool–bone interactions and features governing failure processes ahead of the tooltip, which has given rise to computational approaches for orthogonal cutting.
To date, the vast majority of computational modelling frameworks for orthogonal cutting have been developed for metal machining applications, in which robust predictions of chip formation, cutting forces and heat generation have been possible [
17,
18,
19]. These modelling frameworks benefit from relatively homogeneous material behaviour and several well-established plasticity formulations available that are available to describe the post-yield behaviour of metallic materials [
17,
19,
20]. By far, the most widely used plasticity formulation in cutting simulations is the Johnson–Cook model, which is a strain rate and temperature-dependent version of Von Mises plasticity [
21]. Although this model was developed for metals, many computational models of cutting processes in both cortical [
22] and trabecular bone [
23] have implemented the Johnson–Cook model in an attempt to capture post-yield behaviour, despite the complex material behaviour associated with both tissue types. To date, few studies (if any) have compared their predictions to experiments to determine the suitability of the Johnson–Cook model in predicting cutting processes in orthopaedic applications [
24,
25,
26]. In particular, it has been demonstrated that both Drucker–Prager and Crushable Foam plasticity formulations are more effective than Von Mises formulations in capturing post-yield behaviour of both trabecular bone and synthetic bone analogues [
27,
28], as they account for pressure-dependent yield hardening observed in these cellular solids. However, both the implementation and suitability of pressure-sensitive plasticity formulations in predicting cutting processes in cellular solid materials has not been explored in detail.
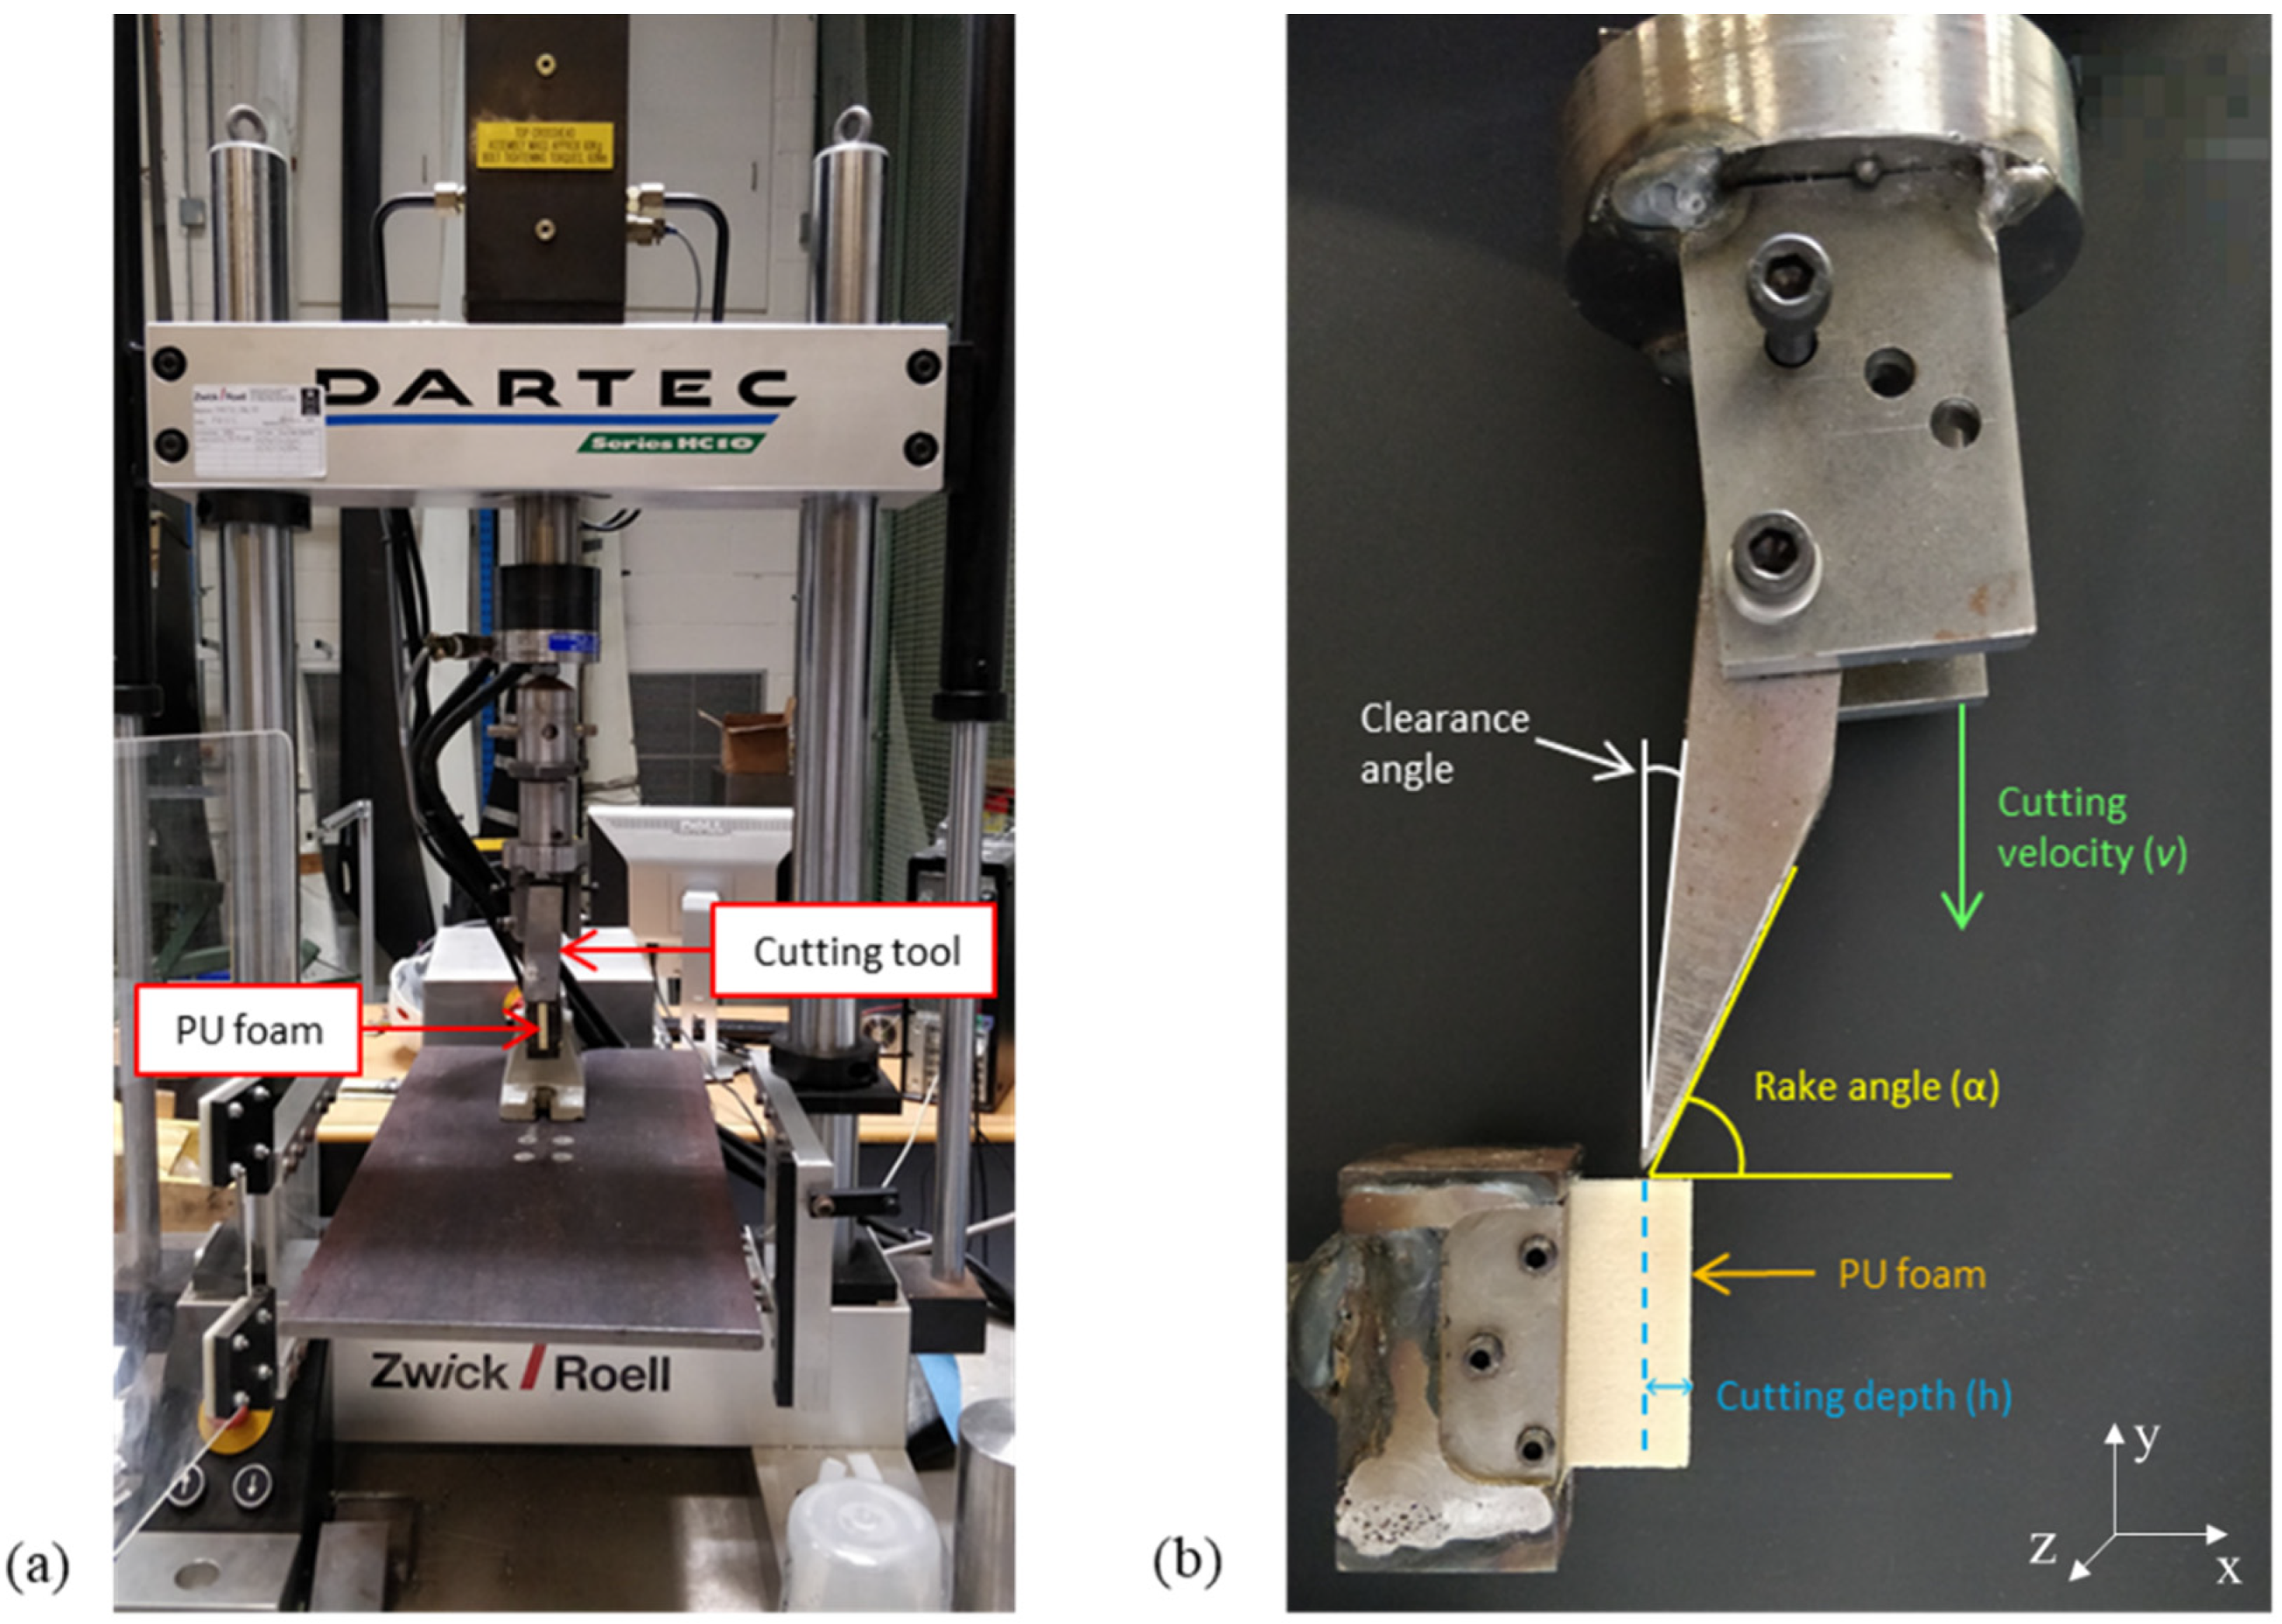
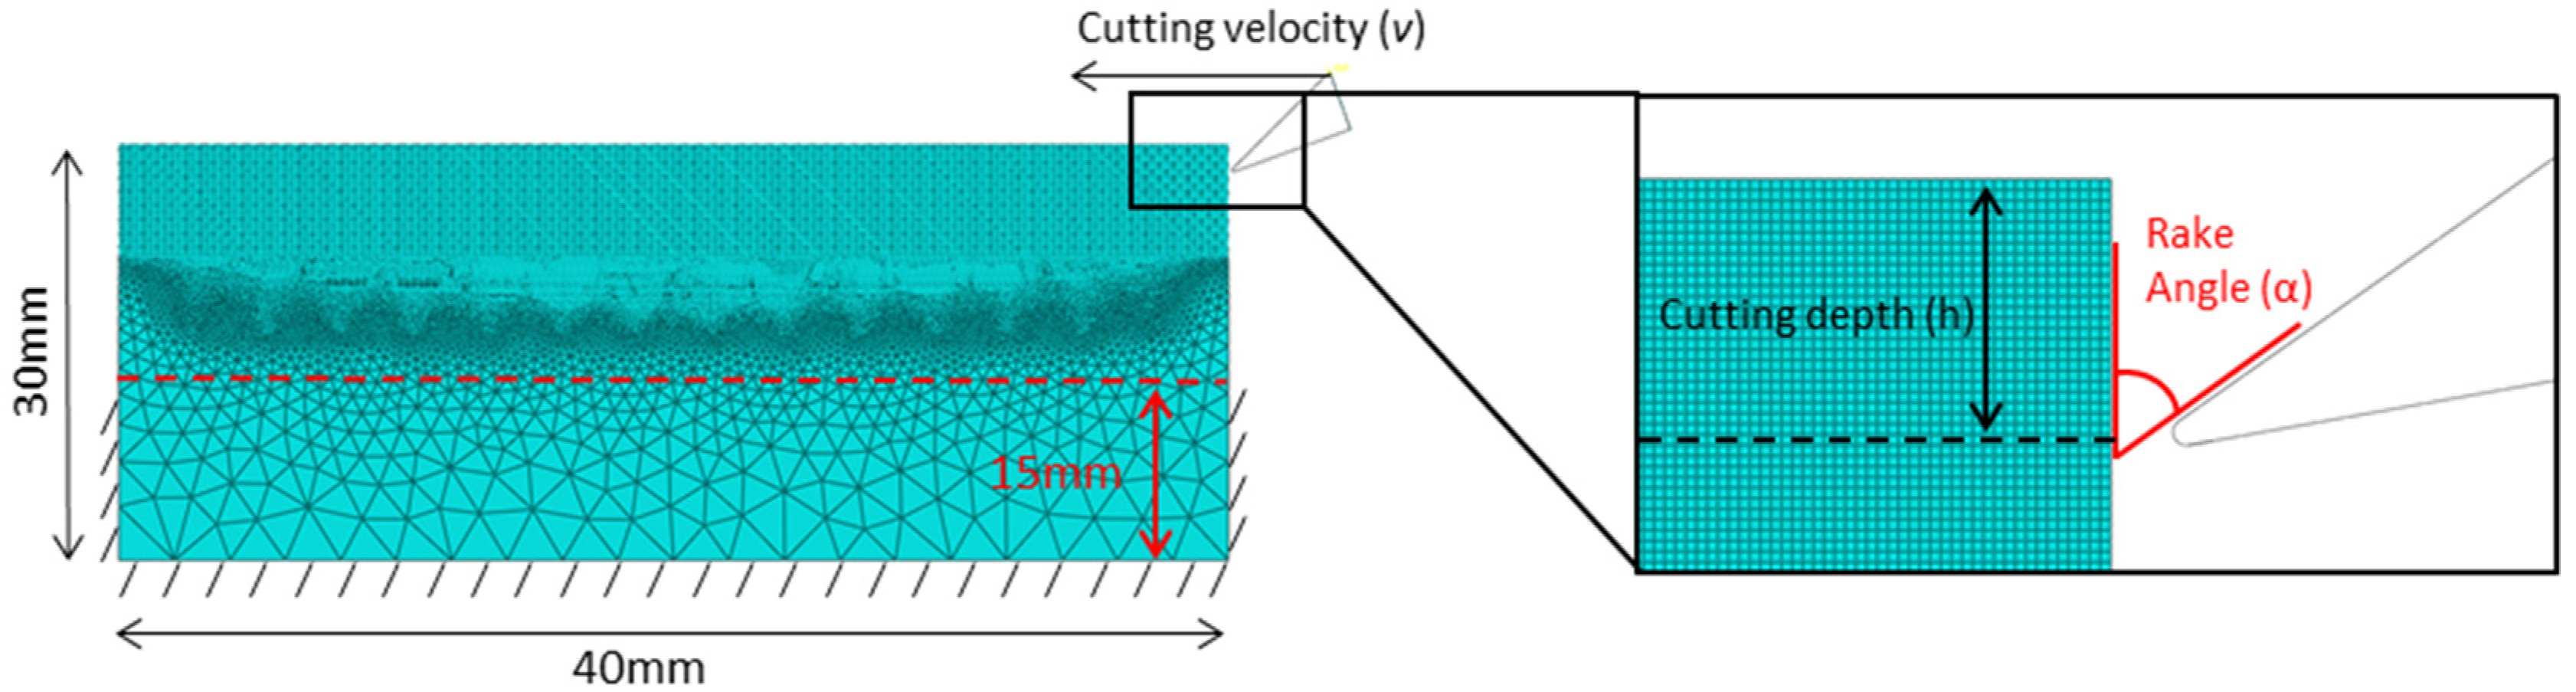
This study presents a computational modelling framework for two-dimensional orthogonal cutting of a synthetic trabecular bone analogue material (Sawbones, Pacific Research Labs, Malmö, Sweden). An experimental model of high-speed orthogonal cutting is developed, whereby an adaptable cutting tool fixture driven by a servo-hydraulic uniaxial test machine characterises cutting performance for a range of conditions. In parallel, a computational modelling framework for orthogonal cutting is presented, with the suitability of both Johnson–Cook and Isotropic Crushable Foam plasticity formulations evaluated. Using this combined experimental–computational approach, a systematic evaluation of the effects of various cutting parameters, such as rake angle and cutting depth, on cutting performance is presented.
4. Discussion
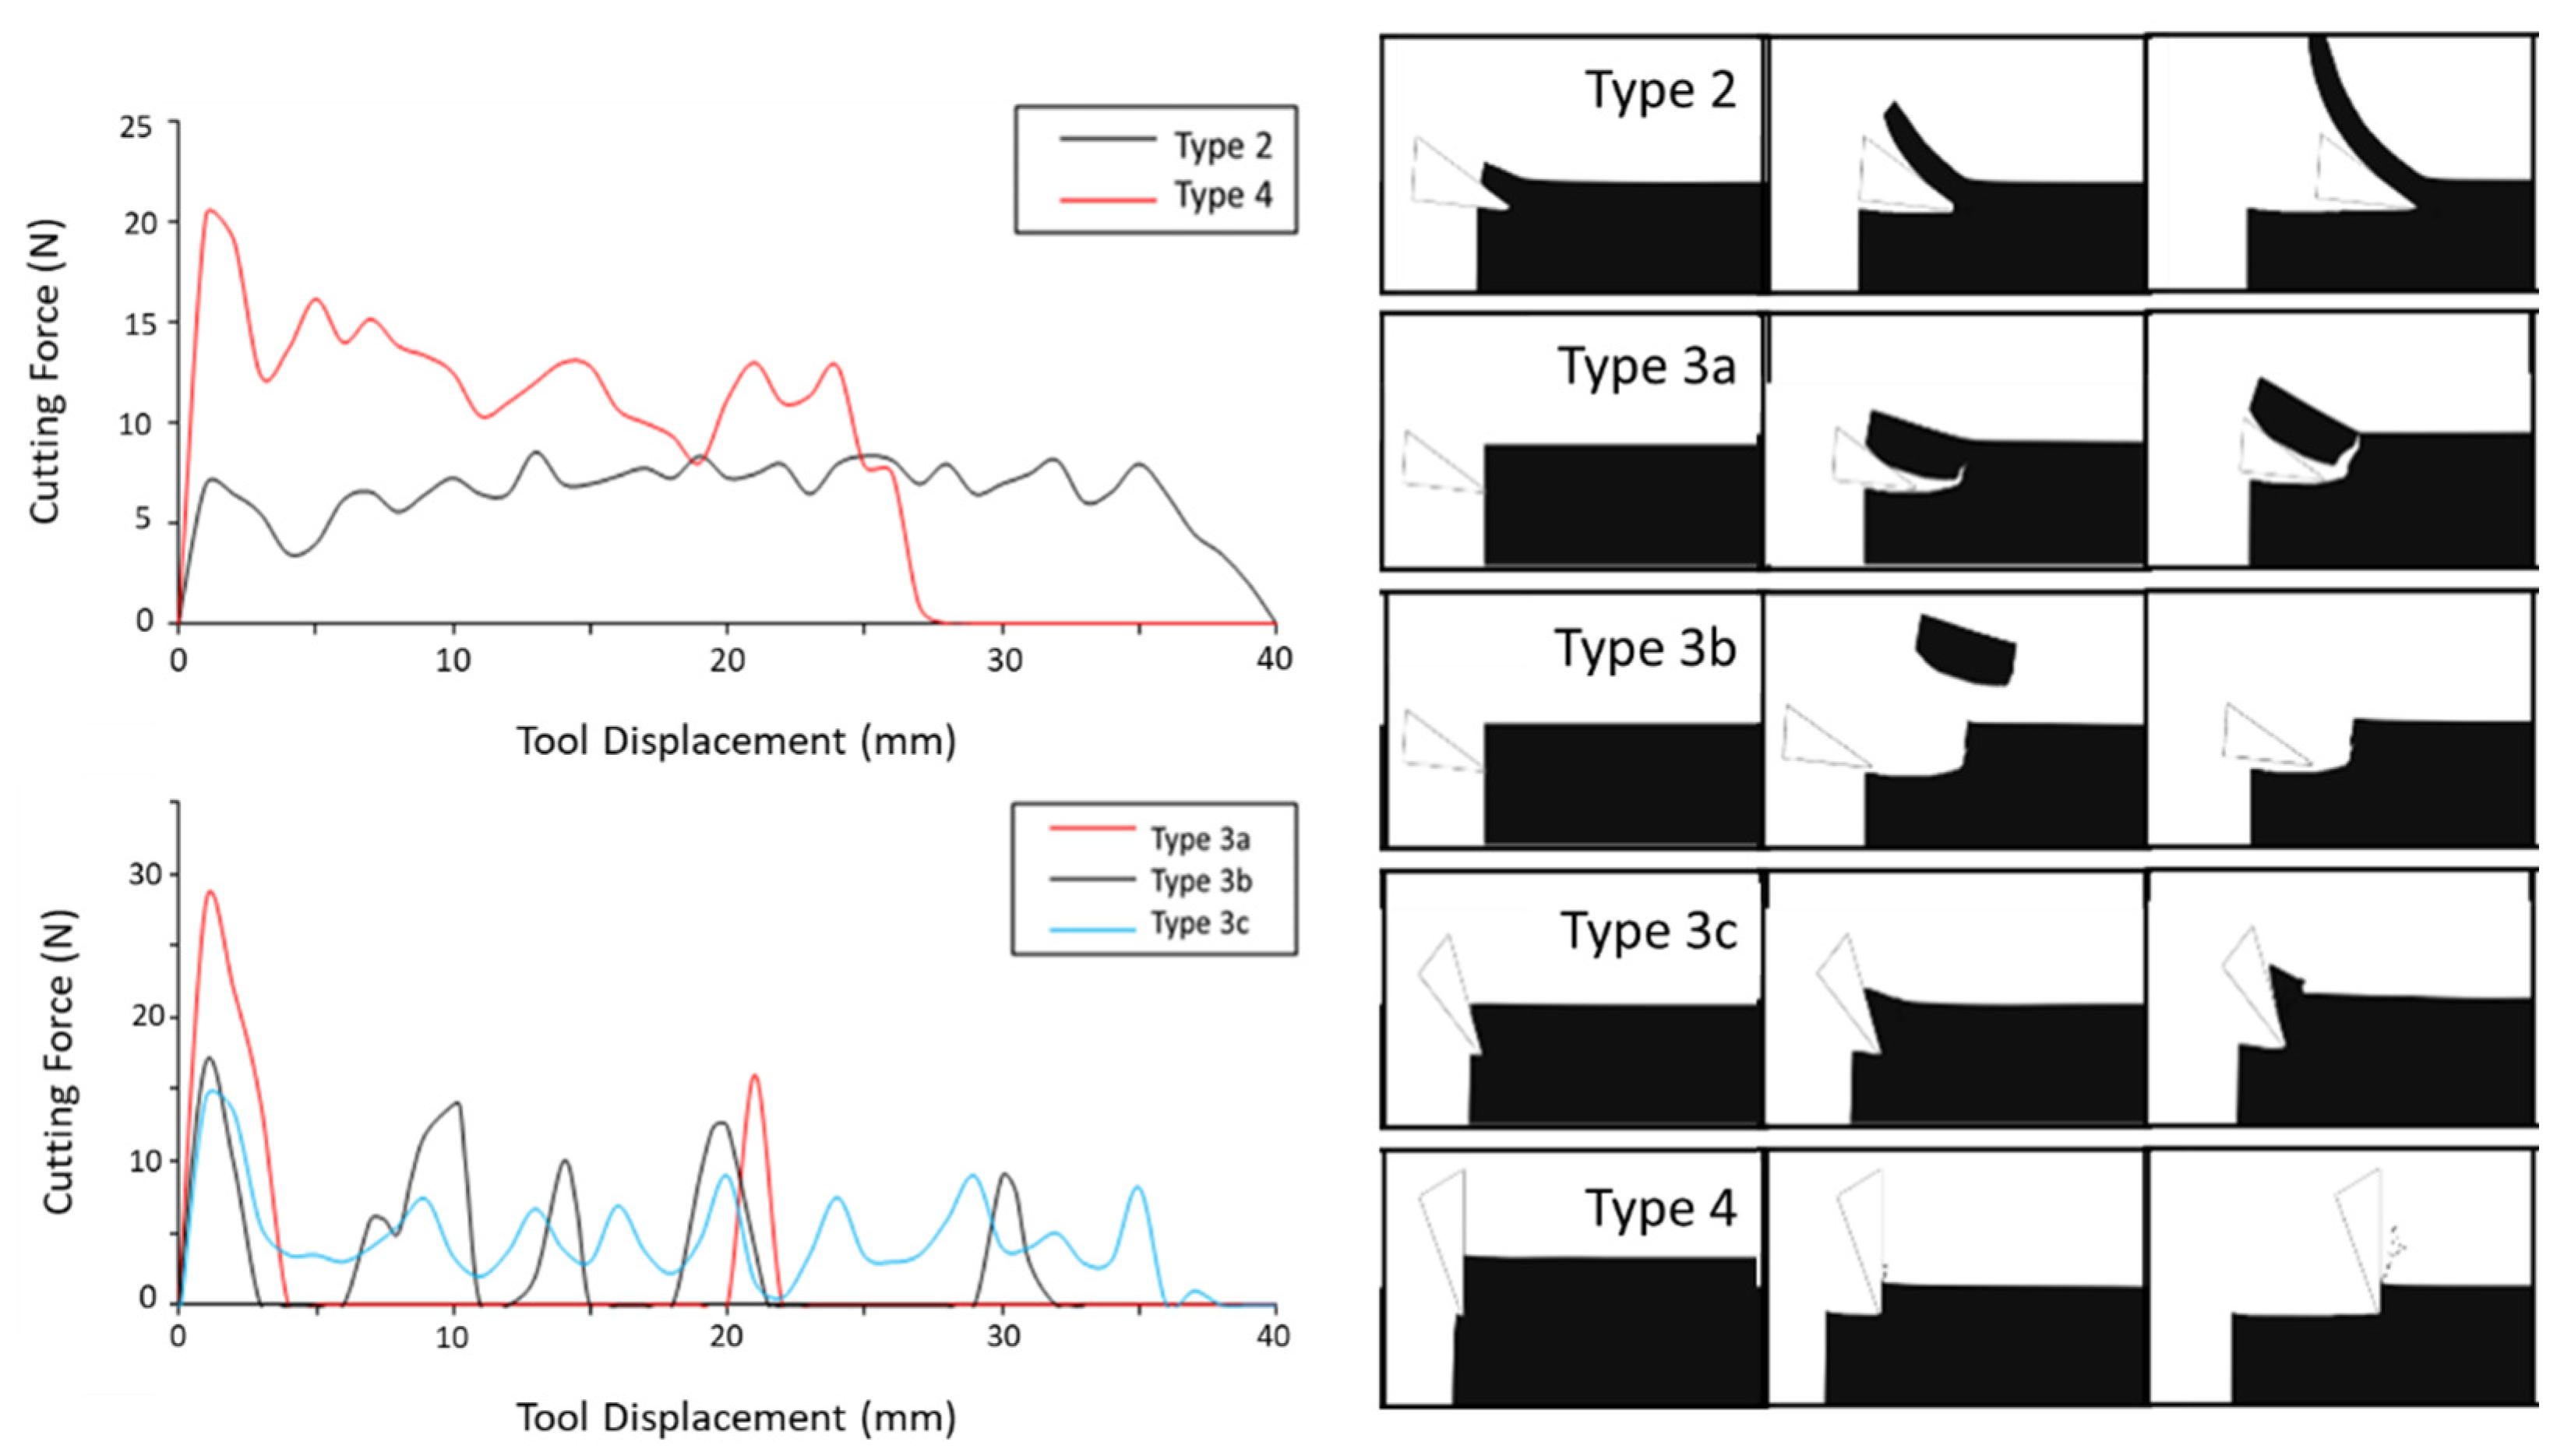
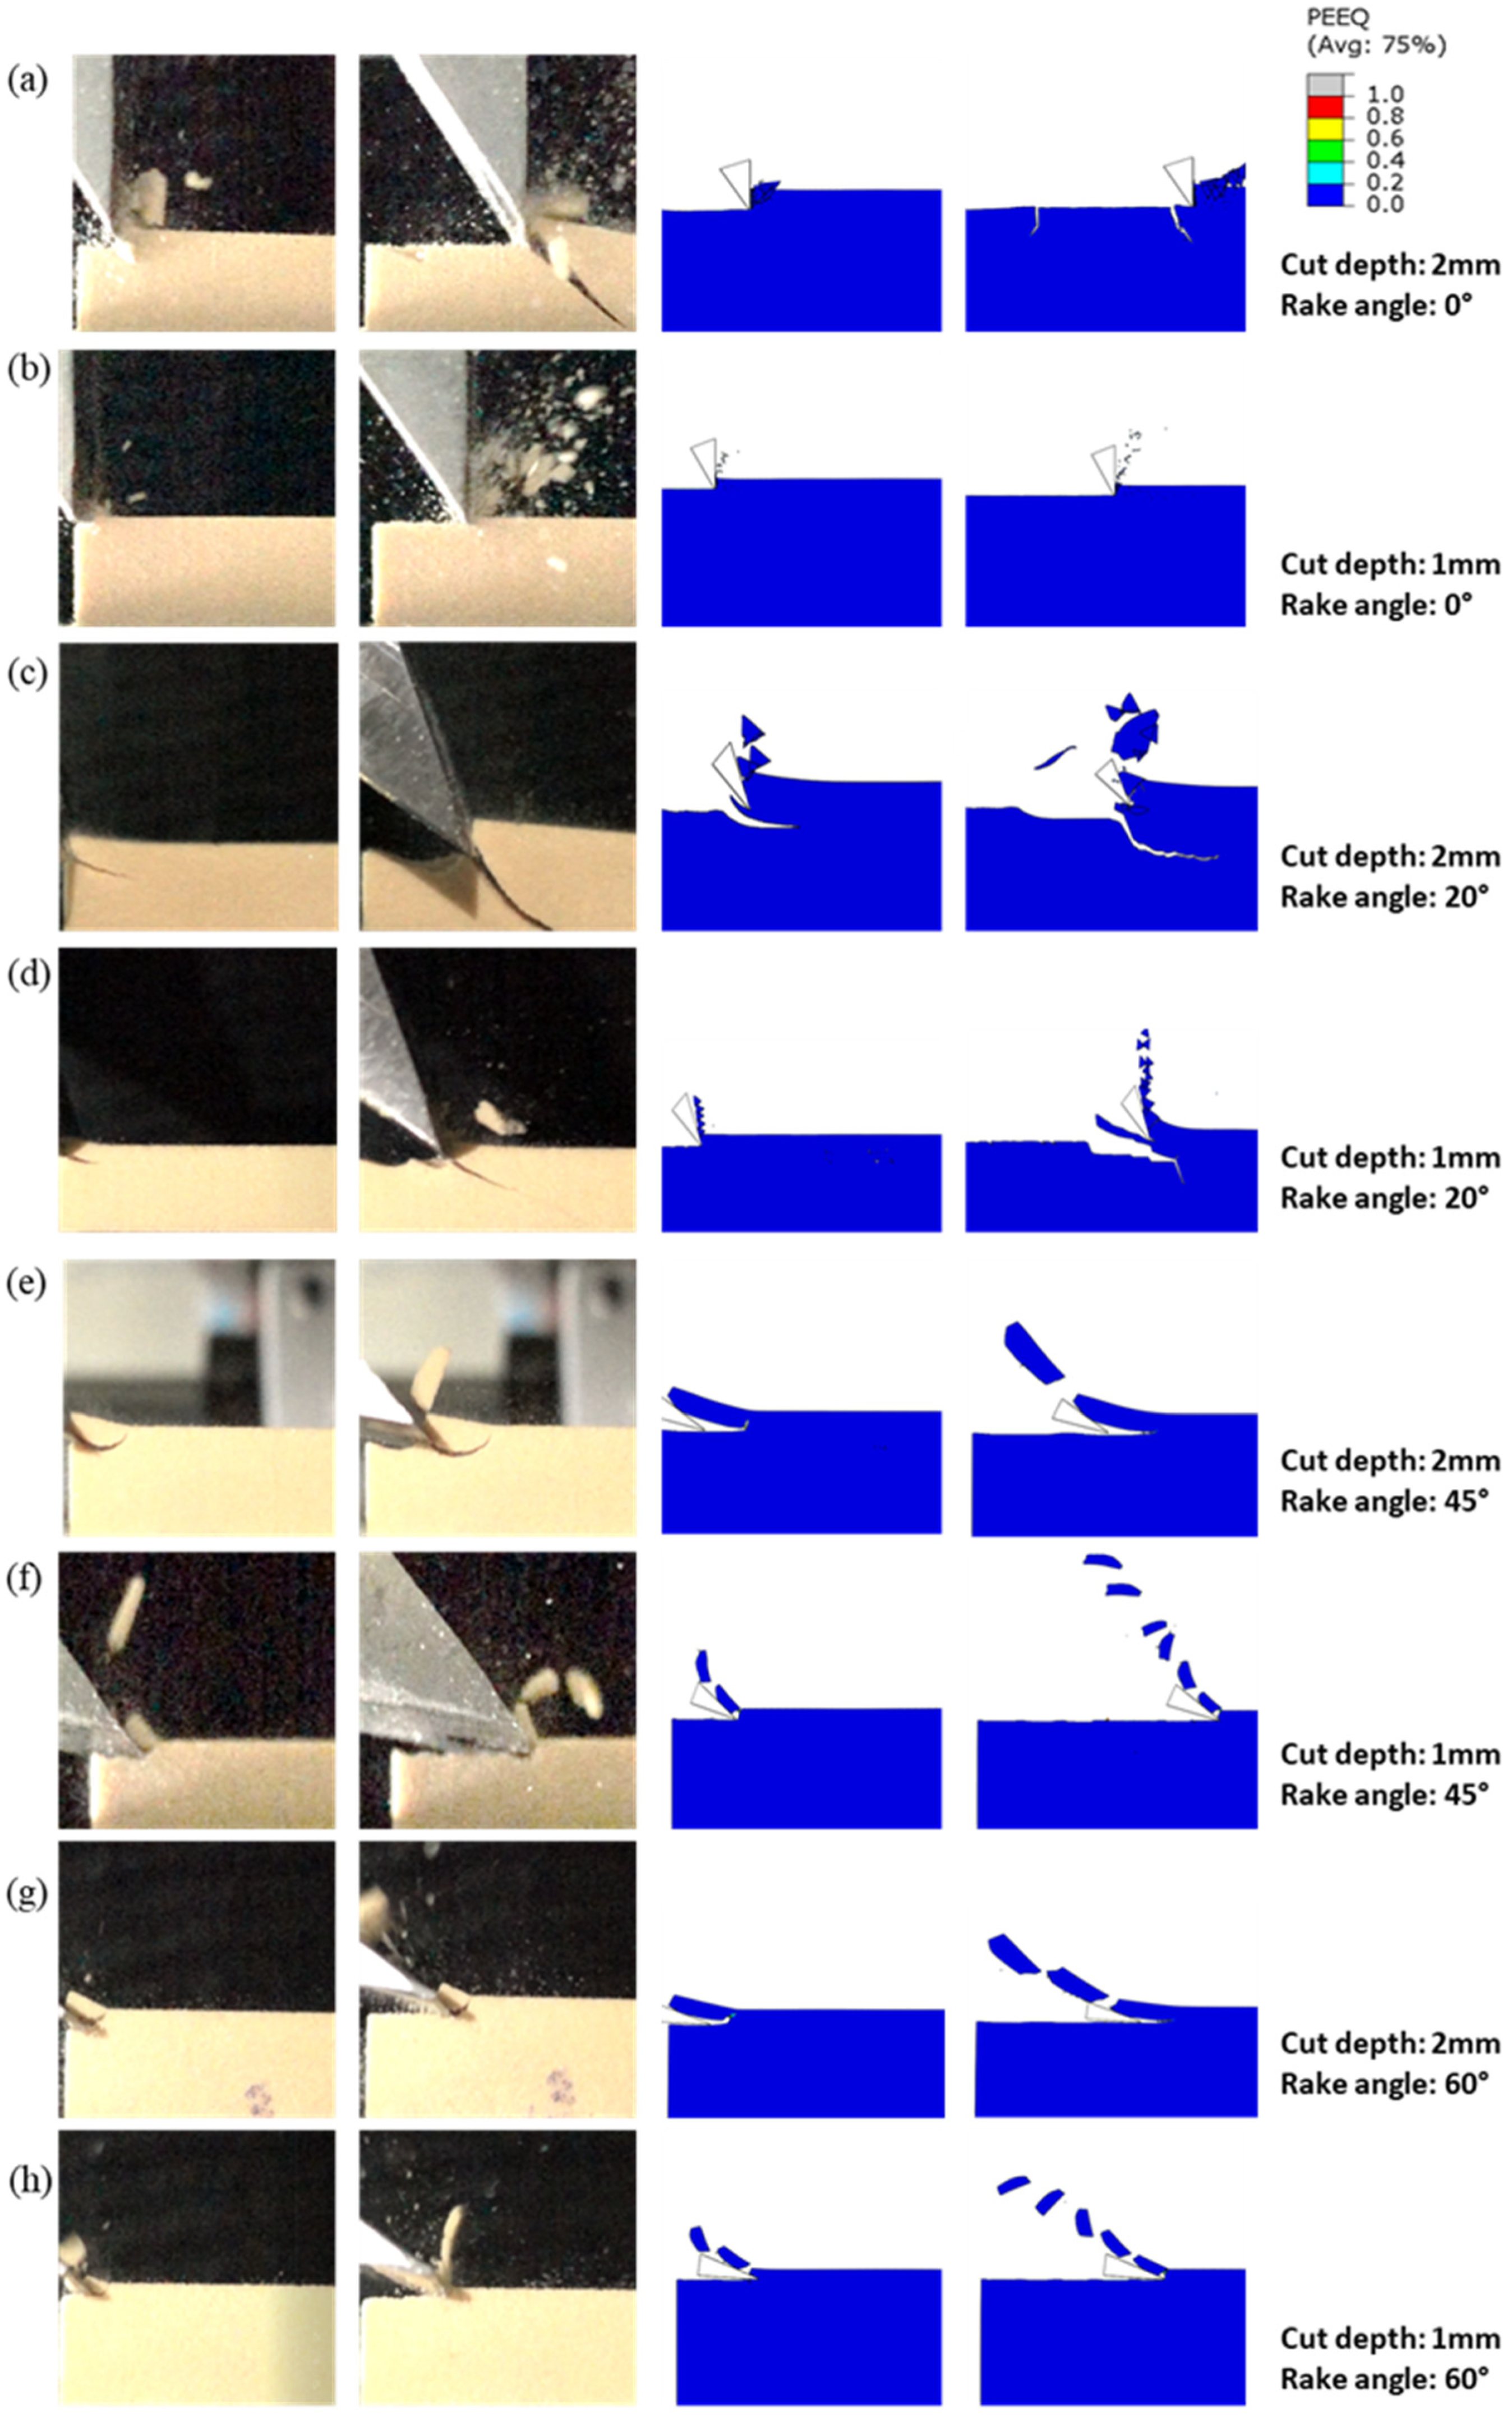
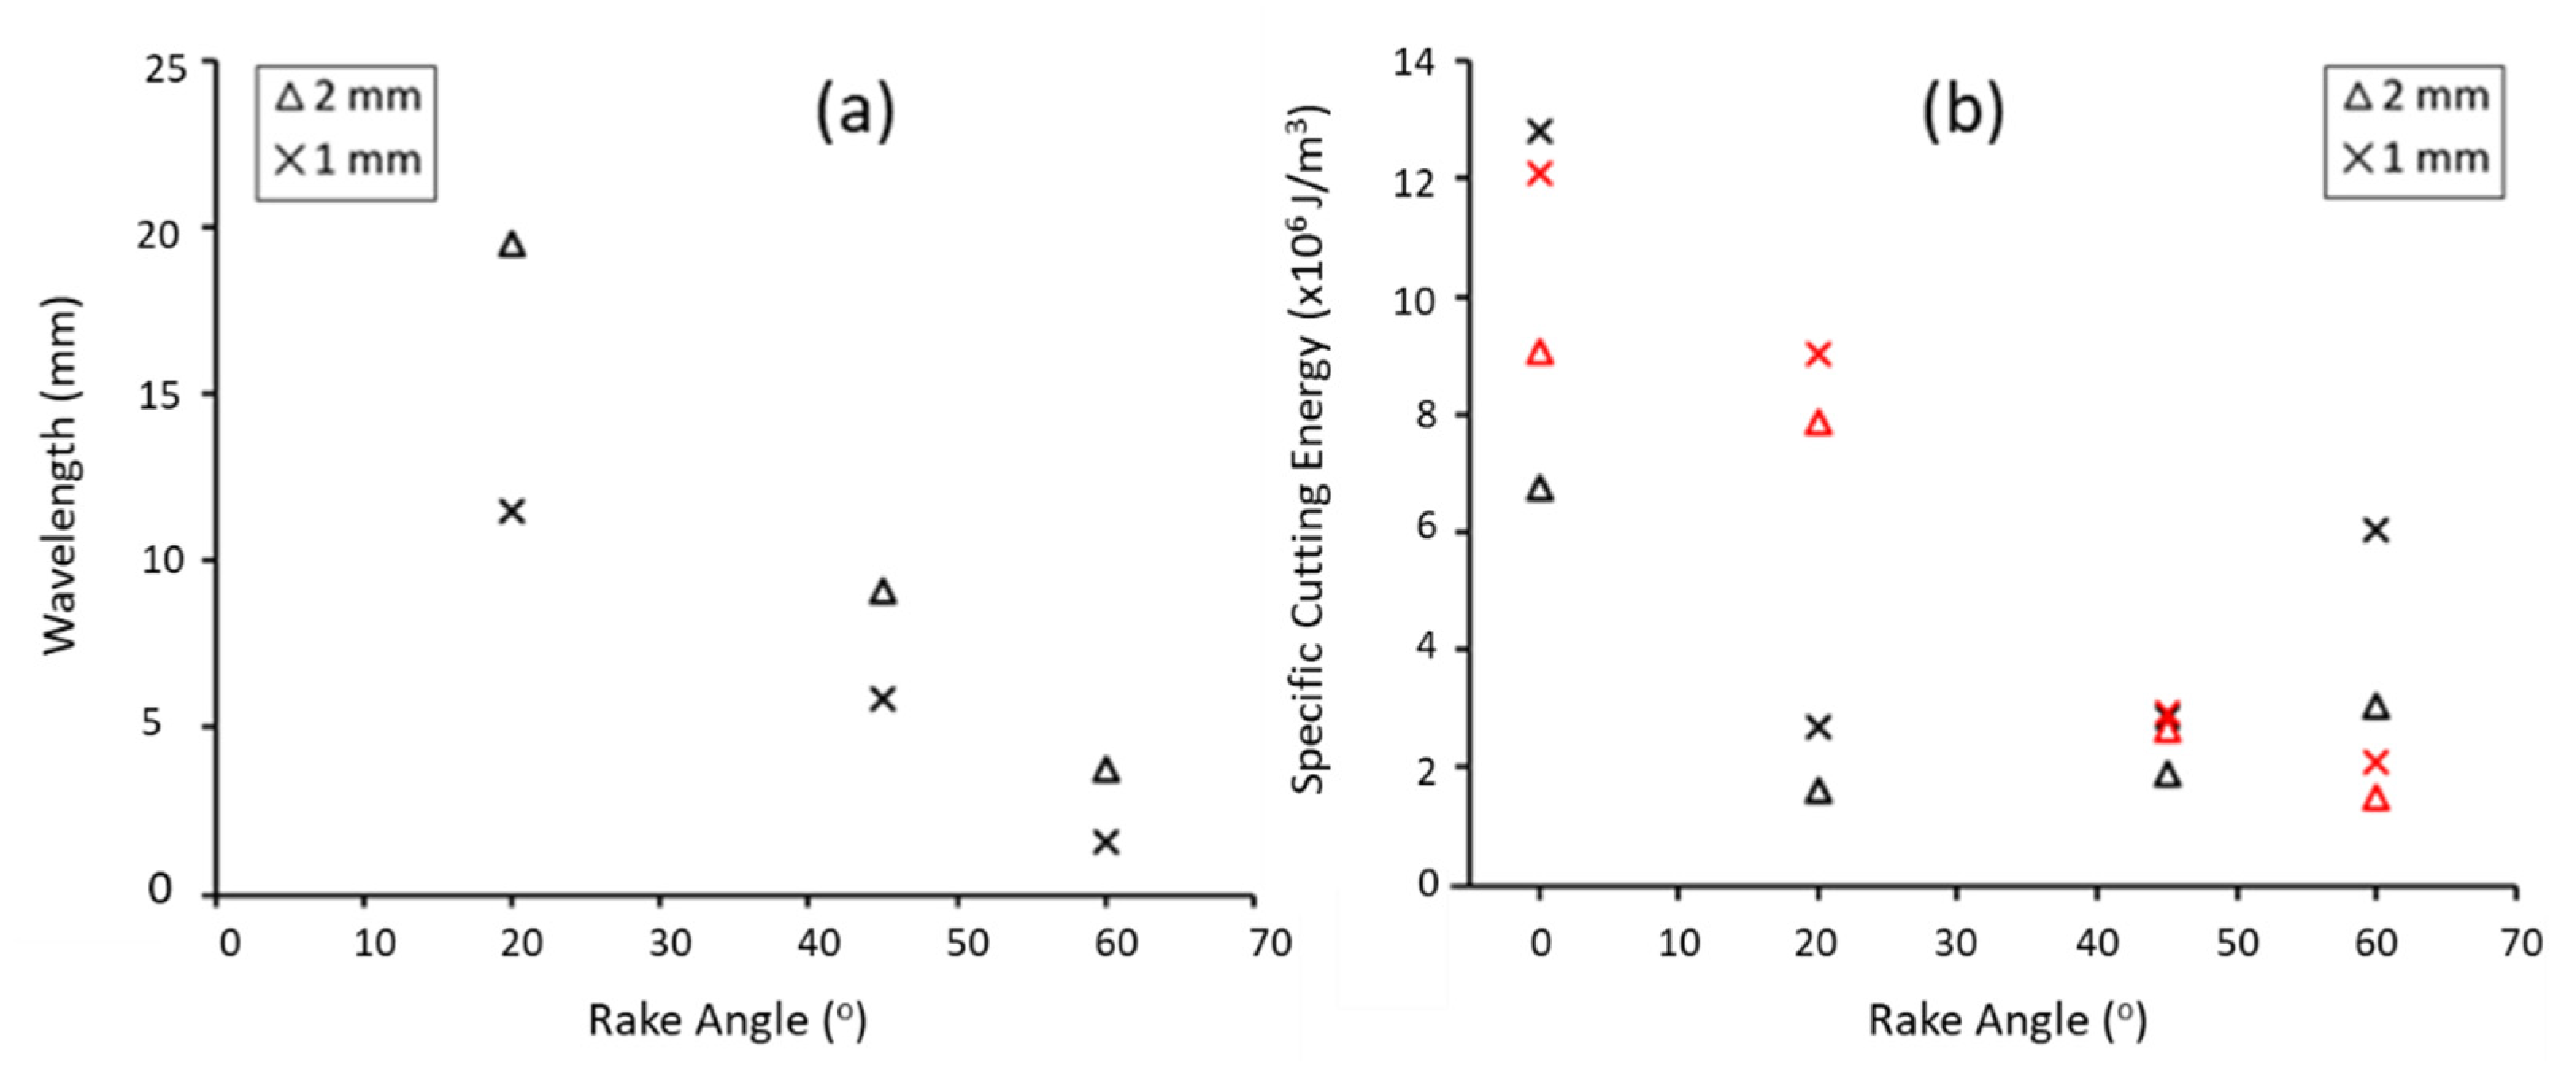
A combined experimental–computational approach was used to determine important relationships between key cutting parameters and overall cutting performance of synthetic trabecular bone analogue under high-speed orthogonal cutting conditions. The study presents a computational modelling framework for high-speed cutting of trabecular bone analogues, whose model parameters were determined experimentally. The modelling framework generally captured features of chip formation and axial cutting forces over a wide range of cutting parameters when compared with experimental measurements and observations and has the potential to be used to examine more complex three-dimensional cutting processes in the future. Through the development of a novel experimental cutting rig, this study represents the first investigation of the high-speed (
v = 200 mm s
−1) orthogonal cutting behaviour of PU foam. It was found that low rake angles (α = 0°) resulted in obliteration (Type 4) of the workpiece ahead of the tooltip and the highest cutting forces. Intermediate rake angles (20° < α < 45°) typically produced discontinuous chip formation, either through confined crack propagation and lifting of the chip (Type 3a), which was usually associated with smaller cutting depths or continuous crack propagation ahead of the cutting tool (Type 3b) at larger cutting depths. Higher rake angles (α = 60°) resulted in the lowest cutting forces and tended towards more continuous chip formation (Type 2), providing a smoother finish on the cut surface. It is interesting that features of chip formation observed at each rake angle and cutting depth here are largely similar to the orthogonal cutting experiments carried out by Malak and Anderson [
8], who tested a range of PU foams, however at much lower cutting speeds (v = 0.187 mm s
−1), suggesting that the cutting rate does not have a drastic effect on visual chip formation. Our study also identified a new mode of chip formation at a rake angle of α = 0°, defined as Type 4 chip formation, which describes compression failure ahead of the tooltip, resulting in the formation of fine dust and some material fragmentation. This observed behaviour could be relevant for the design of tools for burring operations, which tend to have very low (and sometimes negative) rake angles [
16]. Our study also presents the efficiency of the cutting processes using the specific cutting energy (
), a parameter defined as the energy consumed per unit volume of material removed [
31]. With the emergence of minimally invasive surgical techniques [
32], the requirement for more compact tools and surgical equipment with high cutting efficiency is becoming more important. The results from this study show that higher rake angles (α = 20–60°) generate lower specific cutting energies during the cutting process, a feature that could be exploited to optimise the design and efficiency of smaller surgical cutting tools.
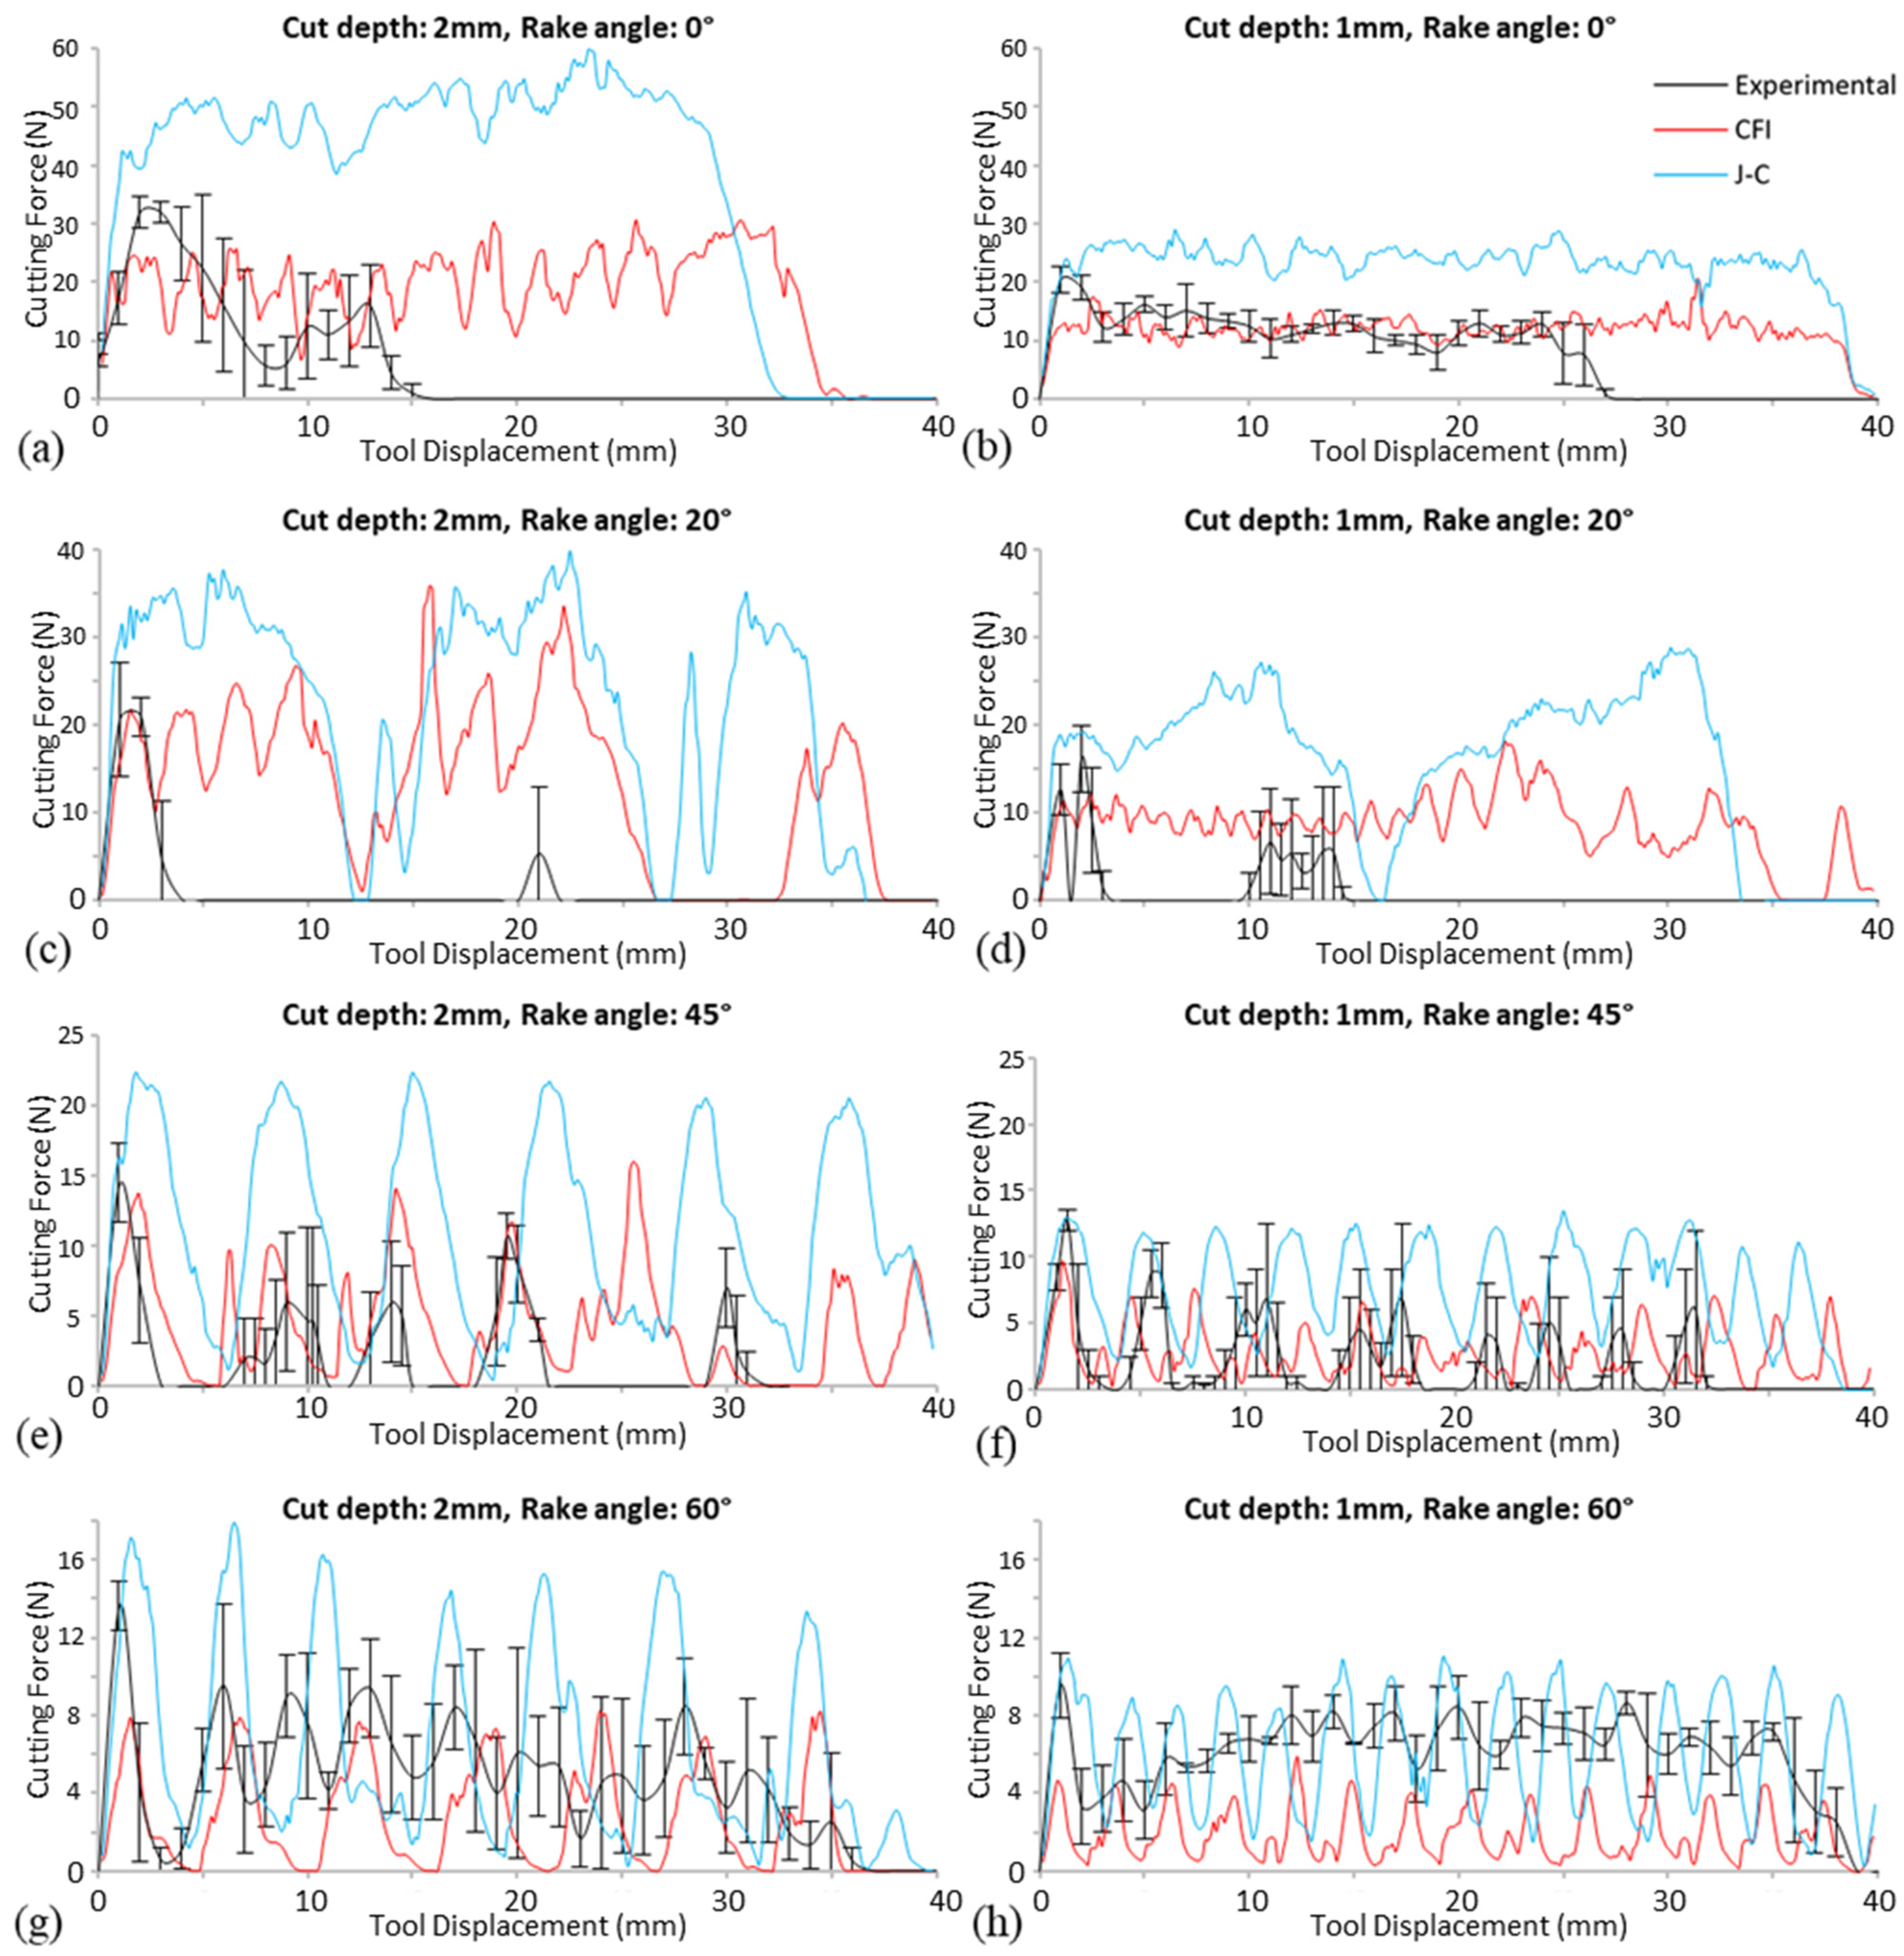
This study also developed a computational modelling framework for high-speed orthogonal cutting that generally captured the features of chip formation and cutting forces over a range of cutting parameters. This framework implements the strain rate- and pressure-dependent crushable foam yield criteria within the cutting model and directly compares its performance in capturing the experimental cutting process against the more widely used Johnson–Cook model (originally developed for metals), with material constants for both plasticity formulations determined experimentally. It is interesting that the CFI model provided a more accurate prediction of cutting forces, while the Johnson–Cook plasticity model consistently overestimated the cutting forces (see
Figure 6) in almost all cases. Previous studies have demonstrated that the yield behaviour of PU foams is pressure-dependent [
27] or, more specifically, depends on stress triaxiality (
), which is defined as the ratio of hydrostatic stress (
p) to Von Mises stress (
q). However, the most widely used plasticity formulation in cutting simulations is the Johnson–Cook model, which is a strain rate- and temperature-dependent version of Von Mises plasticity. This implies that yielding in the Johnson–Cook model is independent of hydrostatic stress/triaxiality. This model should work well where deformation is relatively unconfined or where stress triaxiality values are between
= −0.33 and
= 0.33, respectively. For more confined stress states, or if the stress triaxiality value moves outside the limits (
), it would be expected that a Johnson–Cook plasticity model may fail to capture yielding behaviour.
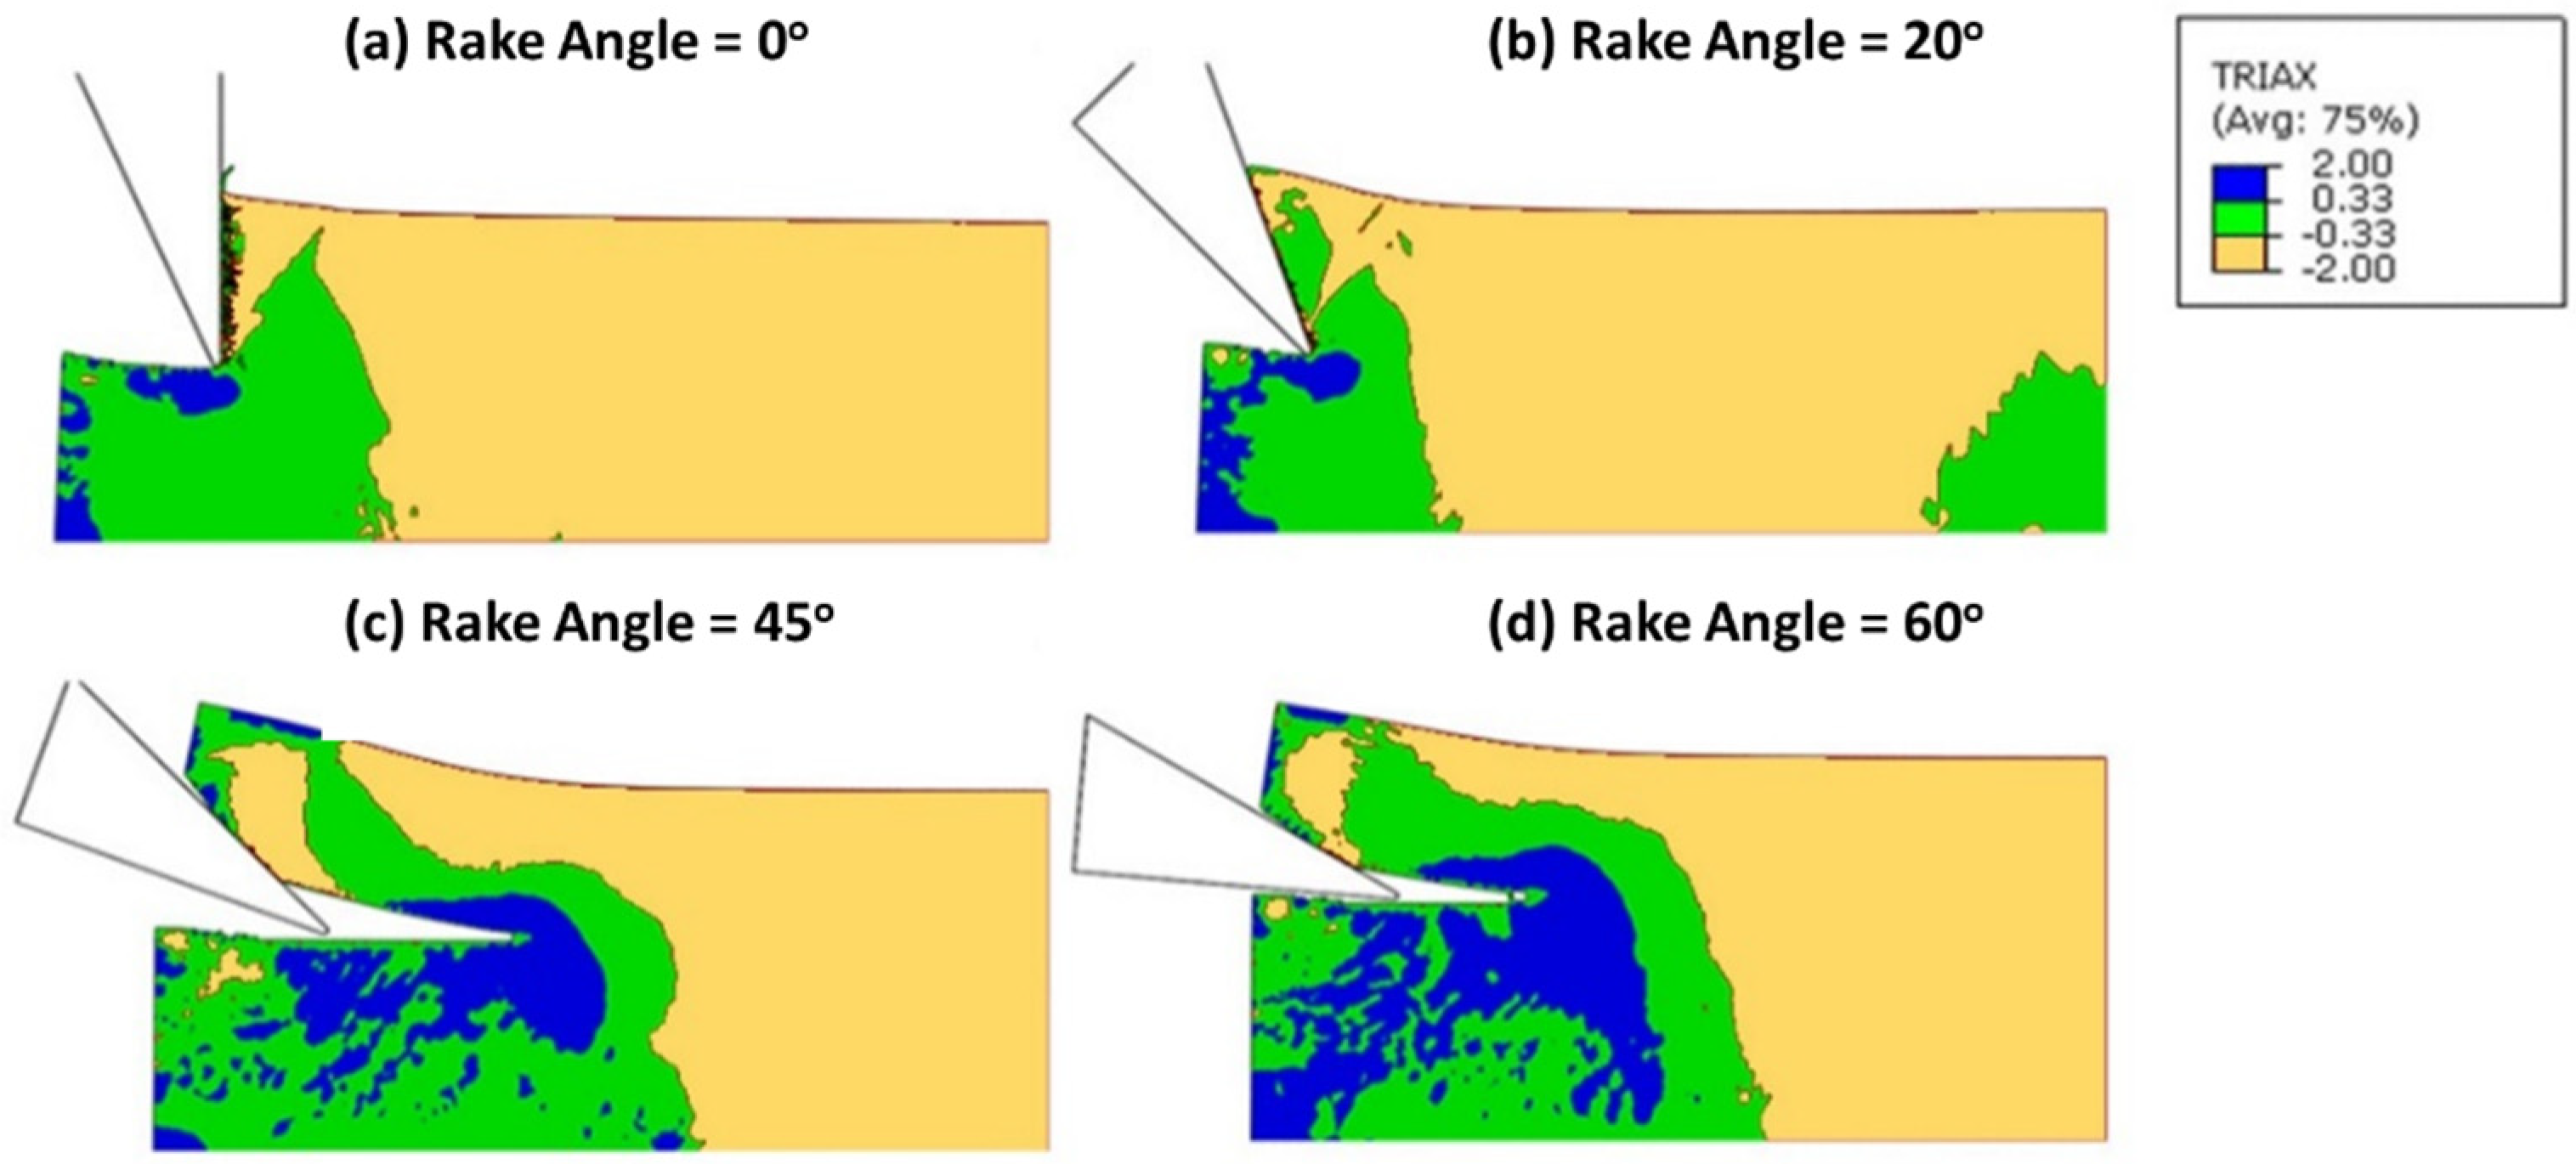
Figure 8 shows contour plots of stress triaxiality
during the cutting process, with high (absolute) values of stress triaxiality in the workpiece ahead of the cutting tool, which leads to a general over-prediction of cutting forces by the J–C model within our computational framework. The implications of this finding are that the accuracy of cutting simulations involving porous, cellular structures relies heavily on choosing correct constitutive material models that account for the complex yield behaviour of such materials.
While the modelling framework has provided very good predictions of overall cutting behaviour, there are certain limitations within this study that should be acknowledged. Firstly, the out-of-plane thickness of the model was assumed to be represented by a single element. While this represents a simplification of the 3D geometry, the orthogonal cutting process presented here is fully planar, implying that out-of-plane forces and effects are negligible. Moreover, while the initial post-yield behaviour of the computational model was determined based on uniaxial compression testing, subsequent damage (or softening) behaviour was described by a damage evolution law (Equation (8)), which is formulated as a function of the equivalent plastic strain (PEEQ) at failure. Due to the difficulty in experimentally determining the individual damage parameters (d1–d3) for this evolution law, our study used an iterative process to calibrate a set of damage constants until an appropriate representation of chip formation compared with the experiments was observed. This process was not trivial, as the computational model was required to capture many different categories of chip formation. Considering the complex dynamic failure processes taking place ahead of the tooltip during orthogonal cutting, the calibrated parameters correctly predicted chip formation in all but one of the cases examined. It should be noted that in the case where the model failed to capture chip formation (, ), several different types of chip formation were observed experimentally (Type 3a and 3b), suggesting that there may have been a transition in chip formation occurring for these set of parameters. An alternative reason could be the use of a continuum-based modelling approach for the PU foam material. While this study represents the first implementation of a CFI plasticity model for this type of foam structure, this constitutive formulation may have difficulty in capturing certain features occurring at particular length scales within this cellular solid. It is worth noting that the PU20 foam used is described by the manufacturer as a closed-cell rigid cellular foam. While this material has been shown to have similar bulk post-yield mechanical behaviour as trabecular bone, the characteristic cell size is much smaller (~0.17 mm) than trabecular bone, whose pore dimensions would be closer to the cutting depths used in this study (1–2 mm). At this scale, it may be the case that a discrete modelling approach in which the cell walls themselves are represented may be required to capture these intricate features of the cutting process.


