Article

Comparison of Various Nitrogen and Water Dual Stress Effects for Predicting Relative Water Content and Nitrogen Content in Maize Plants through Hyperspectral Imaging

1
Department of Agricultural and Biological Engineering, Purdue University, West Lafayette, IN 47907, USA
2
Food Resources Education and Research Center, Graduate School of Agricultural Science, Kobe University, Kasai 675-2103, Japan
3
Health and Crop Sciences Research Laboratory, Sumitomo Chemical Co., Ltd., Takarazuka 665-8555, Japan
4
Department of Agronomy, Purdue University, West Lafayette, IN 47907, USA
*
Author to whom correspondence should be addressed.
Present address: Graduate School of Science and Technology, Niigata University, Niigata 950-2181, Japan.
AI 2023, 4(3), 692-705; https://doi.org/10.3390/ai4030036
Submission received: 24 May 2023 / Revised: 24 June 2023 / Accepted: 16 August 2023 / Published: 18 August 2023
(This article belongs to the Special Issue Artificial Intelligence in Agriculture)

Abstract

:
Water and nitrogen (N) are major factors in plant growth and agricultural production. However, these are often confounded and produce overlapping symptoms of plant stress. The objective of this study is to verify whether the different levels of N treatment influence water status prediction and vice versa with hyperspectral modeling. We cultivated 108 maize plants in a greenhouse under three-level N treatments in combination with three-level water treatments. Hyperspectral images were collected from those plants, then Relative Water Content (RWC), as well as N content, was measured as ground truth. A Partial Least Squares (PLS) regression analysis was used to build prediction models for RWC and N content. Then, their accuracy and robustness were compared according to the different N treatment datasets and different water treatment datasets, respectively. The results demonstrated that the PLS prediction for RWC using hyperspectral data was impacted by N stress difference (Ratio of Performance to Deviation; RPD from 0.87 to 2.27). Furthermore, the dataset with water and N dual stresses improved model accuracy and robustness (RPD from 1.69 to 2.64). Conversely, the PLS prediction for N content was found to be robust against water stress difference (RPD from 2.33 to 3.06). In conclusion, we suggest that water and N dual treatments can be helpful in building models with wide applicability and high accuracy for evaluating plant water status such as RWC.

1. Introduction

Water and nitrogen (N) are major factors in plant growth and agricultural production. Water is necessary for normal plant growth and development. Drought is one of the major constraints limiting crop production [1] and many actual cases have been reported [2,3,4]. Drought stress reduces leaf size, stem extension, and root proliferation, disturbs plant water relations, and reduces water-use efficiency [5]. Drought stress also reduces photosynthesis in a variety of ways. For example, drought progressively decreases CO2 assimilation rates due to reduced stomatal conductance [6]. Moreover, it induces a reduction in the contents and activities of photosynthetic carbon reduction cycle enzymes, including the key enzyme, ribulose-1,5-bisphosphate carboxylase/oxygenase, Rubisco [6].
N is one of the most important nutrients for a plant. Organically bound N is used to build all amino acids, amines, ureides, peptides, and proteins in plants [7]. Much of the plant response to N deficiency is centered on photosynthetic elements. One study showed that N deficiency leads to a breakdown of proteins in wheat chloroplasts, peroxisomes, and cytosol [8]. Chloroplasts contain N involved in photosynthesis as soluble protein, dominated by the enzyme Rubisco, and protein in the thylakoid membranes [9]. Another study determined that N deficiency decreased the leaf area, chlorophyll content, and photosynthetic rate, ultimately resulting in lower dry matter accumulation of sorghum plants [10]. The decreased photosynthetic rate due to N deficiency was mainly associated with the decreases in stomatal conductance and intercellular CO2 concentration [10].
For the reasons described above, water and N condition monitoring in plants play an important role for plant science, breeding, and agricultural production purposes. There are a variety of ways to analyze the water and N status of plants [11,12]. However, most of these analyses are slow, labor-intensive, and destructive to the plant. Remote sensing of plant water and N status could solve these problems. Particularly, hyperspectral imaging is one of the promising tools to evaluate plant traits of interest. Compared to traditional RGB (Red, Green, and Blue) images, hyperspectral images are able to collect much more information from hundreds of narrow spectral bands. Water and N content prediction models can be built using a bunch of spectral information. Researchers have used hyperspectral imaging to evaluate the water content [13,14,15,16,17] or the N content [18,19,20,21] of various plant species. Several previous works have combined water and nutrient stresses in the experiment, but only demonstrated that hyperspectral data could be used to predict water content and nutrient content, respectively [22,23,24,25].
Water and N stresses are confounded, and the application of one stress affects the other stress. Previous biological studies have determined that water and N stresses are involved in each other’s expression of plant phenotypes. One of the large contributors to a decrease in growth under drought stress is N deficiency [26]. In one drought stress study, the plant N content decreased by almost 4% [27]. In other studies, drought reduced plant growth by reducing N uptake, transport, and distribution [28]. Within the plant, as a consequence of the link between nutrient mass flow and transpiration, nutrient availability, particularly that of nitrate, partially regulates plant water flux [29]. However, as described above, there are not enough previous hyperspectral imaging studies of combined water and N stresses, and there is no direct discussion about the impact of dual stresses to predict water and N content in plants.
Our main contributions and novelty in this study are as follows:
  • In order to investigate how the popular imaging models confuse between different types of plant stresses, we conducted hyperspectral imaging for maize plants under three levels of N treatments inter-leaved with three levels of water treatments.
  • Partial Least Squares (PLS) models to predict Relative Water Content (RWC) and N content were developed. We compared their accuracy and robustness according to the different N and water treatment datasets.
  • RWC prediction using hyperspectral data was severely impacted by N stress difference. Conversely, N content prediction was robust against water stress difference.
  • The new models developed from the inter-leaved assay significantly helped to relieve the impacts on RWC prediction.
This paper is organized as follows: Following the introduction, Section 2 briefly reviews previous works related to water and N prediction models using hyperspectral imaging. Section 3 describes the materials and methods and Section 4 provides the experimental results. Section 5 discusses experimental results and the limitation of this study, and finally, Section 6 concludes with some remarks and future works.

2. Related Work

Water and N condition monitoring can be performed in a variety of ways. Plant physiological studies commonly measure water and N content using plant tissue as a sample [11,12]. Most of these analyses are time-consuming, labor-intensive, and inherently destructive to the plant, making it impossible to measure the same plant multiple times during its growth period. For example, RWC is one of the most commonly used measurements to evaluate water status in plants [12].
Remote sensing of plant water and N status could solve these problems. Vegetation indices are often used to evaluate them in the field. Normalized Difference Vegetation Index (NDVI) is one of the most common vegetation indices and is calculated with reflectance in red and infrared bands or is measured by a spectroradiometer. Yousfi et al. [30] used NDVI measured by a spectroradiometer to evaluate water status in the turfgrass field. Colovic et al. [31] also used NDVI and other vegetation indices calculated with reflectance data from a hyperspectral image to assess water and N status. Using the vegetation index is an easy and quick, especially for field measurements, but difficult way to predict the actual content of water and N.
Image-based plant phenotyping offers a high-throughput and non-destructive method that can significantly reduce time and labor costs. It is also a repeatable way to measure the same plant sample. A hyperspectral camera is gradually becoming more common in the plant research area. Traditional RGB images capture data on light intensities in three spectral bands, whereas hyperspectral images are able to collect much more information from hundreds of narrow spectral bands. Using a bunch of spectral information from hyperspectral imaging, models to predict the water and N contents of the plant can be built. In previous studies, hyperspectral imaging has successfully evaluated the water content such as in maize [13], wheat [14], soybean [15], rice [16], and grapevine [17], and N content evaluation has been also reported in sugarcane [18], wheat [19], cucumber [20], and oilseed rape [21].
Several prior works have combined water and nutrient stresses in their experiments. Pandey et al. [22] combined different levels of water and nutrient stress in maize and soybean. Then, water content and nutrient content (N, phosphorus, potassium, sulfur, and so on) were predicted respectively. Similar studies of combined water and N stresses only demonstrated that hyperspectral data could be used to predict water content and N content, respectively, in wheat [23], spinach [24], and sorghum and maize [25].
However, there are not enough previous hyperspectral imaging studies of combined water and N stresses, and there is no direct discussion about how the popular imaging models confuse between different types of plant stresses. This work fills the gap in previous works by conducting hyperspectral imaging for maize plants under three levels of N treatments inter-leaved with three levels of water treatments to investigate the impact of dual stresses to predict water and N content in plants.

3. Materials and Methods

3.1. Hyperspectral Imaging System

The imaging system consisted of an L-shaped cabinet with top-view and side-view hyperspectral cameras and lighting mounted inside. The cameras were 5.5 megapixels sCMOS visible near-infrared hyperspectral sensors (MSV-500, Middleton Spectral Vision, Middleton, WI, USA). The spectral resolution of the sensor was approximately 0.64 nm, and there were 969 bands in the spectral range 400–1019 nm. Inside the imaging tower, there were eight 500 W halogen lamps to provide lighting: four around the top-view camera and four around the side-view camera.

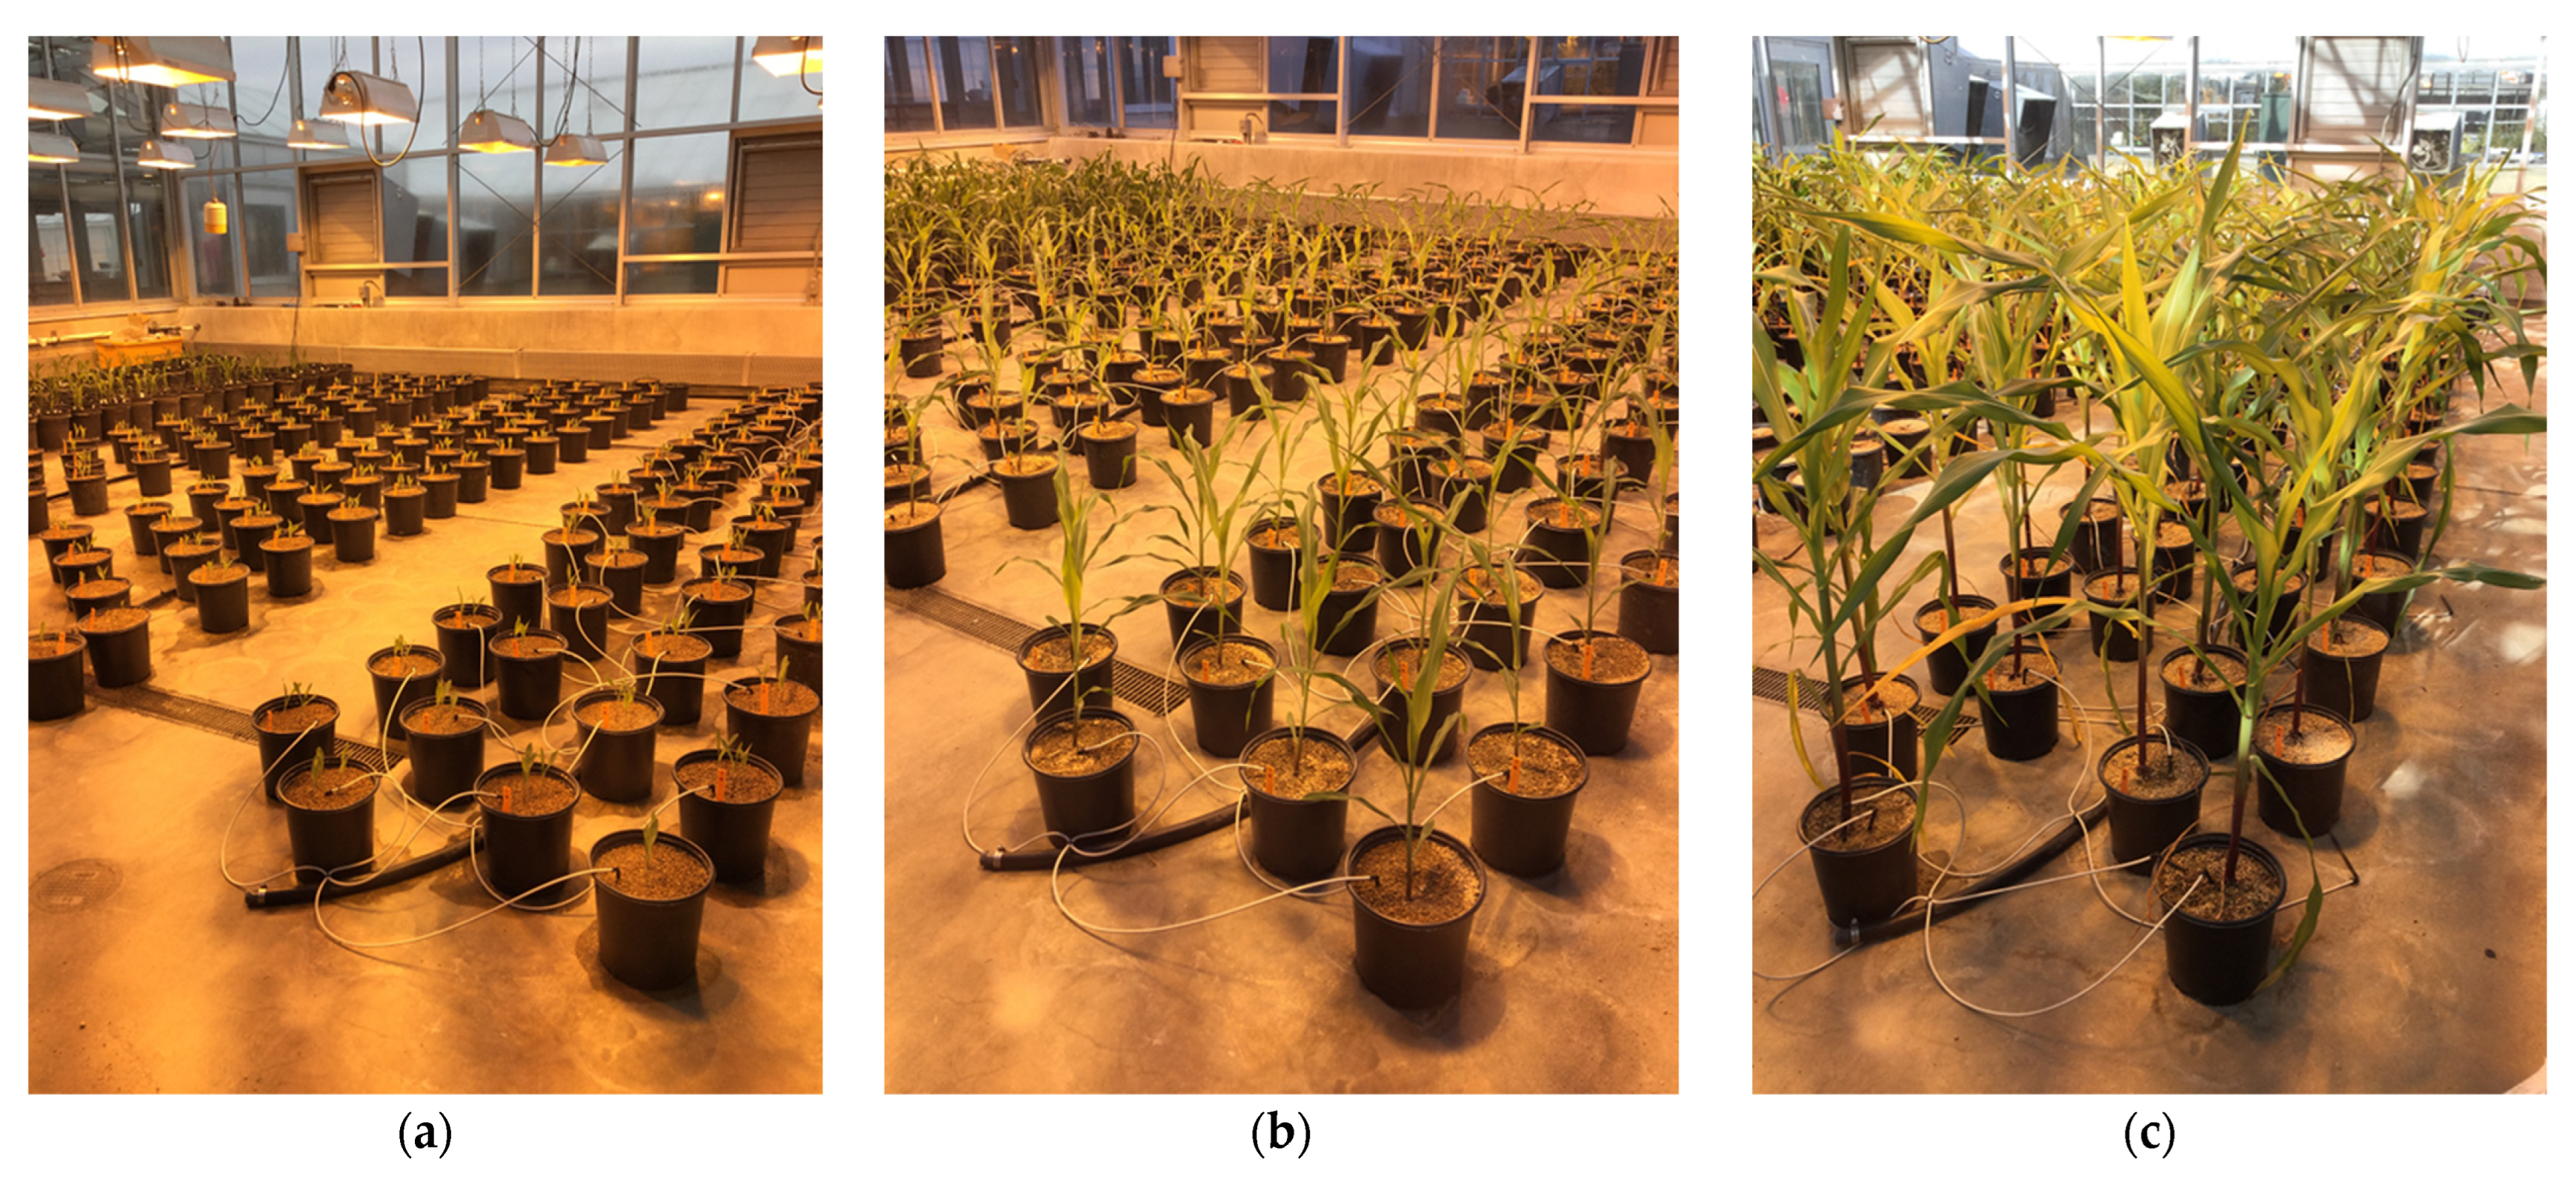
3.2. Experimental Design

Plant growth and data collection were conducted in the Purdue University Lily greenhouse from January to February 2017. A total of 108 maize (Zea mays, B73xMo17 hybrid) plants were grown in 5.7 L pots. B73xMo17 is an F1 hybrid. The Dr. Tuinstra Lab produced seeds of B73xMo17 by crossing the public inbred lines B73 and Mo17 at Purdue University. Seeds were used without any pretreatment. Pots were filled with a 50/50 mixture of sand and Turface AthleticsTM MVP® (PROFILE Products LLC, Buffalo Grove, IL, USA). All maize plants were initially given one round 24-8-16 commercial fertilizer (Miracle-Gro® Water Soluble All Purpose Plant Food, The Scotts Miracle-Gro Company, Marysville, OH, USA). The greenhouse was set to 23–29 °C and supplemental lighting was on 12 h a day. Each pot had an irrigation line that delivered 500 mL water to each plant every morning.
Maize plants were grown under 3 different N treatments by 3 different water treatments and therefore 9 different treatment groups (Table 1). Treatments were assigned to pots following a randomized complete block design with 12 replications.
N treatments were started from the fourth week after sowing (Figure 1b). Plants were in the vegetative growth stage three or four at this point in time. Plants were fertilized weekly with 250 mL of 3 different modified Hoagland’s solutions, which contain different levels of N (0, 3, and 20 mM ammonium nitrate). The original Hoagland solution was developed in 1938 [32] and revised in 1950 [33]. The solutions used in this experiment were modified from the original recipe in order to provide all macronutrients and micronutrients with three different levels of N.
While the N treatments were applied over the entirety of plant growth, water treatments were applied for a short period of time. At the vegetative growth stage seven, the plants assigned to receive low drought and drought treatments were withheld from watering for 3 or 4 days before data collection day. The other plants assigned to the watered treatment were kept watered every morning.

3.3. Image Acquisition and Sample Collection

Data collection was performed at the vegetative growth stage seven on 16 February 2017 (Figure 1c). All the plants were placed inside the imaging tower and scanned one by one from top-view. The distance from the camera to the plant was 2.3 m. To calibrate the acquired images, a flat polyvinyl chloride (PVC) panel was scanned as the white reference. The white reference calibration was used to minimize the effect of the uneven intensity of the lighting source in different bands [34,35].
After image acquisition, a small section of the top collared leaf was taken to measure relative water content (RWC). Then, the rest of the top-collared leaf was collected for N content analysis. The collected RWC and N content data were used as the ground truth data in a later hyperspectral image-based prediction model.

3.4. Relative Water Content Measurements

RWC was measured to estimate the water status of the leaf samples as described by Turner [12]. In this study, a piece of the top collared leaf sampled for RWC measurement was approximately 2.5 cm × 5.0 cm and weighed to obtain the fresh weight (FW). The samples were immediately submerged in deionized water overnight to ensure the tissue was fully turgid and weighed to obtain the turgid weight (TW). Finally, all samples were fully dried in a 60 °C dryer and weighed to obtain the dried weight (DW). These values were used to determine the RWC using the equation below.
RWC (%) = [(FW – DW)/(TW – DW)] × 100

3.5. Nitrogen Content Measurements

The harvested top-collared leaf materials were dried in a 60 °C dryer for a week. Dried leaf materials were ground and stored at room temperature, and subsequently, N concentration of these samples was analyzed using a Thermo Scientific FlashEA® 1112 Nitrogen and Carbon Analyzer for Soils, Sediments, and Filters (Thermo Fisher Scientific, Waltham, MA, USA) based on the flash dynamic combustion method [25].

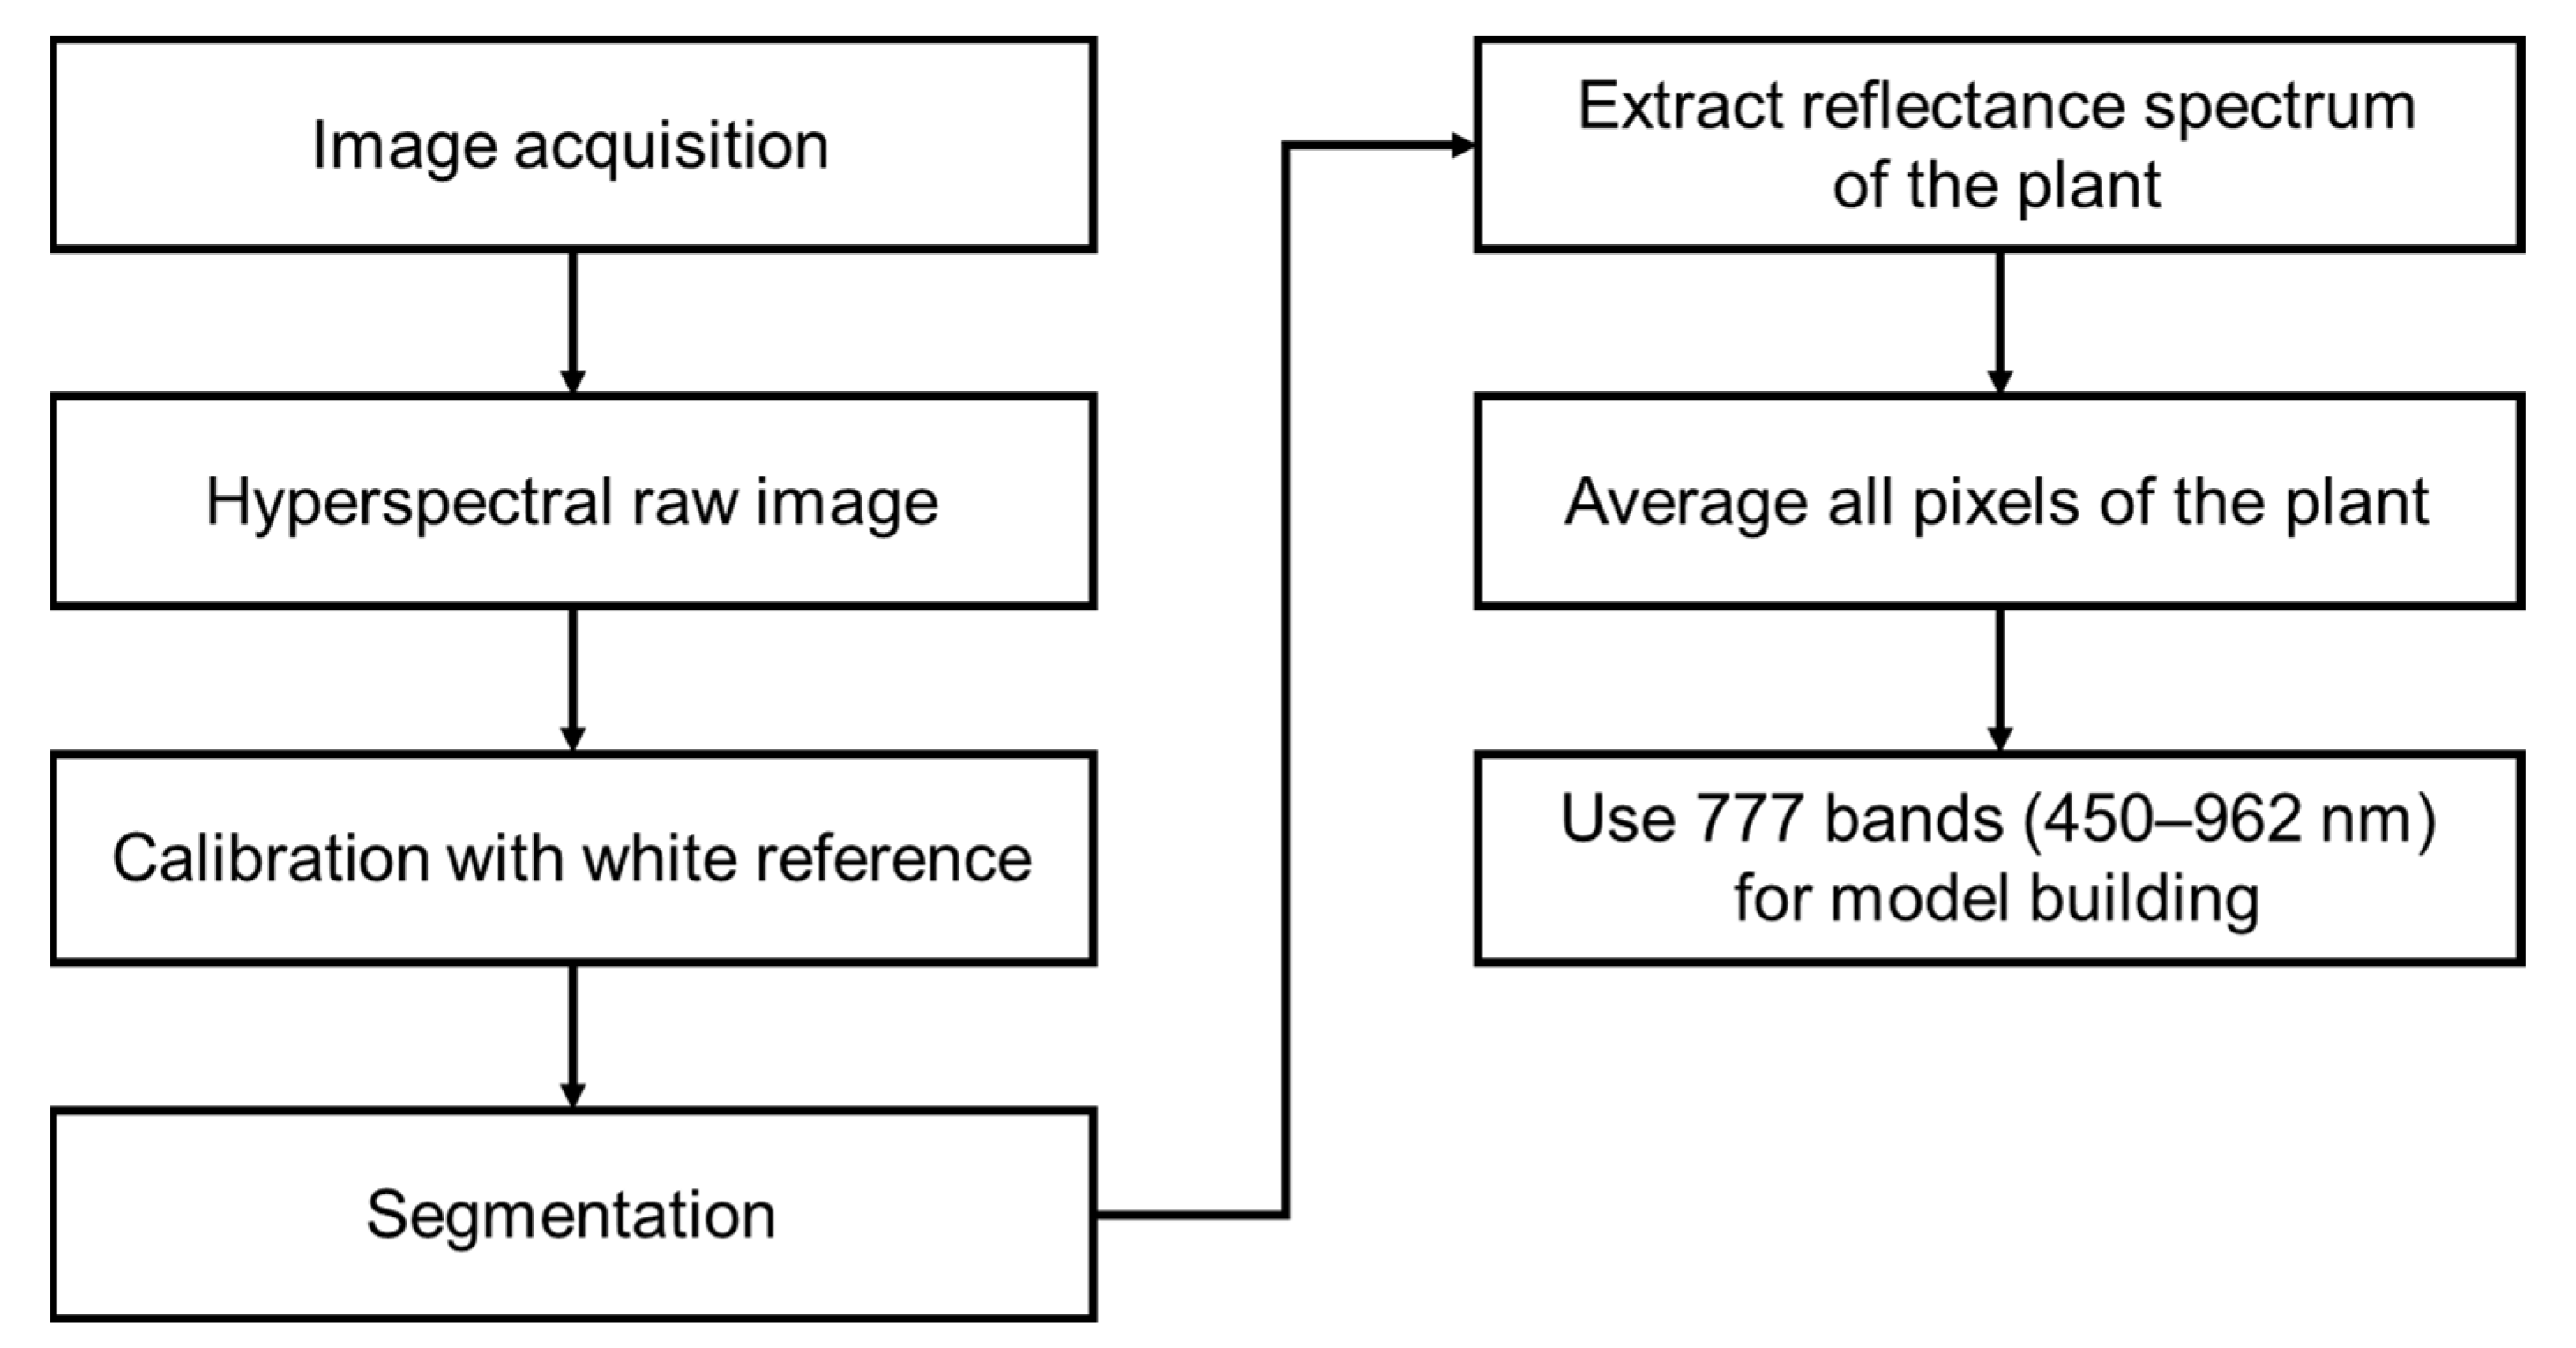
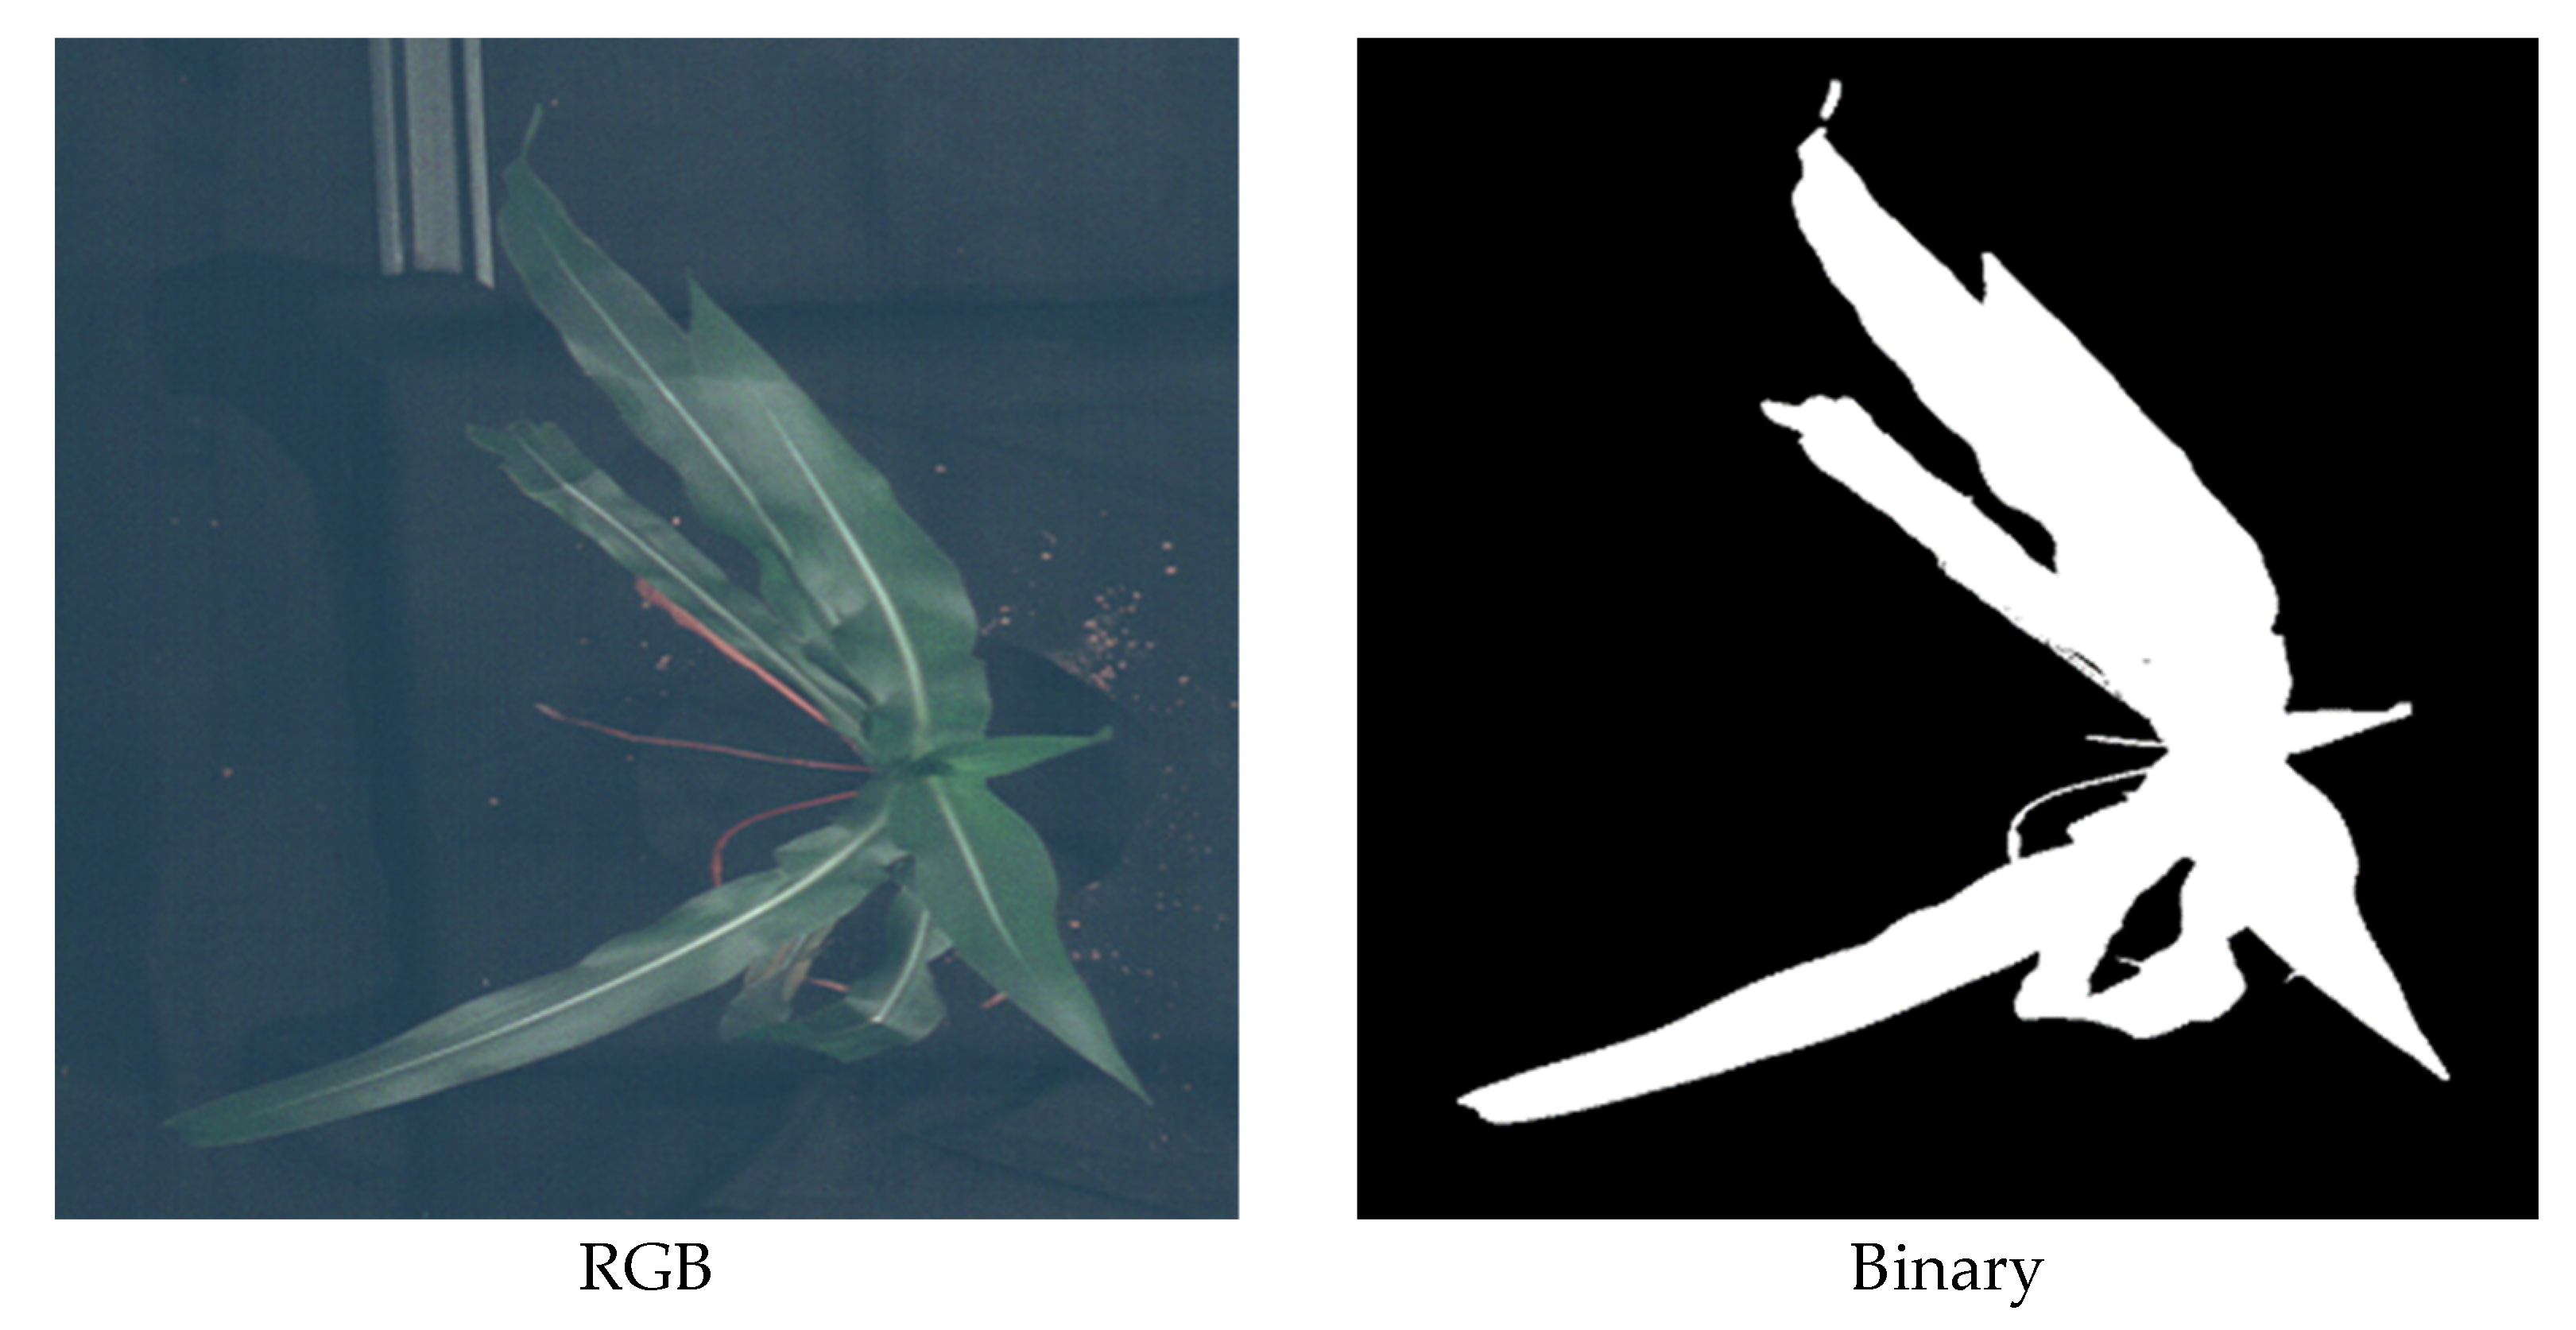
3.6. Image Processing

Figure 2 shows whole image processing steps. To process the hyperspectral images, the raw images were first calibrated with a white reference. The calibrated hyperspectral images were processed using a segmentation procedure with simple convolution methodology that was the same as used in our previous study. [34]. A vector of sequential integers from −20 to 20 was multiplied by the reflectance intensity vector from the red-edge region (680–720 nm). By choosing threshold 7 as the boundary between plant tissue and the background, the plant was successfully segmented out (Figure 3).
The hyperspectral imaging produced a reflectance data point at every pixel of every plant at every wavelength. After segmentation, the pixels representing plant tissues were extracted from the hyperspectral images. Then, the reflectance spectrum of each plant pixel was calculated from those extracted plant images. The average of all the pixels was calculated for every plant at every wavelength and this average was used to represent the plant at a specific wavelength. The spectral resolution was approximately 0.64 nm, and there were 969 bands in the spectral range 400–1019 nm. We used 777 wavebands (from 450 to 962 nm) instead of 969 bands (from 400 to 1019 nm) due to the low signal-to-noise ratio in the two tails of the spectra. Matlab R2016a (MATLAB 9.0) software (The MathWorks Inc., Natick, MA, USA) was used to develop image processing algorithms.

3.7. Data Analysis

PLS is a widely used predictive method for regression and has been applied in previous studies to analyze hyperspectral images for estimating plant water status [13,22,36] and N content [19,37]. In this study, PLS was used to model and predict RWC and N content. The final dataset contained 108 maize samples reflectance at every wavelength along with RWC and N content ground truth collections.
PLS modeling was carried out in Matlab R2016a software and PLS Toolbox (Eigenvector Research Inc., Manson, WA, USA). The preprocessing steps were first introduced and applied to spectra features to remove scaling effects and so on. All 108 samples were separated into two groups as shown in Table 1: a training dataset with 90 samples for model building and calibration, and a test dataset with 18 samples for validating purposes. Leave-one-out cross-validation was used for model calibration. The number of components was determined by choosing those that gave the first local minimum in Root Mean Squared Error of Cross Validation (RMSECV).
To determine how N treatment influences RWC prediction by hyperspectral imaging, three PLS models were built using three different sub-datasets. Each sub-dataset represented an individual N treatment and was referred to as Low-N, Medium-N, and High-N. Each sub-dataset consisted of 30 samples with one N level but varying water stress levels (Watered, Low drought, and Drought) from 90 samples of training dataset. Then, these models were applied to the test dataset including all N and water level combinations, to predict RWC. In addition, another three models were developed with another three sub-datasets named R1, R2, and R3. A total of 30 samples were chosen for each sub-dataset by randomly dividing all 90 samples of the whole training dataset into 3 groups. These models were also applied to the same test dataset to predict RWC.
Similar approaches were used to investigate the water treatment effect on N content prediction. Three PLS models for N content prediction were built using three different sub-datasets. Each sub-dataset represented individual water treatment and was referred to as Watered, Low drought, or Drought. Each sub-dataset consisted of 30 samples, which have one water level with varying N stress levels (Low-N, Medium-N, and High-N) from 90 samples of training dataset. Then, these models were applied to the test dataset including all water and N level combinations, to predict N content. Then, another 3 prediction models for N content were developed with R1, R2, and R3 sub-dataset. These models were also applied to the same test dataset to predict N content.
To assess the model performance, the following three indicators were calculated for both the training and testing datasets: Coefficient of Determination (R2) between measured and predicted values; Root Mean Square Error (RMSE), defined as the Equation (2) in which y i are measured values and y i ^ are predicted values; and Ratio of Performance to Deviation (RPD), calculated as the ratio of the Standard Deviation (SD) of the measured values of the samples to the RMSE using Equation (3).
R M S E = 1 N × y i y ^ i 2
RPD = SD/RMSE

3.8. Statistical Analysis

A two-way analysis of variance (ANOVA) was carried out to determine the main effect of each N and water treatment as well as their interaction effect on RWC ground truth and on N content ground truth, respectively. These ground truth data were checked for normality before the ANOVA. Data were analyzed in R statistical environment [38].

4. Results

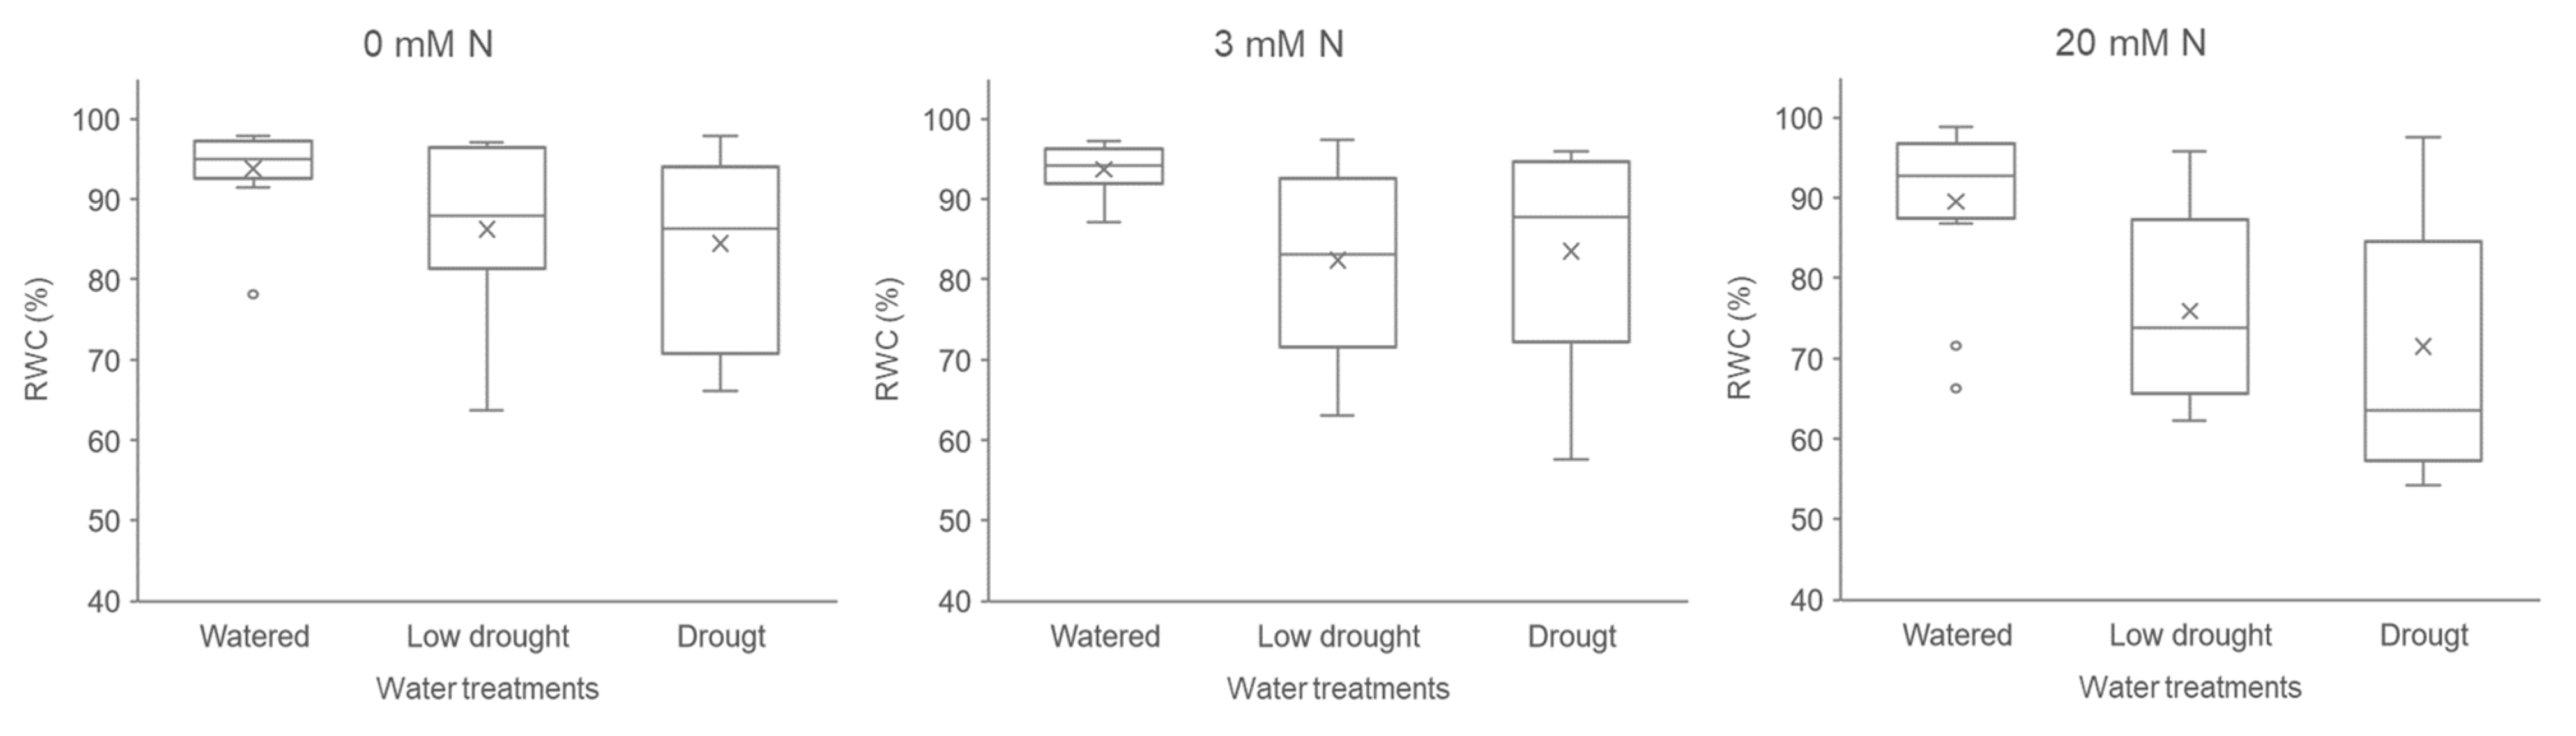
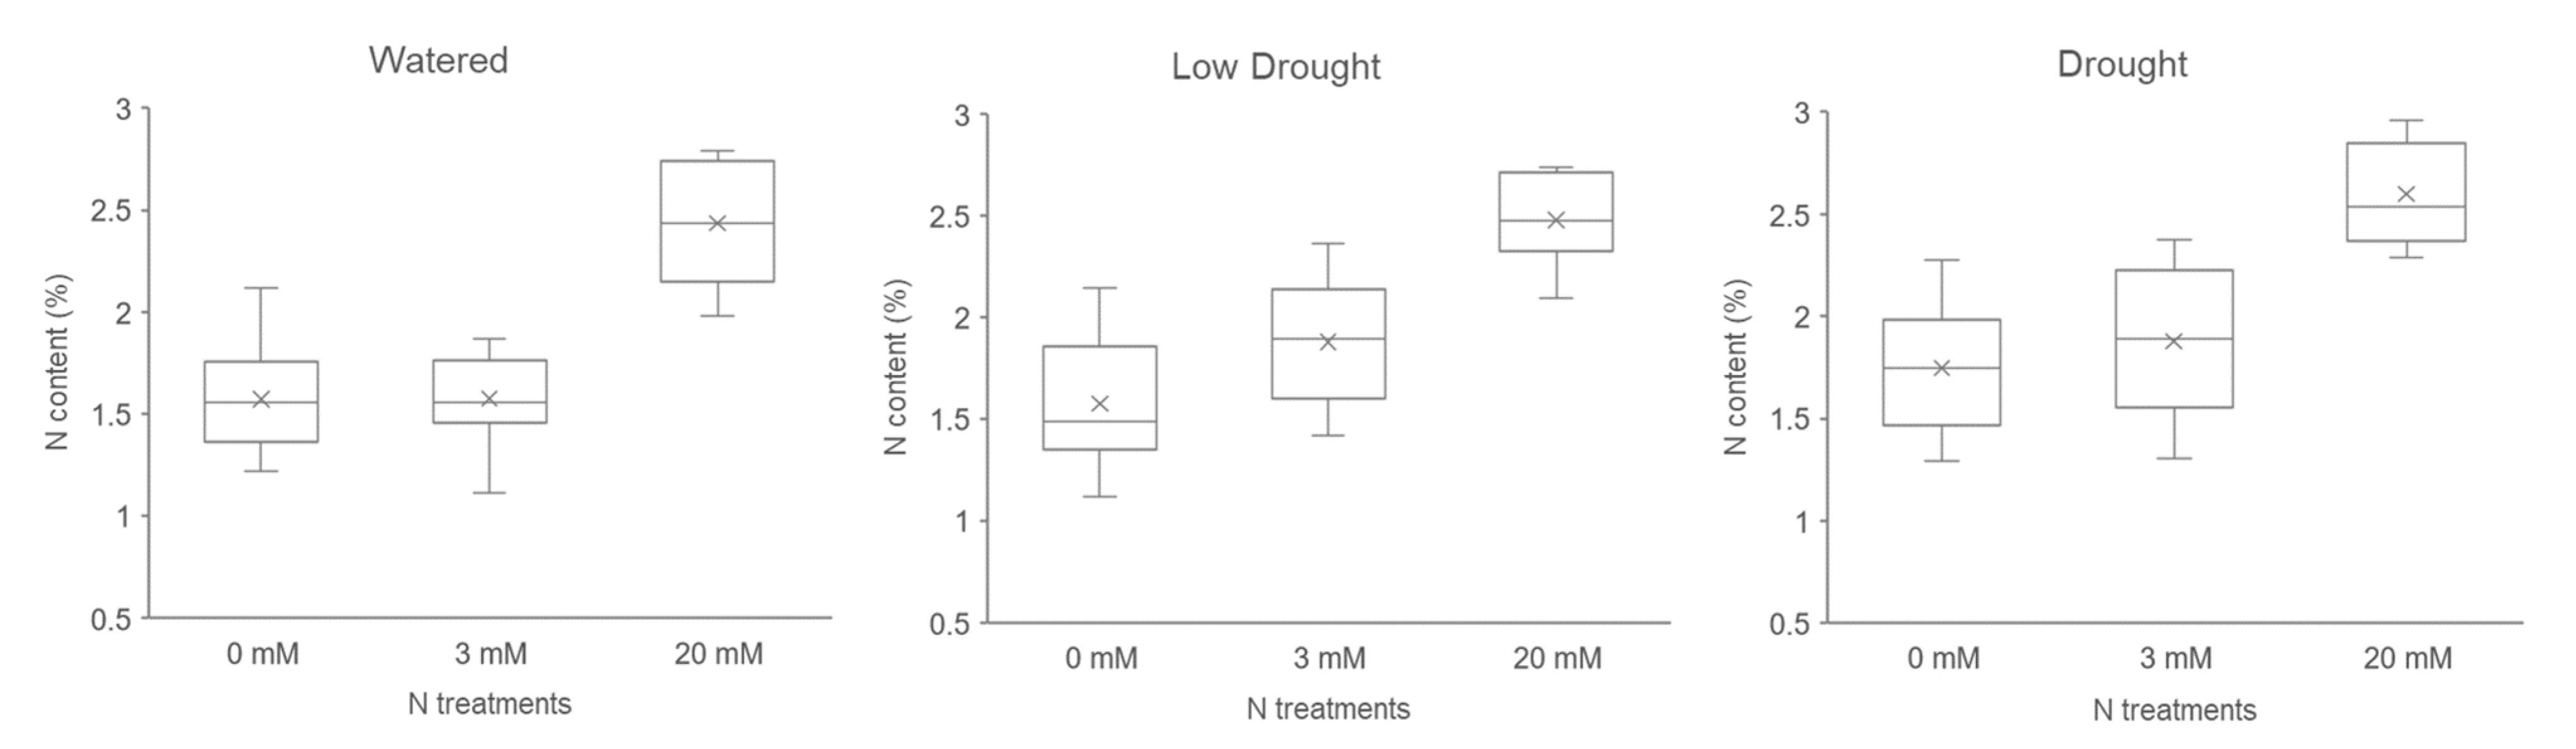
4.1. RWC and N Content Ground Truth

Figure 4 shows the range of RWC levels measured in maize leaves under all different N and water treatment combinations. The RWC ranged from 54.3% to 98.9% of the leaf section. In each N treatment, watered plants had consistently high RWCs close to 100% while both the low drought and drought treatment plants had RWCs in the clearly wider range toward the lower side. There was a significantly clear water treatment effect as well as an N treatment effect shown in the ANOVA, but no significant water × N interaction effect was found for RWC ground truth (Table 2).
Figure 5 illustrates the range of N content levels measured in maize leaves under all different N and water treatment combinations. The N content ranged from 1.11% to 2.96% of the leaf section. In each water treatment, plants grown with higher N treatment tended to have higher N content in the leaves. As in the case with RWC, the ANOVA confirmed that N content ground truth was significantly affected by N treatment as well as water treatment, but no significant water × N interaction effect was found for N content ground truth (Table 2).

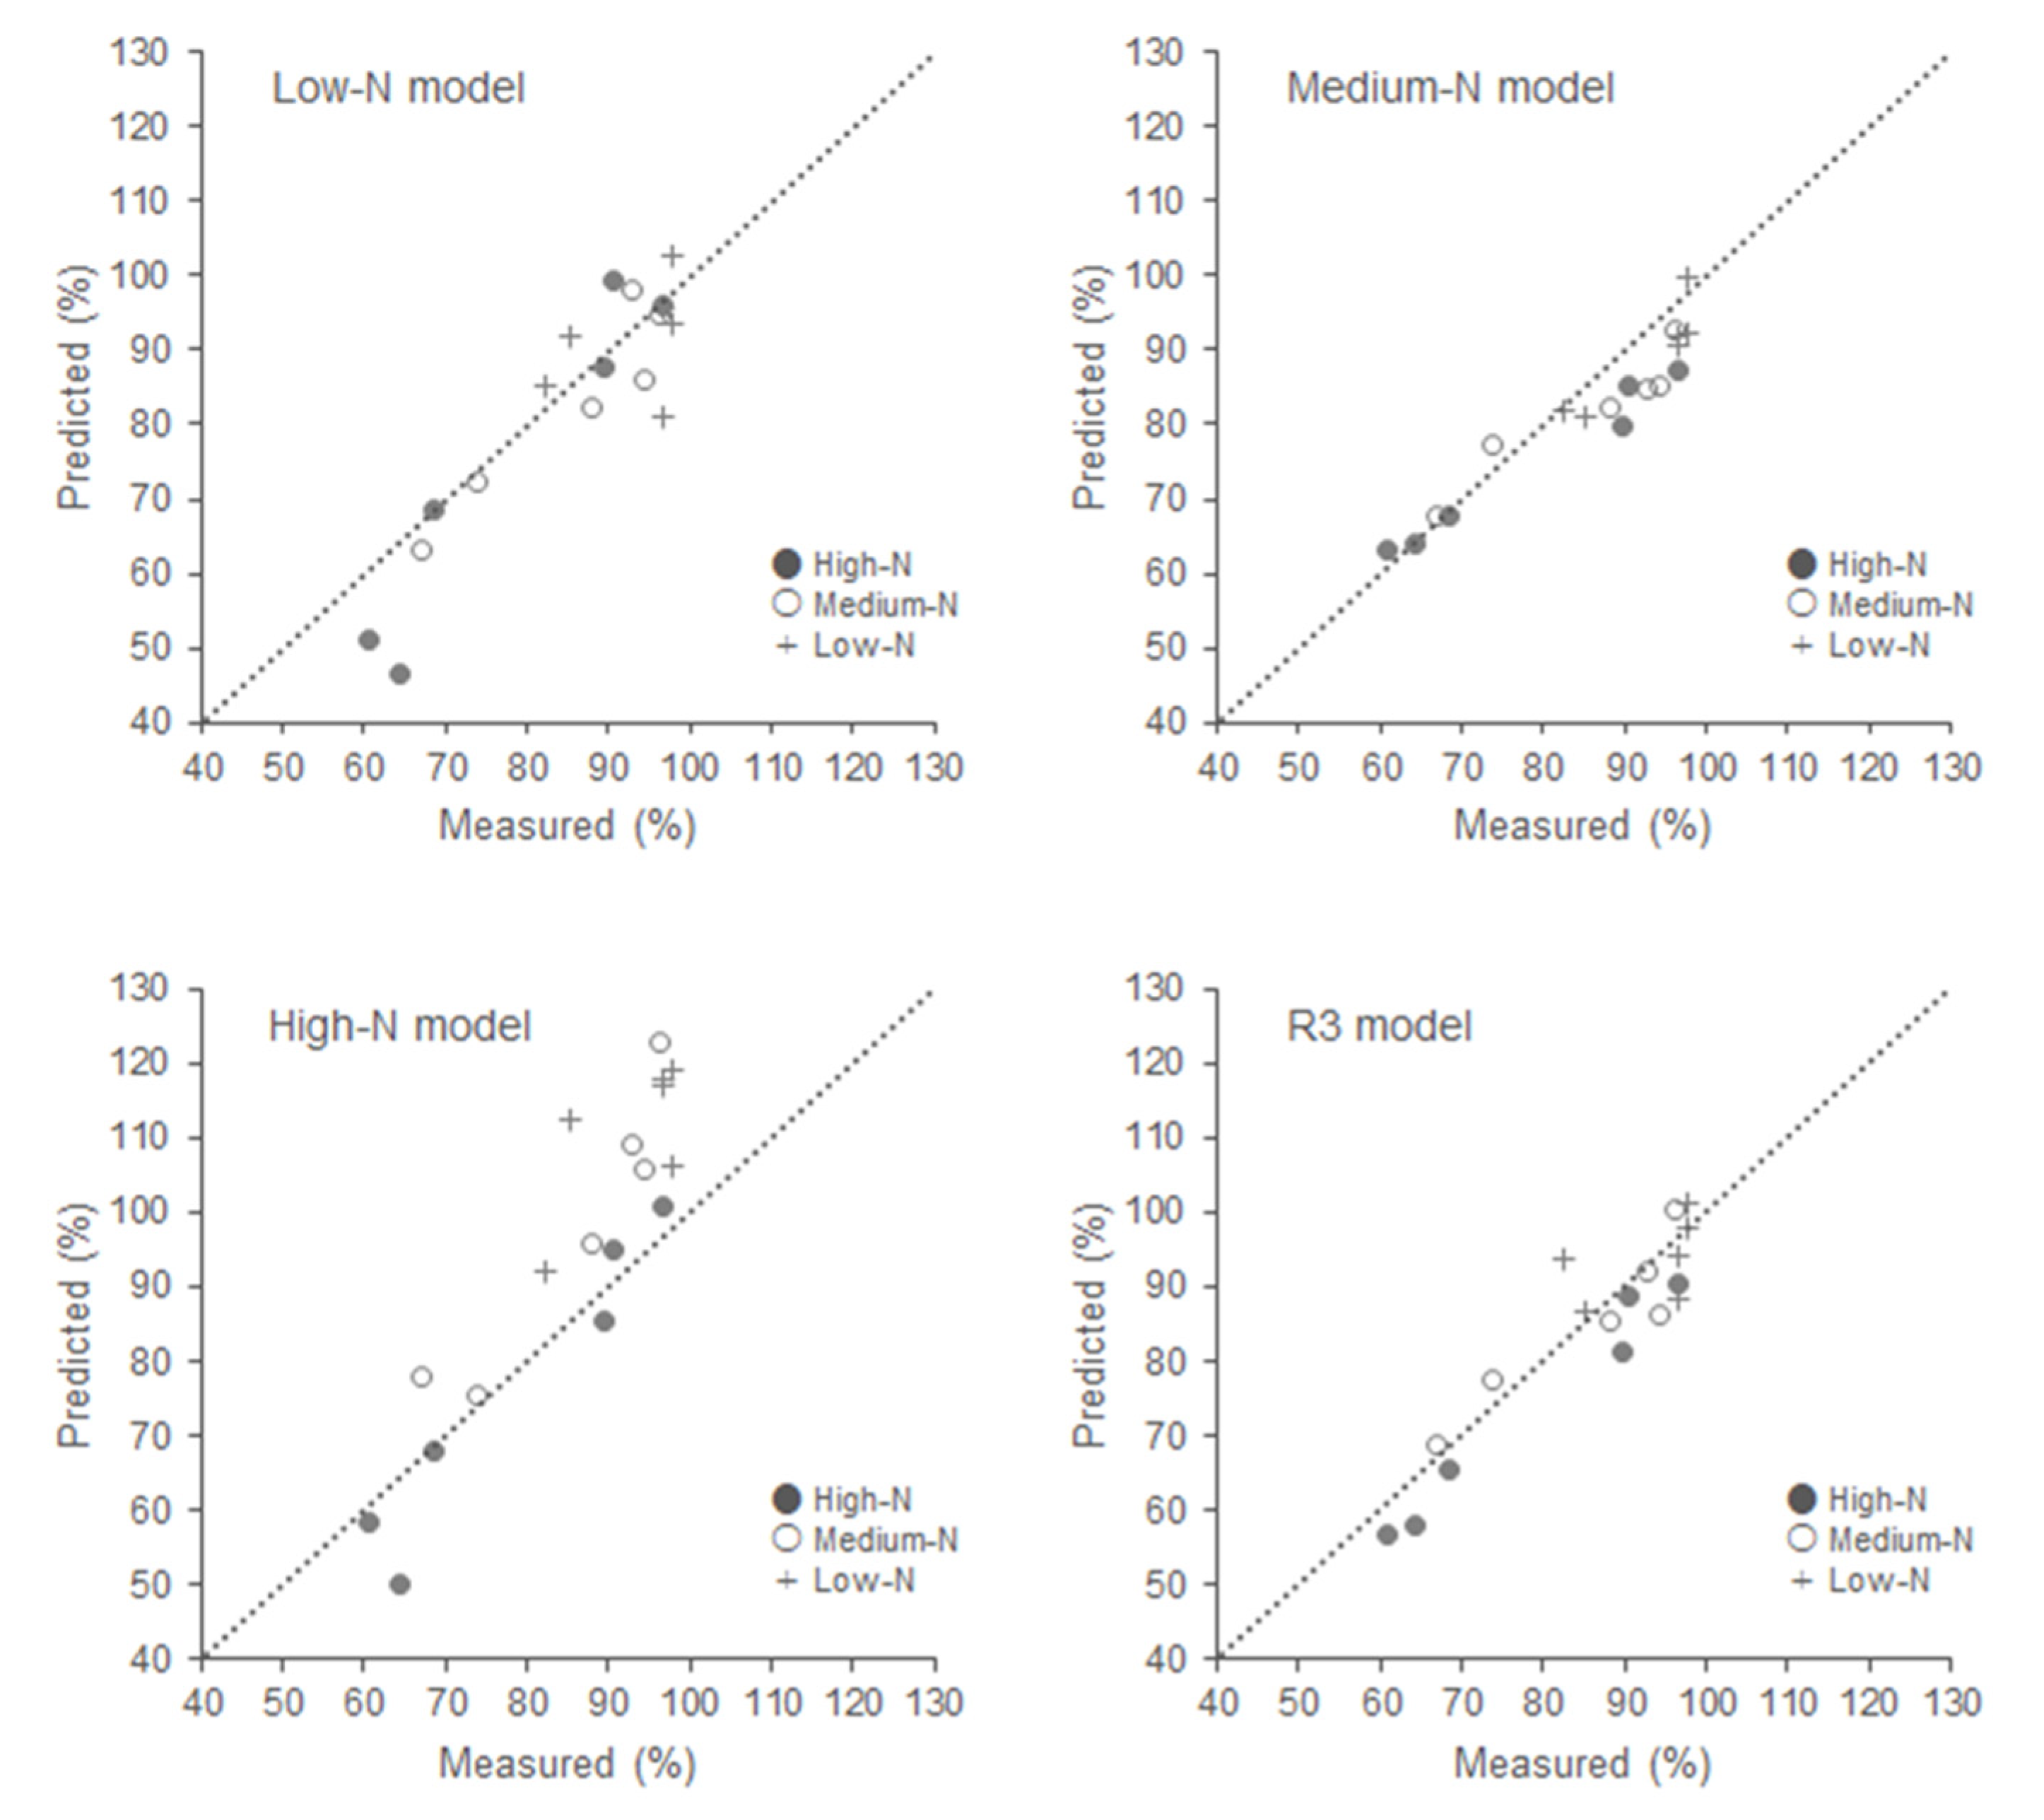
4.2. PLS Modeling for RWC Prediction

N and water stresses are often confounded and produce overlapping symptoms of plant stress. To determine how N treatment influences RWC prediction by hyperspectral imaging, three PLS models were built using three different N treatment sub-datasets. Figure 6 shows the relationships between measured and predicted RWC. The predicted RWC from each model was plotted against the reference RWC. Table 3 provides detailed statistical results from the different N-level training dataset approach. For comparison purposes, another three models (R1, R2, and R3) using randomly selected datasets were applied. Then, the predicted value was plotted against the reference value in Figure 5, and the statistical results are shown in Table 3.

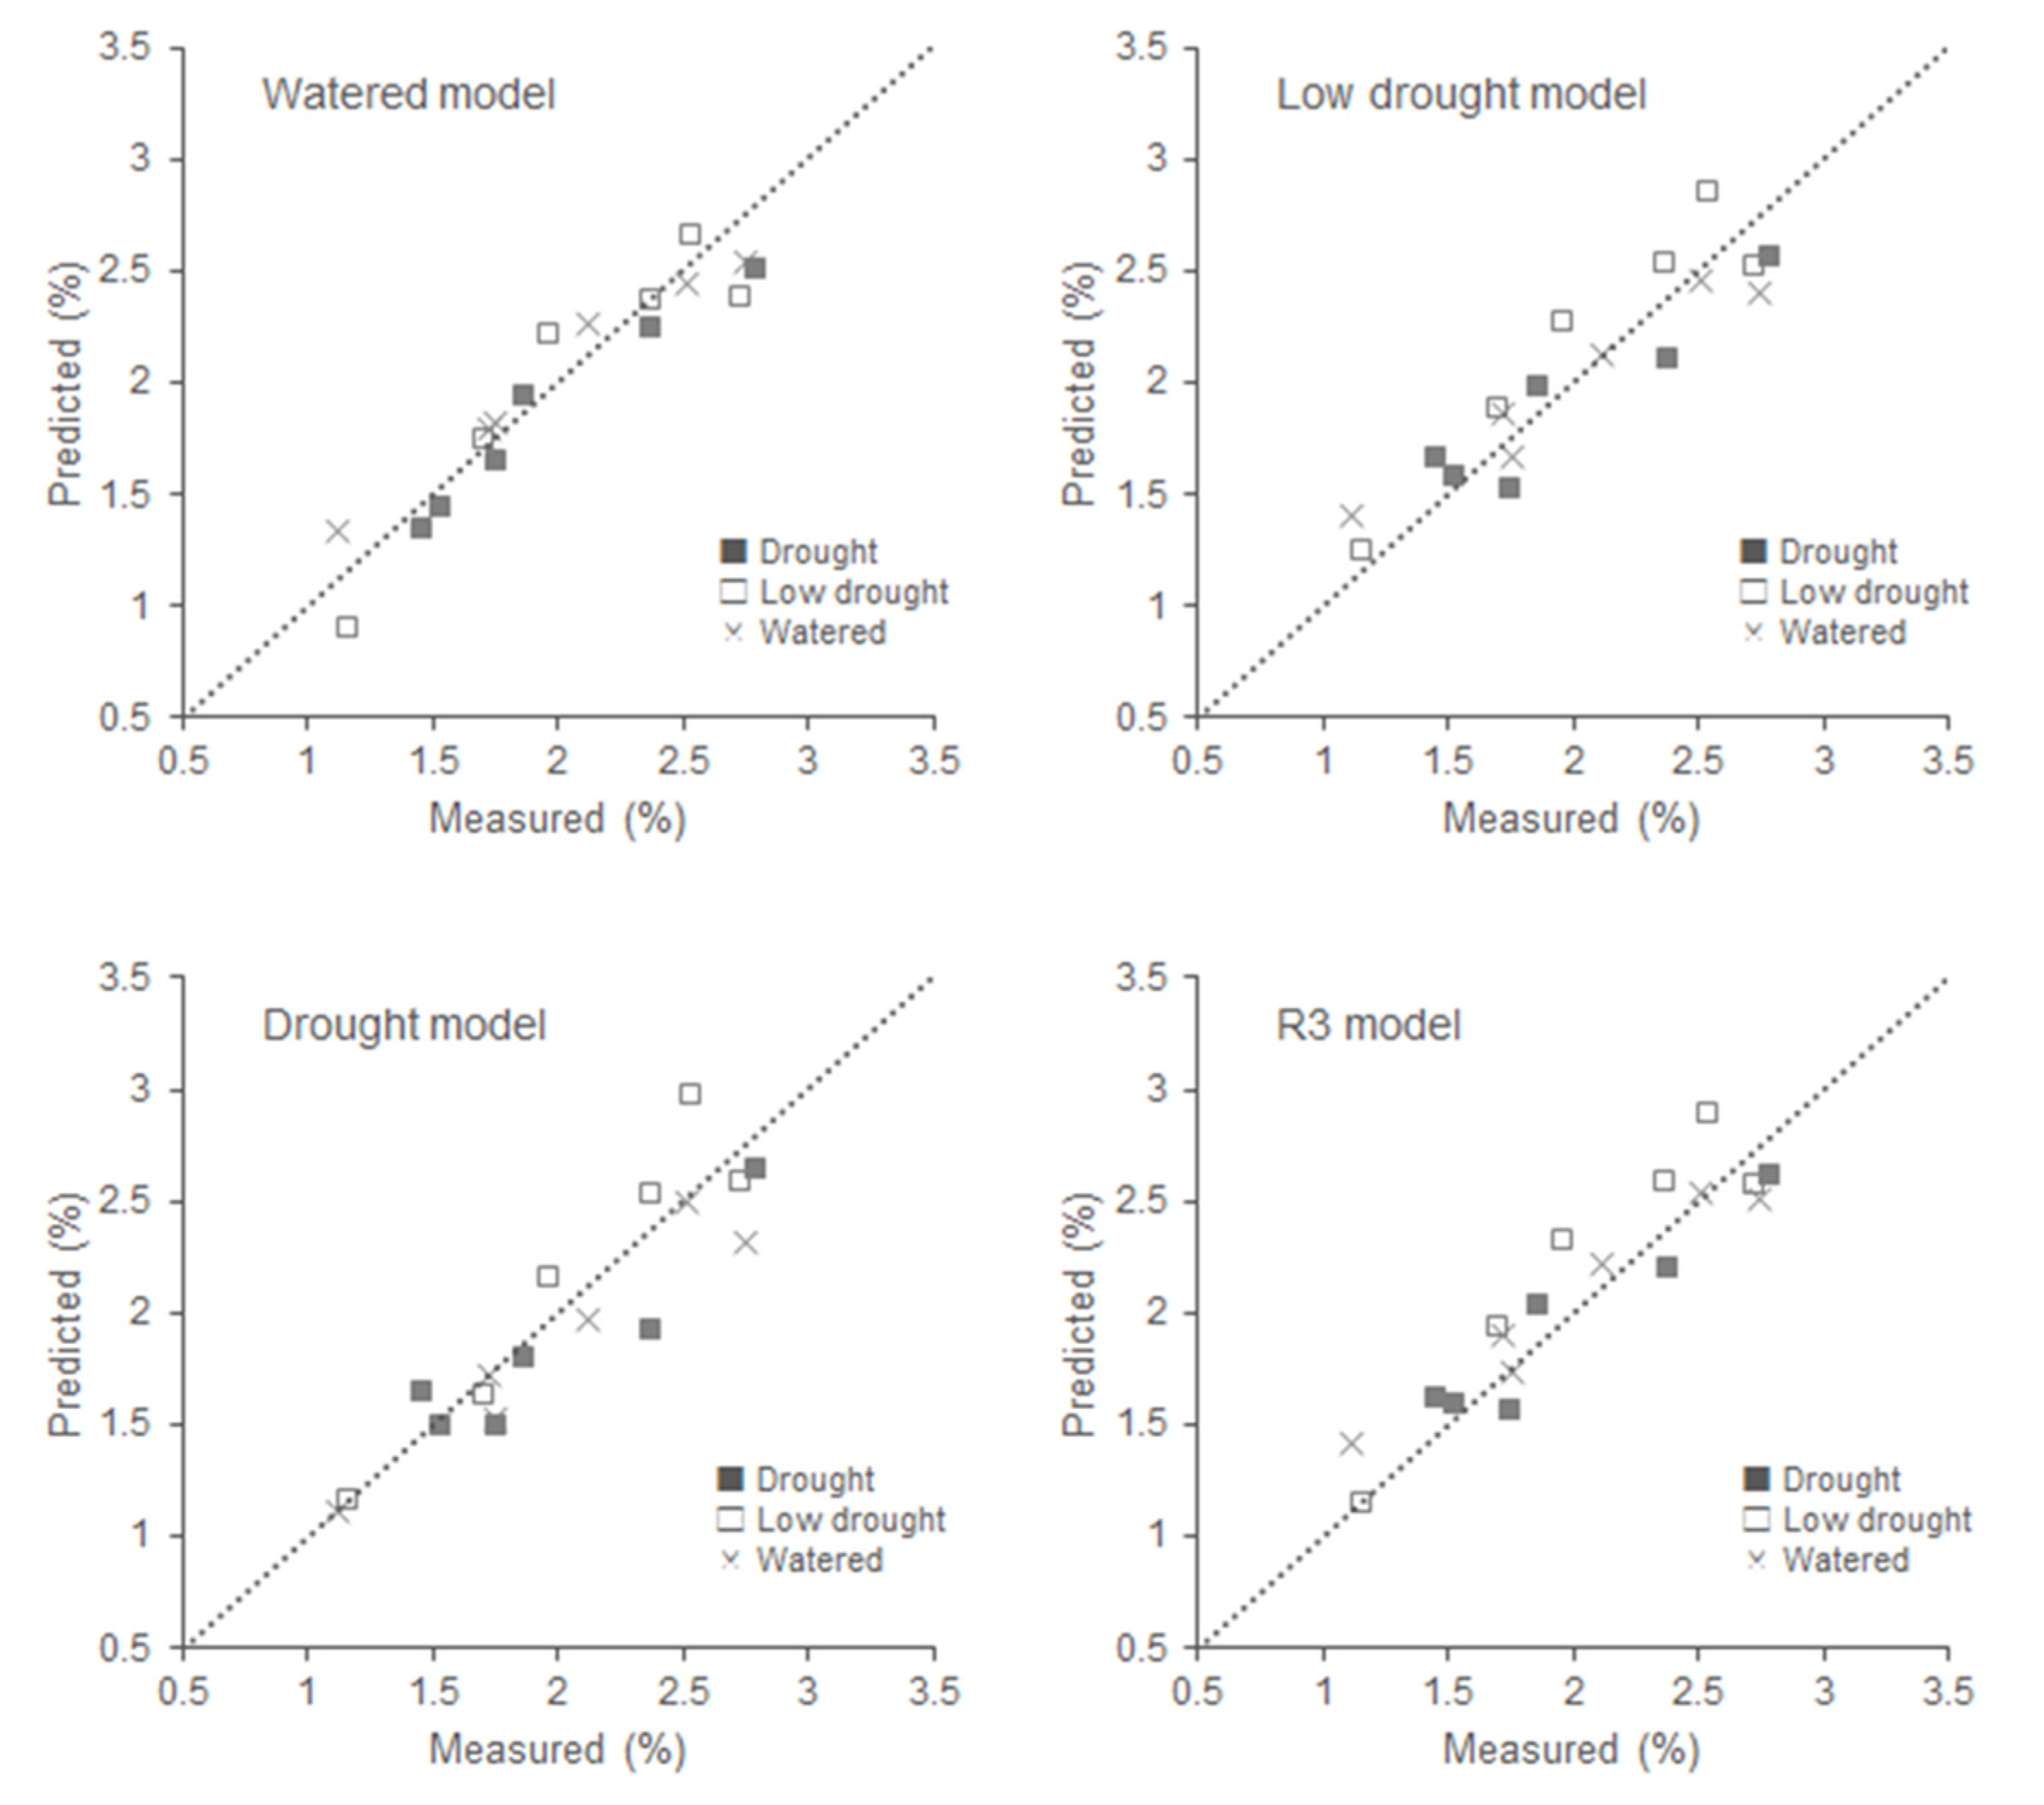
4.3. PLS Modeling for N Content Prediction

Similar approaches were tested to investigate the water treatment effect on N content prediction. Three PLS models for N content prediction were built using three different water treatment sub-datasets. Figure 7 shows the relationships between the measured and predicted N content. The predicted N content from each model was plotted against the reference N content. Table 4 provides detailed statistical results from different water-level training dataset approaches. In addition, another three prediction models (R1, R2, and R3) using randomly selected datasets were also applied. Then, the predicted value was plotted against the reference value in Figure 6, and the statistical results are shown in Table 4.

5. Discussion

5.1. Effects of N and Water Treatments on RWC and N Content Ground Truth

There was a significantly clear water treatment effect as well as an N treatment effect shown in the ANOVA, but no significant water × N interaction effect was found for RWC ground truth (Table 2). This means that both water and N treatment certainly affected RWC ground truth, but each treatment worked independently and there was no positive or negative synergistic effect. As in the case with RWC, the ANOVA confirmed that N content ground truth was significantly affected by N treatment as well as water treatment, but no significant water × N interaction effect was found for N content ground truth (Table 2). This means both N and water treatment certainly affected N content ground truth, but each treatment worked independently and there was no positive or negative synergistic effect. These results indicated that the design of this experiment was successful and created a large variation in plant RWC and N content across the water and N treatments. This also provided a reliable base to examine both the N treatment effect for RWC prediction and the water treatment effect for N content prediction with hyperspectral images.

5.2. N Treatment Effect on PLS Modeling for RWC Prediction

N and water stresses are often confounded and produce overlapping symptoms of plant stress. To determine how N treatment influences RWC prediction by hyperspectral imaging, three PLS models were built using three different N treatment sub-datasets.
Figure 6 shows the relationships between measured and predicted RWC. In the case of RWC prediction with the High-N base model, many of the lower N-level plants (crosses and open circles) were plotted above the 1:1 line. This means lower N levels cause the predictions to be higher than the reference measurements. The Low-N base model displayed an opposite trend. Some of the higher N-level plants (open and filled circles) tended to be plotted below the 1:1 line. This means that higher N levels cause the predictions to be lower than the reference measurements. The Medium-N base model seems to have no bias.
Table 3 provided detailed statistical results from different N-level training dataset approaches. RMSE is a good measure of how accurately the model predicted the response, and it is the most important criterion for fit if the main purpose of the model was prediction. Among the three individual N treatment approaches, the accuracy of RWC prediction fluctuated depending on the N treatment level. The Medium-N model showed the highest accuracy (lowest RMSE) and the High-N-based model showed the lowest accuracy (highest RMSE). RPD also showed a similar trend. RPD is widely used as a criterion to evaluate the usefulness of prediction models in analytical chemistry and chemometric modeling [39,40]. Ge et al. [13] and Pandey et al. [22] used RPD to assess their hyperspectral models to predict the water content as well as the nutrient concentration of plants. There were three categories: (A). good models RPD > 2.0; (B). fair models RPD = 1.4~2.0; and (C). non-reliable models RPD < 1.4 [39]. Following this category standard, only the Medium-N model belonged to good models. Conversely, the High-N model indicated non-reliable model performance. These results demonstrated that RWC prediction models using hyperspectral data are potentially impacted by N stress. We expected that using the dataset with water and N dual stresses can help to improve the accuracy and robustness of the model.
To confirm this idea, another three models (R1, R2, and R3) using randomly selected datasets were applied. The R3 scatterplot in Figure 5 showed less bias. Samples from Low-N, Medium-N, and High-N were plotted uniformly around the 1:1 line. RMSEV and RPD in Table 3 also looked improved. In conclusion, the dataset with water and N dual stresses can help to build an accurate and robust PLS model for RWC prediction by using hyperspectral data.

5.3. Water Treatment Effect on PLS Modeling for N Content Prediction N

Correspondingly, three PLS models for N content prediction were built using three different water treatment sub-datasets to investigate the water treatment effect on N content prediction.
Figure 7 shows the relationships between measured and predicted N content. As contrasted with the RWC prediction in Figure 6, the scatter of crosses (samples from Watered), open squares (samples from Low drought), and filled squares (samples from Drought) around the 1:1 line were quite consistent. There was no overestimation or underestimation of the difference in water treatment. Table 4 provides detailed statistical results from different water-level training dataset approaches. The results of RMSE and RPD for N content prediction also showed steady performance regardless of the water-level difference in model building.
In addition, another three prediction models (R1, R2, and R3) using randomly selected datasets were also applied. Figure 7 and Table 4 show that there was no significant improvement in N content prediction by using the dataset with water and N dual stresses. We expected the water and N stress phenotypes to overlap each other because N deficiency as a result of drought is the largest contributor to the decrease in growth under drought stress [26]. However, in contrast to the N treatment impact on RWC prediction, the PLS prediction for N content was found to be robust against the water status difference in plants.

5.4. The Limitation of This Study

Though the importance of growing plants under both water and N stresses has been suggested, further study is still needed to improve the model applicability and accuracy of plant water status estimation. For example, the two types of stresses may show significantly different color distribution patterns between the different leaf areas such as the base, edge, tip, mid-rib, secondary veins, and mesophyll. Analysis of these color distribution patterns may provide more accurate models to clearly differentiate between N and water stresses. Purdue University’s LeafSpec hyperspectral leaf imager [41] is a new sensor technology providing high-quality single-leaf hyperspectral images with 0.5 mm resolution, which enables such spatial stress distribution analyses. Preliminary studies with this 2021 Davidson Prize winner technology have already shown advantages in accurate plant stress detection [42].

6. Conclusions

In this study, we investigated how N stress influences water status predictions, as well as how water stress affects N status predictions through hyperspectral imaging. We conducted hyperspectral imaging for maize plants under three-level N treatments inter-leaved with three-level water treatments. Then, PLS models to predict RWC and N content were developed and their accuracy and robustness were compared according to the different N treatment datasets and different water treatment datasets, respectively. The results demonstrated that the PLS prediction for RWC using hyperspectral data was potentially impacted by the N stress difference. Furthermore, the dataset with water and N dual stresses improved model accuracy and robustness. Conversely, the PLS prediction for N content was found to be robust against the water stress difference. In conclusion, we suggested that water and N dual treatments can be helpful in building models with wide applicability and high accuracy for evaluating plant water status, such as RWC.
In the future, other limitation factors should be included to further improve the model’s applicability and accuracy. We conducted similar hyperspectral plant phenotyping research previously in terms of multi-species [25] and different imaging angles [34]. These findings should be combined to develop a broader solution. We also plan to include our new sensor technology, the LeafSpec hyperspectral imager [41], to detect single-leaf high-quality stress distribution. This approach could provide high-quality predictions of plant conditions.

Author Contributions

Conceptualization, H.M. and J.J.; methodology, H.M., V.L., D.M., M.R.T. and J.J.; software, H.M. and D.M.; validation, H.M.; formal analysis, H.M.; investigation, H.M. and V.L.; resources, M.R.T. and J.J.; data curation, H.M. and D.M.; writing—original draft preparation, H.M.; writing—review and editing, H.M., M.Y. and J.J.; visualization, H.M. and D.M.; supervision, M.R.T., M.Y. and J.J.; project administration, J.J.; funding acquisition, J.J. All authors have read and agreed to the published version of the manuscript.

Funding

This research was funded by Sumitomo Chemical, grant number 16121941.

Institutional Review Board Statement

Not applicable.

Informed Consent Statement

Not applicable.

Data Availability Statement

The data presented in this study are available on request from the corresponding author. The data are not publicly available due to confidentiality.

Acknowledgments

We are grateful to Sylvie Brouder for help in analyzing the nitrogen content, and Michael Mickelbart for help in analyzing the relative water content.

Conflicts of Interest

The authors declare no conflict of interest.

References

  1. Farooq, M.; Hussain, M.; Wahid, A.; Siddique, K.H.M. Drought Stress in Plants: An Overview. In Plant Responses to Drought Stress; Springer: Berlin/Heidelberg, Germany, 2012; pp. 1–33. [Google Scholar]
  2. Jamieson, P.D.; Martin, R.J.; Francis, G.S. Drought influences on grain yield of barley, wheat, and maize. New Zealand J. Crop. Hortic. Sci. 1995, 23, 55–66. [Google Scholar] [CrossRef]
  3. Shao, H.B.; Chu, L.Y.; Jaleel, C.A.; Manivannan, P.; Panneerselvam, R.; Shao, M.A. Understanding Water Deficit Stress-Induced Changes in the Basic Metabolism of Higher Plants-Biotechnologically and Sustainably Improving Agri-culture and the Ecoenvironment in Arid Regions of the Globe. Crit. Rev. Biotechnol. 2009, 29, 131–151. [Google Scholar] [CrossRef] [PubMed]
  4. Harrison, M.T.; Tardieu, F.; Dong, Z.; Messina, C.D.; Hammer, G.L. Characterizing drought stress and trait influence on maize yield under current and future conditions. Glob. Chang. Biol. 2014, 20, 867–878. [Google Scholar] [CrossRef] [PubMed]
  5. Farooq, M.; Wahid, A.; Kobayashi, N.; Fujita, D.; Basra, S.M.A. Plant drought stress: Effects, mechanisms and management. Agron. Sustain. Dev. 2009, 29, 185–212. [Google Scholar] [CrossRef]
  6. Reddy, A.R.; Chaitanya, K.V.; Vivekanandan, M. Drought-induced responses of photosynthesis and antioxidant metabolism in higher plants. J. Plant Physiol. 2004, 161, 1189–1202. [Google Scholar] [CrossRef]
  7. Marschner, H. Functions of Mineral Nutrients; Macronutrients. In Mineral Nutrition of Higher Plants; Academic Press: Cambridge, MA, USA, 1995; pp. 229–312. [Google Scholar]
  8. Crafts-Brandner, S.J.; Hölzer, R.; Feller, U. Influence of nitrogen deficiency on senescence and the amounts of RNA and proteins in wheat leaves. Physiol. Plant. 1998, 102, 192–200. [Google Scholar] [CrossRef]
  9. Evans, J.R. Photosynthesis and nitrogen relationships in leaves of C3 plants. Oecologia 1989, 78, 9–19. [Google Scholar] [CrossRef] [PubMed]
  10. Zhao, D.; Reddy, K.R.; Kakani, V.G.; Reddy, V.R. Nitrogen deficiency effects on plant growth, leaf photosynthesis, and hyperspectral reflectance properties of sorghum. Eur. J. Agron. 2005, 22, 391–403. [Google Scholar] [CrossRef]
  11. Muñoz-Huerta, R.F.; Guevara-Gonzalez, R.G.; Contreras-Medina, L.M.; Torres-Pacheco, I.; Prado-Olivarez, J.; Ocampo-Velazquez, R.V. A Review of Methods for Sensing the Nitrogen Status in Plants: Advantages, Disadvantages and Recent Advances. Sensors 2013, 13, 10823–10843. [Google Scholar] [CrossRef]
  12. Turner, N.C. Techniques and experimental approaches for the measurement of plant water status. Plant Soil 1981, 58, 339–366. [Google Scholar] [CrossRef]
  13. Ge, Y.; Bai, G.; Stoerger, V.; Schnable, J.C. Temporal dynamics of maize plant growth, water use, and leaf water content using automated high throughput RGB and hyperspectral imaging. Comput. Electron. Agric. 2016, 127, 625–632. [Google Scholar] [CrossRef]
  14. Jin, X.; Xu, X.; Song, X.; Li, Z.; Wang, J.; Guo, W. Estimation of Leaf Water Content in Winter Wheat Using Grey Relational Analysis–Partial Least Squares Modeling with Hyperspectral Data. Agron. J. 2013, 105, 1385–1392. [Google Scholar] [CrossRef]
  15. Kovar, M.; Brestic, M.; Sytar, O.; Barek, V.; Hauptvogel, P.; Zivcak, M. Evaluation of Hyperspectral Reflectance Parameters to Assess the Leaf Water Content in Soybean. Water 2019, 11, 443. [Google Scholar] [CrossRef]
  16. Krishna, G.; Sahoo, R.N.; Singh, P.; Bajpai, V.; Patra, H.; Kumar, S.; Dandapani, R.; Gupta, V.K.; Viswanathan, C.; Ahmad, T.; et al. Comparison of various modelling approaches for water deficit stress monitoring in rice crop through hyperspectral remote sensing. Agric. Water Manag. 2019, 213, 231–244. [Google Scholar] [CrossRef]
  17. Pôças, I.; Gonçalves, J.; Costa, P.M.; Gonçalves, I.; Pereira, L.S.; Cunha, M. Hyperspectral-based predictive modelling of grapevine water status in the Portuguese Douro wine region. Int. J. Appl. Earth Obs. Geoinform. 2017, 58, 177–190. [Google Scholar] [CrossRef]
  18. Abdel-Rahman, E.M.; Ahmed, F.; Ismail, R. Random forest regression and spectral band selection for estimating sugarcane leaf nitrogen concentration using EO-1 Hyperion hyperspectral data. Int. J. Remote Sens. 2013, 34, 712–728. [Google Scholar] [CrossRef]
  19. Li, F.; Mistele, B.; Hu, Y.; Chen, X.; Schmidhalter, U. Reflectance estimation of canopy nitrogen content in winter wheat using optimised hyperspectral spectral indices and partial least squares regression. Eur. J. Agron. 2014, 52, 198–209. [Google Scholar] [CrossRef]
  20. Sabzi, S.; Pourdarbani, R.; Rohban, M.H.; García-Mateos, G.; Arribas, J.I. Estimation of nitrogen content in cucumber plant (Cucumis sativus L.) leaves using hyperspectral imaging data with neural network and partial least squares regressions. Chemom. Intell. Lab. Syst. 2021, 217, 104404. [Google Scholar] [CrossRef]
  21. Yu, X.; Lu, H.; Liu, Q. Deep-learning-based regression model and hyperspectral imaging for rapid detection of nitrogen concentration in oilseed rape (Brassica napus L.) leaf. Chemom. Intell. Lab. Syst. 2018, 172, 188–193. [Google Scholar] [CrossRef]
  22. Pandey, P.; Ge, Y.; Stoerger, V.; Schnable, J.C. High Throughput In vivo Analysis of Plant Leaf Chemical Properties Using Hyperspectral Imaging. Front. Plant Sci. 2017, 8, 1348. [Google Scholar] [CrossRef]
  23. Bruning, B.; Liu, H.; Brien, C.; Berger, B.; Lewis, M.; Garnett, T. The Development of Hyperspectral Distribution Maps to Predict the Content and Distribution of Nitrogen and Water in Wheat (Triticum aestivum). Front. Plant Sci. 2019, 10, 1380. [Google Scholar] [CrossRef] [PubMed]
  24. Corti, M.; Gallina, P.M.; Cavalli, D.; Cabassi, G. Hyperspectral imaging of spinach canopy under combined water and nitrogen stress to estimate biomass, water, and nitrogen content. Biosyst. Eng. 2017, 158, 38–50. [Google Scholar] [CrossRef]
  25. Lin, M.-Y.; Lynch, V.; Ma, D.; Maki, H.; Jin, J.; Tuinstra, M. Multi-Species Prediction of Physiological Traits with Hyperspectral Modeling. Plants 2022, 11, 676. [Google Scholar] [CrossRef] [PubMed]
  26. Heckathorn, S.A.; DeLucia, E.H.; Zielinski, R.E. The contribution of drought-related decreases in foliar nitrogen concentration to decreases in photosynthetic capacity during and after drought in prairie grasses. Physiol. Plant. 1997, 101, 173–182. [Google Scholar] [CrossRef]
  27. He, M.; Dijkstra, F.A. Drought effect on plant nitrogen and phosphorus: A metaanalysis. New Phytol. 2014, 204, 924–931. [Google Scholar] [CrossRef]
  28. Rouphael, Y.; Cardarelli, M.; Schwarz, D.; Franken, P.; Colla, G. Effects of Drought on Nutrient Uptake and Assimilation in Vegetable Crops. In Plant Responses to Drought Stress; Aroca, R., Ed.; Springer: Berlin/Heidelberg, Germany, 2012; pp. 171–195. [Google Scholar] [CrossRef]
  29. Cramer, M.D.; Hawkins, H.-J.; Verboom, G.A. The importance of nutritional regulation of plant water flux. Oecologia 2009, 161, 15–24. [Google Scholar] [CrossRef]
  30. Yousfi, S.; Marín, J.; Parra, L.; Lloret, J.; Mauri, P.V. Remote sensing devices as key methods in the advanced turfgrass phenotyping under different water regimes. Agric. Water Manag. 2022, 266, 107581. [Google Scholar] [CrossRef]
  31. Colovic, M.; Yu, K.; Todorovic, M.; Cantore, V.; Hamze, M.; Albrizio, R.; Stellacci, A.M. Hyperspectral Vegetation Indices to Assess Water and Nitrogen Status of Sweet Maize Crop. Agronomy 2022, 12, 2181. [Google Scholar] [CrossRef]
  32. Hoagland, D.R.; Arnon, D.I. Growing plants without soil by the water-culture method. Circ. Calif. Agric. Exp. Stn. 1938, 1–16. [Google Scholar]
  33. Hoagland, D.R.; Arnon, D.I. The water-culture method for growing plants without soil. Circ. Calif. Agric. Exp. Stn. 1950, 347, 1–32. [Google Scholar]
  34. Zhang, L.; Maki, H.; Ma, D.; Sánchez-Gallego, J.A.; Mickelbart, M.V.; Wang, L.; Rehman, T.U.; Jin, J. Optimized angles of the swing hyperspectral imaging system for single corn plant. Comput. Electron. Agric. 2019, 156, 349–359. [Google Scholar] [CrossRef]
  35. Zhao, Y.-R.; Yu, K.-Q.; He, Y. Hyperspectral Imaging Coupled with Random Frog and Calibration Models for Assessment of Total Soluble Solids in Mulberries. J. Anal. Methods Chem. 2015, 2015, 343782. [Google Scholar] [CrossRef] [PubMed]
  36. Cotrozzi, L.; Couture, J.J.; Cavender-Bares, J.; Kingdon, C.C.; Fallon, B.; Pilz, G.; Pellegrini, E.; Nali, C.; Townsend, P.A. Using foliar spectral properties to assess the effects of drought on plant water potential. Tree Physiol. 2017, 37, 1582–1591. [Google Scholar] [CrossRef] [PubMed]
  37. Nigon, T.J.; Mulla, D.J.; Rosen, C.J.; Cohen, Y.; Alchanatis, V.; Knight, J.; Rud, R. Hyperspectral aerial imagery for detecting nitrogen stress in two potato cultivars. Comput. Electron. Agric. 2015, 112, 36–46. [Google Scholar] [CrossRef]
  38. R Core Team R: A Language and Environment for Statistical Computing. R Foundation for Statistical Computing, Vienna, Austria. 2018. Available online: https://www.R-project.org (accessed on 23 May 2023).
  39. Chang, C.-W.; Laird, D.A.; Mausbach, M.J.; Hurburgh, C.R., Jr. Near-Infrared Reflectance Spectroscopy-Principal Components Regression Analyses of Soil Properties. Soil Sci. Soc. Am. J. 2001, 65, 480–490. [Google Scholar] [CrossRef]
  40. Fearn, T. Assessing Calibrations: SEP, RPD, RER and R2. NIR News 2002, 13, 12–14. [Google Scholar] [CrossRef]
  41. Wang, L.; Jin, J.; Song, Z.; Wang, J.; Zhang, L.; Rehman, T.U.; Ma, D.; Carpenter, N.R.; Tuinstra, M.R. LeafSpec: An accurate and portable hyperspectral corn leaf imager. Comput. Electron. Agric. 2020, 169, 105209. [Google Scholar] [CrossRef]
  42. Ma, D.; Wang, L.; Zhang, L.; Song, Z.; Rehman, T.U.; Jin, J. Stress Distribution Analysis on Hyperspectral Corn Leaf Images for Improved Phenotyping Quality. Sensors 2020, 20, 3659. [Google Scholar] [CrossRef]
Figure 1. The growth of maize plants on 2nd, 4th, and 7th week after sowing: (a) 2nd week, (b) 4th week, (c) 7th week.
Ai 04 00036 g001
Figure 2. The diagram of whole image processing steps.
Ai 04 00036 g002
Figure 3. The top view images of maize in the hyperspectral imaging tower and the segmented binary images.
Ai 04 00036 g003
Figure 4. Boxplots of RWC in maize plant leaves. X indicates mean values and circle indicates outliers in the boxplots.
Ai 04 00036 g004
Figure 5. Boxplots of N content in maize plant leaves. X indicates mean values in the boxplots.
Ai 04 00036 g005
Figure 6. Scatterplots of measured RWC vs. predicted RWC for the test set (n = 18).
Ai 04 00036 g006
Figure 7. Scatterplots of measured N content vs. predicted N content for the test set (n = 18).
Ai 04 00036 g007
Table 1. N and water treatment combinations.
N TreatmentWater Treatment Number of Plants
TrainingTestTotal
Low NWatered10212
Low Drought10212
Drought10212
Medium NWatered10212
Low Drought10212
Drought10212
High NWatered10212
Low Drought10212
Drought10212
(Total) 9018108
Table 2. Two-way ANOVA results of the effect of N and water treatments on RWC and N content.
FactorDfANOVA on RWCANOVA on N Content
Fp Fp
Nitrogen26.8640.002**98.785<0.001***
Water213.044<0.001***5.1360.008**
Nitrogen × Water40.6340.640 1.0130.405
Note: Significant levels are indicated with ** p < 0.01, *** p < 0.001.
Table 3. Results of predicting RWC of maize plants using hyperspectral imaging with different datasets.
Sub-DatasetTraining (n = 30)Test (n = 18)
ApproachLabelPLS CompR2RMSECVRPDR2RMSEVRPD
Individual water treatmentWatered80.6986.011.800.8317.351.70
Low drought40.6326.961.630.9115.502.27
Drought50.8495.732.560.83214.440.87
Randomly selectedR170.7577.362.000.9344.732.64
R240.6237.101.610.7237.381.69
R340.7286.271.900.8545.272.37
Table 4. Results of predicting N content of maize plants using hyperspectral imaging with different datasets.
Sub-DatasetTraining (n = 30)Test (n = 18)
ApproachLabelPLS CompR2RMSECVRPDR2RMSEVRPD
Individual water treatmentWatered10.7990.2042.230.8960.1703.06
Low drought30.8090.1932.280.8420.2102.47
Drought50.8200.2042.340.8350.2232.33
Randomly selectedR140.7720.2322.080.8530.2122.45
R210.8000.1702.240.8960.1723.02
R330.8540.1972.590.8630.2062.52
Disclaimer/Publisher’s Note: The statements, opinions and data contained in all publications are solely those of the individual author(s) and contributor(s) and not of MDPI and/or the editor(s). MDPI and/or the editor(s) disclaim responsibility for any injury to people or property resulting from any ideas, methods, instructions or products referred to in the content.

