Article

Sensitivity Analysis of a Driver’s Lumped Parameter Model in the Evaluation of Ride Comfort

Vehicles Laboratory, School of Mechanical Engineering, National Technical University of Athens, 15772 Zografou, Greece
*
Author to whom correspondence should be addressed.
Vehicles 2023, 5(3), 1030-1045; https://doi.org/10.3390/vehicles5030056
Submission received: 20 July 2023 / Revised: 11 August 2023 / Accepted: 23 August 2023 / Published: 25 August 2023

Abstract

:
The ride comfort provided by a vehicle to the driver and the passengers is an important feature, directly correlated to the technical characteristics of the suspension system of the vehicle. In the literature, several lumped-parameter models simulating the vehicle and the driver are proposed for the computational evaluation of ride comfort. In order to quantify ride comfort, other than the values of acceleration, metrics such as seat effective amplitude transmissibility (SEAT) and seat-to-head transmissibility (STHT) are utilized. In this paper, a quarter car model is coupled with a six-degree-of-freedom lumped-parameter model, consisting of the driver’s seat and the driver. A sensitivity analysis is performed on the values of the lumped parameters of the seated human body with regard to ride comfort in order to evaluate the effect of their accuracy relative to the ride comfort evaluation. The results of the sensitivity analysis revealed that the values of the mass, the stiffness and the damping parameters of the seated human model influence the ride-comfort metrics to a different extent. Furthermore, it was depicted that ride-comfort metrics were affected in different manners depending on the characteristics of the excitation of the vehicle, yet less than 10% Finally, the importance of the consideration of single-disturbance excitations in such sensitivity studies emerged.

1. Introduction

All physical systems consisting of a mass and an elasticity element are capable of vibration, hence of an oscillatory movement of the system about an equilibrium point. On a traveling ground vehicle, this vibration is caused from the contact of its tires on the road surface and other external disturbances. In all ground vehicles, the vibration is induced through their suspension system to their chassis and the seats and ultimately on the driver and the passengers themselves, affecting their bodies [1]. Each human being perceives vibration in a differ manner and to a differ extent; yet, in a traveling vehicle, the driver and/or passengers might experience a growing feeling of discomfort, digestion problems or even fatigue due to the vibrations of the vehicle. The ride comfort provided by a vehicle can be considered good if the maximum value of acceleration of the vehicle is less than 0.5 m s 2 [2]. In ISO 2631-1:1997 [3] and its amendment in 2010 [4], more detailed guidelines on the comfort and perception of whole-body vibration are provided.
The suspension system of a vehicle influences both its handling and its ride, isolating the chassis of the traveling vehicle from the vibration inflicted by the road. Furthermore, professional vehicles in particular have seat-suspension systems enhancing ride comfort, reducing fatigue during driving and improving the health and safety of the drivers [5]. In order to predict, evaluate or optimize the ride comfort provided by a vehicle several computational models exist in the literature. Lumped-parameter models comprise a popular tool for such simulations since they are capable of monitoring the dynamic response of systems with satisfactory computational cost compared to multi-body dynamics models and finite element models [6]. A typical lumped-parameter model contains a number of mass elements interconnected with linear or nonlinear springs and dampers modeled as elastic and damping elements. The number of possible translational or rotational movements of each mass element constitutes the number of degrees of freedom (DOFs) of the lumped-parameter model.
The simplest lumped-parameter model of a vehicle retrieved in the literature, namely, the quarter car model, is a two-DOF model, consisting of an unsprung and a sprung mass interconnected with a pair of an elastic and a damping element simulating the suspension system. In order to evaluate the ride comfort of the vehicle, several modifications of the quarter-car model have been proposed, ranging from the incorporation of the seat as a mass element to the incorporation of the human body as one or more mass elements interconnected with the elastic and damping elements [7,8].
In order to optimize ride comfort, enhanced vehicle lumped-parameter models exist. In more detail, Chen et al. [9] used a three-DOF model consisting of the vehicle and the seat. A seven-DOF lumped-parameter model was used for the estimation of the vibration isolation performance of a seating suspension system [10]. This model consists of the vehicle, the seat and the driver. A more complex lumped-parameter model consisting of eight DOFs, again, simulating the vehicle, the seat and the driver, was used by Du et al. [11] in order to design a control strategy for the improvement of the suspension performance as far as ride comfort is concerned. The same model has been also used for the optimization of the suspension in terms of ride comfort [12], for the investigation of the performance of a semi-active seat suspension [13] and for the design of a controller that improves ride comfort.
This eight-DOF vehicle–seat–driver lumped-parameter model incorporates the biodynamic model of the driver proposed by Boileau et al. [14]. In general, the biodynamic models of the human body comprise various masses interconnected with elastic and damping elements simulating different types of human tissue. Each mass simulates a part of the human body, while the springs and the dampers simulate soft tissue such as muscles, ligaments and intervertebral discs which bond different parts of human body. Since the human body is a complex structure with a high degree of diversity and the stiffness and damping properties of human tissue cannot be uniquely determined, the parameters of the lumped-parameter models are not consistent with the actual parameters of human anatomy and biodynamics [15]. This raises the question of whether the values of the lumped parameters of the seated human body existing in the literature provide results that can be extrapolated to all human body types. Furthermore, it stresses the importance of knowing the manner in which a variation in each value of the lumped parameters affects the evaluated ride comfort of the system.
The present paper addresses the aforementioned issues presenting a sensitivity analysis of the values of the lumped parameters of the seated human model in order to evaluate the degree to which the differentiation in the human body affects the computationally evaluated ride comfort. Within this frame, the lumped-parameter model used to simulate the vehicle–seat–driver dynamic system in the vertical plane is presented. Initially, ride comfort is evaluated using typical parameter values used in the literature in four road excitations with different characteristics. Then, a sensitivity analysis of the values of the mass, the stiffness and the damping elements composing the human body is performed. The dependence of three different metrics of ride comfort evaluation on the values of the lumped parameters is investigated in single, periodic and stochastic excitations. It was shown that each type of parameter affects the ride comfort evaluation in a different way depending also on the type of excitation. Moreover, it was observed that the response of the system to the single-excitation disturbance is more susceptible to the variation of the values of the parameters of the seated human body compared to the periodic and the stochastic disturbances.

2. Numerical Modeling

In this section, the lumped-parameter model used for the sensitivity analysis as well as the road excitations used as inputs are described in detail.

2.1. Lumped-Parameter Model

Sensitivity analysis is performed in a lumped-parameter model consisting of three parts: the vehicle, the seat and the human body in a seated position. For the simulation of the vehicle, a linear quarter-car model consisting of two DOFs is used [16]. The driver’s seat is simulated with two DOFs [12]; for the seated human body, the four-DOF lumped-parameter model proposed by Boileau and Rakheja [14,17] is used. The final lumped-parameter model consisting of eight DOFs ( x h , x u t , x l t , x t p , x s t , x c f , x s and x u ) is presented in Figure 1.
Using Newton’s second law, the set of the linear differential equations which describe the dynamic behavior of the lumped-parameter model are derived and presented in Equations (1)–(8).
m h · x h ¨ = k h · ( x h x u t ) c h · ( x h ˙ x u t ˙ )
m u t · x u t ¨ = k h · ( x h x u t ) + c h · ( x h ˙ x u t ˙ ) k u t · ( x u t x l t ) c u t · ( x u t ˙ x l t ˙ )
m l t · x l t ¨ = k u t · ( x u t x l t ) + c u t · ( x u t ˙ x l t ˙ ) k l t · ( x l t x t p ) c l t · ( x l t ˙ x t p ˙ )
m t p · x t p ¨ = k l t · ( x l t x t p ) + c u t · ( x l t ˙ x t p ) ˙ k t p · ( x t p x s t ) c t p · ( x t p ˙ x s t ˙ )
m s t · x s t ¨ = k t p · ( x t p x s t ) + c t p · ( x t p ˙ x s t ˙ ) k s t · ( x s t x c f ) c s t · ( x s t ˙ x c f ˙ )
m c f · x c f ¨ = k s t · ( x s t x c f ) + c s t · ( x s t ˙ x c f ˙ ) k c f · ( x c f x s ) c c f · ( x c f ˙ x s ˙ )
m s · x s ¨ = k c f · ( x c f x s ) + c c f · ( x c f ˙ x s ˙ ) k s · ( x s x u ) c s · ( x s ˙ x u ˙ )
m u · x u ¨ = k s · ( x s x u ) + c s · ( x s ˙ x u ˙ ) k u · ( x u y )
The values for all the lumped parameters of the model were defined according to the literature. In more detail, the vehicle model included in the green rectangle in Figure 1 consists of a sprung m s = 270 kg and an unsprung mass m u = 27 kg, simulating a passenger’s vehicle of an average size and a total weight equal to approximately 1200 kg. The sprung and the unsprung masses are connected with a linear spring of stiffness k s = 20,000 N/m and a linear damper with a damping coefficient c s = 2000 Ns/m simulating the passive suspension system of a typical vehicle. The tire stiffness was modeled as a vertical spring with a stiffness coefficient k u = 160,000 N/m, while the tire damping coefficient was considered negligible, and no nonlinearities were considered [16,18].
The seat was modeled as a system of two masses, depicted in the orange rectangle. The structural part of the seat is that of the cabin and frame ( m c f = 15 kg), which simulates the frame of the seat and its mounting on the vehicle body, followed by the seat cushion ( m s t = 1 kg). These two masses are connected to each other with a stiffness element ( k s t = 18,000 N/m) and a damping element ( c s t = 200 Ns/m), while the cabin and frame mass is connected to the vehicle in the same way ( k c f = 31,000 N/m c c f = 830 Ns/m), simulating the mounting of the seat on the floor of the vehicle.
Finally, the human body is divided into four body parts, namely, the head and neck ( m h = 5.31 kg), the chest and upper torso ( m u t = 28.49 kg), the lower torso ( m l t = 8.62 kg) and the thighs and pelvis ( m t p = 12.78 kg) [14,17]. According to Boileau et al. [17], the values of these seated human body masses were calculated taking into consideration anthropometric data for the distribution of the total body weight to the different body parts. Furthermore, the fact that the seat supports only a part of the total body weight was also accounted for. In this human body model, the driver’s mass was considered approximately 75 kg, and the percentage of total body weight supported by the seat was considered equal to 73.6% according to the literature [17]. The values of the stiffness and damping elements used to connect the aforementioned masses are presented in Table 1.

2.2. Excitations

In order to simulate different driving scenarios, different types of excitation are proposed in the literature [16,19,20,21,22,23]. Single disturbance excitations are used to simulate local irregularities on the road profile, such as a speed bump or a pothole. On the other hand, to simulate the movement of the vehicle on typical roads, periodic or stochastic excitations are used. Periodic excitations simulate an ideal road profile, while the stochastic excitations simulate road profiles closer to real life having the inherent characteristic of stochasticity. In order to explore the interdependence between the type of excitation and the values of the parameters of the seated human model, four excitations were used as y .

2.2.1. Single-Disturbance Excitations

Both a speed bump and a pothole were simulated, separately, for the single-disturbance excitations. They both have a trapezoid shape, as presented in Figure 2, and their length is equal to 0.500 m. The height of the speed bump is equal to 0.010 m, while the depth of the pothole is equal to 0.040 m [16].

2.2.2. Periodic Excitation

The periodic excitation was simulated as a sinusoidal function with an amplitude of 0.005 m [16] (Figure 3).

2.2.3. Stochastic Excitation

According to ISO 8608 [24], which classifies road profiles with respect to road quality, random road profiles contain stochastic excitations. Class A road profiles are the smoothest ones, while Class E road profiles simulate a very rough road. In Table 2, the power spectral density (PSD) values used in this ISO for the road-roughness classification are presented.
For the sensitivity analysis in this paper, a Class E road profile was depicted.

3. Results

In Section 3.1, the maximum and the root mean square (RMS) value of the vertical acceleration on the head of the driver along with the seat effective amplitude transmissibility (SEAT) and seat-to-head transmissibility (STHT) are evaluated using the lumped-parameter model presented in Section 2.1, with the parameter values retrieved in the literature. Then, in Section 3.2, a sensitivity analysis is performed on the values of each lumped parameter of the driver’s body within specified boundary values, and the dynamic response of the system is monitored again.
The lumped-parameter model was implemented in a MATLAB programming environment, and an ODE45 solver was used for the solution of the differential Equations (1)–(8).

3.1. Eight-DOF Lumped-Parameter Model with Default Parameter Values

The results in terms of maximum and RMS values of the vertical acceleration of the driver’s head in the eight-DOF lumped-parameter model are presented for all excitations (Table 3). In order to monitor the vertical acceleration, a sampling frequency of 200 Hz was used. The longitudinal speed of the vehicle was considered equal to 30 km/h for the single-disturbance excitations and to 80 km/h for the periodic and the stochastic excitations, which are typical speed values for such excitations.
In Table 3, the maximum value of vertical acceleration is presented for the single-disturbance excitations, while the RMS value is presented for the periodic and the stochastic excitation, due to their nature. It is worth mentioning that the RMS value of the driver’s head acceleration is often used as an objective for the optimization of ride comfort. In such optimization studies, the design variables are either the lumped parameters of the driver’s seat or the lumped parameters of the suspension of the vehicle [12,25,26,27]. In Table 3, it is observed that the maximum value of the driver’s head acceleration is highest for the pothole excitation compared to that of the speed bump excitation. Furthermore, it is obvious that the values of a driver’s head acceleration are lower for the stochastic excitation compared to the periodic one.
The transmission of vibration through a seat depends on the mechanical impedance of the body supported by the seat. Thus, SEAT and STHT have been used in the literature to predict or optimize ride comfort [1,10,28,29,30]. In the following Equations (9) and (10), SEAT and STHT are defined, respectively.
S E A T = R M S ( x s t ) ¨ R M S ( x c f ) ¨
S T H T = R M S ( x h ) ¨ R M S ( x s t ) ¨
The first metric is a non-dimensional ratio of the RMS of acceleration of the seat surface to the RMS of acceleration of the seat base. STHT is defined as the ratio of the RMS of acceleration of the driver’s head to the RMS of acceleration at the seat–body interface [15,31]. In Table 4, the values of SEAT and STHT for all excitations are presented. Both single-excitation disturbances have the same value for both SEAT and STHT. The periodic excitation provides slightly higher values of the metrics, while the Grade E road profile provides values almost 40% lower.

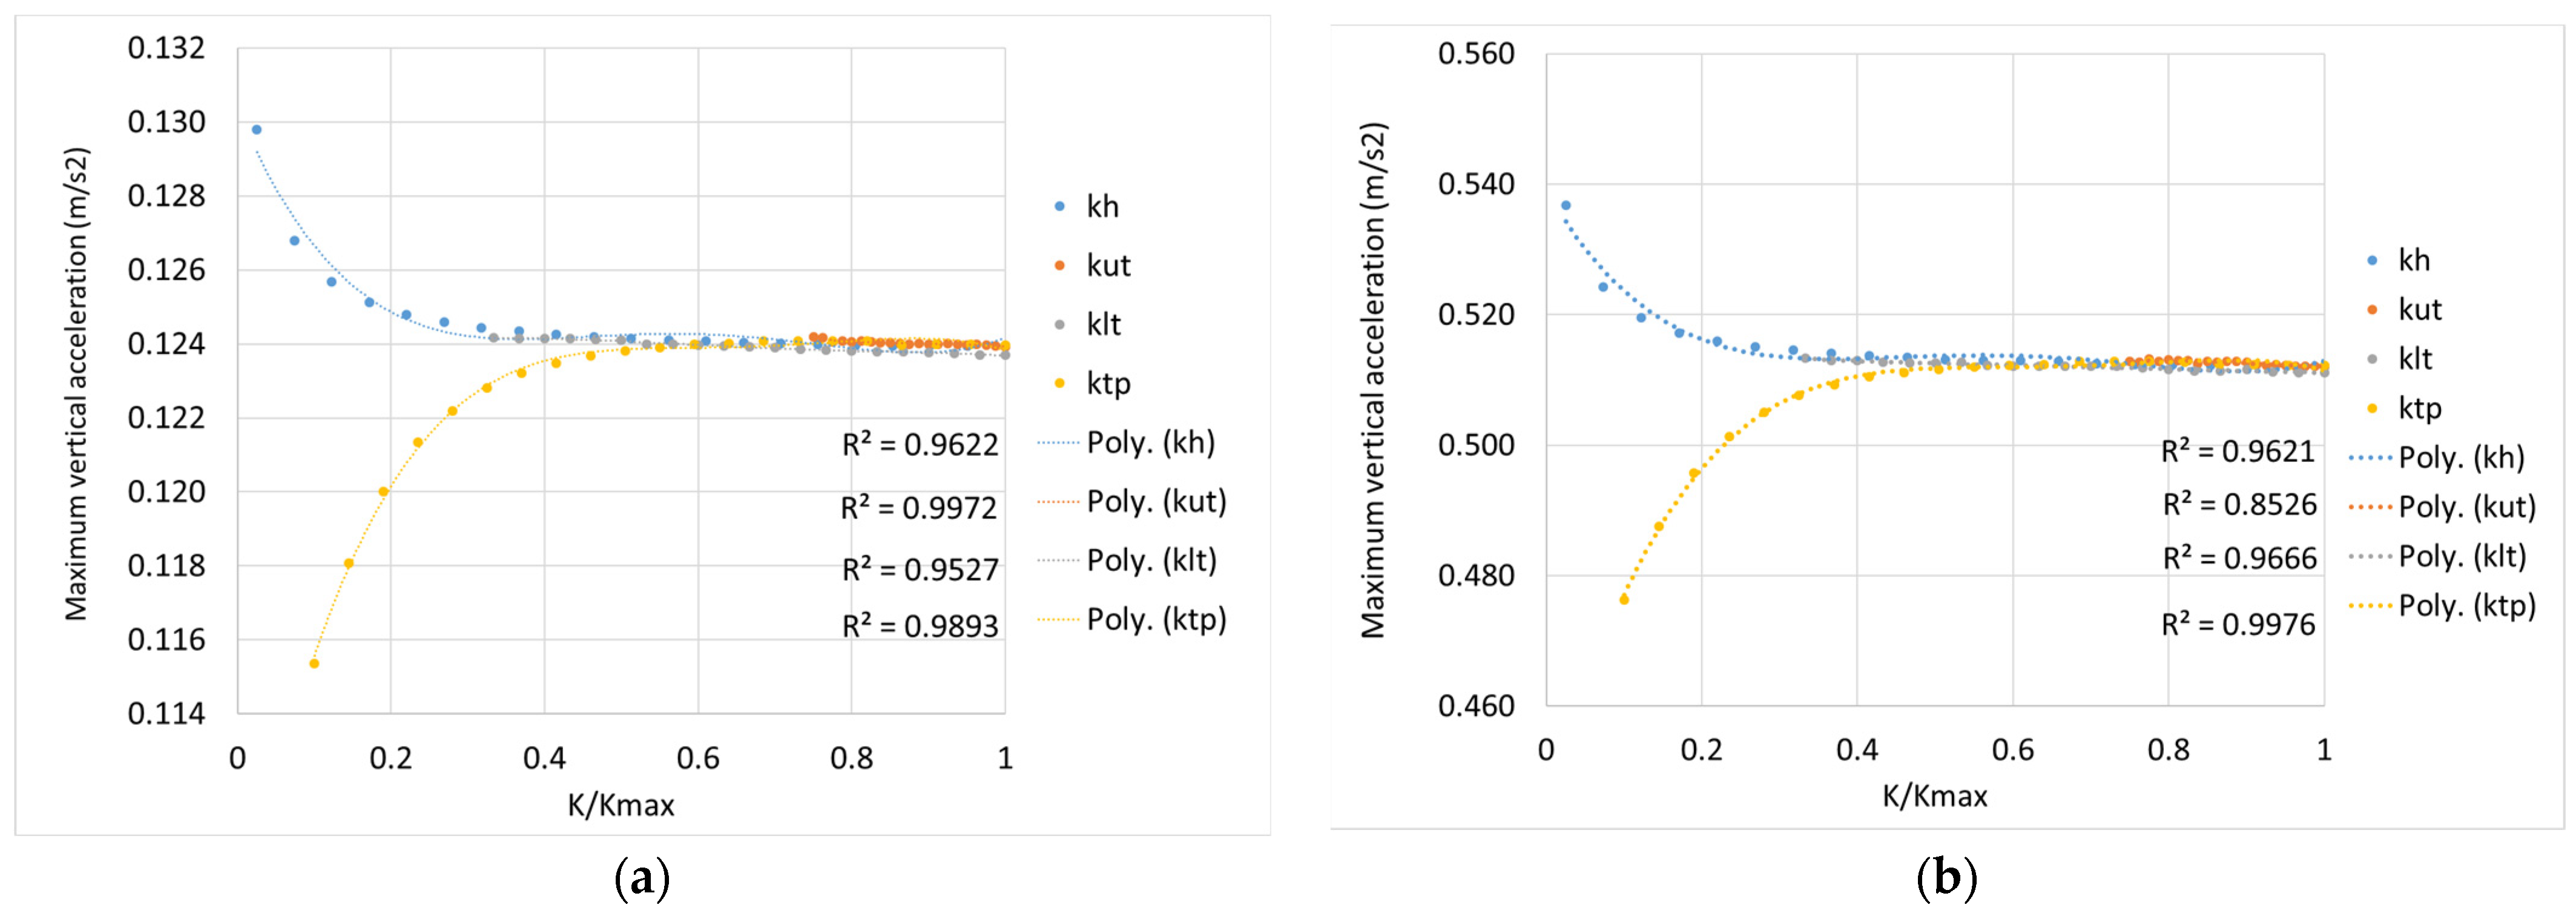
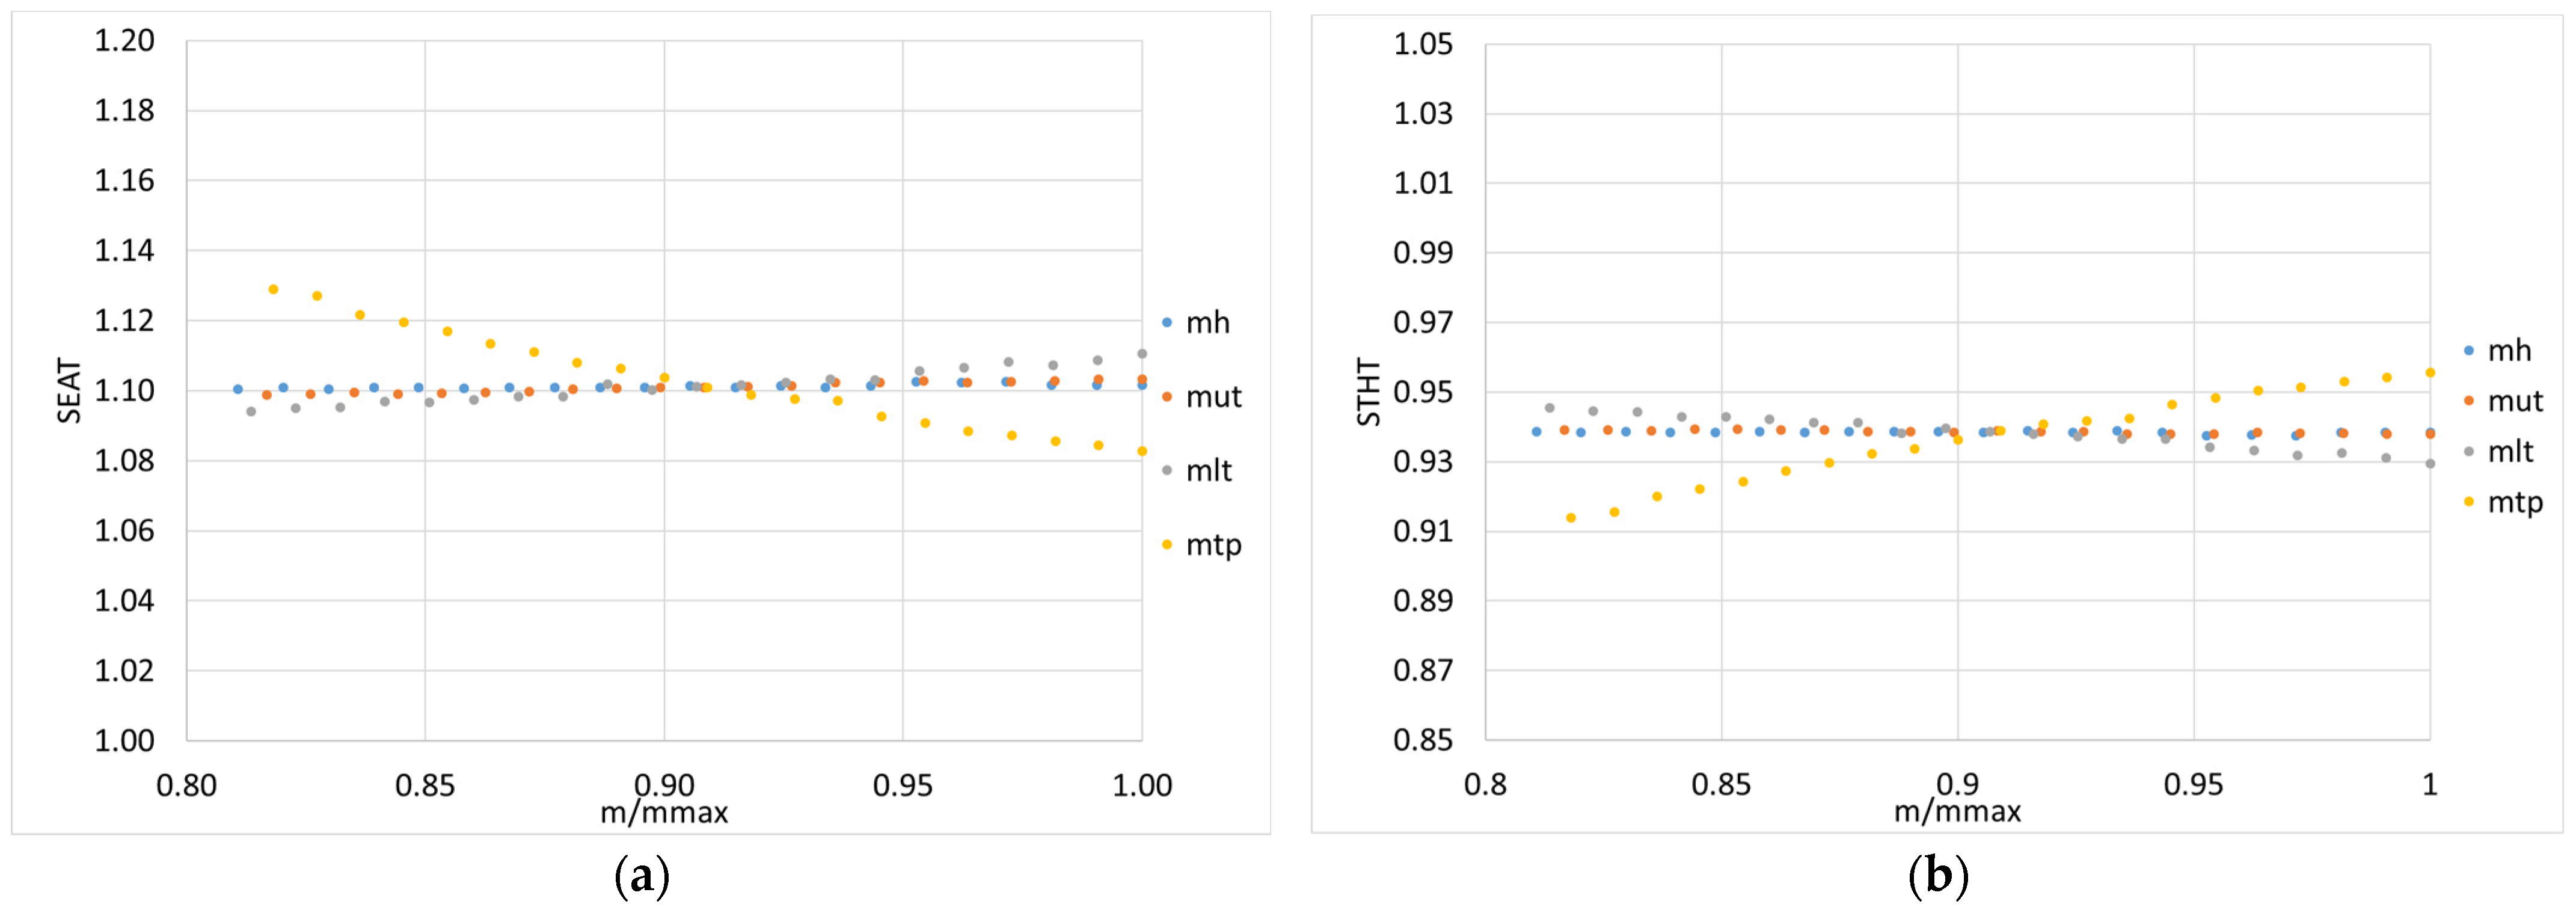
3.2. Sensitivity Analysis of the Mass, Stiffness and Damping Parameter Values of the Driver’s Model

In order to evaluate the effect of the value of each lumped parameter of the driver’s model on the estimation of ride comfort, a sensitivity analysis is performed. The objective of this sensitivity analysis is to identify the influence of the human body type to the ride comfort evaluation. The boundary values of the mass and the stiffness coefficients of the different body parts are presented in Table 5 along with their increment. The values of all the damping coefficients were altered within the interval of [400, 5000] Ns/m with an increment of 220 Ns/m. All parameter values are set within the limits referenced in the literature [17]. In each run of the sensitivity analysis, the values of all parameters were kept constant and equal to those in Section 2.1 except for one parameter, which alters its values sequentially, 21 times, within the aforementioned boundaries.
In Figure 4, the change in the maximum value of the vertical acceleration of the driver’s head versus the change in mass parameters is presented for the single-disturbance excitations. The 21 different values of maximum driver’s head acceleration are provided for each case along with a linear trendline.
The same procedure was repeated for the periodic excitation, and the correlation of the mass parameter value to the RMS value of the driver’s head vertical acceleration is presented in Figure 5.
In Figure 6, the maximum value of the vertical acceleration on the head of the driver versus the stiffness parameter value is presented for single-disturbance excitations. The 21 different values of maximum driver’s head acceleration are provided for each case along with a second-order polynomial trendline.
In Figure 7, the RMS value of the vertical acceleration of the head of the driver versus the stiffness parameter value is presented for the periodic excitation.
The same plots are also presented for the damping coefficients. In more detail, in Figure 8, the maximum value of the vertical acceleration of the driver’s head versus the value of the damping parameters is presented for single-disturbance excitations. For the graphs of the damping coefficients, no trendline was added.
The RMS value of the vertical acceleration of the head of the driver versus the value of the damping parameters for the periodic excitation is presented in Figure 9.
In Figure 10, the plots of the RMS of the driver’s head acceleration for all the parameters are presented for the Grade E road profile. The 21 different values of maximum acceleration of the driver’s head are provided for each case and parameter type (m, k, c) along with a moving average trendline with a period equal to 2.
In order to further investigate the effect of the values of the lumped parameters of the driver’s model on the dynamic response of the whole model and the prediction of ride comfort, SEAT and STHT are also explored for periodic excitation. In Figure 11, SEAT and STHT are presented for periodic excitation versus the mass parameters.
In Figure 12, the values of SEAT and SHTH are presented against the stiffness coefficients for the periodic excitation.
In Figure 13, the same values are presented for the periodic excitation versus the damping coefficients.

4. Discussion

In Figure 4, Figure 5, Figure 6, Figure 7, Figure 8 and Figure 9, it is obvious that each type of parameter (mass, stiffness and damping coefficient) influences the dynamic response of the seated human body model in a different way, even if slightly. Figure 4 and Figure 5 in particular show that the values of the mass parameters influence the value of the vertical acceleration of the driver’s head (maximum or RMS) in a linear way; thus, linear interpolation was selected for the trendline. In the single-disturbance and periodic excitations, the value of the vertical acceleration of the driver’s head decreases as the value of the body part mass increases.
In Figure 6 and Figure 7, the stiffness coefficients appear to influence the vertical acceleration of the driver’s head in a nonlinear way. Furthermore, k u t and k l t seem to influence the vertical acceleration of the driver’s head less than the values of k h and k t p . At the same time, an increase in the value of k h leads to a decrease in the value of the vertical acceleration of the driver’s head, while the opposite happens with an increase in the value of k t p . Finally, decreasing the value of the stiffness coefficient parameters less than 50% of their maximum value does not lead to a significant alteration in the dynamic response of the system.
On the other hand, a change in the values of the damping coefficients (Figure 8 and Figure 9) has a low effect on the value of the vertical acceleration of the driver’s head. In both the single-disturbance and periodic excitations, the c t p is the parameter that more greatly influences the dynamic response of the system. In the single-disturbance excitations, every damping coefficient but c h influences the maximum value of the vertical acceleration of the driver’s head in a linear way. In the case of the periodic excitation, the damping coefficient that influences the dynamic response of the system in a nonlinear way is c t p .
In Figure 10, the plots of the RMS value of the vertical acceleration of the driver’s head versus the lumped-parameter values for the Grade E road profile indicate that there is no obvious correlation between the value of the parameters and the dynamic response of the system. Apart from the low values of the vertical acceleration of the driver’s head, the inherent stochasticity of this excitation also makes it improper for such a sensitivity analysis.
In order to quantify the influence of each parameter in the evaluation of ride comfort the extrema values of acceleration of the driver’s head through sensitivity analysis are presented in Table 6 for all four excitations.
In Table 7, the range of the vertical acceleration values of the driver’s head evaluated for each parameter and excitation is presented.
In order to visualize the abovementioned Table 6 and Table 7, Figure 14 has been created for the single-disturbance excitations. In more detail, in Figure 14, the ratio of the range of acceleration presented in Table 7 over the median value of the vertical acceleration of the driver’s head as it is calculated for the interval presented in Table 6 is depicted for the single-disturbance excitations.
In Figure 14, it is obvious that the values of the parameters that affect the maximum vertical acceleration of the driver’s head more than 5% are m u t and k t p for the single-disturbance excitations.
In Figure 15, the same results are presented for the periodic excitation.
In Figure 15, the values of the parameters which affect the maximum vertical acceleration of the head the most are m u t , k h and c h , yet no parameter affects the value more than 5%.
As far as the transmissibility metrics of SEAT and STHT are concerned, it is shown in Figure 11 that these are mostly affected by the value of m t p . All mass parameters of the driver’s lumped-parameter model influence SEAT and STHT in a linear way. On the other hand, STHT value is not influenced by the stiffness parameters, and only k t p influences the SEAT value (Figure 10). Finally, the damping coefficient values influence both the SEAT and STHT values, while c h and c u t influence them in a linear way, and c l t and c t p influence them in a nonlinear way.

5. Conclusions

In the present paper, the effect of the values of the lumped parameters of a four-DOF seated driver’s model, being part of an eight-DOF lumped-parameter vehicle–seat–driver model, on the prediction of ride comfort was investigated. The main objective of this paper was to illustrate the effect of anthropometric accuracy when such a seated human model is used for the evaluation of ride comfort. The modeling was performed in the vertical direction since the displacement of the suspension components in the other directions (longitudinal and transverse) can be considered negligible in comparison to the vertical one.
In more detail, a sensitivity analysis for the values of the parameters of the human model was performed in four excitations with different characteristics. In total, the influence of 12 parameters was examined: 4 mass, 4 stiffness coefficient and 4 damping coefficient values. As metrics for the evaluation of ride comfort, the maximum and the RMS values of the vertical acceleration of the driver’s head, SEAT and STHT were used. For the single-disturbance and the periodic excitations, the correlation between the aforementioned values and the values of the lumped parameters of the driver’s model was clear. Furthermore, it was shown that the value of the mass parameter influences the dynamic response in a linear way, while the stiffness and the damping coefficient values influence the dynamic response in a nonlinear way. The three parameters that influence vertical acceleration of the driver’s head the most are the stiffness coefficients of the head ( k h ) and of the pelvis ( k t p ) and the mass of the upper torso ( m u t ). Although the values of the damping coefficients did not affect the vertical acceleration of the driver’s head, they did affect SEAT and STHT in the case of the periodic excitation. The values of SEAT and STHT were less affected by the change in the values of the mass and the stiffness coefficients. The performed sensitivity analysis revealed that a change in the values of the mass, the stiffness coefficient or the damping coefficient values of the driver’s lumped-parameter model can cause a change in the value of (a) vertical acceleration of the driver’s head up to 7%, (b) SEAT up to 6% and (c) STHT up to 9%. Keeping in mind that such lumped-parameter models are mainly used in the preliminary analysis and optimization of a suspension system, one can conclude that anthropometric accuracy, which is hard to obtain, is not a prerequisite for the use of such a model, and typical values for its parameters can be used.

Author Contributions

Conceptualization, D.K. and C.V.; methodology, D.K. and C.V.; software, C.V.; validation, D.K. and C.V.; formal analysis, D.K. and C.V.; investigation, D.K. and C.V.; data curation, D.K. and C.V.; writing—original draft preparation, C.V.; writing—review and editing, D.K.; visualization, C.V.; supervision, D.K. All authors have read and agreed to the published version of the manuscript.

Funding

This research received no external funding.

Conflicts of Interest

The authors declare no conflict of interest.

References

  1. Gosavi, P.; Pandit, M.; Gabhale, A.; Gajbhiye, N.; Patil, R.K. Determination of transmissibility responses of human seated body exposed to vibration. Int. Res. J. Eng. Technol. 2021, 8, 3098–3112. [Google Scholar]
  2. Popp, K.; Schiehlen, W. Ground Vehicle Dynamics; Springer Science & Business Media: Berlin/Heidelberg, Germany, 2010. [Google Scholar]
  3. ISO 2631-1:1997; Mechanical Vibration and Shock-Evaluation of Human Exposure to Whole-Body Vibration—Part 1: General Requirements. ISO: Geneva, Switzerland, 1997; pp. 42–44.
  4. ISO 2631-1:2010; Mechanical Vibration and Shock: Evaluation of Human Exposure to Whole Body Vibration, Part 1: General Requirements. ISO: Geneva, Switzerland, 2010.
  5. Heidarian, A.; Wang, X. Review on seat suspension system technology development. Appl. Sci. 2019, 9, 2834. [Google Scholar] [CrossRef]
  6. Kim, E.; Fard, M.; Kato, K. A seated human model for predicting the coupled human-seat transmissibility exposed to fore-aft wholebody vibration. Appl. Ergon. 2020, 84, 102929. [Google Scholar] [CrossRef] [PubMed]
  7. Anand, A.; Sudheesh Kumar, C.P. A review of whole-body vibration of seated occupants in moving vehicles. In Proceedings of the International Conference on Systems, Energy & Environment (ICSEE), Singapore, 3–5 February 2021. [Google Scholar]
  8. Al-Ashmori, M.; Wang, X. A systematic literature review of various control techniques for active seat suspension systems. Appl. Sci. 2020, 10, 1148. [Google Scholar] [CrossRef]
  9. Chen, X.; Song, H.; Zhao, S.; Xu, L. Ride comfort investigation of semi-active seat suspension integrated with quarter car model. Mech. Ind. 2022, 23, 18. [Google Scholar] [CrossRef]
  10. Zhao, Y.; Bi, F.; Shu, H.; Guo, L.; Wang, X. Prediction of the driver’s head acceleration and vibration isolation performance of the seating suspension system using the time and frequency domain modeling. Appl. Acoust. 2021, 183, 108308. [Google Scholar] [CrossRef]
  11. Du, H.; Li, W.; Zhang, N. Integrated seat and suspension control for a quarter car with driver model. IEEE Trans. Veh. Technol. 2012, 61, 3893–3908. [Google Scholar]
  12. Nagarkar, M.P.; Patil, G.J.V.; Patil, R.N.Z. Optimization of nonlinear quarter car suspension-seat-driver model. J. Adv. Res. 2016, 7, 991–1007. [Google Scholar] [CrossRef]
  13. Jain, S.; Saboo, S.; Pruncu, C.I.; Unune, D.R. Performance investigation of integrated model of quarter car semi-active seat suspension with human model. Appl. Sci. 2020, 10, 3185. [Google Scholar] [CrossRef]
  14. Boileau, P.; Wu, X.; Rakheja, S. Definition of a range of idealized values to characterize seated body biodynamic response under vertical vibration. J. Sound Vib. 1998, 215, 841–862. [Google Scholar] [CrossRef]
  15. Bai, X.X.; Xu, S.X.; Cheng, W.; Qian, L.J. On 4-degree-of-freedom biodynamic models of seated occupants: Lumped-parameter modeling. J. Sound Vib. 2017, 402, 122–141. [Google Scholar] [CrossRef]
  16. Koulocheris, D.; Vossou, C. A Comparative Study of Integrated Vehicle–Seat–Human Models for the Evaluation of Ride Comfort. Vehicles 2023, 5, 156–176. [Google Scholar] [CrossRef]
  17. Boileau, P.É.; Rakheja, S. Whole-body vertical biodynamic response characteristics of the seated vehicle driver: Measurement and model development. Int. J. Ind. Ergon. 1998, 22, 449–472. [Google Scholar] [CrossRef]
  18. Gillespie, T. Fundamentals of Vehicle Dynamics; SAE International: Warrendale, PA, USA, 2021. [Google Scholar]
  19. Paliwal, V.; Dobriyal, R.; Kumar, P. Dynamic analysis of a quarter car model moving over a gaussian bump. J. Graph. Era Univ. 2020, 2020, 78–86. [Google Scholar]
  20. Paliwal, V.; Dobriyal, R.; Kumar, P.; Manral, A.R. Effect of Varying Road Profile Amplitude on the Behavior of a Nonlinear Quarter Car Model. In IOP Conference Series: Materials Science and Engineering; IOP Publishing: Bristol, UK, 2021; Volume 1149, p. 012015. [Google Scholar]
  21. Barethiye, V.; Pohit, G.; Mitra, A. Analysis of a quarter car suspension system based on nonlinear shock absorber damping models. Int. J. Automot. Mech. Eng. 2017, 14, 4401–4418. [Google Scholar] [CrossRef]
  22. Mitra, A.C.; Desai, G.J.; Patwardhan, S.R.; Shirke, P.H.; Kurne, W.M.; Banerjee, N. Optimization of passive vehicle suspension system by genetic algorithm. Procedia Eng. 2016, 144, 158–1166. [Google Scholar] [CrossRef]
  23. Verros, G.; Natsiavas, S.; Papadimitriou, C. Design optimization of quarter-car models with passive and semi-active suspensions under random road excitation. J. Vib. Control 2005, 11, 581–606. [Google Scholar] [CrossRef]
  24. T.C. ISO/TC. M. Vibration, S.S.S. Measurement, E. of Mechanical Vibration, S. as Applied to Machines, Mechanical Vibration–Road Surface Profiles–Reporting of Measured Data; International Organization for Standardization: Geneva, Switzerland, 1995; Volume 8608. [Google Scholar]
  25. Gündogdu, Ö. Optimal seat and suspension design for a quarter car with driver model using genetic algorithms. Int. J. Ind. Ergon. 2007, 37, 327–332. [Google Scholar] [CrossRef]
  26. Abbas, W.; Abouelatta, O.B.; El-Azab, M.; Megahed, A. Application of genetic algorithms to the optimal design of vehicle’s driver seat suspension model. In Proceedings of the World Congress on Engineering, London, UK, 30 June–2 July 2010; Volume 2. [Google Scholar]
  27. Abbas, W.; Emam, A.; Badran, S.; Shebl, M.; Abouelatta, O. Optimal seat and suspension design for a half-car with driver model using genetic algorithm. Intell. Control. Autom. 2013, 4, 199–205. [Google Scholar] [CrossRef]
  28. Behari, N.; Noga, M. Vibration transmissibility behaviour of simple biodynamic models used in vehicle seat design. Czas. Tech. 2016, 15, 3–12. [Google Scholar]
  29. Ghasemi-Goneyrania, S.; Malekib, A. Evaluation of optimized lumped-parameter models of seated human body ex-posed to vertical vibration. In Proceedings of the 10th International Conference on Acoustics & Vibration (ISAV2020), Tehran, Iran, 17–18 February 2021. [Google Scholar]
  30. Zhang, S.; Shi, W.; Chen, Z. Modeling and parameter identification of seated human body with the reference vector guided evolutionary algorithm. Adv. Mech. Eng. 2021, 13, 16878140211062679. [Google Scholar] [CrossRef]
  31. Adam, S.A.; Jalil, N.A.A. Vertical suspension seat transmissibility and seat values for seated person exposed to whole-body vibration in agricultural tractor preliminary study. Procedia Eng. 2017, 170, 435–442. [Google Scholar] [CrossRef]
Figure 1. Eight-DOF vehicle–seat–driver lumped-parameter model.
Vehicles 05 00056 g001
Figure 2. Single-disturbance excitations: (a) speed bump and (b) pothole.
Vehicles 05 00056 g002
Figure 3. Periodic disturbance.
Vehicles 05 00056 g003
Figure 4. Maximum value of driver’s head acceleration versus the value of mass for the (a) speed bump and (b) pothole excitation.
Vehicles 05 00056 g004
Figure 5. RMS value of driver’s head acceleration versus the value of mass for the periodic excitation.
Vehicles 05 00056 g005
Figure 6. Maximum value of driver’s head acceleration versus the value of the stiffness coefficient for the (a) speed bump and (b) pothole excitation.
Vehicles 05 00056 g006
Figure 7. RMS value of driver’s head acceleration versus the value of the stiffness coefficient for the periodic excitation.
Vehicles 05 00056 g007
Figure 8. Maximum value of driver’s head acceleration versus the value of the damping coefficient for the (a) speed bump and (b) pothole excitation.
Vehicles 05 00056 g008
Figure 9. RMS value of driver’s head acceleration versus the value of the damping coefficient for the periodic excitation.
Vehicles 05 00056 g009
Figure 10. RMS value of the driver’s head acceleration versus the value of (a) mass, (b) stiffness and (c) damping coefficients for the Grade E road profile.
Vehicles 05 00056 g010
Figure 11. (a) SEAT and (b) STHT values versus the mass of the driver’s body parts for the periodic excitation.
Vehicles 05 00056 g011
Figure 12. (a) SEAT and (b) STHT values versus the stiffness coefficient values of the driver’s body parts for the periodic excitation.
Vehicles 05 00056 g012
Figure 13. (a) SEAT and (b) STHT values versus the damping coefficient values of the driver’s body parts for the periodic excitation.
Vehicles 05 00056 g013
Figure 14. Change in maximum acceleration of the driver’s head over the values of the lumped parameters for the (a) speed bump and the (b) pothole excitation.
Vehicles 05 00056 g014
Figure 15. Change in RMS acceleration of the driver’s head over the values of the lumped parameters for the periodic excitation.
Vehicles 05 00056 g015
Table 1. Values of the stiffness and damping elements for the human body model [17].
ParameterUnitValue
k h N/m310,000
k u t N/m183,000
k l t N/m162,800
k t p N/m90,000
c h Ns/m400
c u t Ns/m4750
c l t Ns/m4585
c t p Ns/m2064
Table 2. ISO Classification of road roughness.
Degree   of   Roughness   in   10 6 m 3 Φ Ω 0   Where   Ω 0   =   1 r a d m
Road ClassLower LimitGeometric MeanUpper Limit
A (very good)-1632
B3264128
C128256512
D51210242048
E (very poor)204840968192
Table 3. Maximum and RMS values of the vertical acceleration of the head for all excitations.
ExcitationMaximum Value (m/s2)RMS Value (m/s2)
Speed Bump0.1238-
Pothole0.5123-
Periodic-0.6805
Grade E-0.0005
Table 4. SEAT and STHT for all excitations.
ExcitationSEATSTHT
Speed Bump1.101.05
Pothole1.101.05
Periodic1.110.93
Grade E0.760.48
Table 5. Minimum and maximum values for the mass and the stiffness elements of the driver’s model.
ParameterUnitMinimum ValueMaximum ValueIncrement
m h kg6.07.40.070
m u t kg26.332.20.295
m l t kg9.611.80.110
m t p kg14.417.60.160
k h N/m10,000400,00019,500
k u t N/m150,000200,0002500
k l t N/m100,000300,00010,000
k t p N/m10,000100,0004500
Table 6. Minimum and maximum vertical acceleration value for each parameter and excitation in the sensitivity analysis.
ExcitationSpeed BumpPotholePeriodicGrade E
Maximum Vertical
Acceleration (m/s2)
Maximum Vertical
Acceleration (m/s2)
RMS Vertical
Acceleration (m/s2)
RMS Vertical Acceleration (m/s2)
ParameterMinimumMaximumMinimumMaximumMinimumMaximumMinimumMaximum
m h 0.1230.1250.5090.5160.6790.6830.0010.008
m u t 0.1210.1270.4990.5270.6730.6890.0010.009
m l t 0.1230.1250.5070.5180.6780.6840.0020.007
m t p 0.1220.1260.5050.5200.6770.6860.0020.006
k h 0.1240.1270.5120.5370.6810.6940.0010.008
k u t 0.1240.1240.5120.5130.6810.6820.0020.008
k l t 0.1240.1240.5110.5130.6800.6830.0020.007
k t p 0.1150.1240.4760.5130.6630.6860.0020.009
c h 0.1240.1260.5120.5170.6810.6970.0020.007
c u t 0.1240.1250.5130.5150.6810.6820.0010.008
c l t 0.1240.1250.5130.5150.6810.6820.0020.008
c t p 0.1230.1250.5090.5170.6790.6820.0020.007
Table 7. Range of vertical acceleration values for each parameter and excitation in the sensitivity analysis.
ExcitationMaximum Vertical Acceleration (m/s2)RMS Vertical Acceleration (m/s2)
Speed BumpPotholePeriodicGrade E
Parameter
m h 0.0020.0060.0040.006
m u t 0.0070.0280.0160.007
m l t 0.0020.0110.0060.005
m t p 0.0030.0150.0090.005
k h 0.0030.0250.0130.006
k u t 0.0000.0010.0010.007
k l t 0.0000.0020.0030.005
k t p 0.0090.0370.0230.007
c h 0.0020.0050.0160.005
c u t 0.0010.0020.0010.007
c l t 0.0010.0030.0010.007
c t p 0.0020.0080.0030.005
Disclaimer/Publisher’s Note: The statements, opinions and data contained in all publications are solely those of the individual author(s) and contributor(s) and not of MDPI and/or the editor(s). MDPI and/or the editor(s) disclaim responsibility for any injury to people or property resulting from any ideas, methods, instructions or products referred to in the content.

