Article

Voltage Signals Measured Directly at the Battery and via On-Board Diagnostics: A Comparison

by
Gereon Kortenbruck
,
Lukas Jakubczyk
* and
Daniel Frank Nowak
Technische Hochschule Georg Agricola (THGA), PROLAB Produkt+Produktion, Herner Straße 45, 44787 Bochum, Germany
*
Author to whom correspondence should be addressed.
Vehicles 2023, 5(2), 637-655; https://doi.org/10.3390/vehicles5020035
Submission received: 28 February 2023 / Revised: 14 April 2023 / Accepted: 20 April 2023 / Published: 30 May 2023
(This article belongs to the Special Issue Feature Papers in Vehicles)

Abstract

:
Nowadays, cars are an essential part of daily life, and failures, especially of the engine, need to be avoided. Here, we used the determination of the battery voltage as a reference measurement to determine possible malfunctions. Thereby, we compared the use of a digital oscilloscope with the direct measurement of the battery voltage via the electronic control unit. The two devices were evaluated based on criteria such as price, sampling rate, parallel measurements, simplicity, and technical understanding required. Results showed that the oscilloscope (Picoscope 3204D MSO) is more suitable for complex measurements due to its higher sampling rate, accuracy, and versatility. The on-board diagnostics (VCDS HEX-V2) is more accessible to non-professionals, but it is limited in its capabilities. We found that the use of an oscilloscope, specifically the Picoscope, is preferable to measure battery voltage during the engine start-up process, as it provides more accurate and reliable results. However, further investigation is required to analyse numerous influences on the cranking process and the final decision for the appropriate measurement device is case specific.

1. Introduction

Cars are an indispensable part of modern society. A failure of the engine can cause significant problems for consumers. To ensure reliable operation of the vehicles, an early and precise diagnosis is essential. When choosing the right diagnostic device, it is of crucial importance that it is appropriate for the specific application. A frequent tool in workshops is the error diagnosis via on-board diagnostics (OBD II). Alternatively, oscilloscopes are used as diagnostic tools. A representative study by A.M. Heyes in “Automotive Component Failures” examined the primary causes of failures in internal combustion engines. The results showed that 41% of all failures were due to the engine itself (Figure 1) [1]. A quick and qualitative diagnosis of the cause of the error is highly relevant for modern workshops.
Diagnosing malfunctions using an oscilloscope requires a high level of technical expertise of the workshop personnel. Unfortunately, this procedure often does not achieve application in workshops, particularly for new employees, due to the manual comparison of the signal waveforms by the worker. This method aims to identify deviations between the planned and actual waveform. Identification of these deviations is typically done through a visual inspection. On-board diagnosis is often the first method for assessing the actual malfunctions of a vehicle today. However, this method is often faulty and it does not always provide a reliable diagnosis.
The battery voltage of a car can indicate possible engine failures as the course of the voltage during the starting process displays the engine’s compression [2]. The measurement of the battery voltage is simple and it can be performed without disassembly or any special measuring clamps or connectors. Thus, we focused on the accuracy of measuring battery voltage during cranking with an oscilloscope compared to the battery voltage measurement via the engine control units to compare both detection methods and identify their respective limitations and advantages.

1.1. Related Works

In his work “Automotive Battery State-of-Health Monitoring Methods”, Ryan J. Grube presents the development of reliable methods for monitoring the state of automotive batteries [3]. The author emphasizes the importance of effective monitoring of the state of automotive batteries to ensure a safe power supply in the vehicle. The study compares three methods including a method based on the battery starter voltage, a method using a parity relationship using battery voltage and starter signals, and a pattern recognition method using Support Vector Machines. The performance of these methods is evaluated and compared by analysing data from 20 batteries of two different vehicles. One of the results of this work is that the approach of analysing the battery starter voltage as well as the parity relationship can give advanced warnings about impending starting difficulties of the car due to low battery life [3].
In “Framework for Building Low-Cost OBD-II Data-Logging Systems for Battery Electric Vehicles,” Ramai et al. developed a framework for analysing battery technical state of health based on OBD II data. Within this work, the battery state of charge, temperature, cell voltages, and cumulative energy consumption were considered. A cost-effective solution for real-time monitoring data was developed. Using a Raspberry Pi Zero W to communicate with the vehicle and OBD-II connectors, the system costs less than 100€. In the process, the health status of the battery could be determined [4].
A literature review has shown that some studies have focused on the impact of the measurement equipment on the voltage waveform such as distortion, noise, and frequency response. Other studies have investigated the effect of different load conditions, such as varying temperature, engine speed, and battery capacity. However, few studies have directly compared the accuracy of oscilloscope measurement with engine control unit measurement, which is a common method used by automotive manufacturers and repair shops [1,2,4,5,6,7,8].

1.2. Review of Vehicle Control Units, CAN, OBD II, Oscilloscope

1.2.1. Vehicle Control Units

Each system in a vehicle is controlled by an electronic control unit (ECU) specialized for the respective system. One control unit is responsible for the central locking system, one for the engine, and another for the automatic climate control, etc. This quickly adds up to 50 to 150 control units per vehicle. Standard parameters are stored in each control unit within the framework of which the systems are supposed to work [9]. If deviations occur, an error code is generated and the control unit attempts to restore the control state. During vehicle diagnosis, these error codes are read out and analysed. The entire internal communication takes place via a data highway, which is the so-called CAN bus.

1.2.2. Controller Area Network (CAN)

The CAN data bus is mainly used for data transmission between the control units in the car. The CAN transmits the data with the help of two data lines. The operating principle is the multi-master principle. A distinction is made between CAN data bus Class A, B, and C.
Table 1 shows a comparison of the data volume rates that are transmitted via the different CAN data bus types. The data bus types shown correspond to those in the car.
While CAN Class A and B can only transmit data rates of up to 10 and 125 kBit/s, respectively, CAN Class C has the highest possible data rate of up to 1 Mbit/s. This CAN type is used in the automotive sector for engine and transmission diagnostics. Furthermore, it is real-time capable and is therefore also used for safety-relevant control systems such as ESP, ASR, and ABS [10].
The engine control units communicate via the CAN bus using data protocols. Each data protocol consists of the following components.
Each CAN frame begins with the start field, which is 1 bit long, and describes the beginning of a CAN message. This is followed by the status field. This status field shows the data type and the priority of the CAN message. The priority is set when two vehicle control units want to access the CAN BUS at the same time. The control unit with the higher priority level is preferred. The third frame describes the RTR field. This indicates whether data are sent or requested. The 4th field is the control field. This field describes how many data are transmitted within this CAN message. In this way, it can be checked at the end whether all the data were received. The 5th field is the data field. The data field contains all the data to be transmitted. The 6th field, the backup field, is used to detect transmission errors. In the 7th field, the correct receipt of the message is confirmed by the recipient. The 8th and 9th fields are used to end the CAN message. The end of the message is described in field 8. Field 9 initiates the idle state on the CAN bus and waits for the next CAN message [11].

1.2.3. OBD II—Standard

Until the 1980s, nearly every vehicle manufacturer in America had its own standard for communication between external devices and its vehicles. In Europe, these differences even existed until 2001, meaning that every independent workshop also had to keep many devices, connection cables, and software on hand to be able to connect with vehicles from different manufacturers. The exact definition of the newly developed and currently valid OBD standard is laid down in Europe in SAE J2012 or ISO standard-15031-6 and now allows the use of a universal connector for OBD analysis [12].

1.2.4. The Starting Process of a Vehicle Engine

Figure 2 shows the starting voltage curve of an internal combustion engine measured at the battery.
T0 indicates the state of the battery in the idle state. The time range T1–T2 indicates the moment when the ignition key is turned. A small voltage drop can be measured at the battery, which is due to the preparation of the electrical system for the starting process. A starter motor is needed for the starting process (Figure 3). This motor is usually a high torque DC motor designed to operate at extreme overload and high efficiency. Mounted on the starter is a cylindrical plunger surrounded by a solenoid coil. In addition, this plunger is surrounded by a holding winding and a pick-up winding. As soon as the ignition key is turned, an electric current flows into the starter’s solenoid coil. This creates a strong magnetic field that pulls the plunger back and connects the starter pinion to the flywheel ring gear. From here, the rotary motion begins as the current flows from the pull-in winding to the ground via the exciter winding. At the same time, the relay switches through and thus releases the main current (terminal 30, compare Figure 3). This creates equipotential bonding at the holding winding. The starter motor can now rotate freely. After releasing the ignition key, the current of the holding winding is disconnected. The engagement lever now disengages the pinion from the flywheel ring gear. This again creates a potential difference, which stops the rotation of the starter motor.

1.2.5. Ohm’s Law Defines the Increase in Voltage over Time

The Ohm’s Law can be used to explain the following increase in voltage. Due to the increase in compression and the first rise of the graph in Figure 2 in the above-mentioned interval, a greater resistance must be counteracted. This results in an increased force required by the starter motor. In the first and second stroke, the intake and compression stroke, of the four-stroke engine shown, cylinders 1–4 are moved from bottom dead centre to top dead centre with increased force (cf. Figure 2). The required voltage of the starter motor remains high in this range. During the power stroke, the aspirated and compressed mixture is ignited. The starter engine has to then work against a lower resistance, which reduces the required voltage. From second 5.25 onwards, all four strokes of the engine have been run through for each cylinder. The starter motor can stop operating from this point and the engine fires. Successful starting of an internal combustion engine requires that the engine is started at a sufficient speed (e.g., 50–100 rpm for a cold start) to enable the combustion of the aspirated mixture and to give the flywheel sufficient momentum until the engine can run without assistance (T3–T4). From T4 onwards, the alternator is added as a further component of the engine to recover the used energy from the battery. The alternator is a generator which, driven by a belt, charges the battery while the engine is running without additional support [1].
U = R · I

2. Materials and Methods

2.1. Data Acquisition

2.1.1. Oscilloscopic Measurements

A digital Picoscope 3204D MSO (Pico Technology, St Neots, Cambridgeshire, United Kingdom) was used to record the battery voltage. In the process of data acquisition using an oscilloscope, the position of the vehicle battery was determined. Then, the oscilloscope was connected to the mains and switched on. This was followed by attaching the clamps with Y-BNC connectors to the oscilloscope to record the signals from the battery. The measuring software was started and all necessary settings (sampling rate 100 kS/s, time range 1 s) were made.
The negative terminal was then connected to the negative pole of the battery to make a secure connection. The measurement was started and the oscilloscope signals were transmitted in real time on the screen. The next step was to start the vehicle to record the signals while it was running. After 20 s, the engine was stopped to finish the measurement.

2.1.2. Measurements with an OBD II—Diagnostic Adapter

In addition to the Picoscope, an OBD II diagnostic adapter from the company VCDS (Auto-Intern GmbH, Bochum, Germany) was used to record the battery voltage data. This is somewhat more complicated than recording via the oscilloscope, as the VCDS requires more configuration effort. The first step was to locate the OBD II port in the vehicle. This is usually located in the driver’s seat area or under the dashboard. Once the interface was found, the VCDS diagnostic adapter could be prepared. The adapter was connected to the OBD II interface. It had to be checked that the adapter was switched on. The adapter was then configured to perform the measurement. This includes selecting the correct mode and setting of the necessary parameters. After the configuration of the adapter, the measurement was started. The next step was to start the vehicle. During the measurement, the vehicle was operated for about 20 s before it was stopped again, as was the measurement.
Both detection methods were used to measure the battery voltage during engine start-up of eight different cars from different manufactures, of different ages, and with different fuels. In addition, we determined the battery voltage of one car with a simulated error. Therefore, the ignition coil was removed to prevent ignition of one of the cylinders.

2.2. Data Preparation

An initial visual inspection of the signals showed that datasets received from both detection methods vary in length, means that the duration of the recorded signals varied and it was difficult to compare or analyse the data due to different reference times (Figure 4). Thus, it was also difficult to perform trend or pattern recognition. This problem can lead to inaccurate or inconsistent results and it can be problematic to draw valid conclusions from the data. To solve these problems, it may be necessary to synchronize the data before analysis. For synchronization, it was necessary to identify salient points of the different datasets. To do this, the existing data were shifted and displayed graphically. This has the advantage that a correct and complete recording of the measurement data is ensured. Furthermore, this step is useful for a later analysis and identification of the salient points. A salient point is a point in time or a range at which the data changes significantly. It is important to note that this point was found in the oscilloscope data as well as in the VCDS data.
If the measurement was carried out correctly, the largest voltage drop represents the most prominent point, which was recognizable across all measurements. Therefore, for better comparability, all datasets were superimposed at the most prominent point in the following.
The procedure for overlaying data at a prominent point involves several steps. The first step was to convert the CSV file into a data frame. This was done by a self-written Python script (script available at: https://gitlab.thga.de/PROLAB/paper_battery_voltage_analysis_ecuxosci, accessed on 2 February 2023). A data frame is a tabular representation of data organized in columns and rows. This makes it easier to analyse and manipulate the data. The next step was to find the minimum of the data. The minimum is the lowest value in a particular column or row. It was used to determine the split point. The split point is the point at which the data are split to be placed on top of each other. To calculate the split point, the point of the detected minimum was subtracted with the time range. The time range is the range in which the data were recorded. This indicates the exact time when the minimum occurred. After the split point was calculated, the transformed data frame was created. A transformed data frame is a modified version of the original data frame. In this case, the data were split at the calculated split point and superimposed. Finally, the transformed data frame was drawn. This allowed a visual comparison and analysis of the data. Figure 5 shows the transformed data.

2.3. Battery Charge Test

A car battery has to be sufficiently charged to provide the starter motor with enough voltage to start the engine. The state of charge of each battery was calculated based on the initial values of the battery voltage at the beginning of a measurement. Table 2 shows the prevailing battery terminal voltage depending on its state of charge [14].

2.4. Analytical Methods

The following methods were used to analyse the time ranges from the first compression of the engine to the final ignition, the time where the engine can run without any help of the alternator. Analysis of the data was done separately for the VCDS and Picoscope datasets to assess specific differences and similarities in relation to the respective measurement devices.

2.4.1. Mean

The mean, also known as the arithmetic mean, is one of the most common measures in statistical analysis. It indicates the average value of a given set of data and can be used to identify trends and patterns in the data. The mean of a set of data was calculated by adding up all the data points and division by the number of data points.
x = 1 n i = i n x i = x 1 + x 2 + + x n n

2.4.2. Dynamic Time Warping:

Dynamic Time Warping (DTW) is a statistical technique used to measure and compare the similarity of time series. It is commonly used in applications such as pattern recognition, classification, voice recognition, and comparison of medical data or time series-based processes. DTW refers to a weighted path through the time series feature spaces where each deviation is evaluated to calculate the total deviation between the time series. Here, the minimum deviation was calculated to determine the DTW distance, which is a numerical statement of the similarity or deviation between the time series. A lower DTW value indicates a greater similarity between the time series, while a higher value indicates a greater deviation.
Dynamic Time Warping is based on the Euclidean distance calculation:
d i s t x , y = x y = ( x 1 y 1 ) 2 + ( x 2 y 2 ) 2 + + ( x n y n ) 2
with x = [x1, x2, …, xn] and y = [y1, y2, …, yn].
However, if the length of x is different from y, we cannot use the above formula to calculate the distance. Instead, we need a more flexible method that can find the best mapping from elements in x to elements in y to calculate the distance. The aim of dynamic time warping is to find a minimal mapping path. This correlation can be plotted in a so-called heat map [15].
D i , j = t i r ( j ) + m i n D ( i + 1 , j ) D i + 1 , j + 1 D ( i , j + 1 )

3. Results

Table 3 compares the two electronic measuring devices, the digital Picoscope 3204D MSO and the VCDS HEX-V2, based on four different criteria: price, sampling rate, parallel measurements and ease of use. The first criterion, price, refers to the financial outlay required to purchase each device. The acquisition costs of the Picoscope 3204D MSO are nearly double the costs of the VCDS HEX-V2. The second criterion, sampling rate, refers to the speed at which a meter converts an analogue signal into a digital signal. The Picoscope 3204D MSO is able to achieve a higher sampling rate of up to 1 GS/s, while the VCDS HEX-V2 is limited in sampling rate by the CAN protocol. The third criterion, parallel measurements, refers to how many measurements can be performed simultaneously. The Picoscope 3204D MSO can take two measurements at the same time, while the VCDS HEX-V2 allows unlimited parallel measurements. The fourth criterion, usage, refers to the user-friendliness of a measuring device. While the use of the VCDS HEX-V2 is considered easy and intuitive, the use of the Picoscope 3204D MSO is more sophisticated. This also correlates with the fifth criterion, the background knowledge. While the Picoscope is technically more complex, the measurements are more accurate and versatile. However, knowledge and understanding of the technical interactions in a car are necessary to interpret the resulting data. The VCDS, on the other hand, may be more accessible to non-professionals and requires less technical understanding, but is limited in its capabilities.

3.1. Start-Up Voltage Analysis:

The start-up voltage of a battery can be used to determine the state of charge of the respective battery. This is the first estimation whether the battery energy supply is still sufficient to start the engine.
Table 4 shows the voltage and the state of charge of the battery at rest (engine not running) measured by either the Picoscope or the VCDS.
For the Picoscope measurements, the values vary between 11.86 V and 12.42 V. Thus, the resulting voltage conditions of these batteries ranged from 30–70% according to Table 2. One measurement (Sample 1) indicates a nearly discharged battery as a value of 12 V is assumed to be the threshold necessary to start the engine.
In comparison, most of the battery voltages determined via VCDS were below the critical value of 12 V, thus resulting in respective lower charge states of the batteries. In addition, for Sample 2, a battery voltage of 13.47 V was measured, which would correspond to a charge state of more than 100%.
Subsequently, the average difference between the Picoscope open-circuit voltage of the battery and the open-circuit voltage of the battery measured via the VCDS was determined (Table 4). According to Formula (2), the average difference between both methods is 0.203 V. This difference in the voltage measured results in partially significant differences of the state of charge. As starting the engine of all cars was possible throughout all measurements, we assume the values determined via the Picoscope to be more precise and significant.

3.2. Compression within the Cranking Process

As already mentioned before, the Ohmic behaviour of the engine during start-up is also displayed in the course of the battery voltage. This time range corresponds to the compression of the four cylinders of the engine and its resolution needs to be sufficient to identify possible anomalies. 
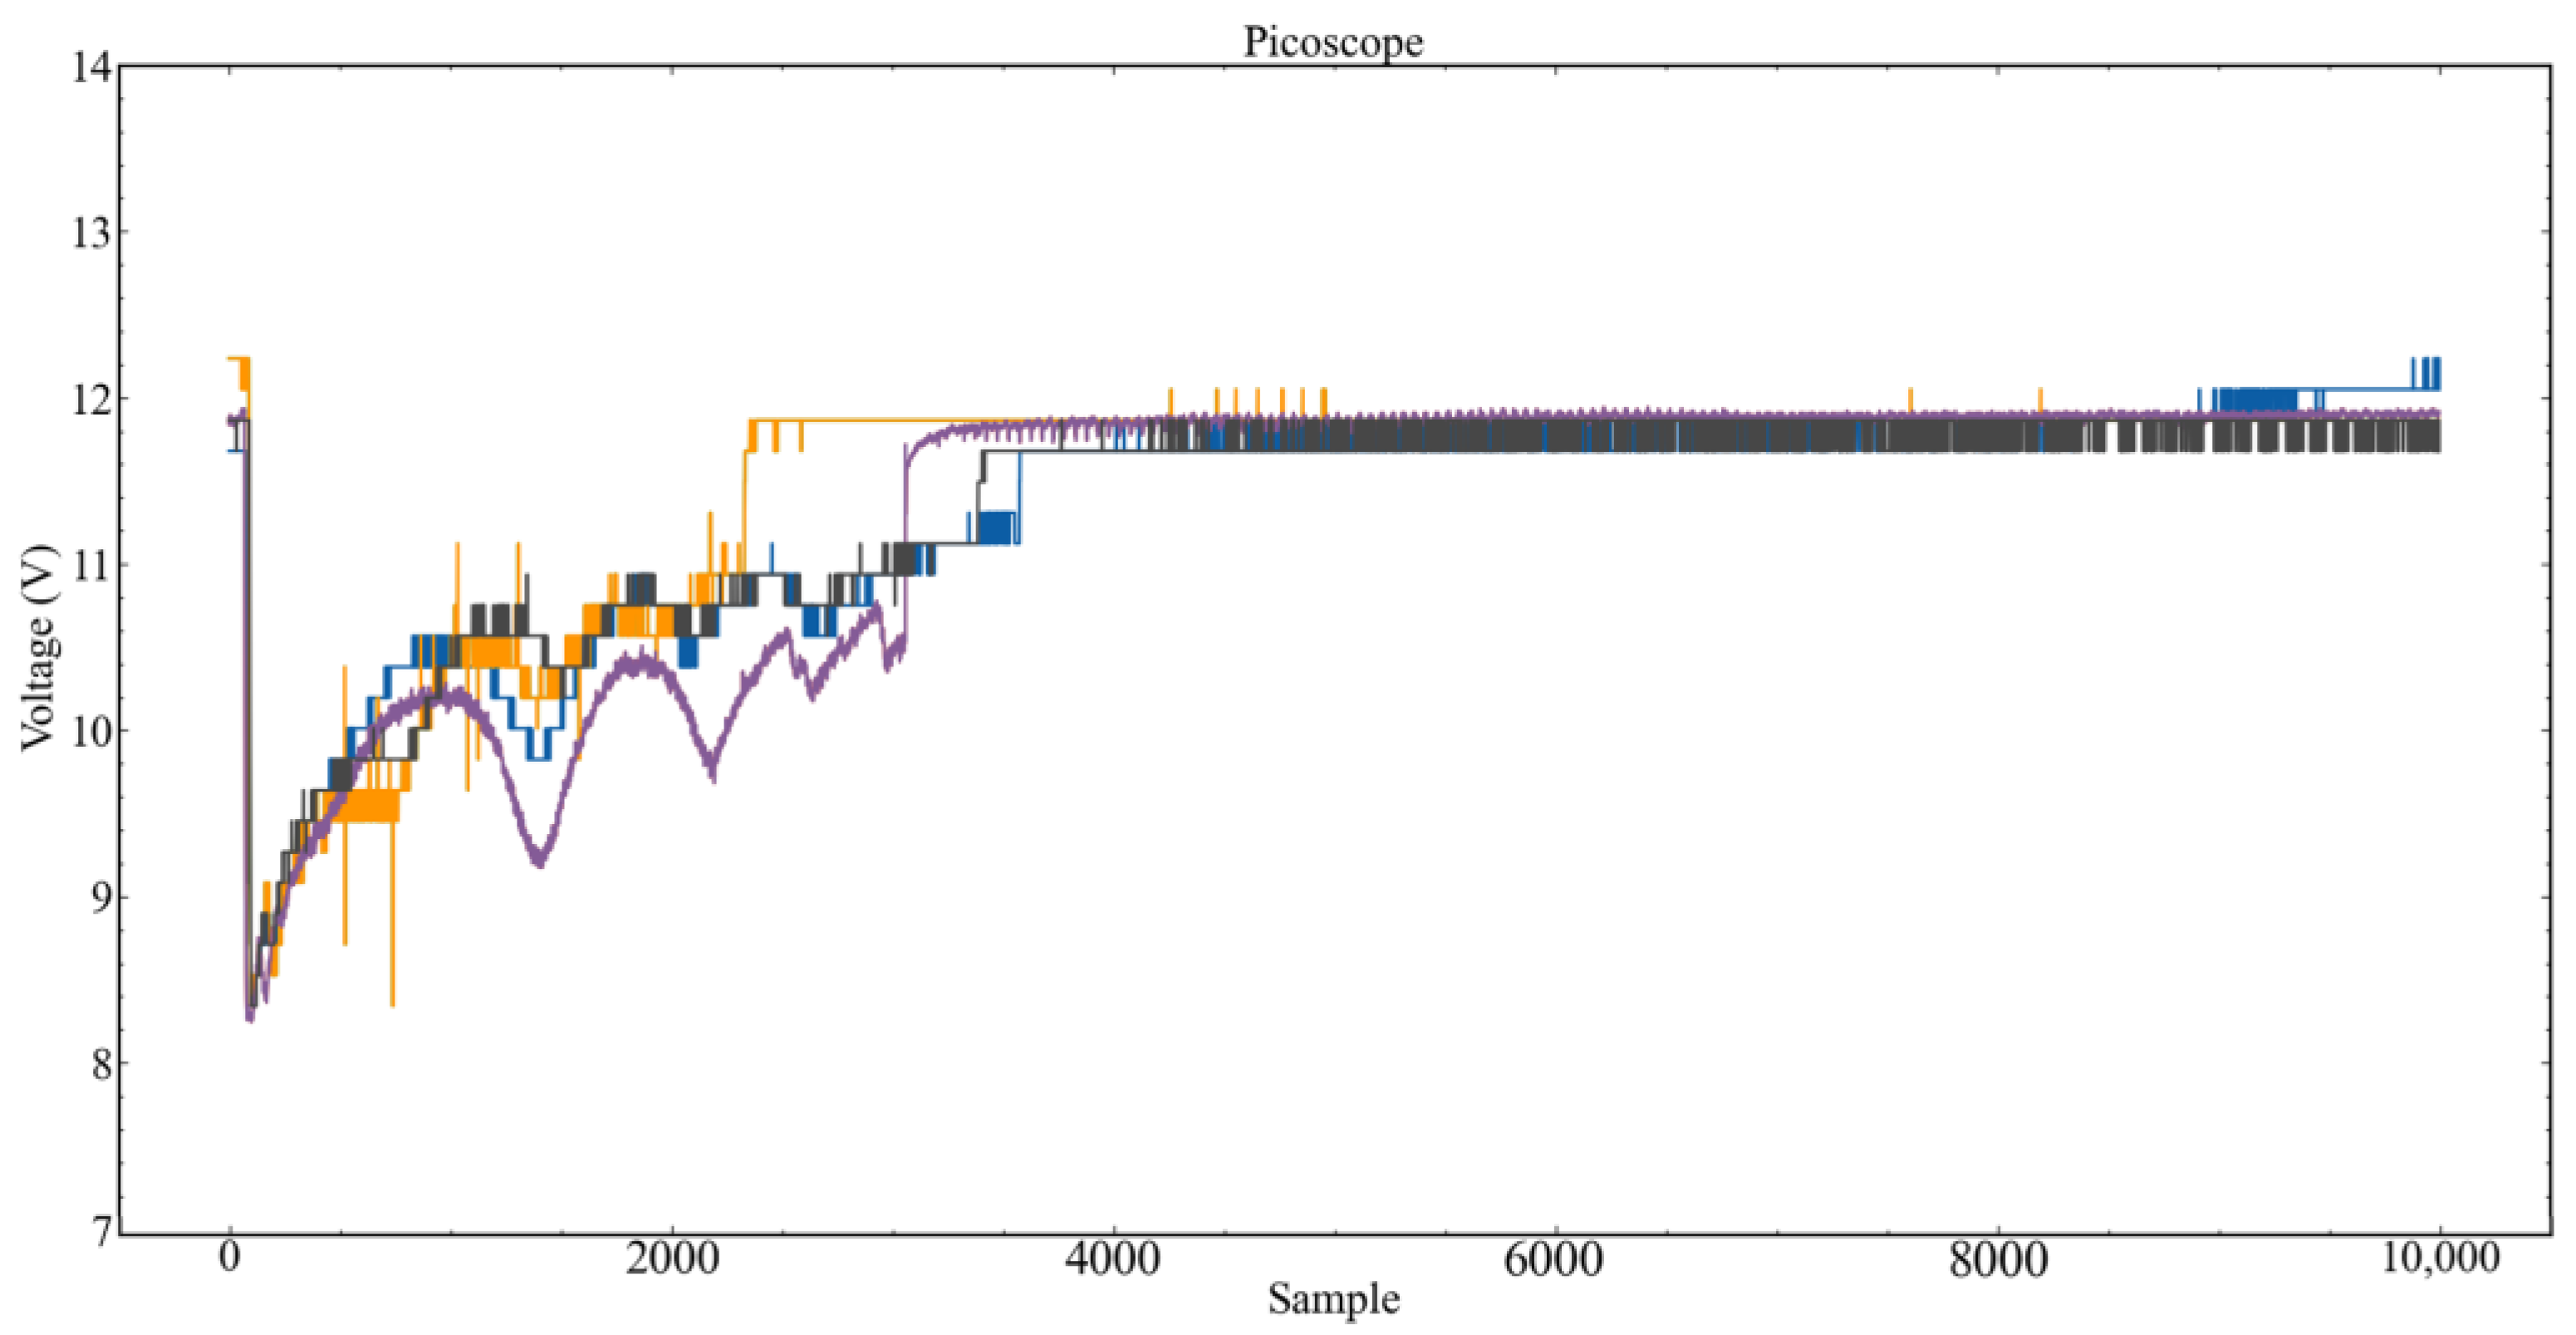
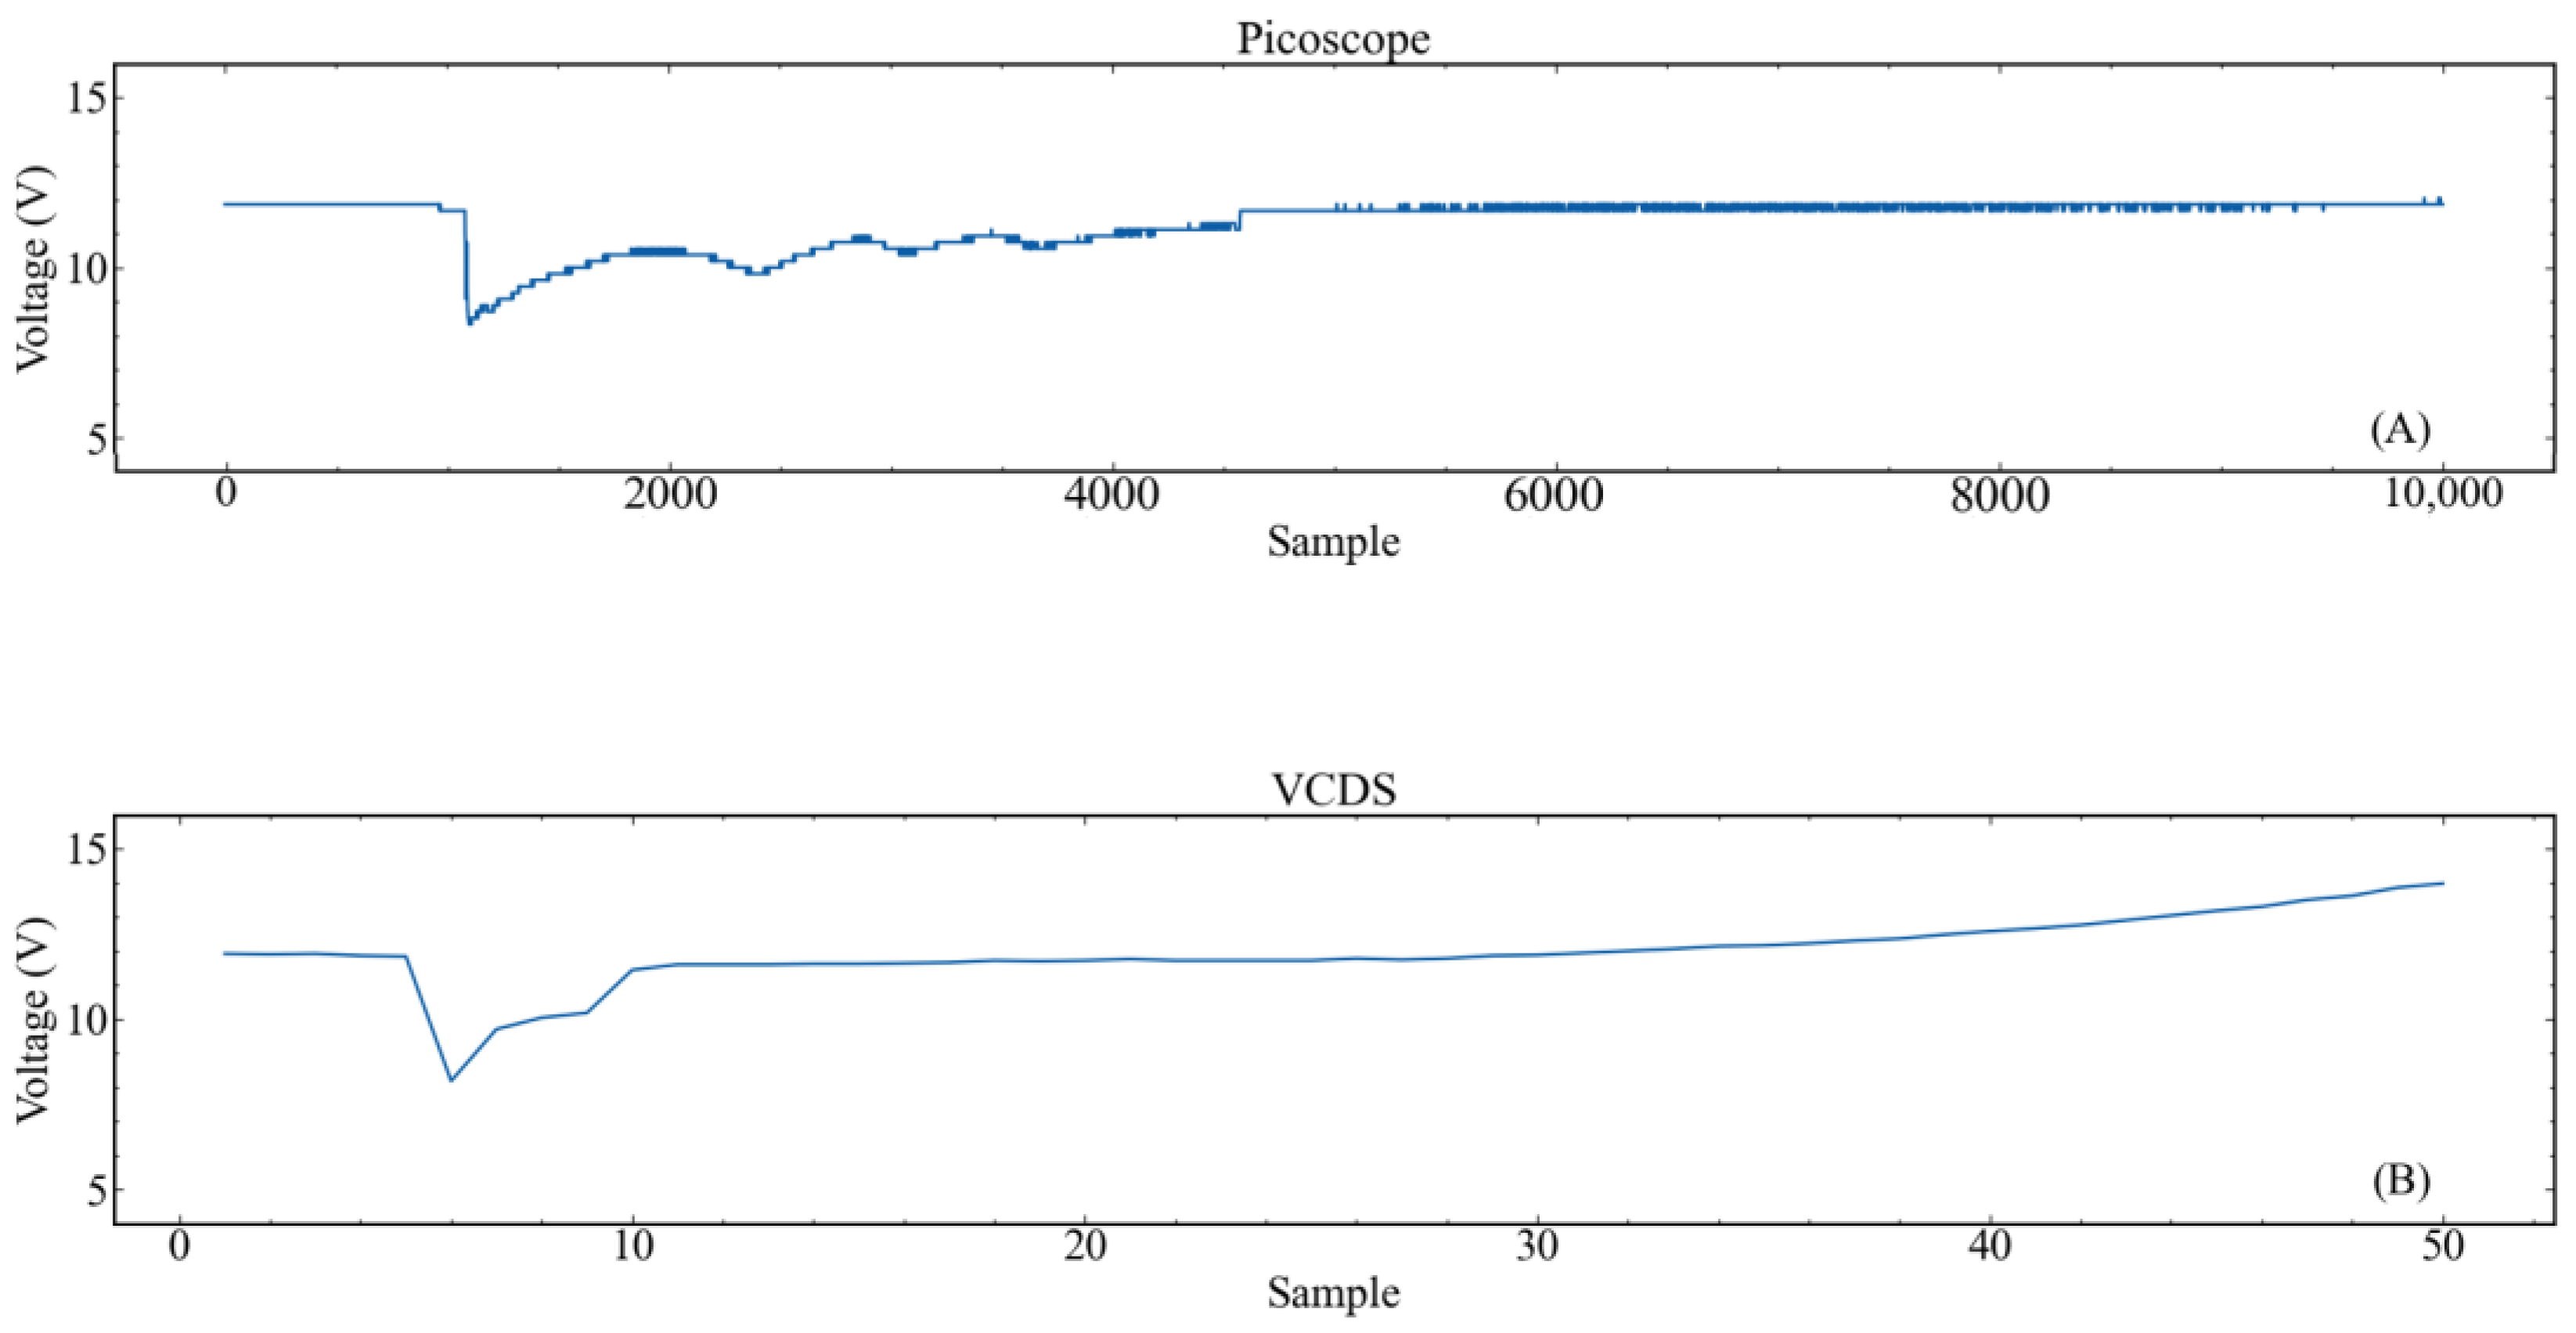
Figure 6 illustrates the comparison of the normalized data acquired by the oscilloscope and the data recorded via the OBD II interface. The signal received by the oscilloscope is characterized by a high noise intensity and a non-smooth voltage curve. Furthermore, a pronounced noise around the voltage curve can be observed. A special feature is the concise first voltage drop, as well as the recognizable compression phases of the following cylinders. Four voltage drops and the stepwise rise of the charge controller are visible. In contrast, the recording via the ECU shows a smoother voltage curve compared to the noisy signal captured by the oscilloscope. A particular feature is the clearly discernible first voltage drop, but only two further voltage drops can be guessed until the engine finally fires. Furthermore, the rise of the charge controller is exponential and smooth and there is no noise around the voltage curve.
In the following text, the time frame of the first compression to the final ignition of the engine is examined. A short period before starting the starter engine is considered for the compression of the first cylinder until the final ignition of the engine.
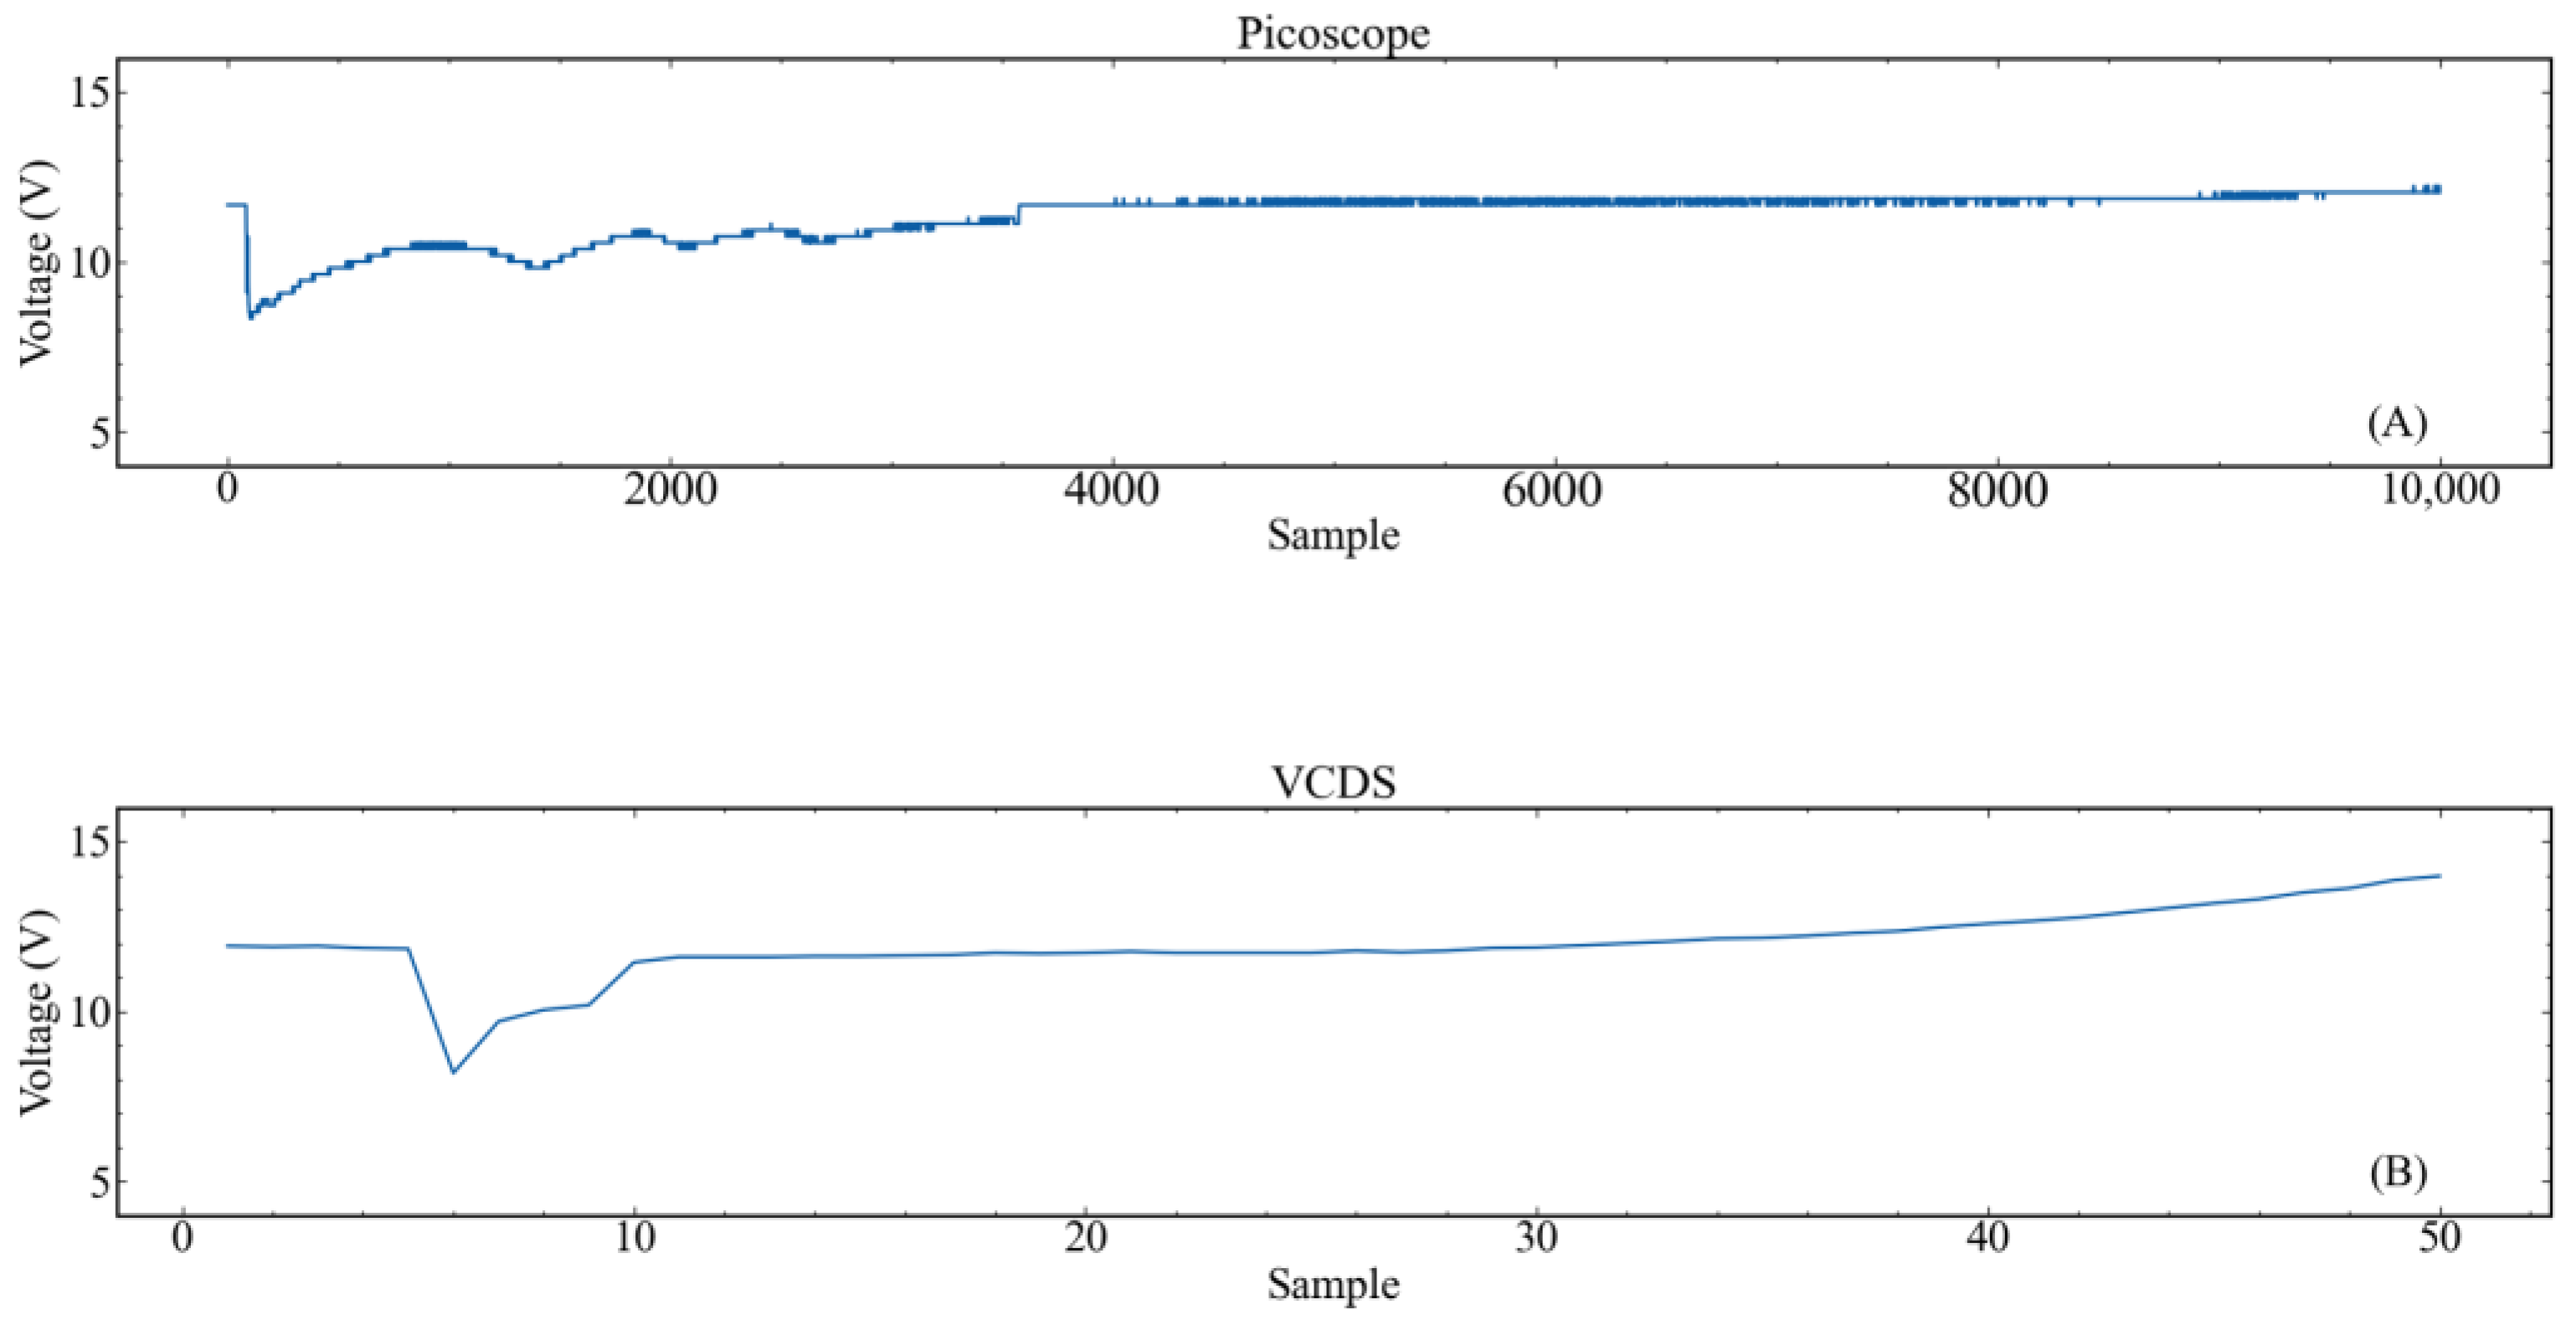
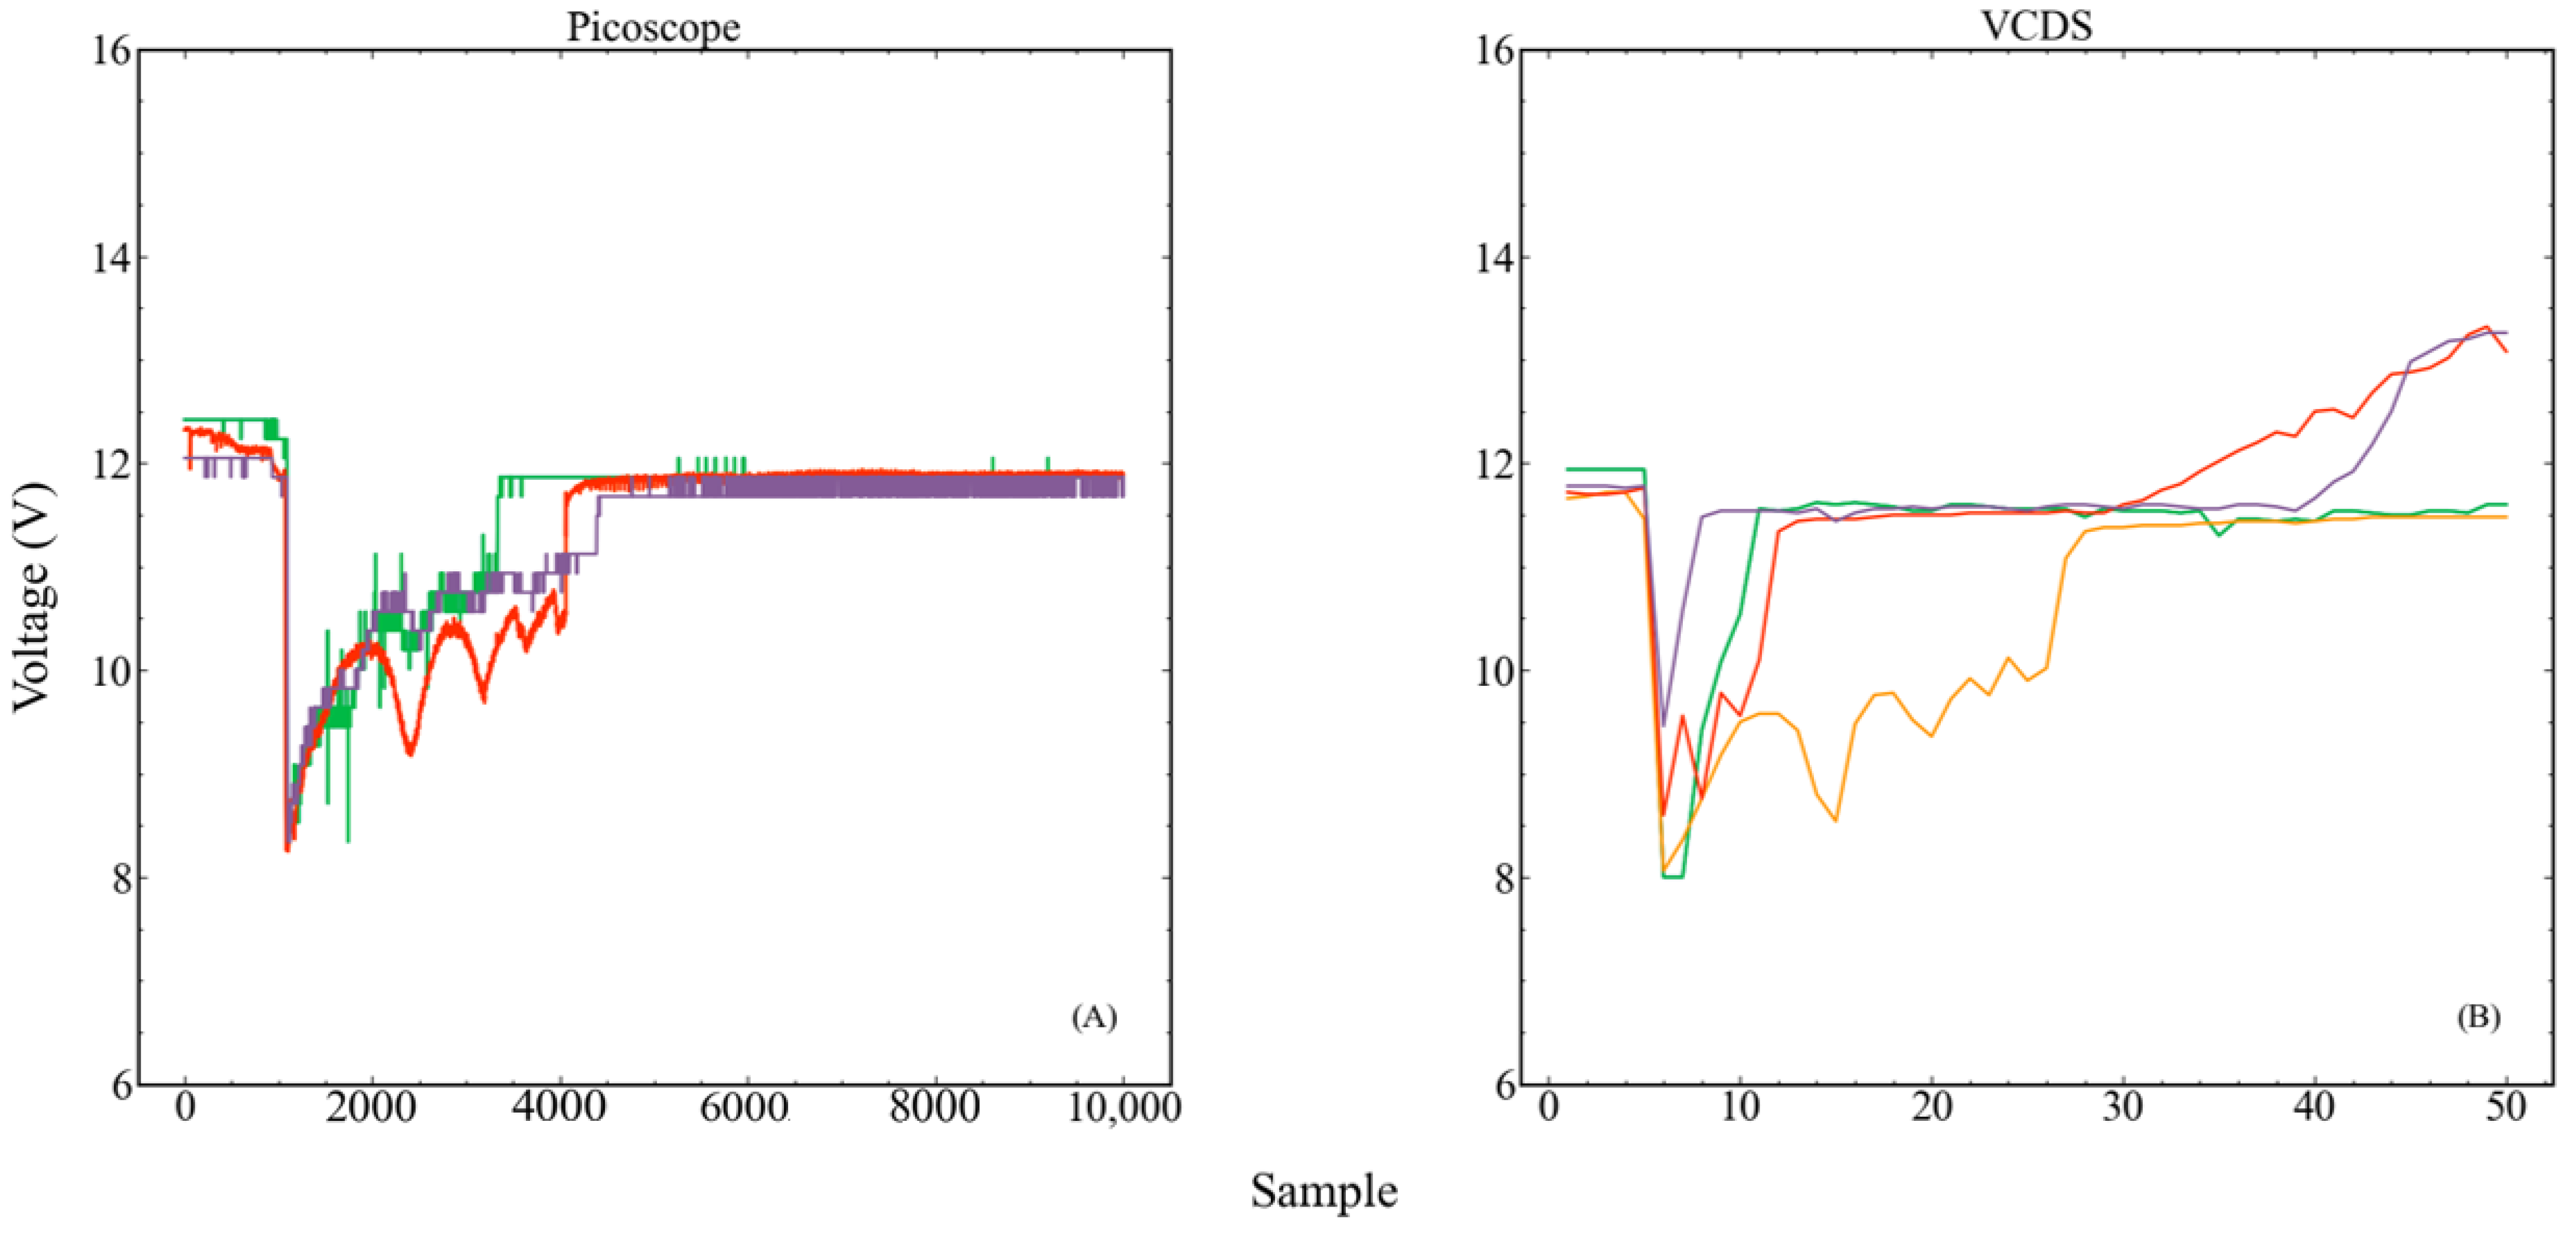
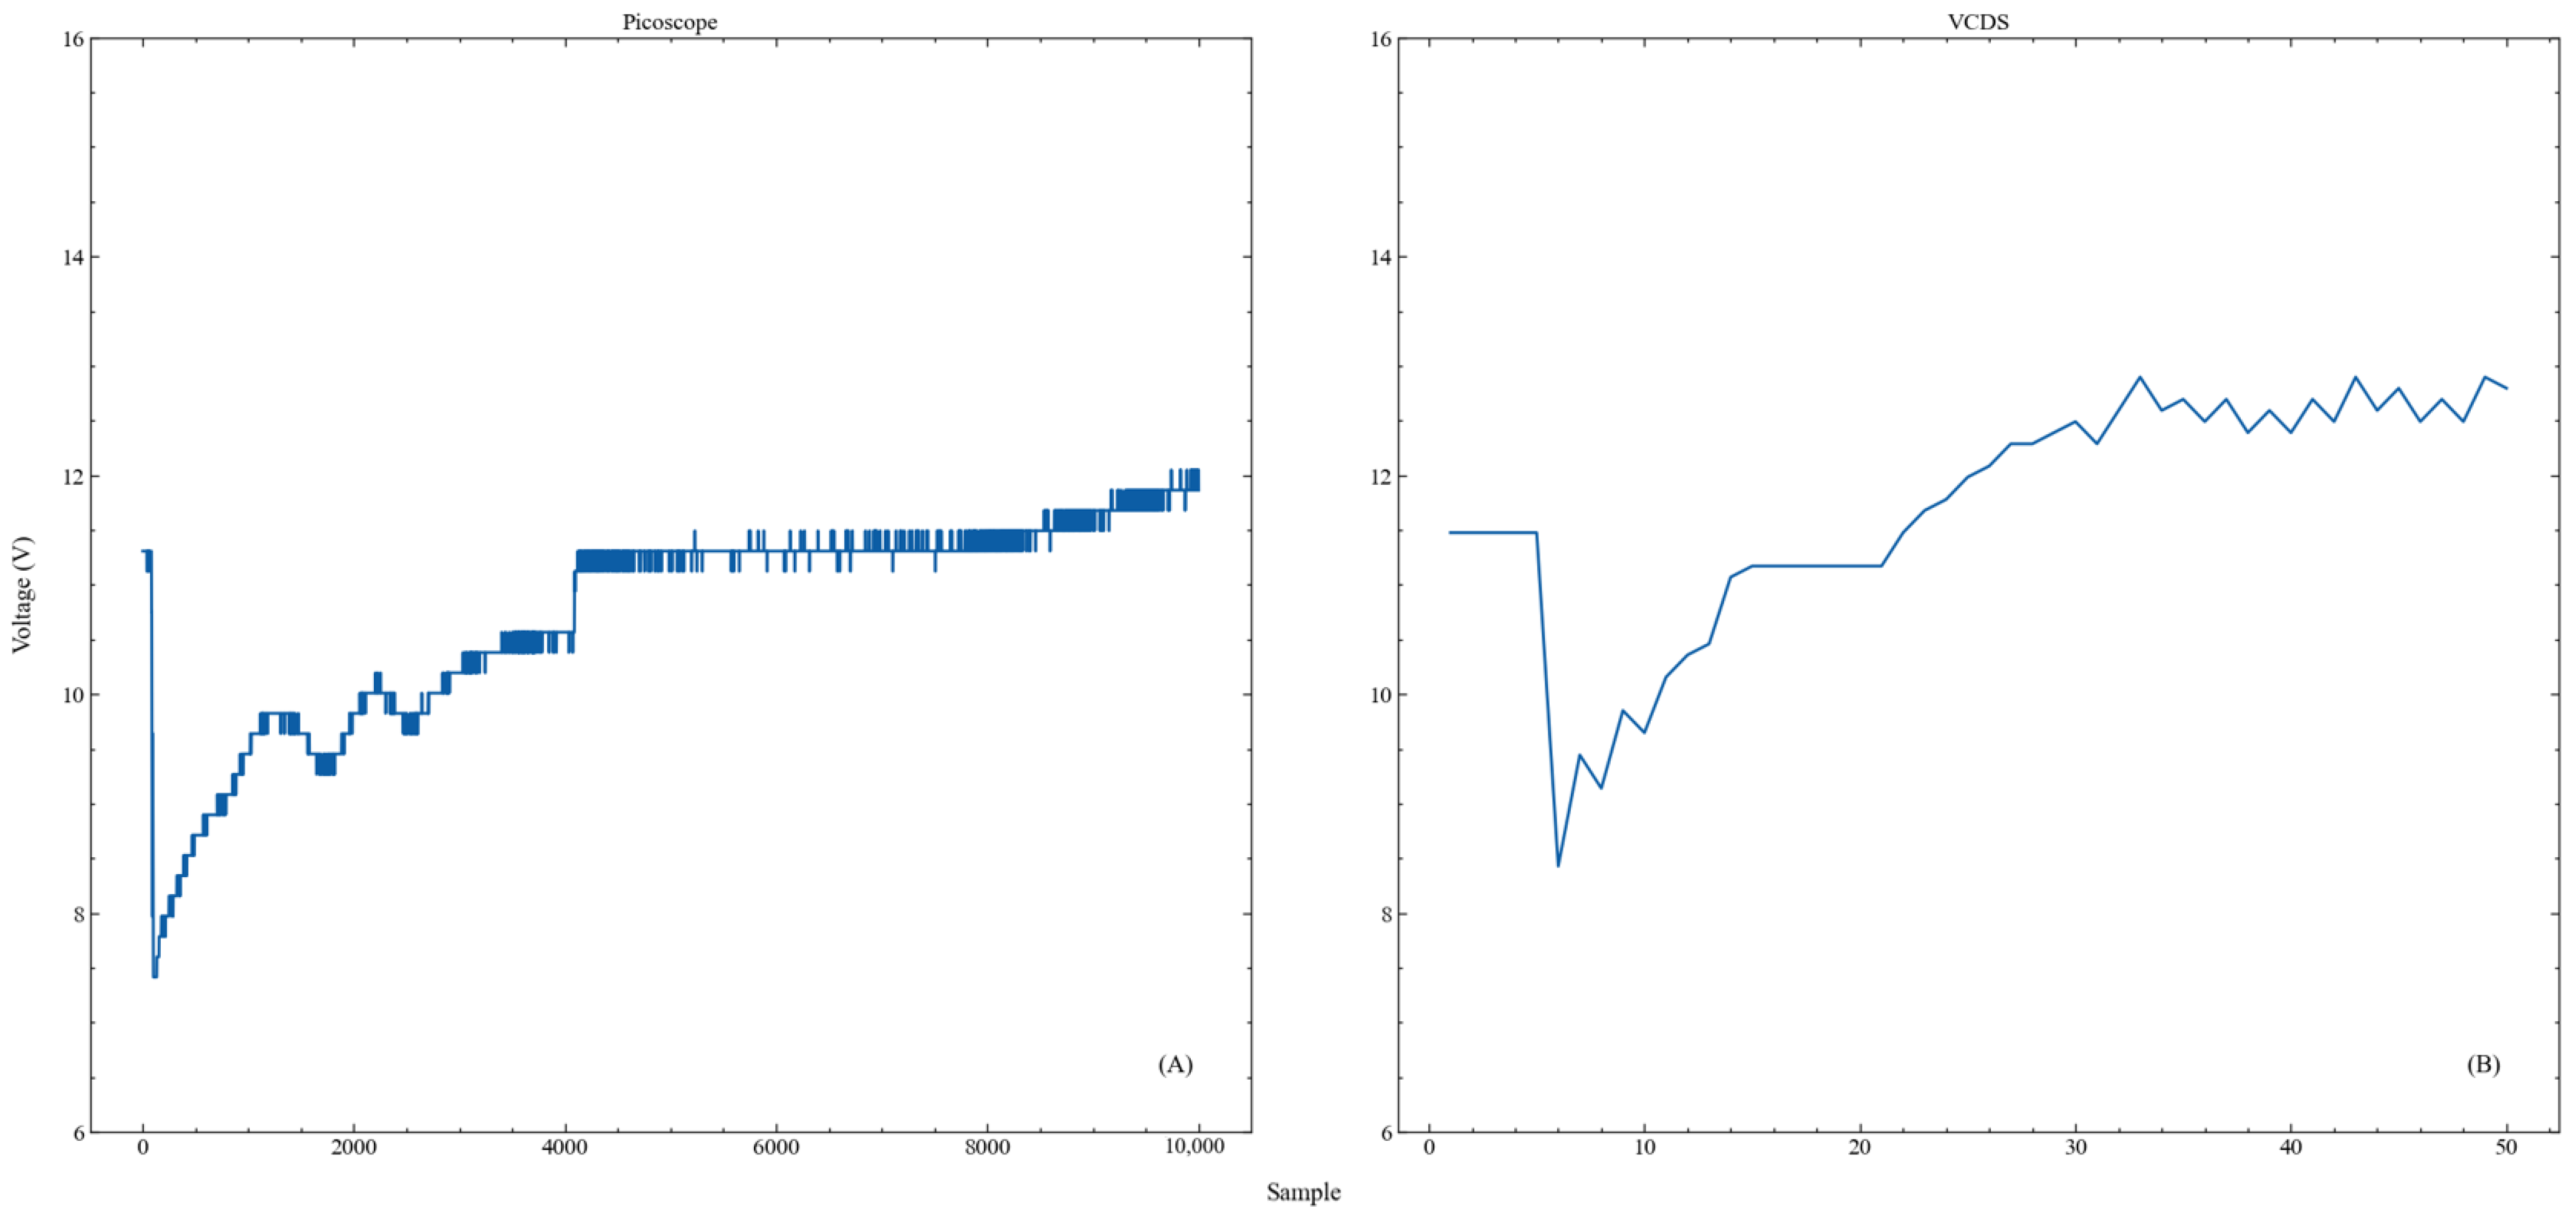
Figure 7A shows the time frame of the first compression recorded by the Picoscope compared to the same measurement recorded via the OBD II (Figure 7B) interface. In comparison, it is noticeable that the individual compressions of the cylinders within the OBD measurement are not as detailed as for the oscilloscope measurement. Nevertheless, the time of the greatest voltage drop is still recognizable. This trend can be observed in all measurements.

3.3. Charging Voltage Analysis

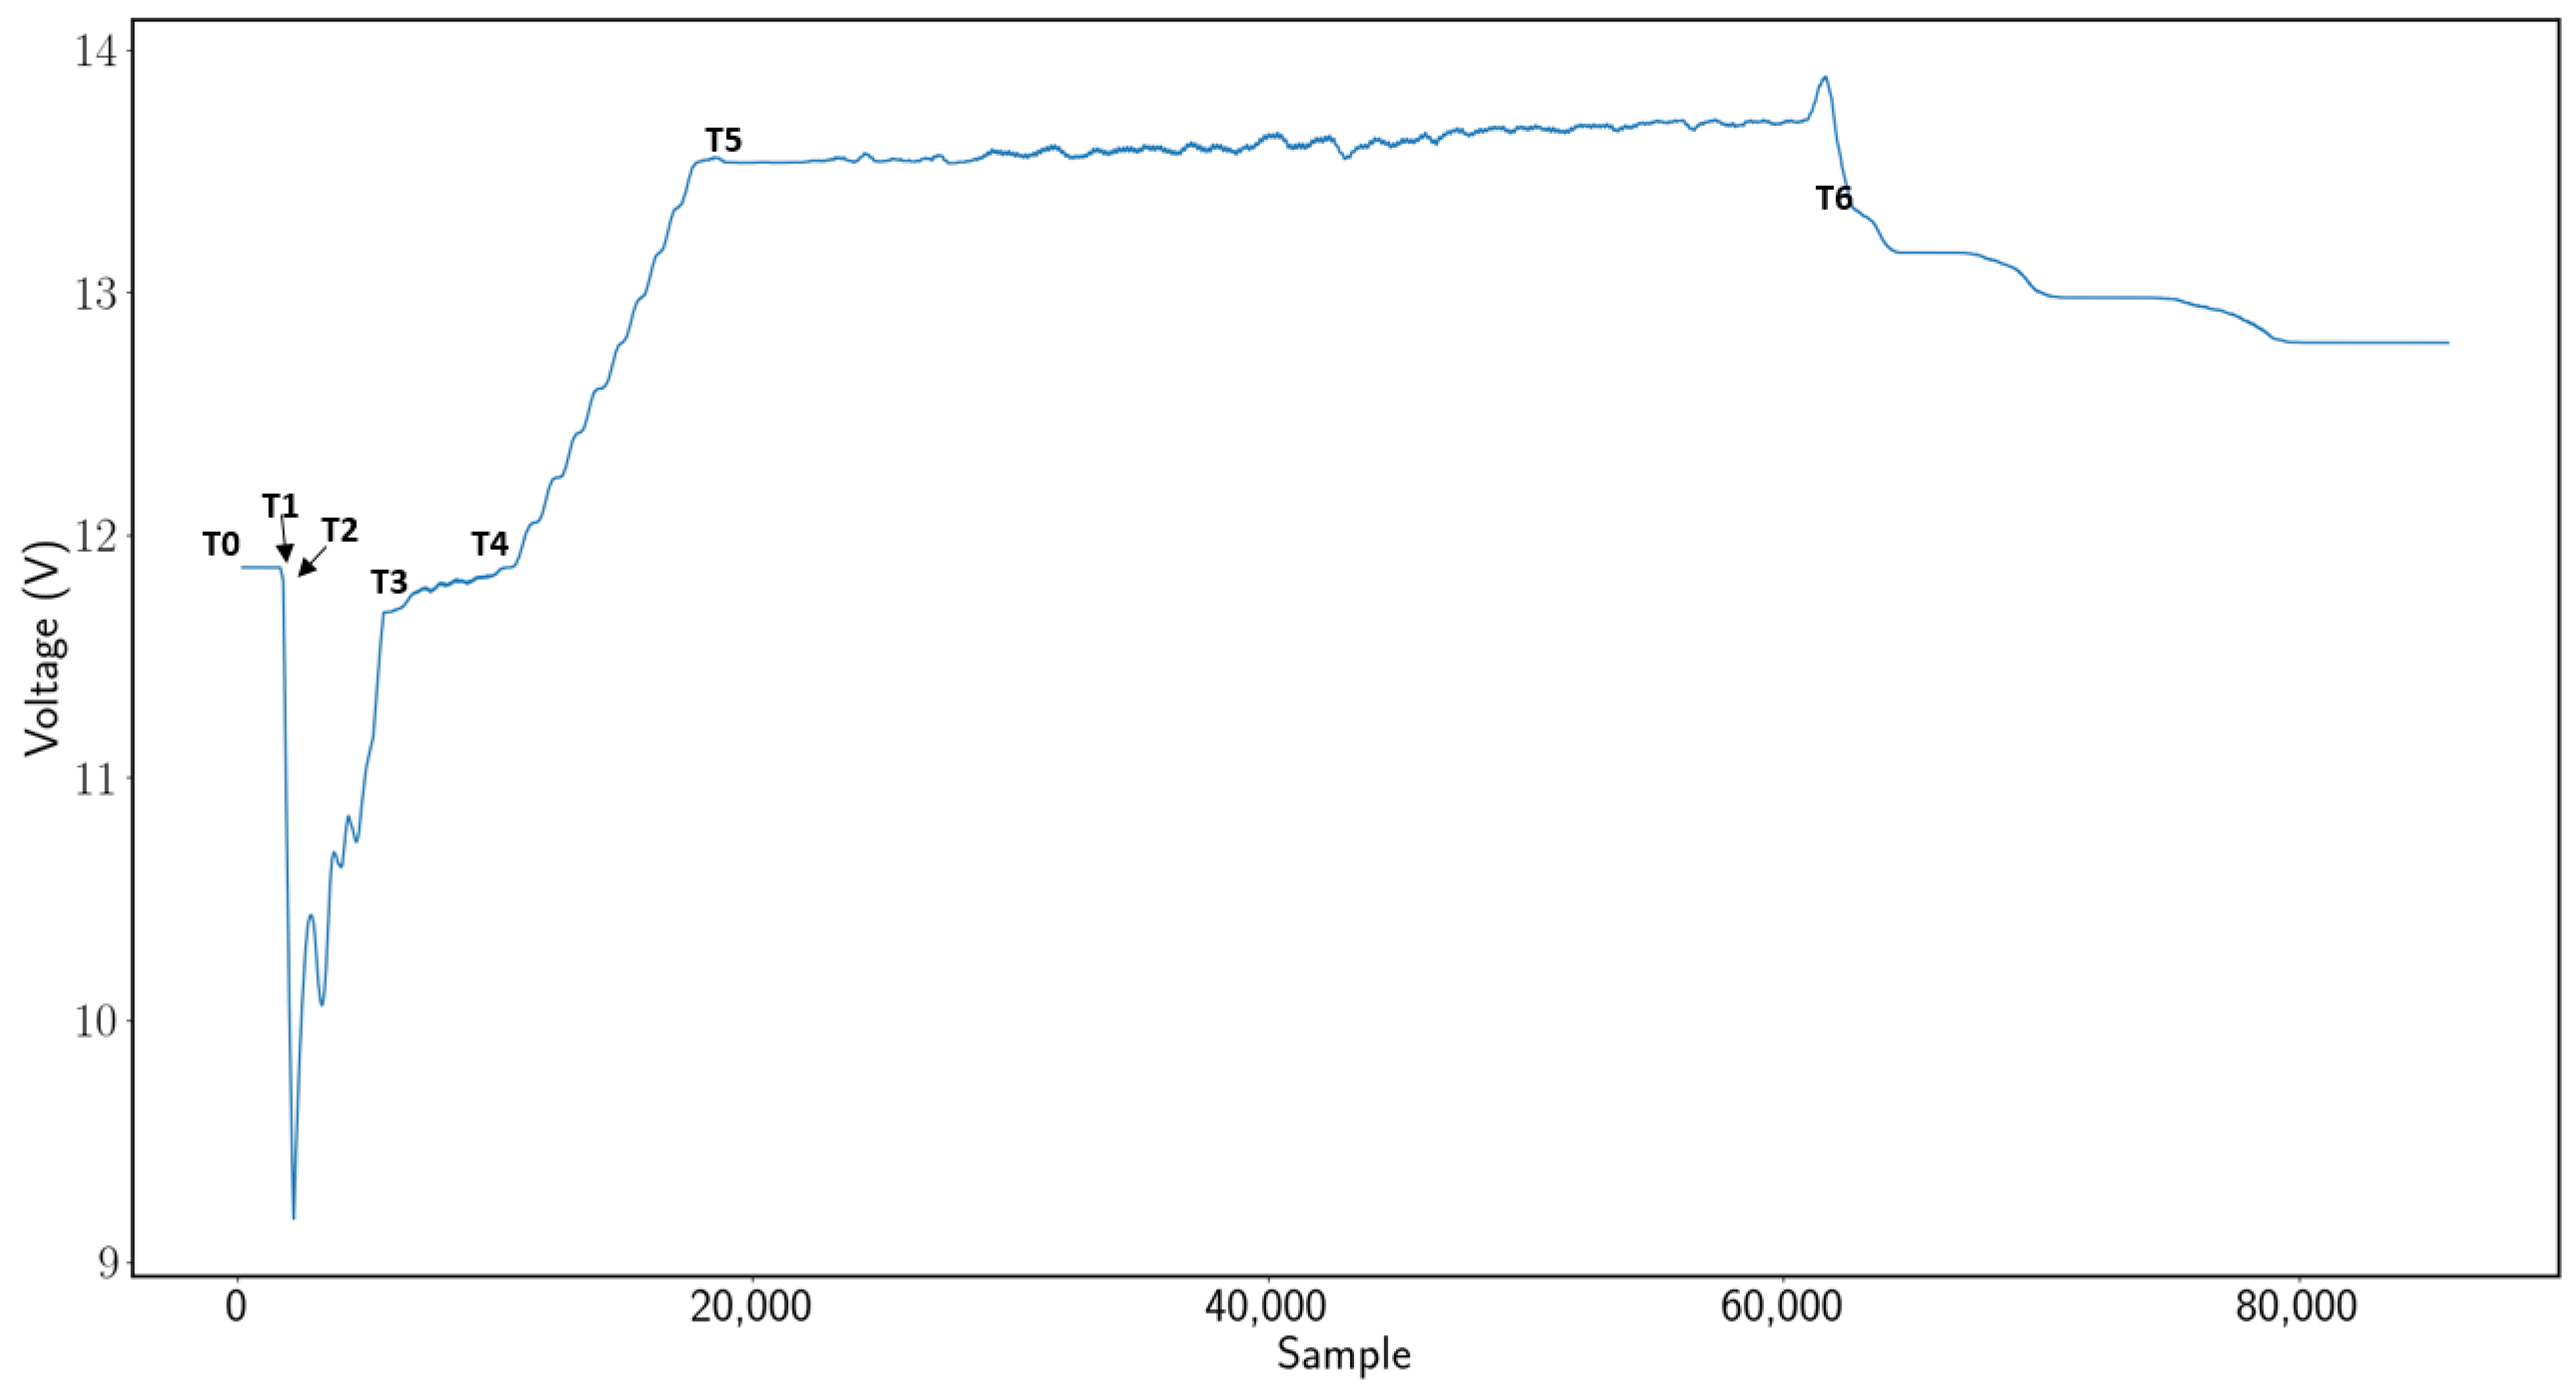
After the engine starts-up, the battery needs to be recharged to regain the consumed energy. The resulting charging voltage (compare T5 in Figure 2) can be used as an indicator as to whether the respective charging systems are properly working or not.
For both detection methods, charging voltages of around 14 V were measured (compare Table 5). However, the Picoscope displays an average of 0.11 V lower battery charge voltage than the VCDS.

3.4. Graph Similarity

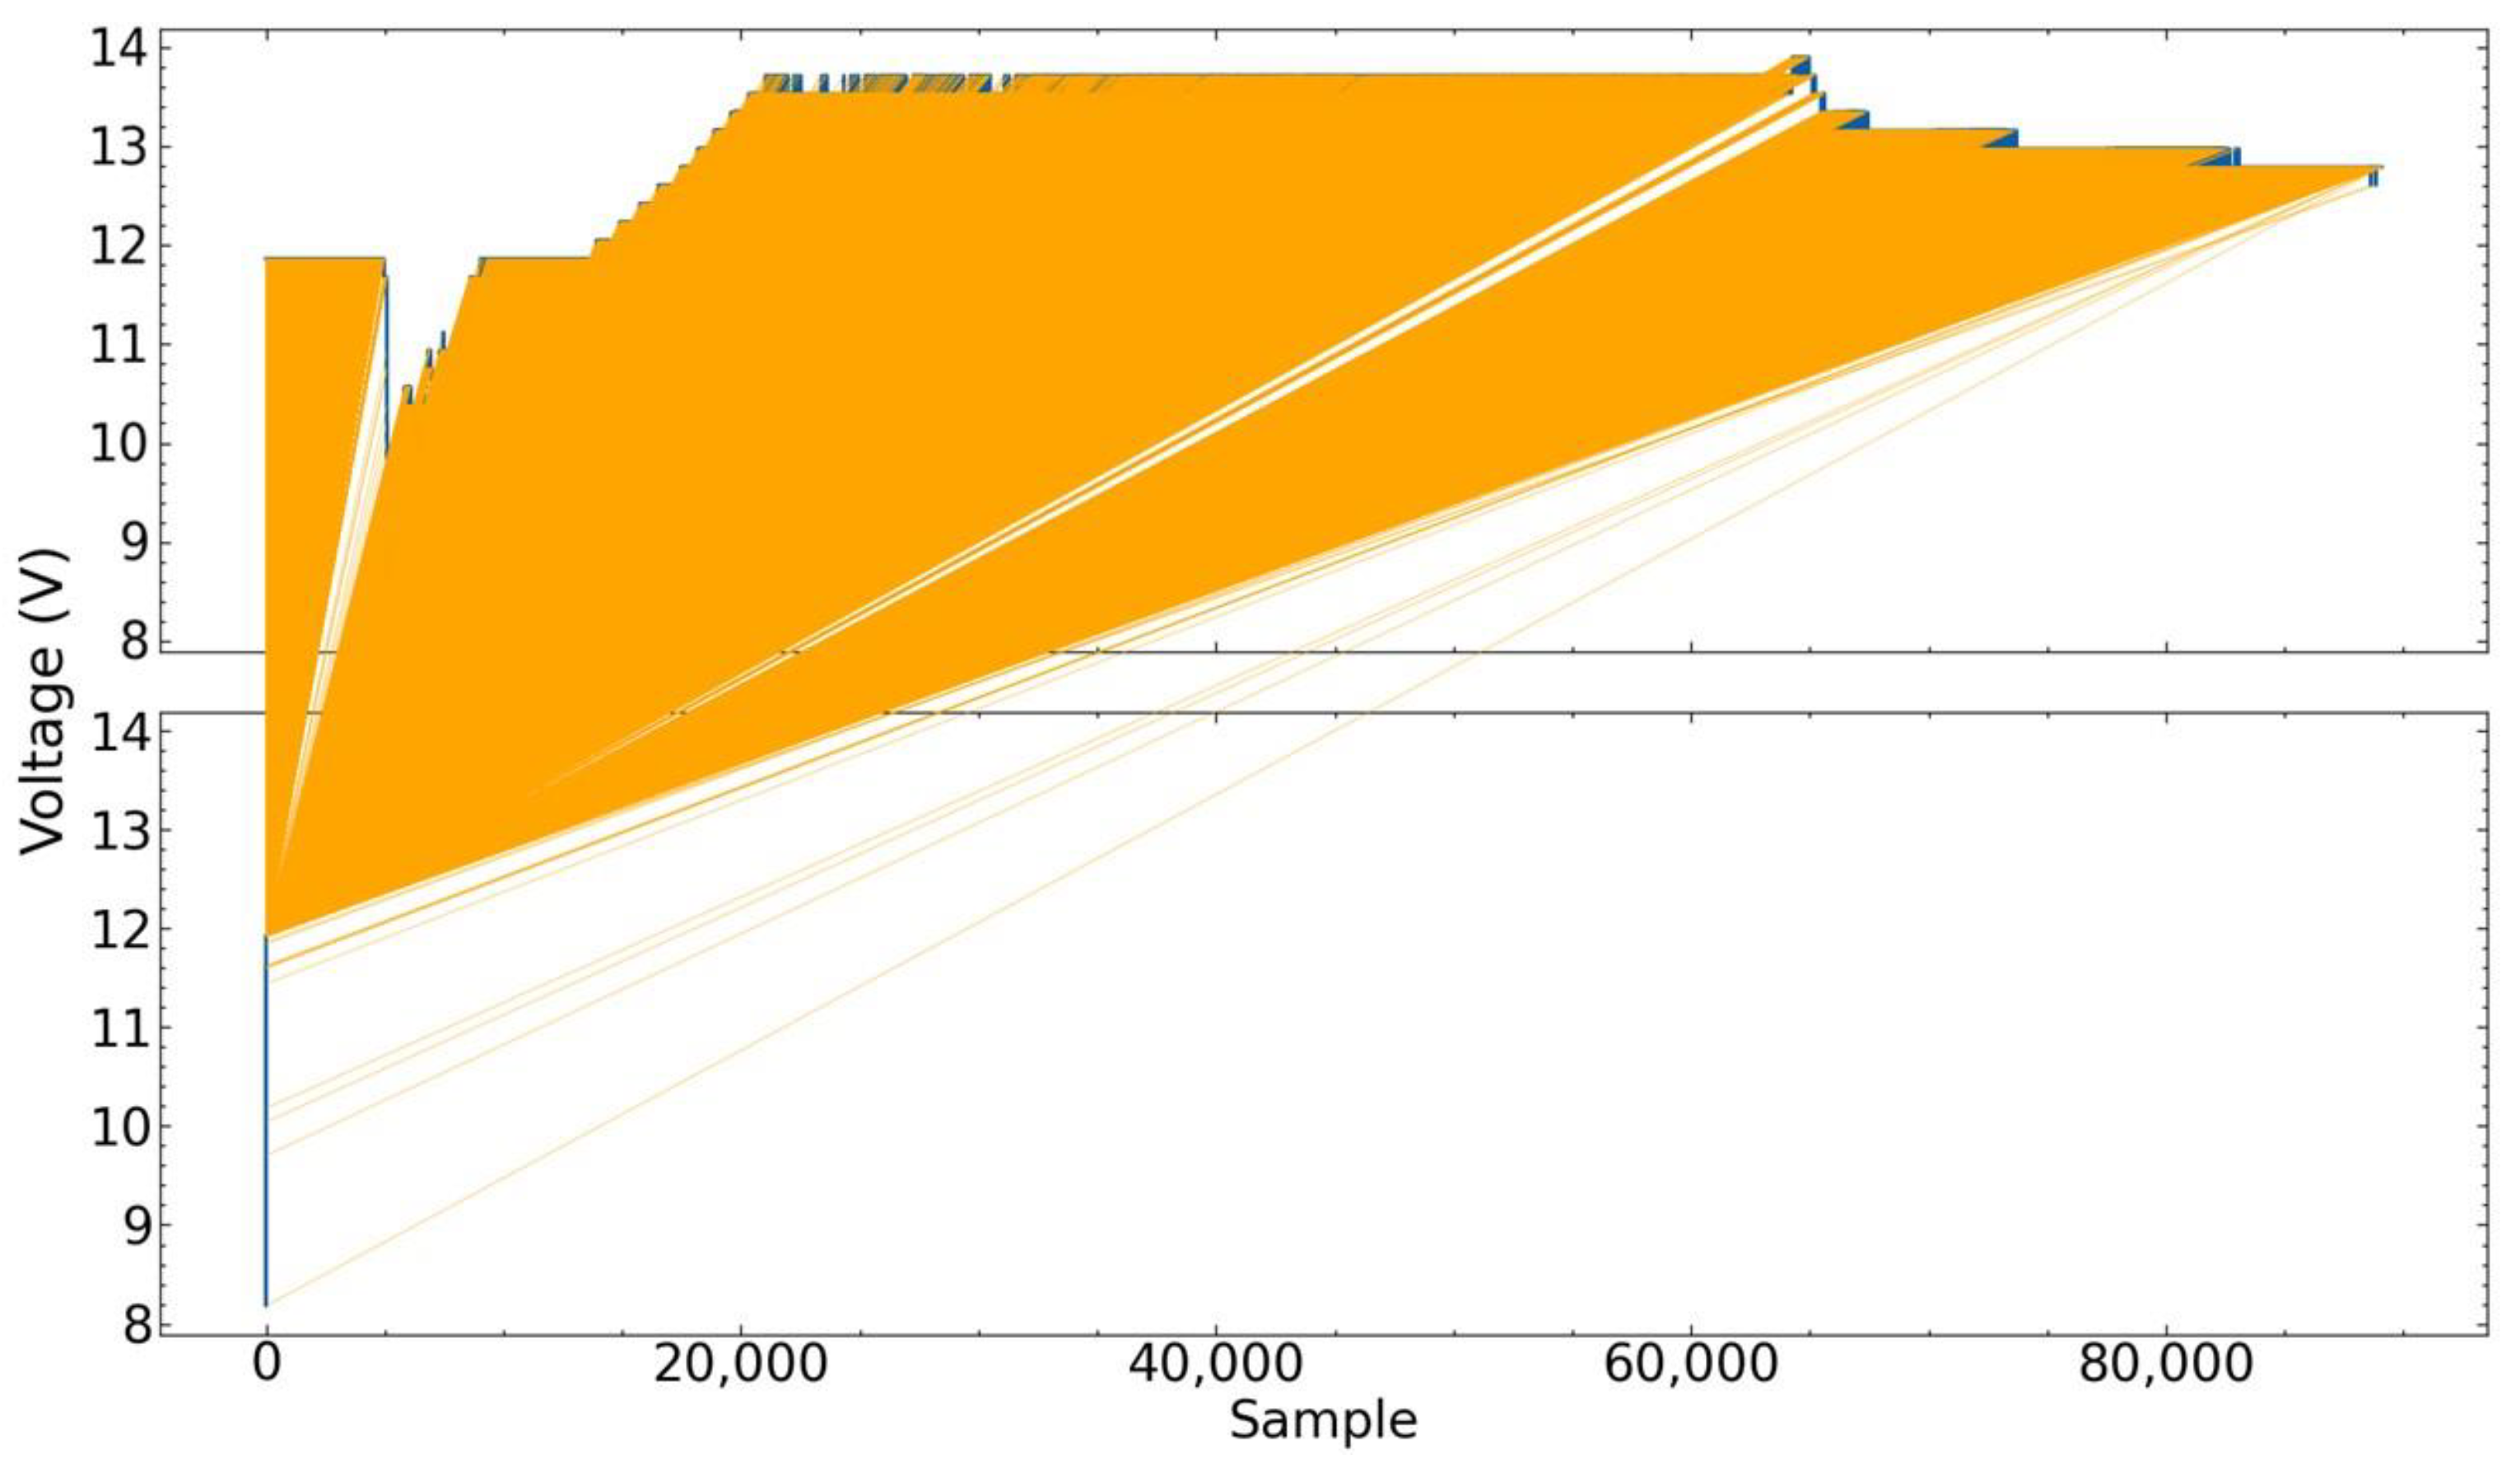
To perform a comparative analysis of the similarities between two graphs, the Dynamic Time Warping (DTW) approach was applied. However, this method is limited to the comparison of datasets for one car. Exemplarily, the DTW result for Sample Five is shown and the calculated DTW value is 532.4.
This indicates a very low similarity between the two graphs. The graphical representation also supports the statement about the low similarity of the two datasets and is shown in 
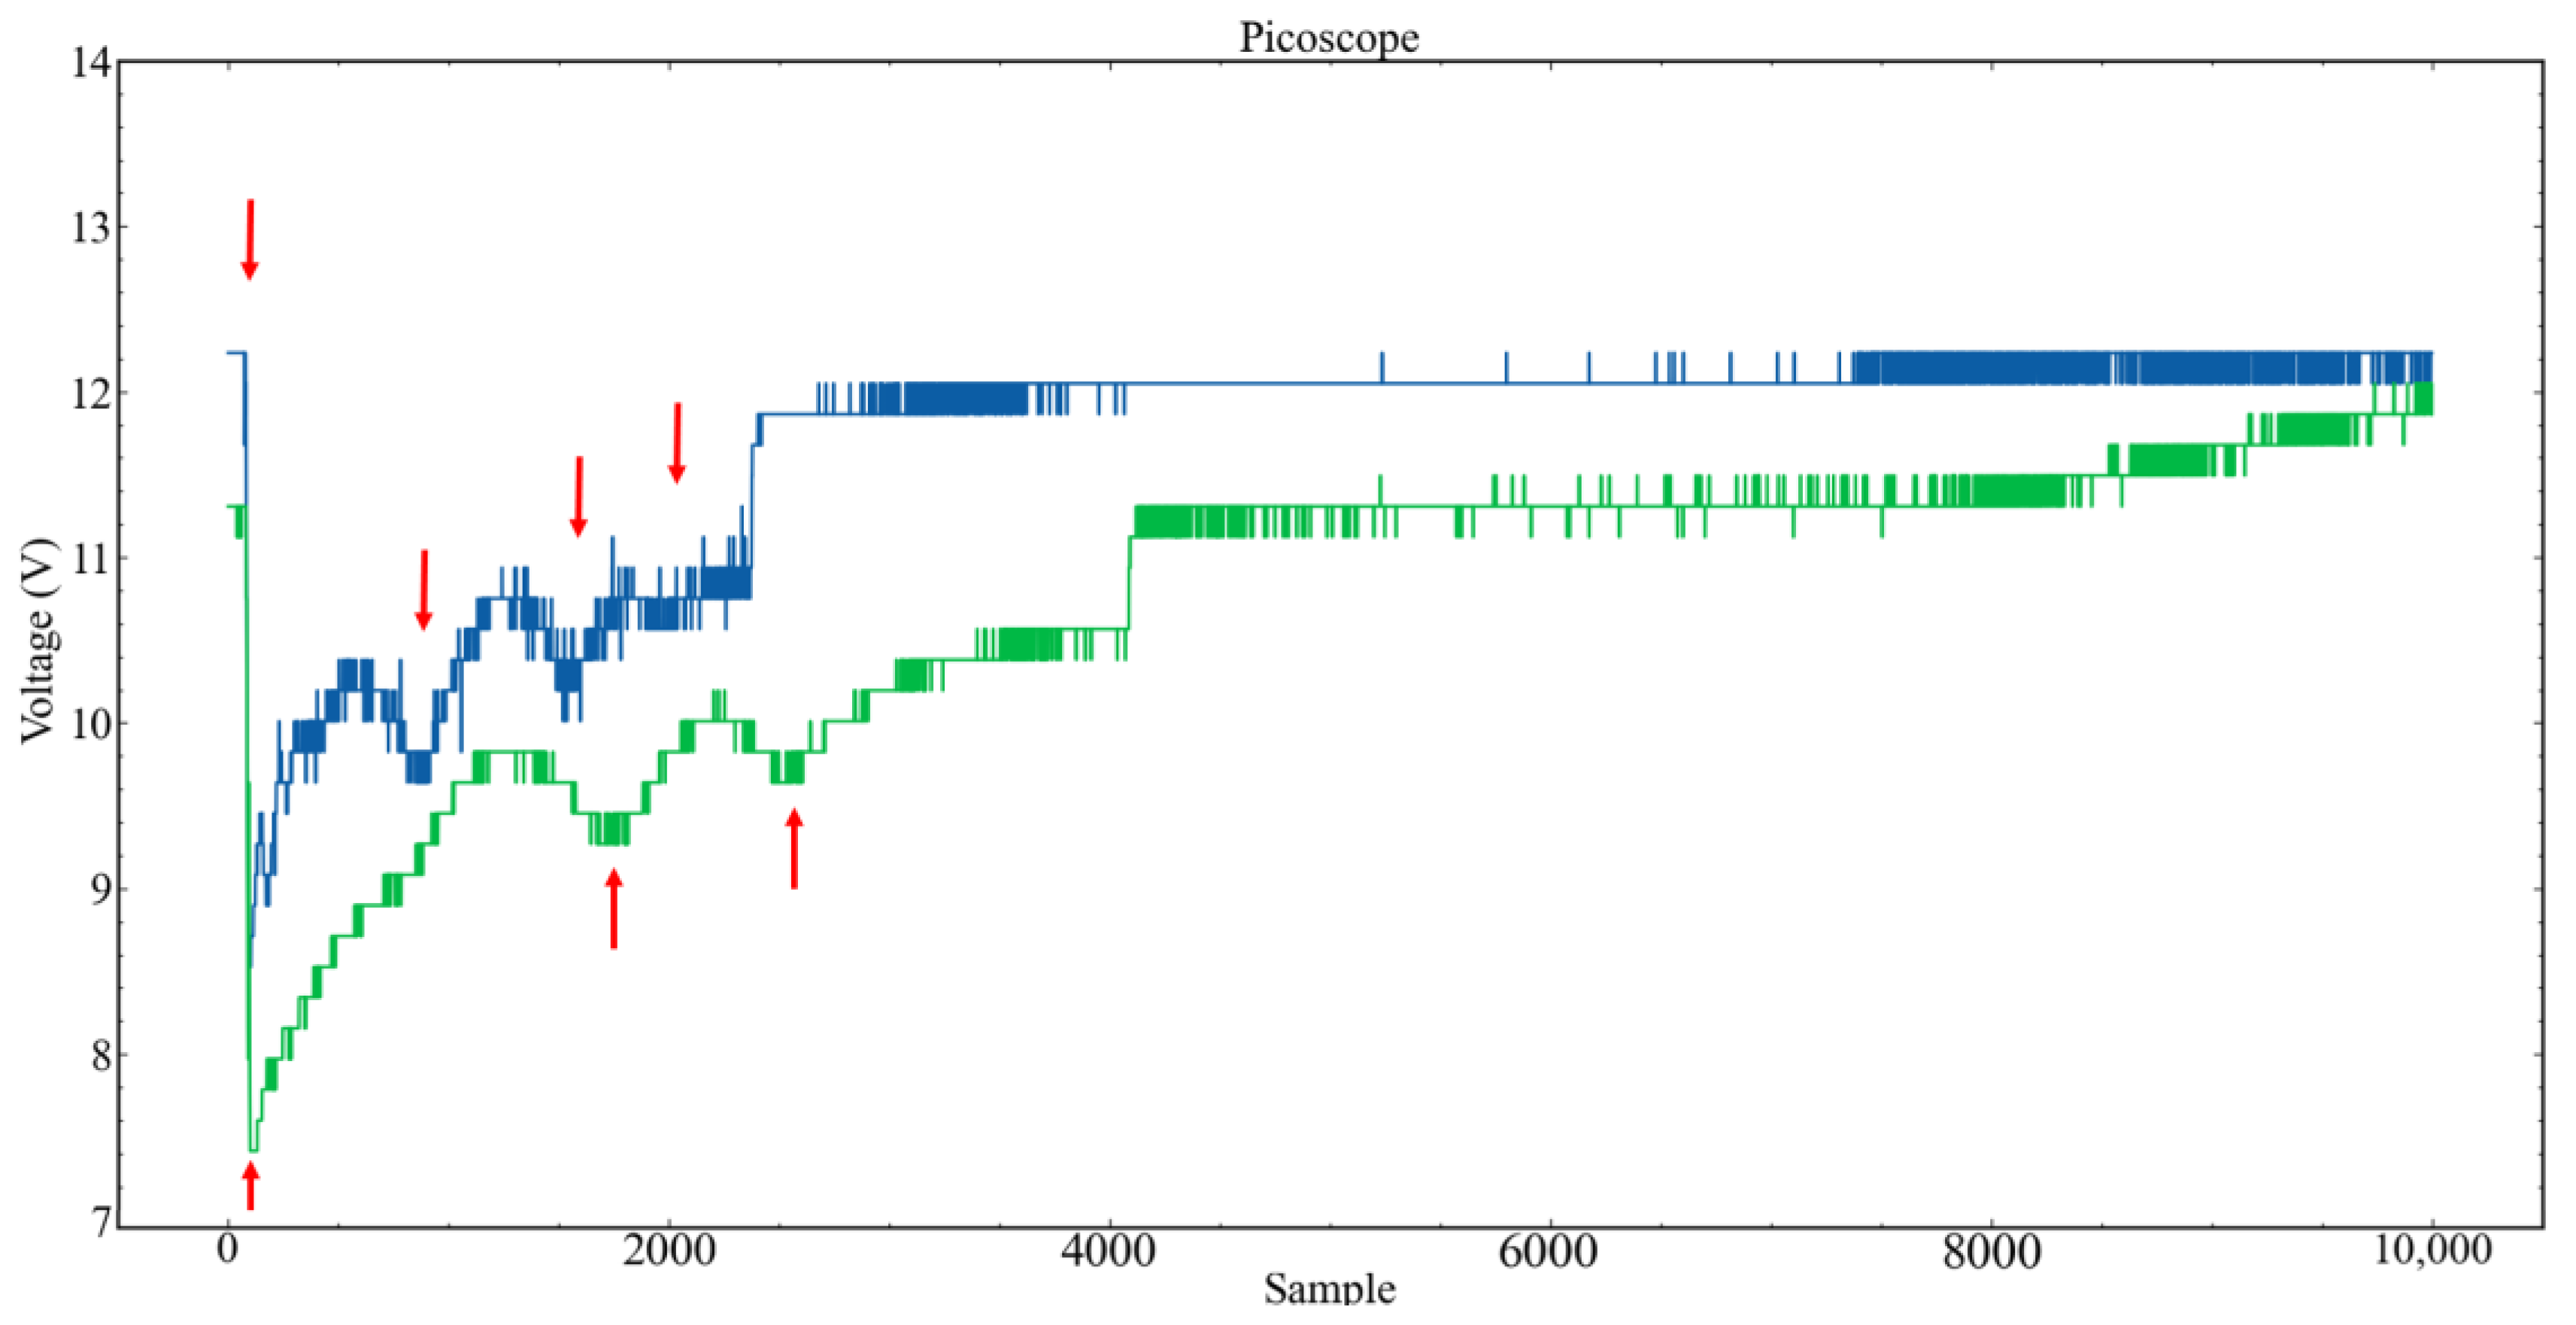
Figure 8. The upper part of the graph represents the cranking process recorded by Picoscope and the lower part of the graph represents the cranking process measured by VCDS.
To simulate comparable sample rates for both detection methods, datasets recorded with the Picoscope were down-sampled. Therefore, the respective down-sampling factor based on the number of samples of each method was calculated.
d o w n s a m p l i n g _ f a c t o r = N u m b e r   o f   P i c o s c o p e   S a m p l e s N u m b e r   o f   V C D S   s a m p l e s
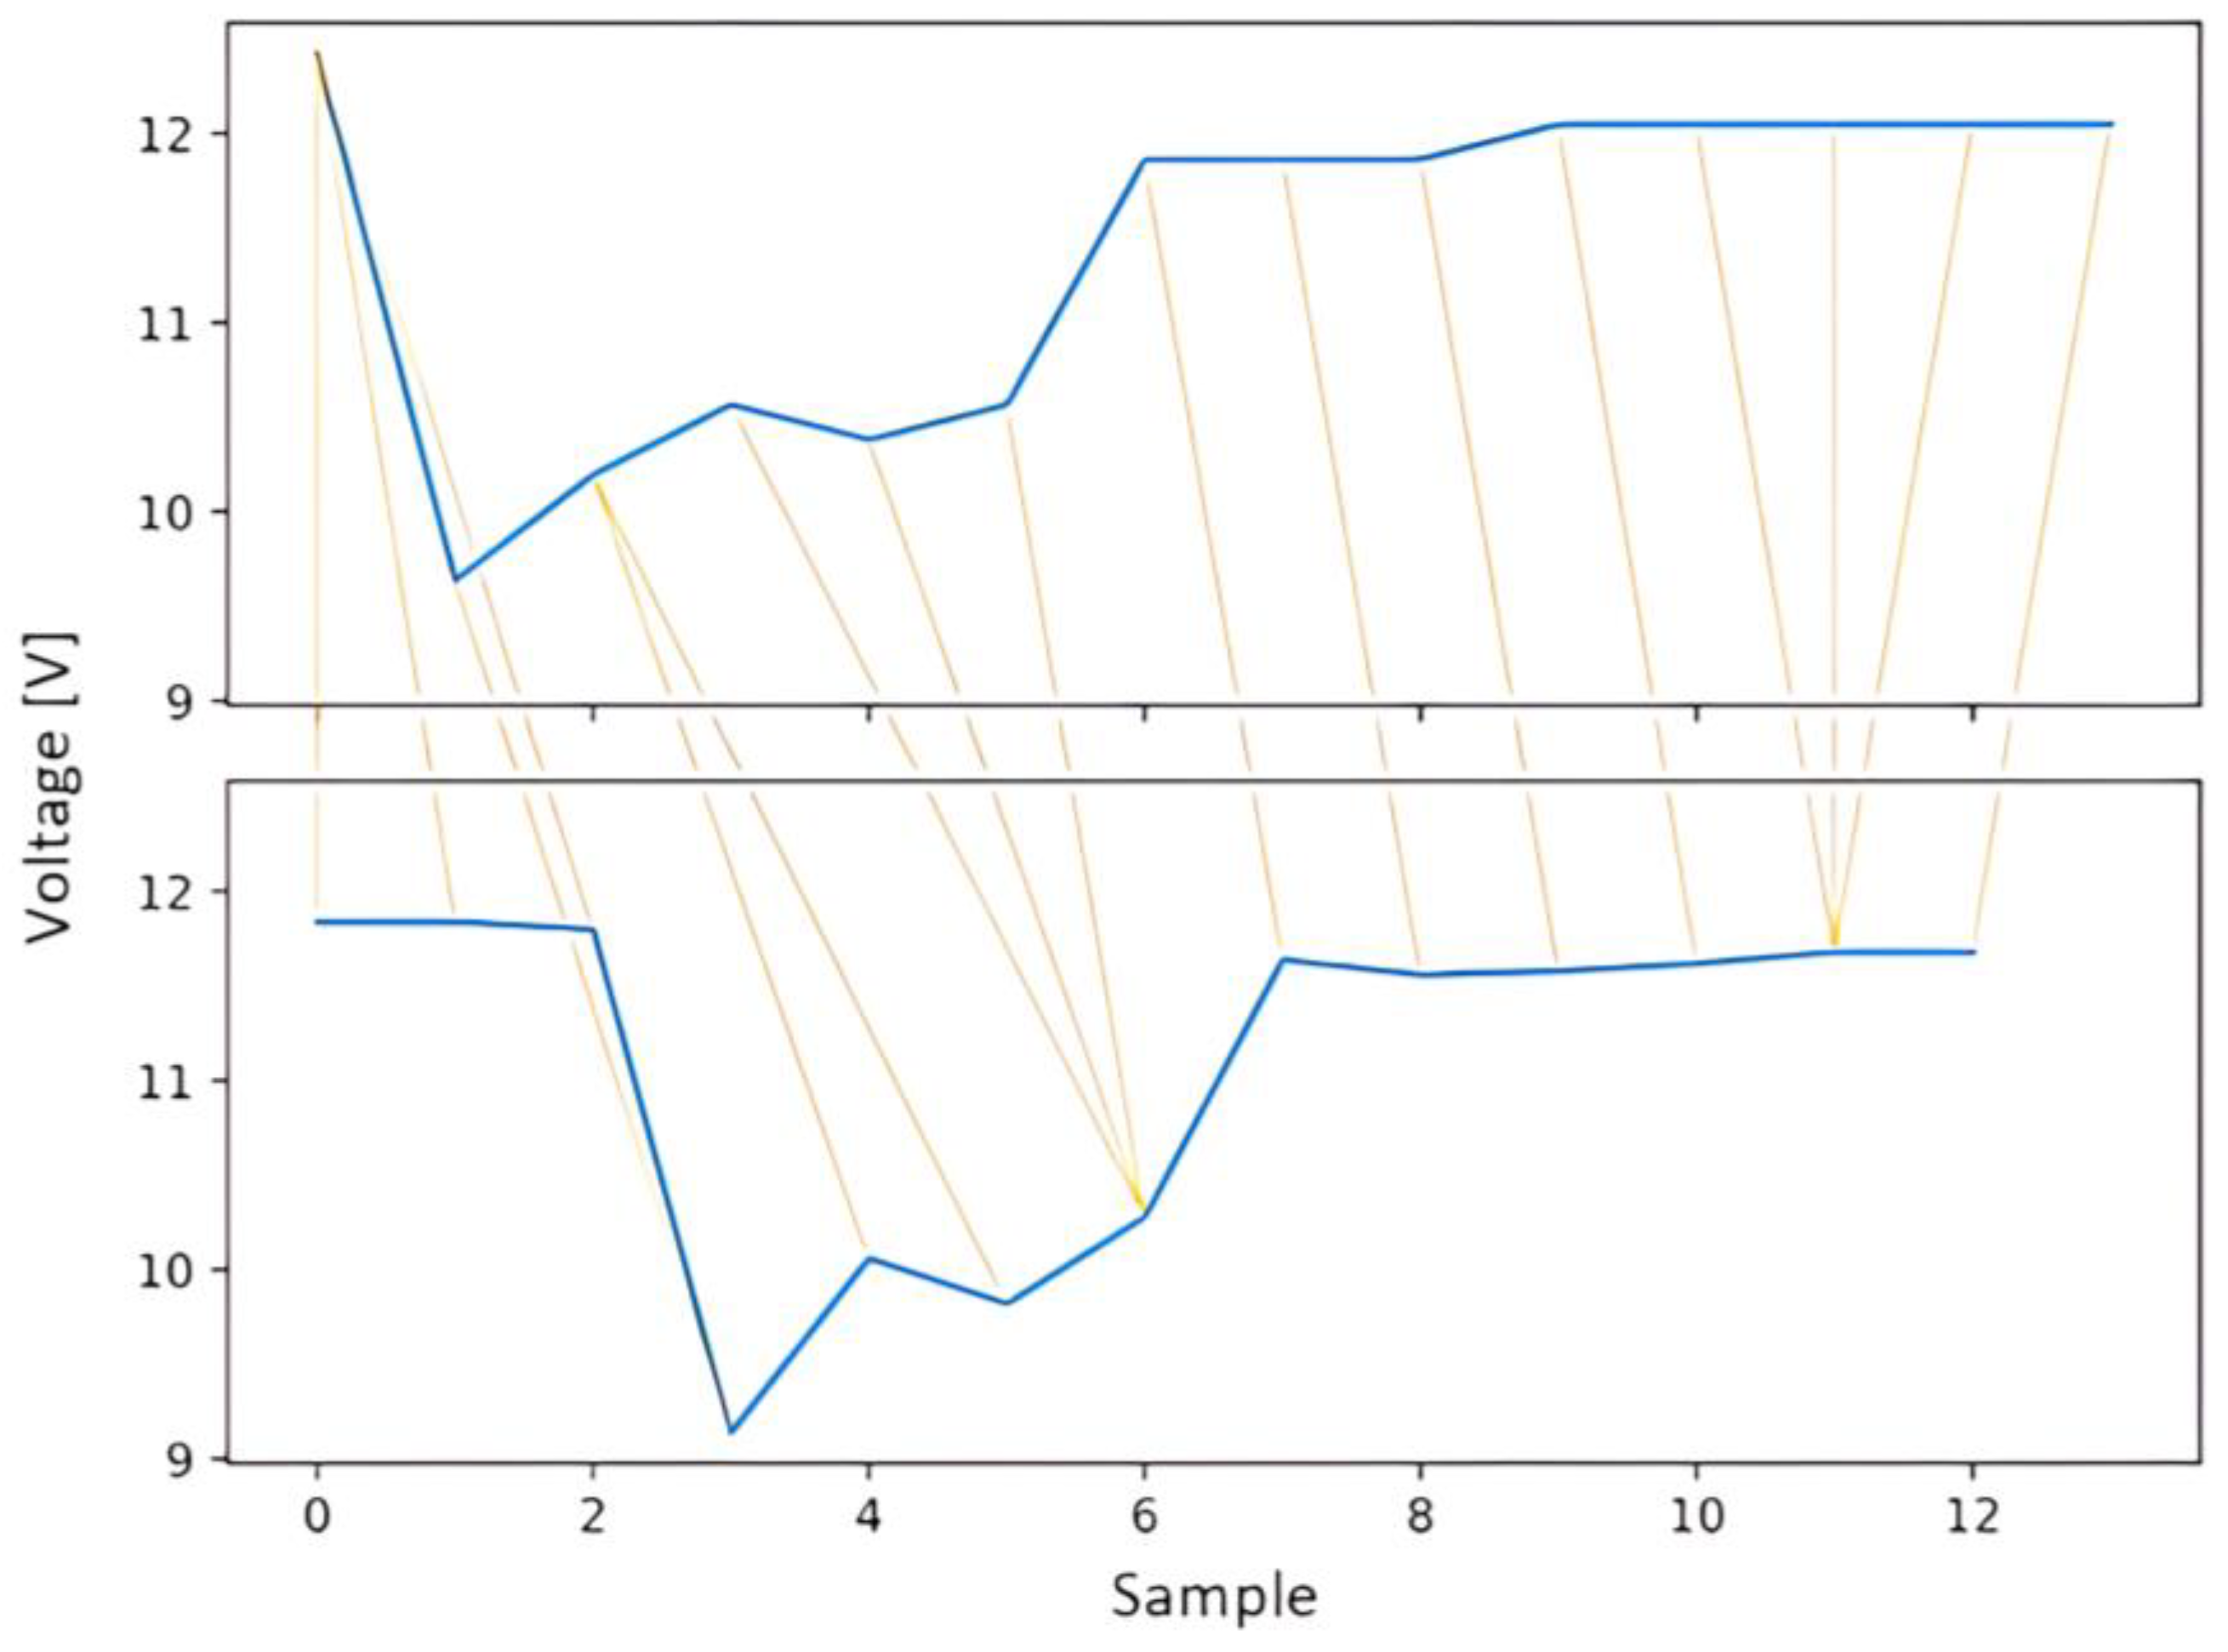
For the example shown above, this down-sampling factor is 446. Applying this factor to the existing data of the Picoscope results in the following DTW graph (Figure 9):
The calculated DTW value of 1.6 indicates a much higher agreement between the two signals. This supports the assumption of a stronger similarity between the two signals after down-sampling.
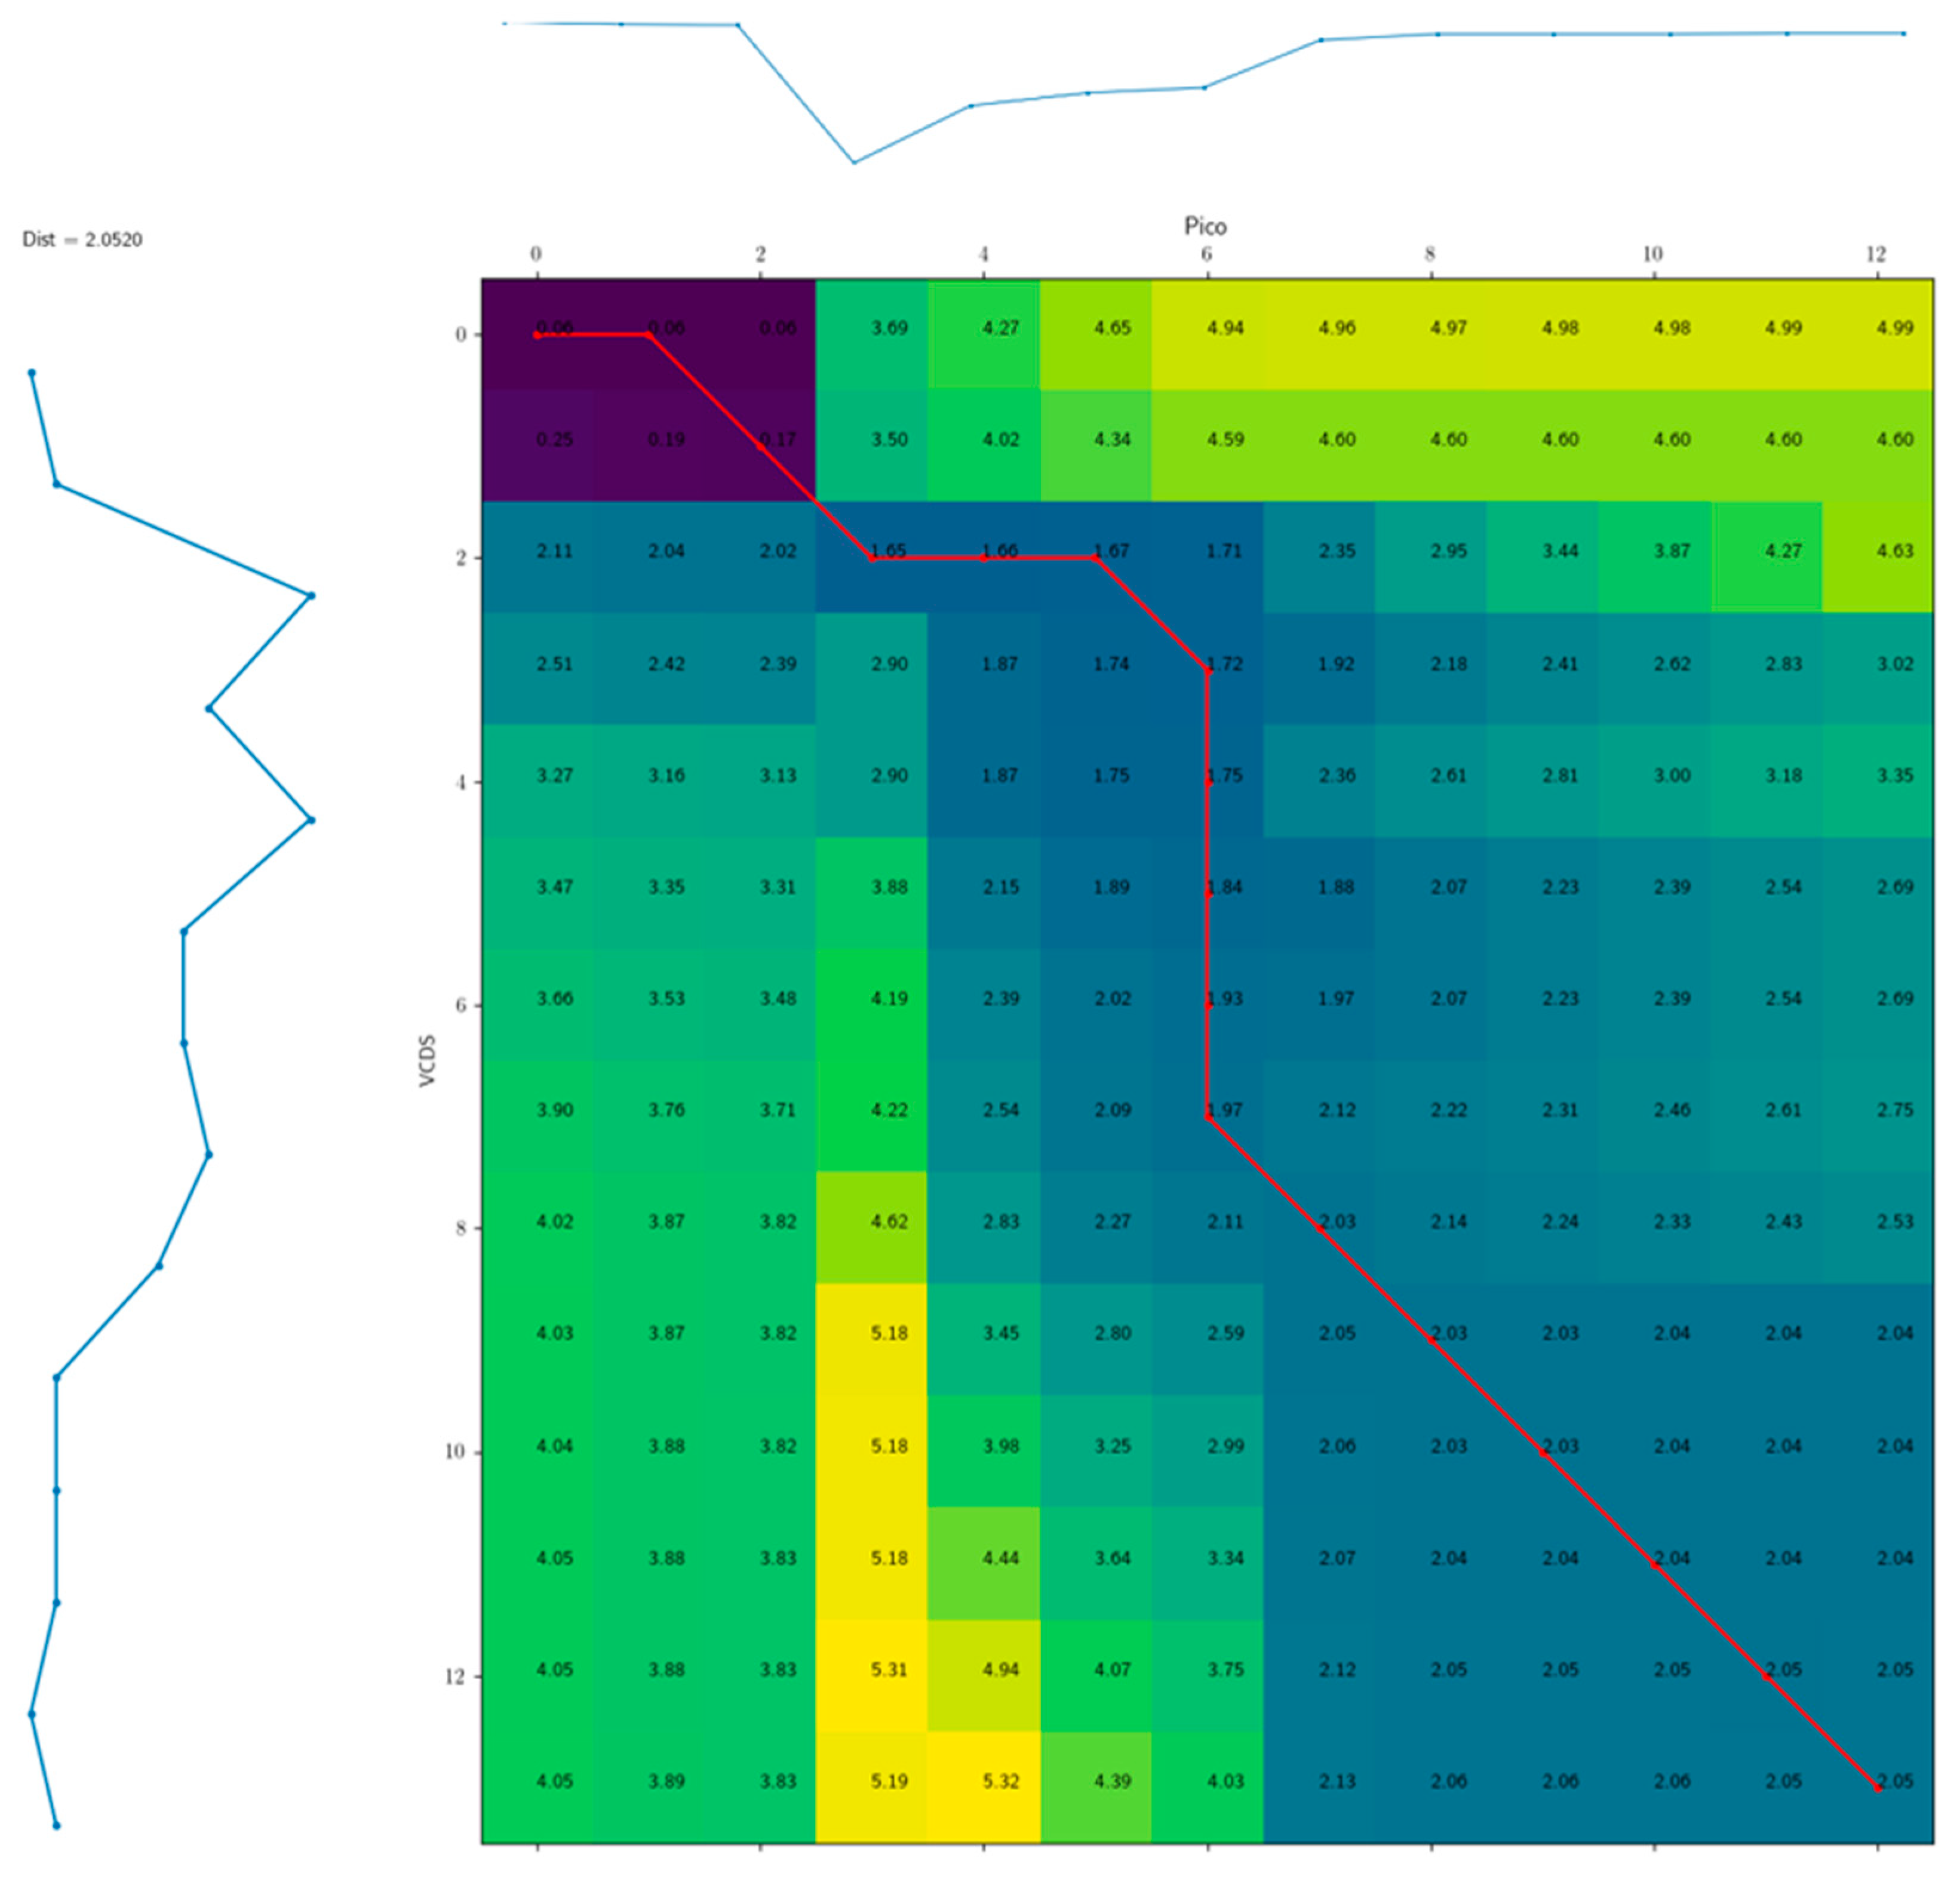
A heat map represents the cost of the possible time shifts from signal A to signal B. Figure 10 shows the heat map of the cost function that was used to determine the best possible alignment of signals A and B. To achieve this alignment, the path through the heat map needs to be minimized.

3.5. Determination of the Battery Voltage with a Simulated Error

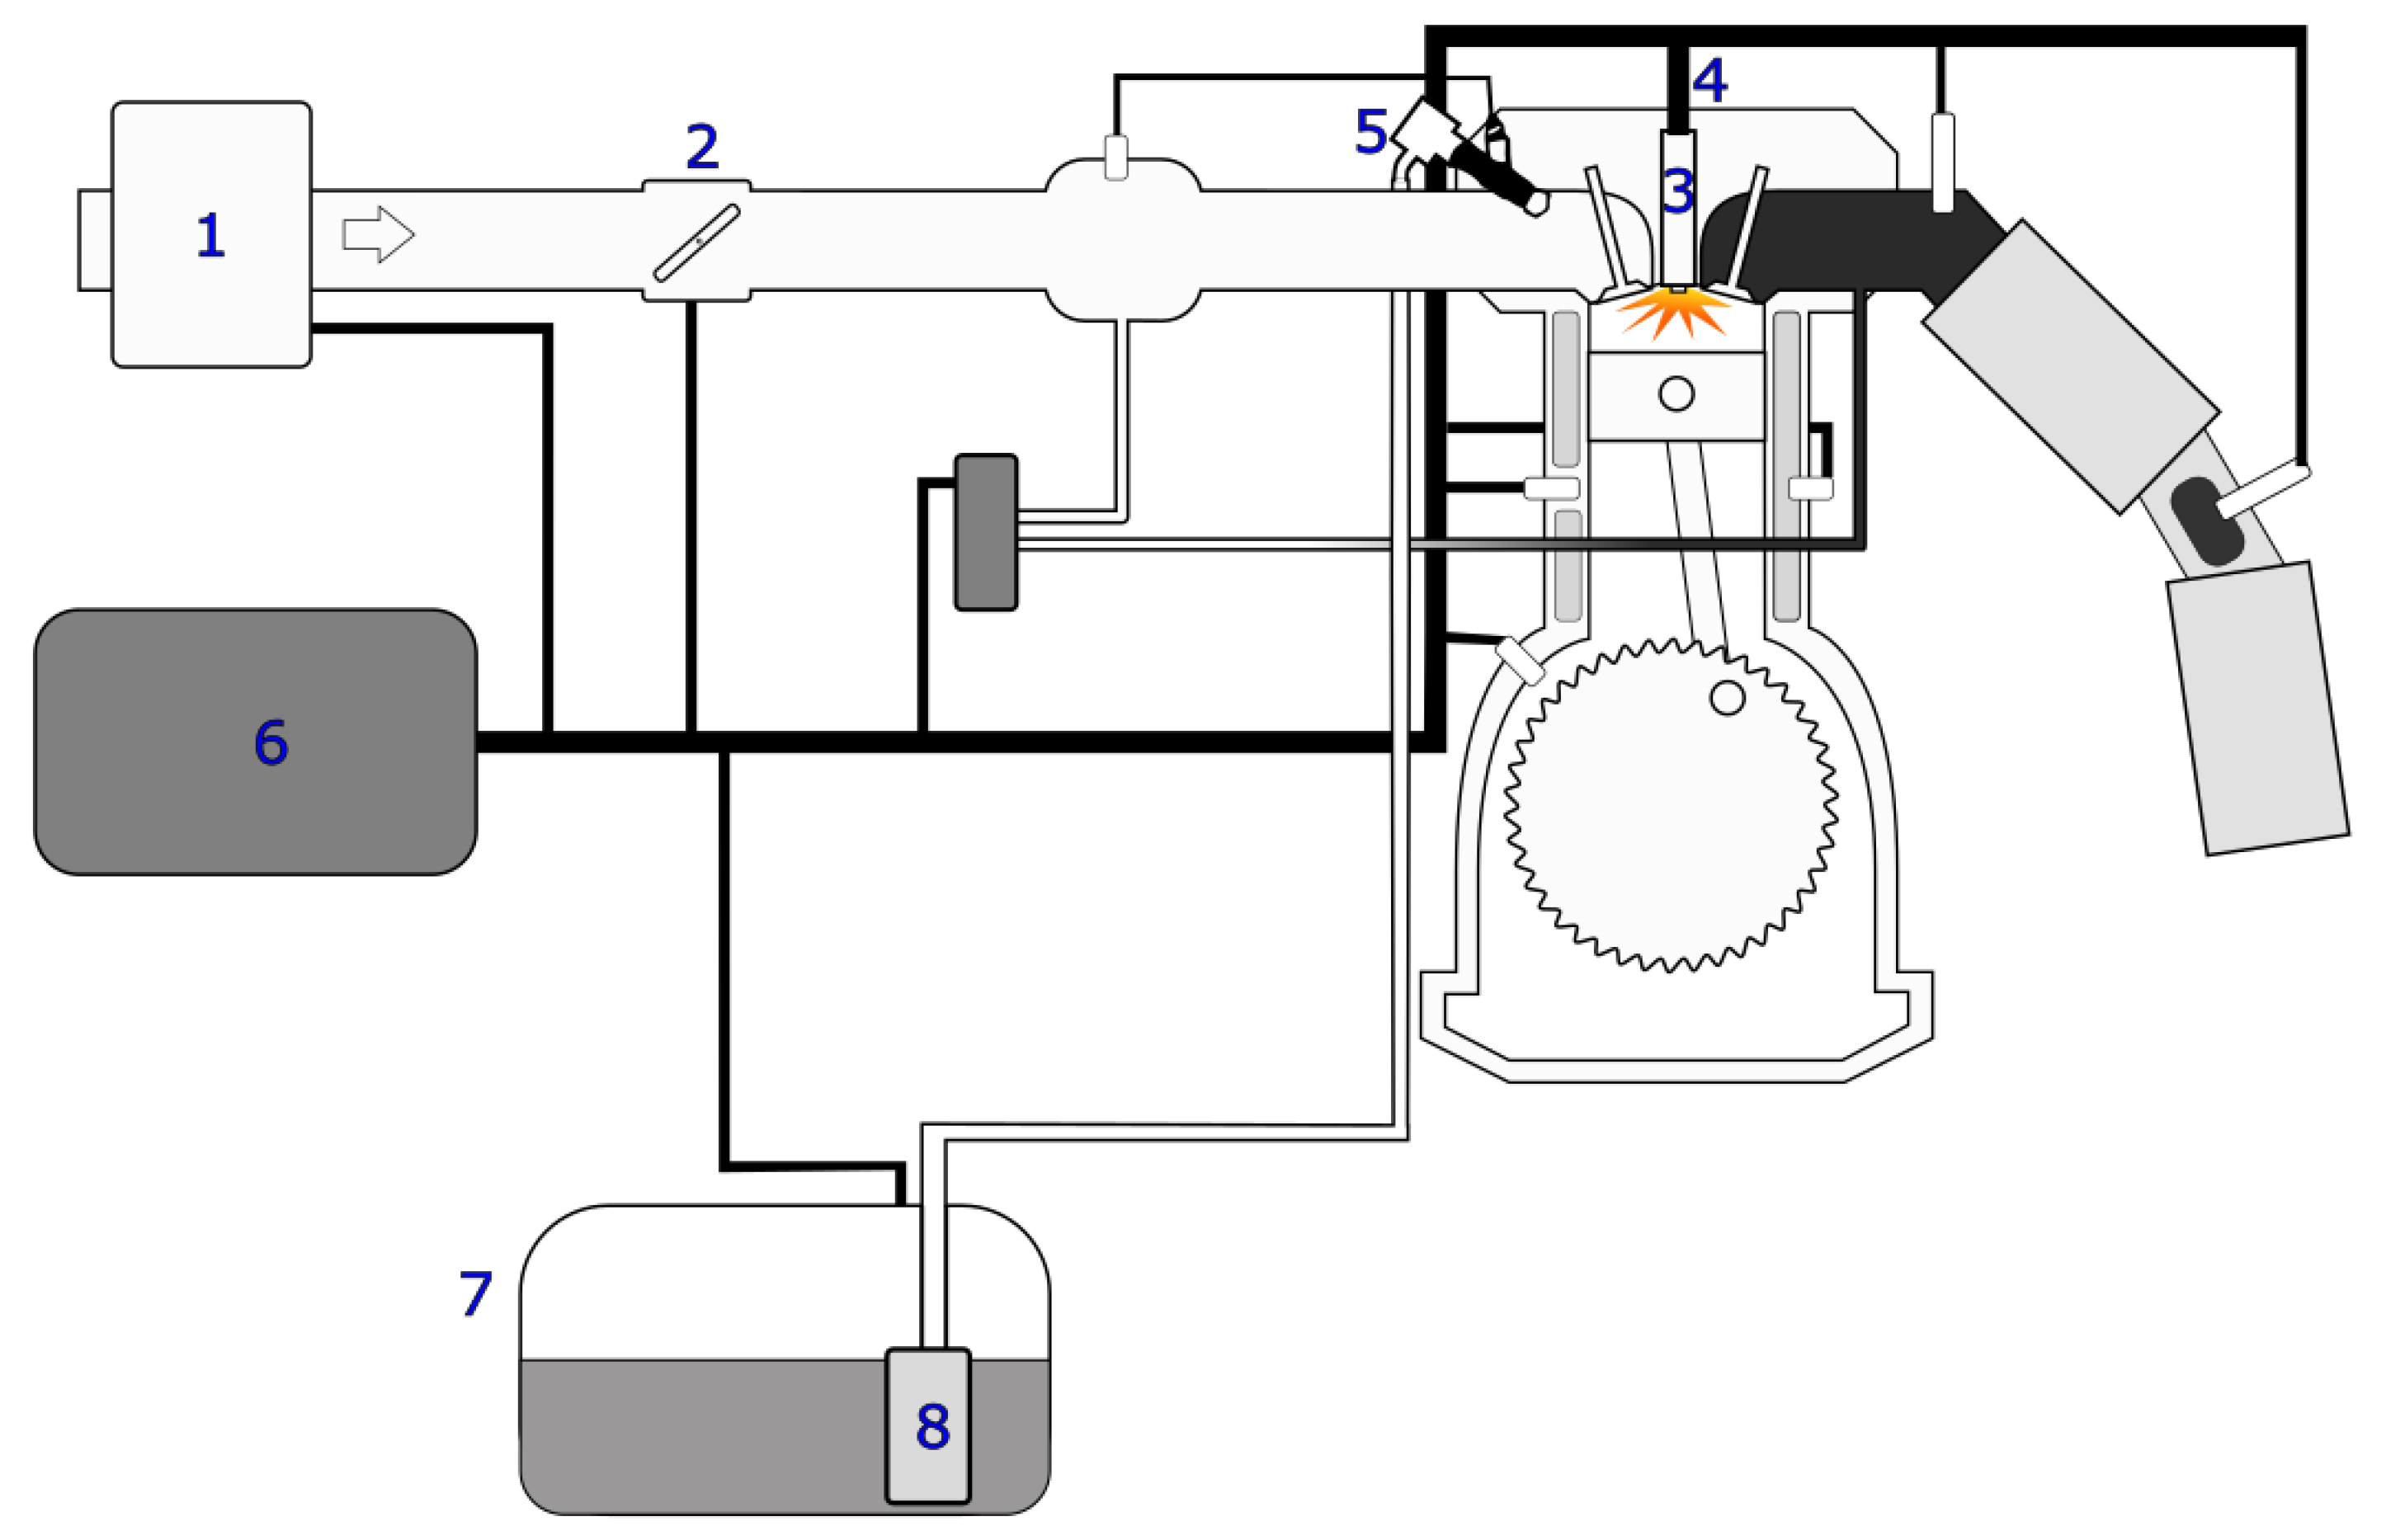
To provide further support for our previous findings, we intentionally caused an error on one of the cars. Therefore, we removed the ignition coil during engine start-up. The spark plug (4 in Figure 11) was responsible for igniting the compressed air–gas mixture inside the engine, and the ignition voltage required for this depended primarily on the gas density in the combustion chamber. As the gas density increased, the required ignition voltage also increased almost linearly. The single-spark ignition coil transmitted the ignition voltage to the spark plug. By removing the ignition coil, we inhibited ignition in the cylinder.
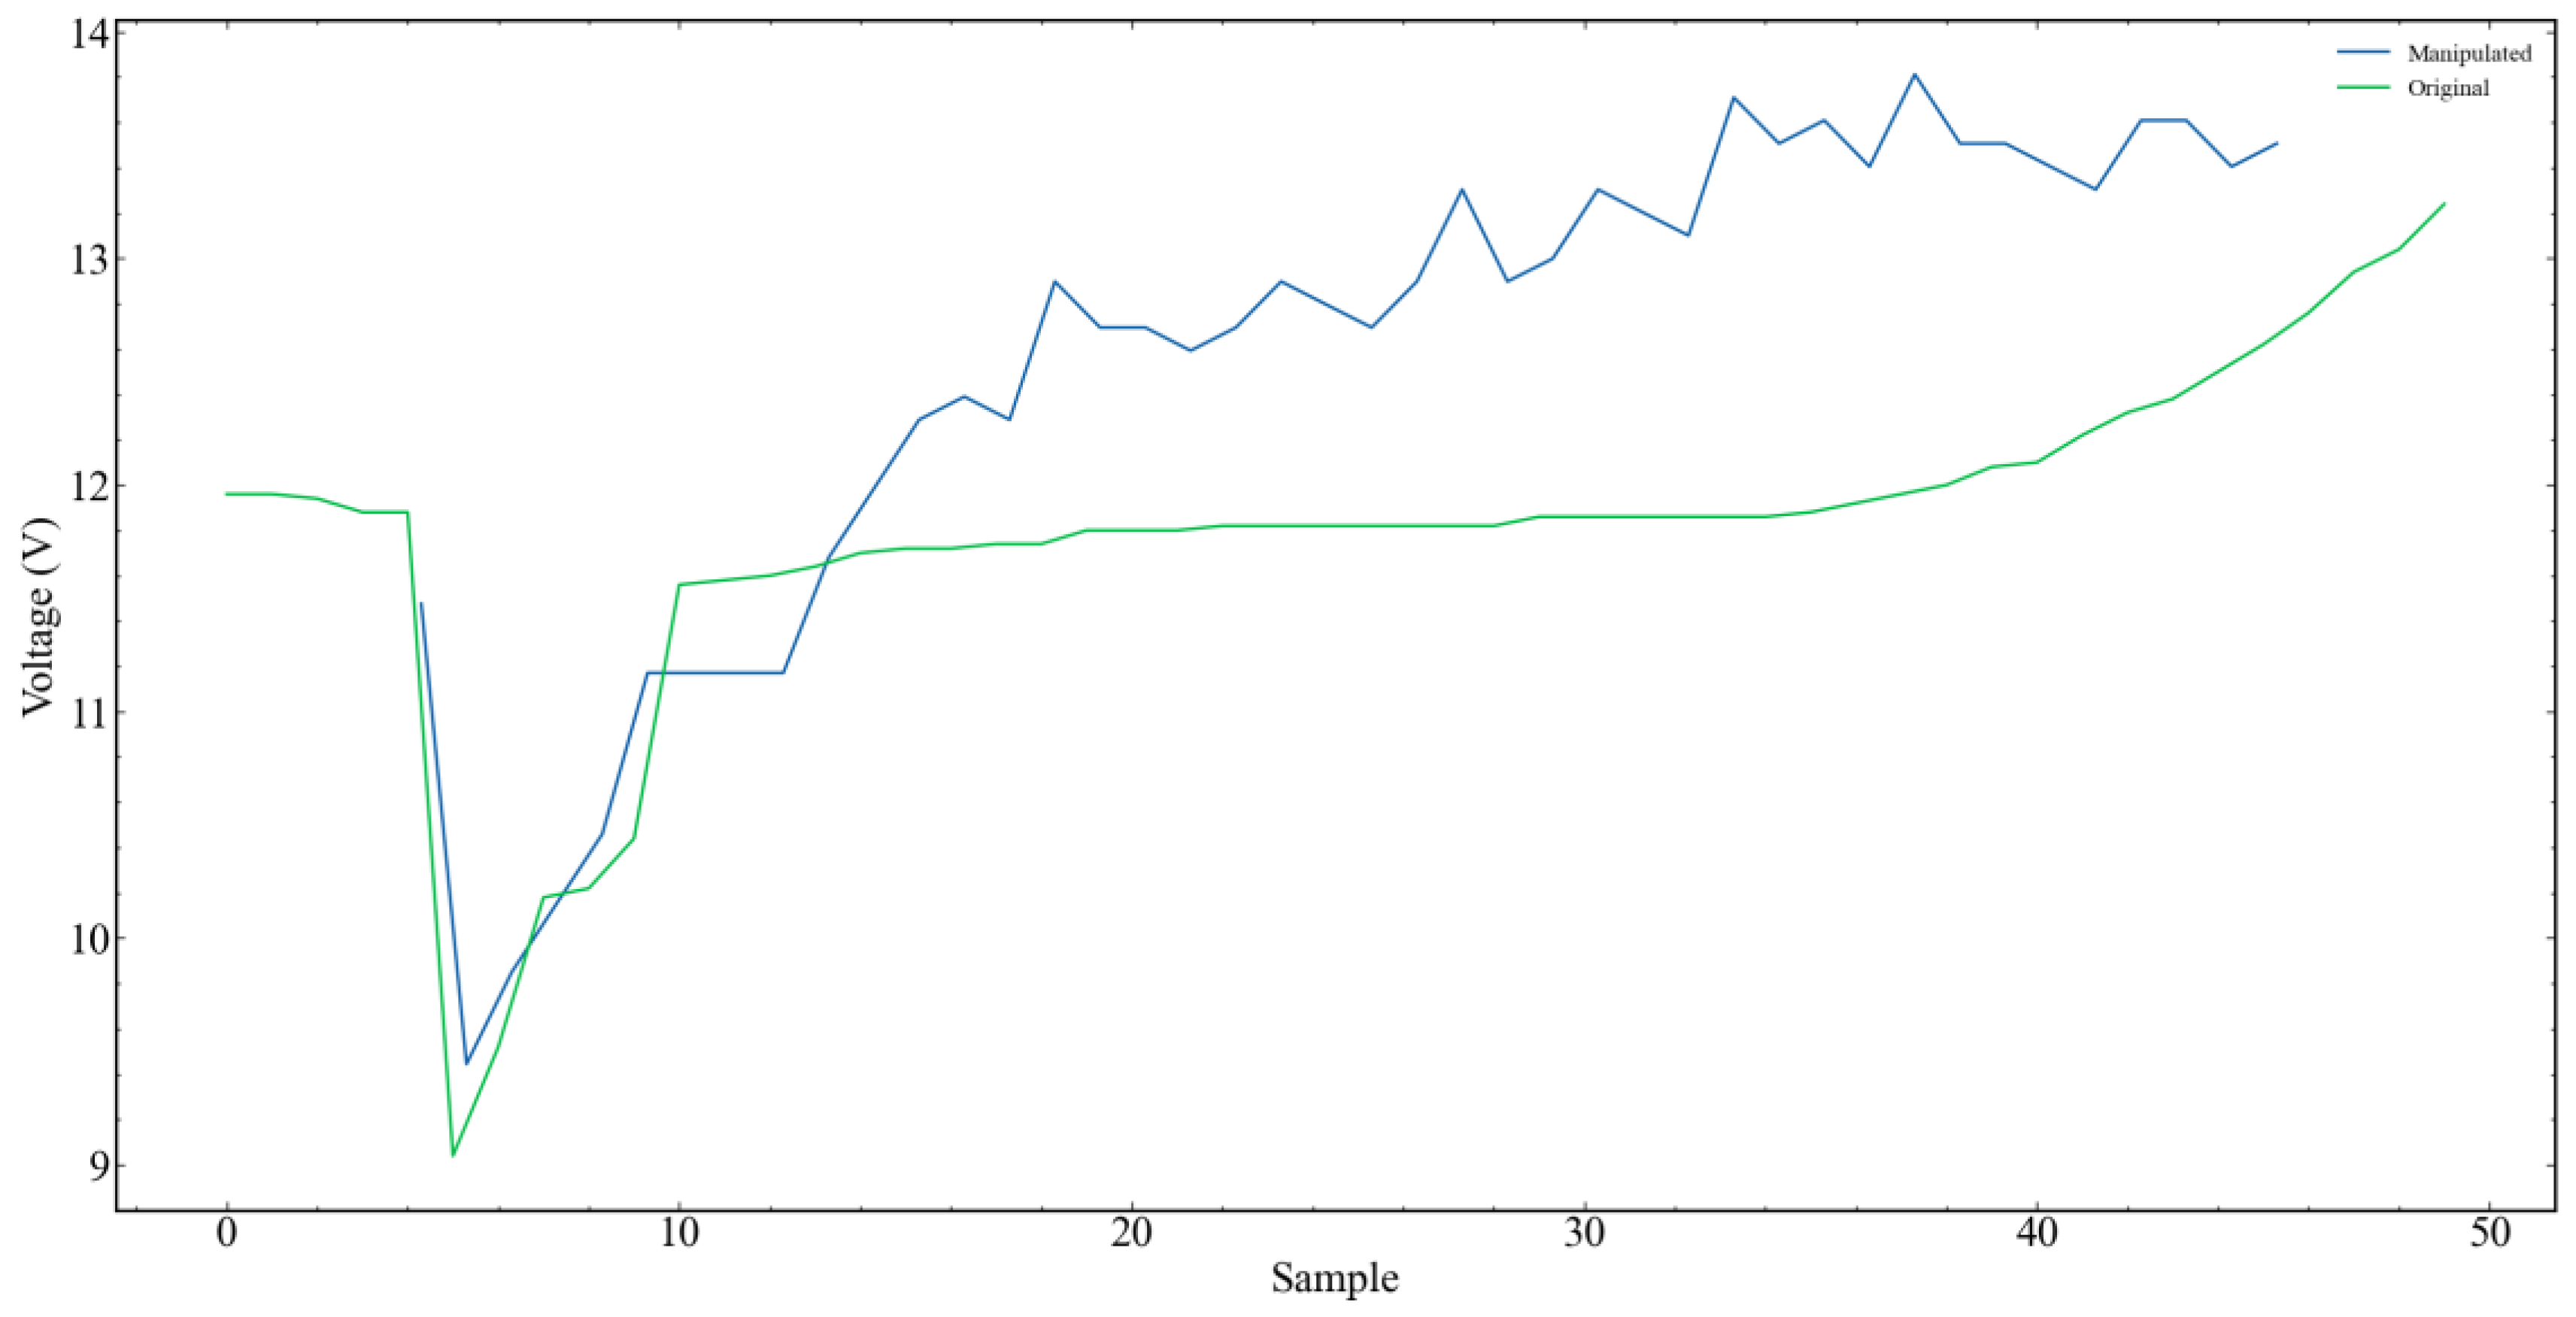
Figure 12 shows the results of the battery voltage during engine start-up with and without the ignition coil measured by the Picoscope.
The original plot shows the four voltage drops, which were described as significant in Section 3.2. Manipulating the vehicle by removing the ignition coil resulted in a reduced number of voltage drops (3).
Table 6 shows the voltage values as well as the time interval between the detected dips. For each of the two measurement series, the time ranges between the aforementioned dips were calculated. For this purpose, the time point of the first dip was assumed to be zero. In the comparison of the voltage, it can be seen that the mean value of the voltages in the original state of the motor between the four dips is 9.8 volts. For the manipulated case, this is 8.8 volts, i.e., almost 1.1 volts lower on average. The average of the time intervals between the dips for the unmodified motor is 0.09 s. For the motor in the manipulated state, this value is 0.16 s. Accordingly, the time between two dips, i.e., between two compressions of the engine, is 1.7 times higher than in the original state.
In contrast, the battery voltage measurement via the engine control unit only detects a reduced number of dips compared to the measurement via the Picoscope directly at the battery (Figure 13).
The results in Table 7 show that the voltage values in the manipulated condition were different compared to the original condition. In particular, the first dip in the manipulated condition was higher than the corresponding dip in the original condition. The difference between the two measurements was about 0.4 volts. The time interval between the dips was also different, with the second dip in the manipulated condition occurring later than in the original condition.
For the simulated error—the comparison between the battery voltage signal measured via the engine control unit (Figure 14A) and the signal measured directly at the battery with a Picoscope (Figure 14B)—significant deviations can be observed. These deviations include not only the differences in the voltage ratios, but also a clearly different resolution of the signals. In particular, significant voltage drops within the measurement via the engine control unit by means of VCDS are clearly less visible than in the measurement via the Picoscope directly at the battery. This suggests that due to the significantly lower sampling rate of the measurement via the engine control unit, the compression cannot be determined accurately. In particular, important points such as the dips within the first compression of the engine are not recorded. These results clearly show that the choice of the measuring instrument and the measuring method is of decisive importance, especially when measuring fast processes such as compression in an engine.

4. Discussion

A comparison of the two measuring devices, Picoscope 3204D MSO and VCDS HEX-V2, for the determination of battery voltage was carried out to identify advantages, drawbacks, significance, and limitations of the respective device for this application.
For a first step, both devices were compared on a general basis. The criteria of the comparison were the price, the sampling rate, parallel measurements, and the simplicity of the measurement. It was found that the acquisition cost of the Picoscope 3204D MSO was almost double that of the VCDS HEX-V2 which is, inter alia, due to the fact that the Picoscope 3204D MSO has a higher sampling rate of up to 1 GS/s, while the sampling rate of the VCDS HEX-V2 is limited by the CAN protocol. However, the VCDS HEX-V2 allows for unlimited parallel measurements, while the Picoscope 3204D MSO can take only two measurements at the same time. In addition, the operation of the VCDS HEX-V2 is considered easy and intuitive, while the operation of the Picoscope 3204D MSO is more demanding. This also correlates with the fifth criterion, background knowledge. As the Picoscope is technically more complex, the measurements are more accurate and versatile. However, knowledge and understanding of the technical relationships in a car are necessary to interpret the resulting data. The VCDS, on the other hand, while more accessible to non-professionals and requiring less technical understanding, is limited in its capabilities. Overall, the comparison shows that the Picoscope 3204D MSO is more suitable for complex measurements due to its higher sampling rate and its accuracy and versatility. Nevertheless, it also requires a higher technical understanding and background knowledge of the measured process.
In the next step, the start-up voltage analysis of the battery was carried out to gain information about the state of charge of the respective batteries which allows for an initial estimation of whether the energy supply of the battery is still sufficient to start the engine. Results showed that the start-up voltages measured via the VCDS were 0.2 V lower as those measured by the Picoscope. Thus, the corresponding states of charge based on the VCDS measurements were below the critical value that is necessary to start the engine. As it was no problem to start all cars tested in this study, we conclude that the determination of the start-up voltage using a Picoscope is more reliable and accurate and allows an earlier detection of possible failures based on the battery status.
Afterwards, we looked at the compression within the cranking process. As the Ohmic curve of the motor at start-up is reflected in the battery voltage curve, resolution of the battery voltage must be sufficient to identify possible anomalies. Results showed that the signal received from the oscilloscope has a high noise intensity but a better resolution, as all four voltage drops corresponding to the compression of the engine are clearly visible. In contrast, the signal received via the VCDS measurement is smooth, but besides the first large voltage drop, only two further voltage drops can be guessed until the final start of the engine. Thus, potential malfunctions of the four cylinders may not be detected when using a VCDS. Regarding the functionality of the alternator, the use of a VCDS seems to be sufficient, as the signals determined via the Picoscope do not deliver any additional information.
Finally, we looked at the resulting charging voltage of the battery through the alternator. Measurements via the Picoscope resulted in a 0.11 V lower battery voltage than the VCDS. Unfortunately, we do not know exact values of the expected battery voltages after charging. However, due to the results obtained before, we assume that the values resulting from measurements with the Picoscope are more reliable.
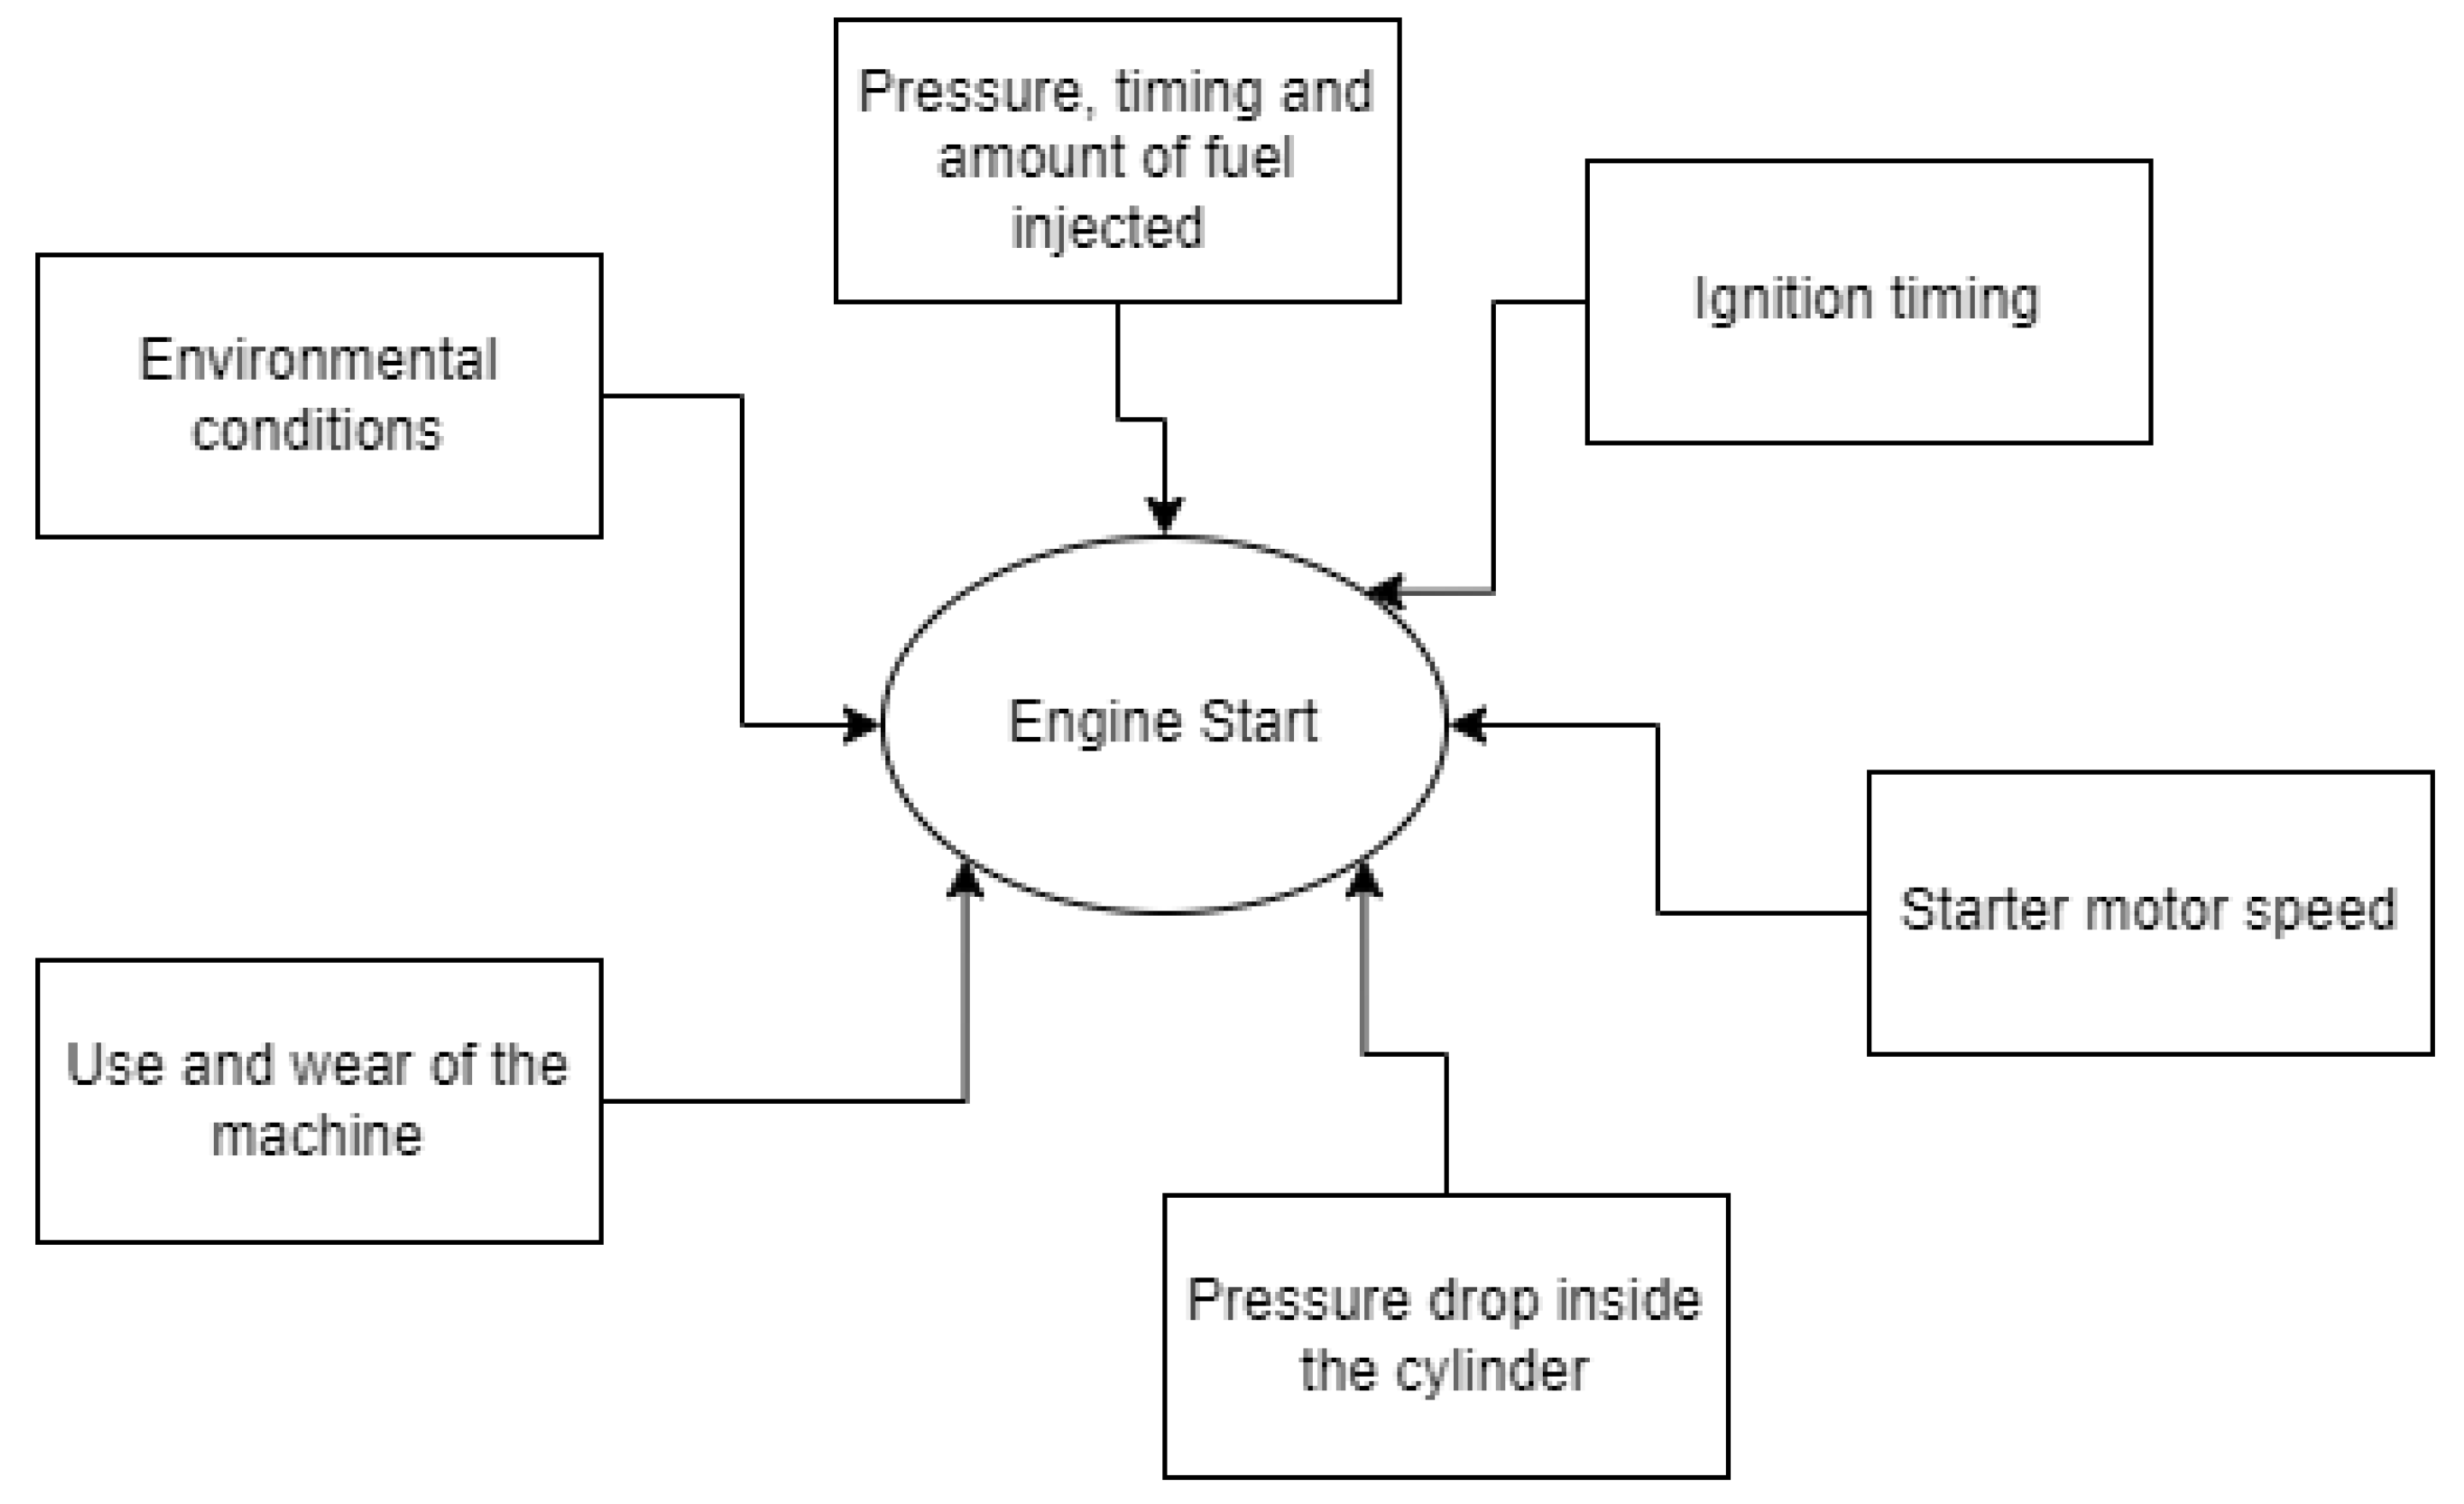
Results of our study indicate that the use of an oscilloscope is preferable to measure the battery voltage during start-up of the engine. Nevertheless, numerous influences on the cranking process, as shown in Figure 15, were not analysed within the framework of this work using the selected measurement methods. This requires further investigation to finally decide for the best detection method.
Within this work, we exemplarily simulated an error during engine start-up by removing the ignition coil. Results showed significant deviations between the measurements taken via the engine control unit and those taken directly at the battery with a Picoscope. Once again, it became apparent that the direct measurement at the battery provided significantly more accurate information than the measurement via the engine control unit. For later work, however, it is advisable to provoke further fault cases and compare them with the original condition. An interesting question here could be whether faults such as a spark plug that does not seal completely can also be detected within the voltage curve.
Nevertheless, the choice of the measurement device depends on the respective application. Therefore, we also highlighted the pros and cons of the Picoscope and the VCDS in Table 8.
Differences between the devices exist in terms of their ease of use, sampling rate, need for background knowledge, parallel measurements, price, and their ability to identify and later analyse the state of charge, charging voltages, and initial compression of the vehicle.
The Picoscope is more user-friendly than the VCDS in terms of software, but it requires more background knowledge to be fully utilised. The Picoscope has a higher sampling rate of up to 1 Gs/s, while the VCDS is limited by CAN. The Picoscope also allows parallel measurement of up to two sensors, while the VCDS allows unlimited parallel measurements.
In terms of price, the Picoscope is more expensive than the VCDS. However, the Picoscope is able to accurately identify the state of charge, the charging voltages, and the compression state of the vehicle, whereas the VCDS is inaccurate.
In the end, the choice of the measuring device depends on individual needs and available technical knowledge. The on-board diagnosis using a VCDS is less accurate due to the lower sample rate that is also reflected in the DTW analysis and the increased similarity after down-sampling. In addition, the VCDS is more error-prone compared to an oscilloscope. Several interfering factors can affect the measurement. In addition to instrument-specific errors, errors can also occur within the data transmission from the ECU to the VCDS measuring instrument itself. In summary, the applicability of diagnostics via the OBD II interface is limited by the restricted information provided by car manufacturers via on-board diagnostics. In contrast, an oscilloscope enables the measurement of the respective voltages by connecting to a variety of sensors. However, due to their compact engine designs, newer vehicle models provide fewer and fewer possibilities for direct measurements, which requires the use of special measurement sensors. The need for more affordable measuring devices is becoming more and more important. Since direct sensor measurements pose a considerable risk of damage to cables and connectors, the benefits of indirect methods such as measurements via an E-field sensor become apparent. In addition, future research should focus on the use of machine learning methods to more accurately evaluate oscilloscope measurements based on clearly detectable points. One possible classification method that can be used is the dynamic time warping method applied within this study. Based on these findings, an assistance system for the dynamic and intelligent support of employees in workshops can be developed in future work. To improve the accuracy and efficiency of diagnostic and repair processes, this system could be based on machine learning as well. It could also integrate different measurement methods, including direct and indirect measurements from sensors, to enable a more comprehensive diagnosis. In addition, the system could be tailored to the specific characteristics and needs of different vehicle models. By creating such an assistance system, the effectiveness and efficiency of workshops could be increased and customer satisfaction enhanced.

Author Contributions

Conceptualization, G.K., L.J. and D.F.N.; methodology, D.F.N.; software, D.F.N.; formal analysis, D.F.N.; data curation, D.F.N.; writing—original draft preparation, G.K., L.J. and D.F.N.; writing—review and editing, G.K. and L.J.; visualization, D.F.N.; supervision, G.K. and L.J.; project administration, G.K. and L.J.; funding acquisition, G.K. and L.J. All authors have read and agreed to the published version of the manuscript.

Funding

This research was funded by the German Federal Ministry for Economic Affairs and Climate Action (BMWK), grant number 68GX21005F.

Data Availability Statement

Data generated and models used in this work are published at https://gitlab.thga.de/PROLAB/paper_battery_voltage_analysis_ecuxosci (accessed on 24 April 2023).

Conflicts of Interest

The authors declare no conflict of interest.

References

  1. Heyes, A.M. Automotive Component Failures. Eng. Fail. Anal. 1998, 5, 129–141. [Google Scholar] [CrossRef]
  2. Ramirez, J.D.; Romero, C.A.; Mejia, J.C.; Quintero, H.F. A methodology for non-invasive diagnosis of diesel engines through characteristics of starter system performance. Diagnostyka 2022, 23, 2022202. [Google Scholar] [CrossRef]
  3. Grube, R.J. Automotive Battery State-of-Health Monitoring Methods. Master’s Thesis, Wright State University, Dayton, OH, USA, 1998. [Google Scholar]
  4. Ramai, C.; Ramnarine, V.; Ramharack, S.; Bahadoorsingh, S.; Sharma, C. Framework for Building Low-Cost OBD-II Data-Logging Systems for Battery Electric Vehicles. Vehicles 2022, 4, 1209–1222. [Google Scholar] [CrossRef]
  5. Kerley, R.; Hyun, J.H.; Ha, D.S. Automotive Lead-Acid Battery State-of-Health Monitoring System. In Proceedings of the IECON 2015—41st Annual Conference of the IEEE Industrial Electronics Society, Yokohama, Japan, 9–12 November 2015; Institute of Electrical and Electronics Engineers Inc.: Piscataway, NJ, USA, 2015; pp. 3934–3938. [Google Scholar]
  6. Cugnet, M.; Sabatier, J.; Laruelle, S.; Grugeon, S.; Sahut, B.; Oustaloup, A.; Tarascon, J.M. On Lead-Acid-Battery Resistance and Cranking-Capability Estimation. IEEE Trans. Ind. Electron. 2010, 57, 909–917. [Google Scholar] [CrossRef]
  7. Zau, A.T.P.; Lencwe, M.J.; Chowdhury, S.P.D.; Olwal, T.O. A Battery Management Strategy in a Lead-Acid and Lithium-Ion Hybrid Battery Energy Storage System for Conventional Transport Vehicles. Energies 2022, 15, 2577. [Google Scholar] [CrossRef]
  8. Noh, T.W.; Ahn, J.H.; Lee, B.K. Cranking Capability Estimation Algorithm Based on Modeling and Online Update of Model Parameters for Li-Ion SLI Batteries. Energies 2019, 12, 3365. [Google Scholar] [CrossRef]
  9. Hergenhan, A.; Heiser, G. Operating Systems Technology for Converged ECUs; ISITS: Hamburg, Germany, 2008. [Google Scholar]
  10. ISO 11898-1:2015; Road Vehicles—Controller Area Network (CAN)—Part 1: Data Link Layer and Physical Signalling. International Organization for Standardization: Geneva, Switzerland, 2015. Available online: https://www.iso.org/standard/63648.html (accessed on 17 February 2023).
  11. Reif, K. Automobilelektronik Eine Einführung Für Ingenieure; Springer: Berlin/Heidelberg, Germany, 2012; ISBN 9783834814982. [Google Scholar]
  12. J2012_201303; Diagnostic Trouble Code Definitions. SAE International: Warrendale, PA, USA, 2013. Available online: https://www.sae.org/standards/content/j2012_201303/ (accessed on 17 February 2023).
  13. Reif, K. Bosch Autoelektrik Und Autoelektronik; Springer: Berlin/Heidelberg, Germany, 2011. [Google Scholar]
  14. Piller, S.; Perrin, M.; Jossen, A. Methods for State-of-Charge Determination and Their Applications. J. Power Sources 2001, 96, 113–120. [Google Scholar] [CrossRef]
  15. 8-4 Dynamic Time Warping. Available online: http://mirlab.org/jang/books/dcpr/dpDtw.asp?title=8-4%20Dynamic%20Time%20Warping (accessed on 17 February 2023).
  16. Pischinger, S.; Seiff, U.; Auflage, H. Vieweg Handbuch Kraftfahrzeugtechnik; Springer: Berlin/Heidelberg, Germany, 2012. [Google Scholar]
Figure 1. Distribution of component failures in automotive vehicles. The pie chart shows the percentage portion of failures of the different components: Engine (41%), Drivetrain (26%), Suspension (13%), Steering (7%), Chassis/Body (7%), Braking System (3%), Hydraulics (3%). Data were taken from: [1].
Vehicles 05 00035 g001
Figure 2. Exemplary battery voltage curve of a combustion engine, divided into the respective time ranges. Y-axis: Battery voltage, X-axis: Number of samples.
Vehicles 05 00035 g002
Figure 3. Schematic depiction of a starter. 1: Ignition switch, 2: Engagement relays, 3: Return spring, 4: Permanent magnet, 5: Engagement lever, 6: Roller free-wheel, 7: Pinion, 8: Car battery, 9: Anchor. Figure adapted from: [13].
Vehicles 05 00035 g003
Figure 4. Comparison of the battery voltage curves from Picoscope (A) and VCDS (B).
Vehicles 05 00035 g004
Figure 5. Exemplary representation of the normalised graphs for the battery voltage of eight different signals. Each colored line represents one measurement.
Vehicles 05 00035 g005
Figure 6. Normalized data of battery voltage from the Picoscope (A) and VCDS (B).
Vehicles 05 00035 g006
Figure 7. Normalized data of the battery voltage measured by the Picoscope (A) and the VCDS (B). Only the time interval of the first compression is shown. Each color represents one measurement of the different cars.
Vehicles 05 00035 g007
Figure 8. Offset of the graphs of Picoscope (top) and VCDS (bottom), which was determined by DTW. The signals of the raw data for Sample Five are shown.
Vehicles 05 00035 g008
Figure 9. Offset of the graphs of the Picoscope (top) and VCDS (bottom), which was determined by DTW. The signals of the down-sampled data for Sample Five are shown. Blue represents the voltage signal of both detection methods and the yellow lines show the connectors based on the warping path.
Vehicles 05 00035 g009
Figure 10. DTW cost function path. The cost function for the determined down-sampled graphs of the Picoscope (left) and VCDS (above) for Sample Five is shown.
Vehicles 05 00035 g010
Figure 11. Automotive system consisting of multiple components and sensors. 1: Hot film, 2: Throttle device, 3: Spark plug, 4: Ignition coil, 5: Fuel distributor, 6: ECU, 7: Fuel tank, 8: Fuel pump, Figure adapted from [16].
Vehicles 05 00035 g011
Figure 12. Picoscope signal measured directly at the battery. Comparison between the original state of the engine (blue) and a measurement with a removed ignition coil (green).
Vehicles 05 00035 g012
Figure 13. VCDS measured battery voltage via the ECU. Comparison between the original state of the engine and a measurement without an ignition coil.
Vehicles 05 00035 g013
Figure 14. Battery voltages during engine start-up without ignition coil measured via Picoscope (A) or using a VCDS (B).
Vehicles 05 00035 g014
Figure 15. Factors influencing the starting process of a car. Figure adapted from: [2].
Vehicles 05 00035 g015
Table 1. Data transfer rate for the CAN Classes A, B, C.
CAN Class ACAN Class BCAN Class C
Data transfer rate<10 kBit/s<125 kBit/s<1 Mbit/s
Table 2. Battery voltages in relation to its state of charge [14].
Battery Voltage [V]State of Charge [%]
>12.65100
12.6090
12.5080
12.4070
12.3060
12.2050
12.1040
11.9030
11.8020
11.500–10
Table 3. Comparison of the devices used based on the criteria: price, sampling rate, parallel measurements, usage, and background knowledge.
Picoscope 3204D MSOVCDS HEX-V2
PriceEUR 1000 (https://de.farnell.com/pico-technology/picoscope-3204d-mso/oszilloskop-18-kan-le-60mhz-2/dp/2432908, accessed on 2 February 2023)EUR 584 (https://car-diagnostics.eu/shop/diagnoseadapter/vcds/19/vcds-mit-hex-v2-im-set?number=ccd10002.2, accessed on 2 February 2023)
Sampling rateup to 1 GS/slimited by CAN
Parallel measurements2unlimited
Usagecomplexeasy
Background knowledgeyesnot necessary
Table 4. Comparison between the battery voltage measurements at battery rest between the Picoscope and VCDS.
SampleVoltage PicoscopeState of Charge PicoscopeVoltage VCDSState of Charge VCDSDifferences
111.86~30%11.92~30%−0.06
212.42~70%13.47>100%−1.05
312.42~70%11.76~20%0.66
412.42~70%11.94~30%0.48
512.42~70%11.94~30%0.48
612.14~40%11.72~15%0.42
712.14~40%11.7~15%0.44
812.04~35%11.78~20%0.26
Table 5. Comparison of charging voltages measured by the Picoscope and VCDS.
SampleVoltage PicoscopeVoltage VCDSDifferences
113.5314.18−0.65
213.7914.015−0.22
314.2714.140.13
414.0814.14−0.06
514.0814.00.08
613.9113.920.01
713.9114.02−0.11
813.8014.010.21
Table 6. Comparison of voltage and time range for the respective dips of the original and manipulated samples measured with a Picoscope.
LabelDipVoltage Picoscope∆ Time [s]
Original18.500
Original29.750.176
Original310.400.124
Original410.550.09
Manipulated17.40
Manipulated29.30.32
Manipulated39.70.16
Table 7. Comparison of voltage and time range for the respective dips of the original and manipulated samples using VCDS.
LabelDipVoltage VCDS∆ Time [s]
Original19.0570
Original210.2130.35
Manipulated19.450
Manipulated29.30.66
Table 8. Comparison of features and specifications between the Picoscope and VCDS diagnostic tools for automotive use.
PicoscopeVCDS
Usability of softwareEasyComplex
Usability of deviceComplexVery Easy
Sampling rateUp to 1 Gs/sLimited by CAN
Need of background knowledgeYesNo
Parallel measurements2Unlimited
PriceEUR 1000EUR 584
State of chargeAccurateInaccurate
Charging voltagesAccurateInaccurate
Compression stateYesNo
Disclaimer/Publisher’s Note: The statements, opinions and data contained in all publications are solely those of the individual author(s) and contributor(s) and not of MDPI and/or the editor(s). MDPI and/or the editor(s) disclaim responsibility for any injury to people or property resulting from any ideas, methods, instructions or products referred to in the content.

