Article

Noise Reduction of Two-Speed Automatic Transmission for Pure Electric Vehicles

1
Beijing Engineering Research Center of Precision Measurement Technology and Instruments, Beijing University of Technology, No. 100, Pingleyuan, Chaoyang District, Beijing 100124, China
2
Department of Automotive Engineering, School of Transportation Science and Engineering, Beihang University, Beijing 100191, China
*
Author to whom correspondence should be addressed.
Vehicles 2023, 5(1), 248-265; https://doi.org/10.3390/vehicles5010014
Submission received: 27 December 2022 / Revised: 28 January 2023 / Accepted: 30 January 2023 / Published: 10 February 2023

Abstract

:
At present, the noise of pure electric vehicles is a research hotspot, especially the noise of automatic transmission. In order to reduce the noise problem in the test, this paper proposes a method to optimize the local structure of the gearbox housing. First, the noise is evaluated and analyzed by combining subjective and objective methods, and the subjective score and noise order information are obtained. Then the factors that have great influence on the transmission error are explored, and the gearbox housing is finally determined as the optimization objective. Through finite element analysis, the weak position of the gearbox housing can be located quickly and accurately, and then the static and dynamic stiffness of the housing can be improved by adding and changing stiffeners. The simulation results show that the performance of the optimized housing is significantly improved. After the noise test of the whole vehicle, the noise of the two-speed automatic transmission is significantly reduced, and the subjective evaluation results are good.

1. Introduction

The powertrain composed of motor and gearbox in electric vehicles is being developed in the direction of miniaturization and integration. The powertrain with two-speed automatic transmission has become a research hotspot due to its better power and economy. The noise level of the motor is constantly decreasing and the influence of motor noise is weakened. In addition, due to the good acceleration performance of the motor, the transmission input has a large torque impact, which causes the transmission in the assembly to become the main source of noise. Therefore, it is of great significance to analyze the causes for vibration and noise of automatic transmission in electric vehicles and carry out vibration reduction and noise reduction [1,2,3,4]. Noise, vibration, and harshness (NVH) of vehicle transmission has been extensively explored. Guan studied the subjective and objective evaluation methods of NVH of dual-clutch automatic transmission in passenger cars and improved the NVH level of vehicles through data analysis and failure mode and effects analysis (FMEA) [5]. Yang et al. found that the howling problem of manual transmission (MT) was caused by the unbalanced load of gear meshing and could be partly solved by modifying and optimizing gears [6]. Chen analyzed the noise problem from the perspective of the transmission path, compared the acceleration responses of the mounting end and the gearbox housing, found that the resonance was amplified by the mounting end, and finally reduced the vibration and noise by modifying the design of the mounting [7]. Dong explored the influences of gearbox housing mode and gear meshing frequency on the peak power spectrum of the vibration noise signal and reduced the noise level by optimizing the gearbox housing [8]. Kou et al. determined the working conditions and the order of howling noise through vehicle tests and then weakened the howling noise to a certain degree by modifying gears and improving the rigidity of the gearbox bearing position [9]. In order to reduce the howling noise of the transmission at high speed, Tong et al. reduced the transmission error by means of a micro-modification of gears and added reinforcing ribs to the gearbox and then confirmed the significant optimization effect through platform tests and vehicle tests [10]. Tosun et al. determined the structure with the largest contribution to noise based on the methods of transmission path analysis (TPA) and exogenous operation path analysis (OPAX) and then optimized the structure [11]. Focusing on the vibration and noise problems of pure electric vehicles, Deng et al. found that the radiation noise data obtained by acoustic boundary element analysis and other simulation means were consistent with the actual test noise and provided the basis for exploring the noise source by adjusting the parameters of the simulation model [12]. Zang et al. established the dynamic model of the transmission system, studied the relationship between the vibration data of the gearbox housing surface and the dynamic structural response of the gearbox housing by means of modal superposition, and proved the effectiveness of the simulation model by comparing the results of simulation and bench tests [13]. Curtis et al. optimized micro-geometric parameters of gears with a genetic algorithm in order to reduce transmission errors and transmission noise [14]. Singh et al. studied the noise level of specific gears based on micro-geometric parameters (involute slope and wire slope) and reduced the noise of gear gearbox by improving the stress distribution of the tooth surface [15].
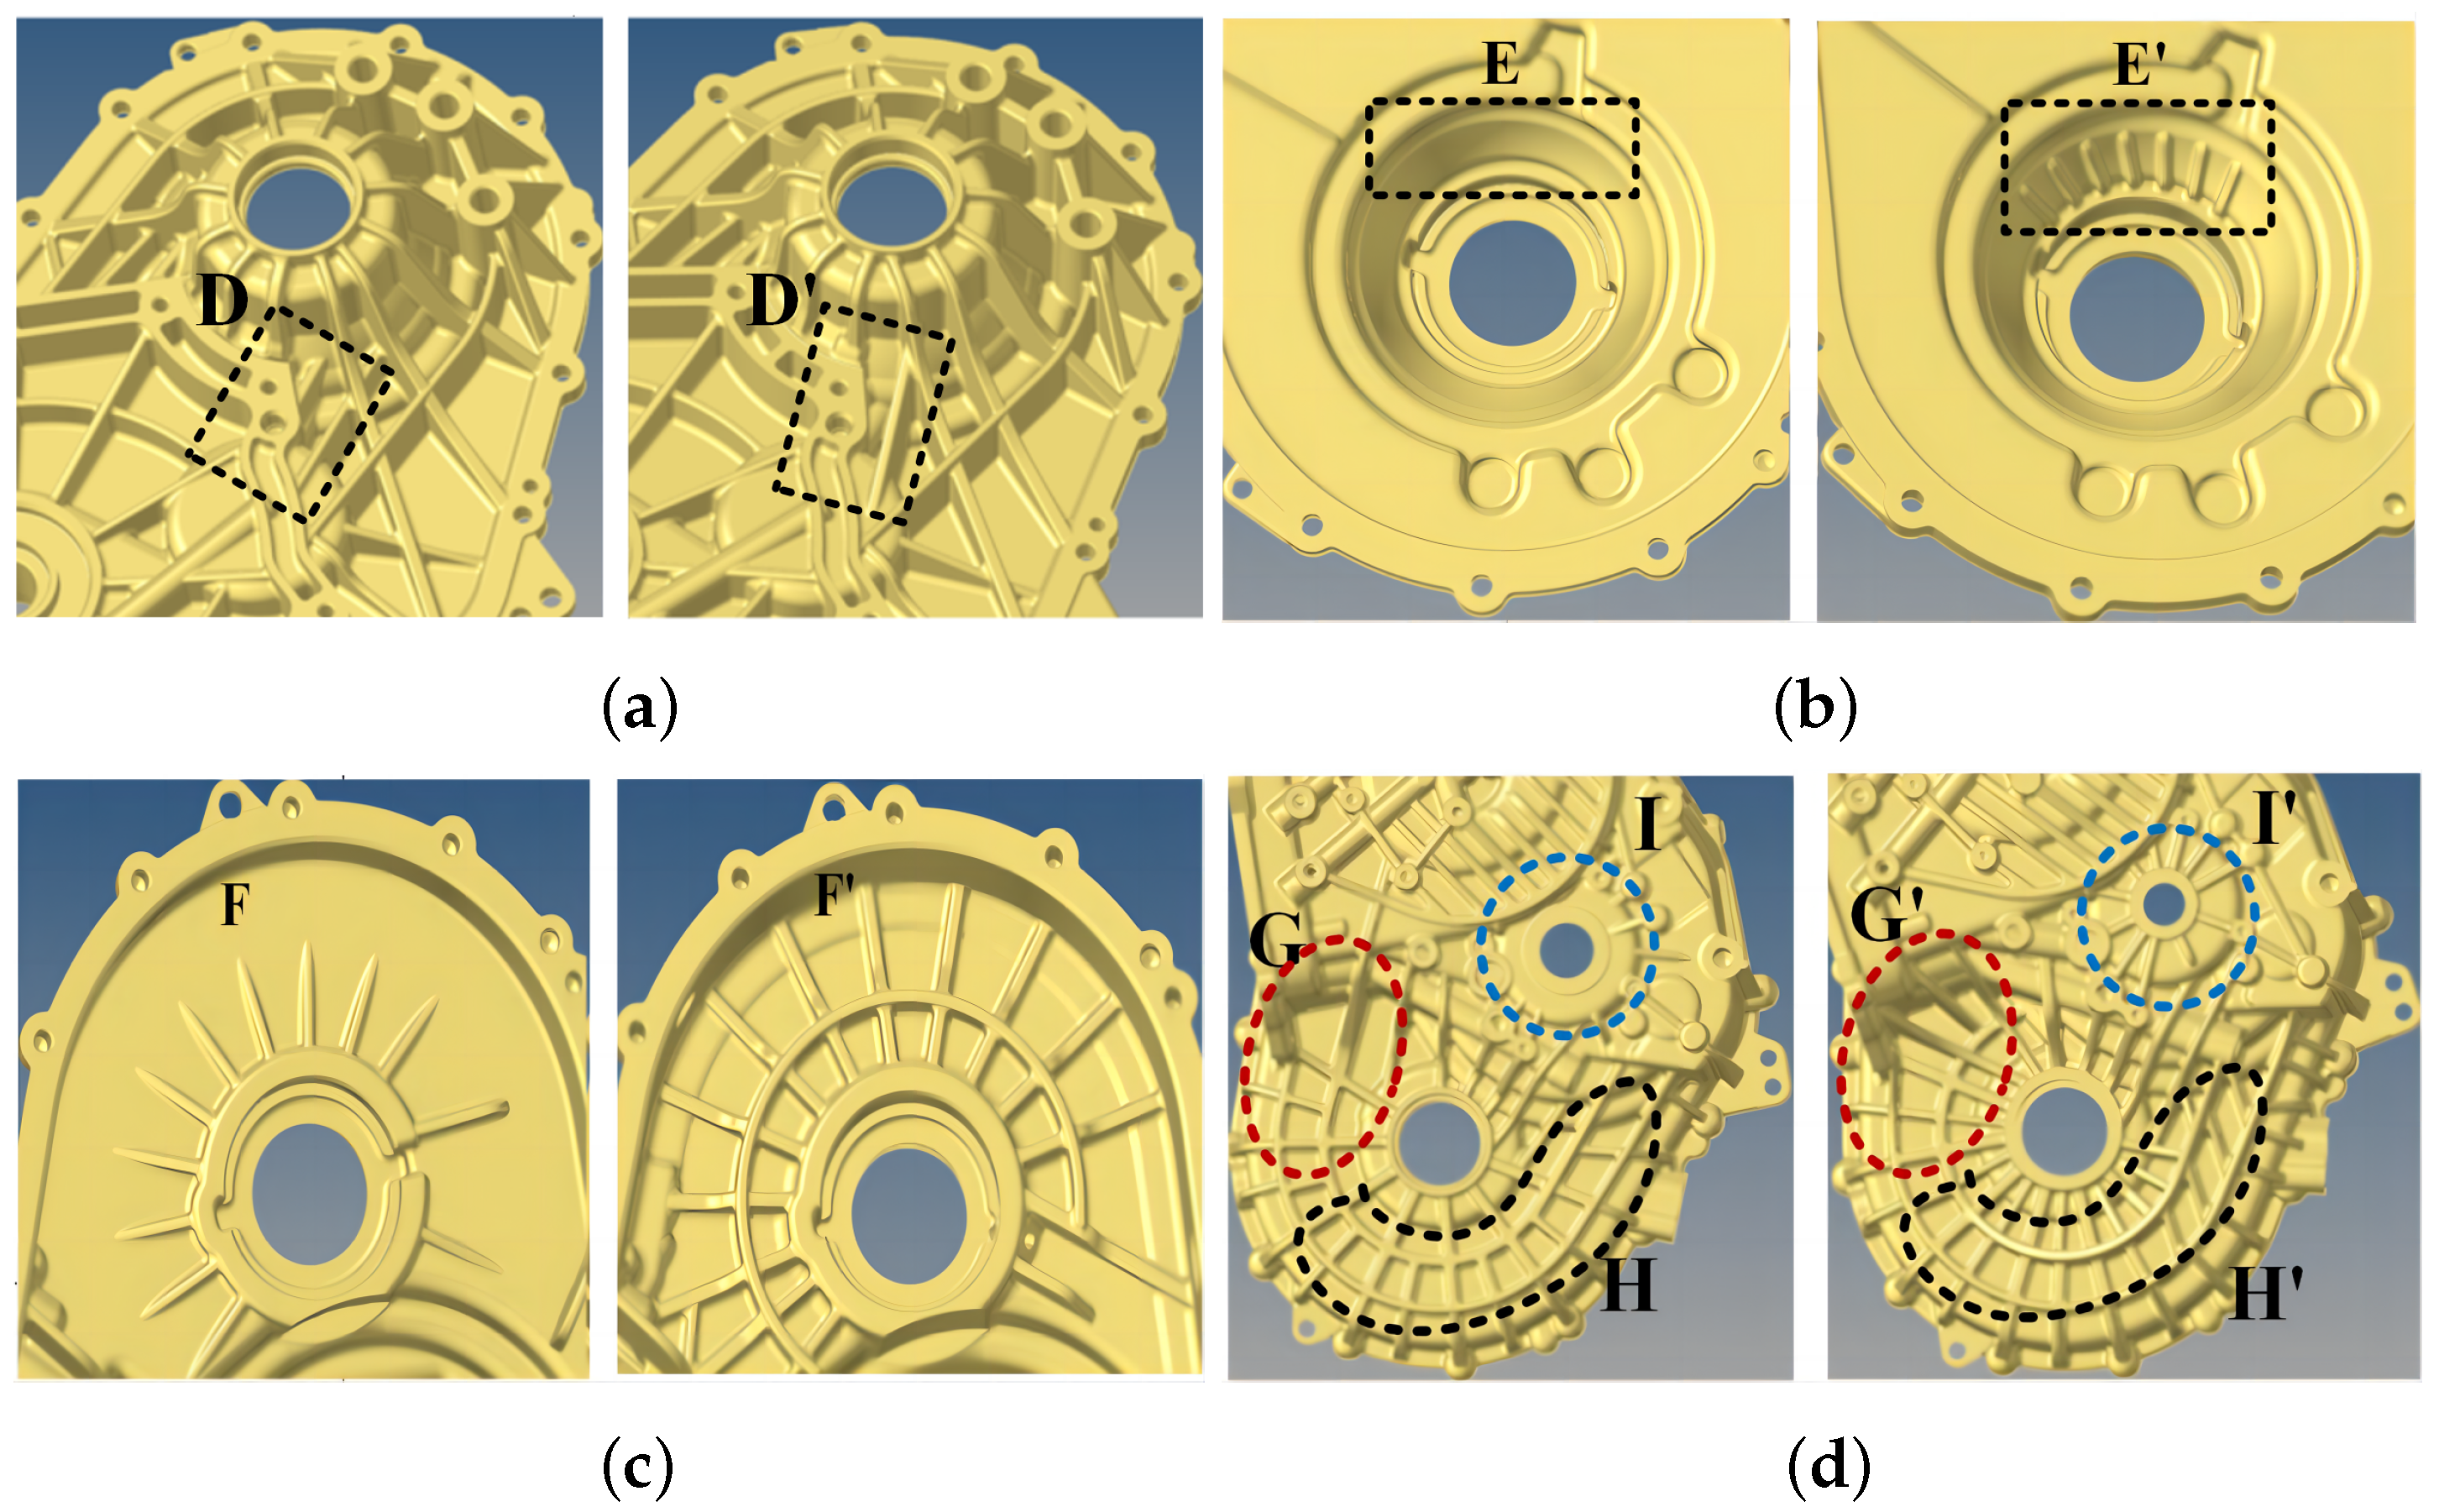
Regardless of traditional fuel vehicles or pure electric vehicles, at present, transmission noise reduction has been explored by optimizing the macro- and micro-parameters of the gears. From the perspective of the transmission path of noise, the natural frequencies of specific structural components were optimized to avoid resonance. However, the gear meshing state and sound radiation of the transmission are greatly influenced by the gearbox housing, but noise reduction based on gearbox housing optimization is seldom explored. Therefore, it is necessary to explore the vibration and noise reduction of the transmission through optimizing the gearbox housing [16,17,18].
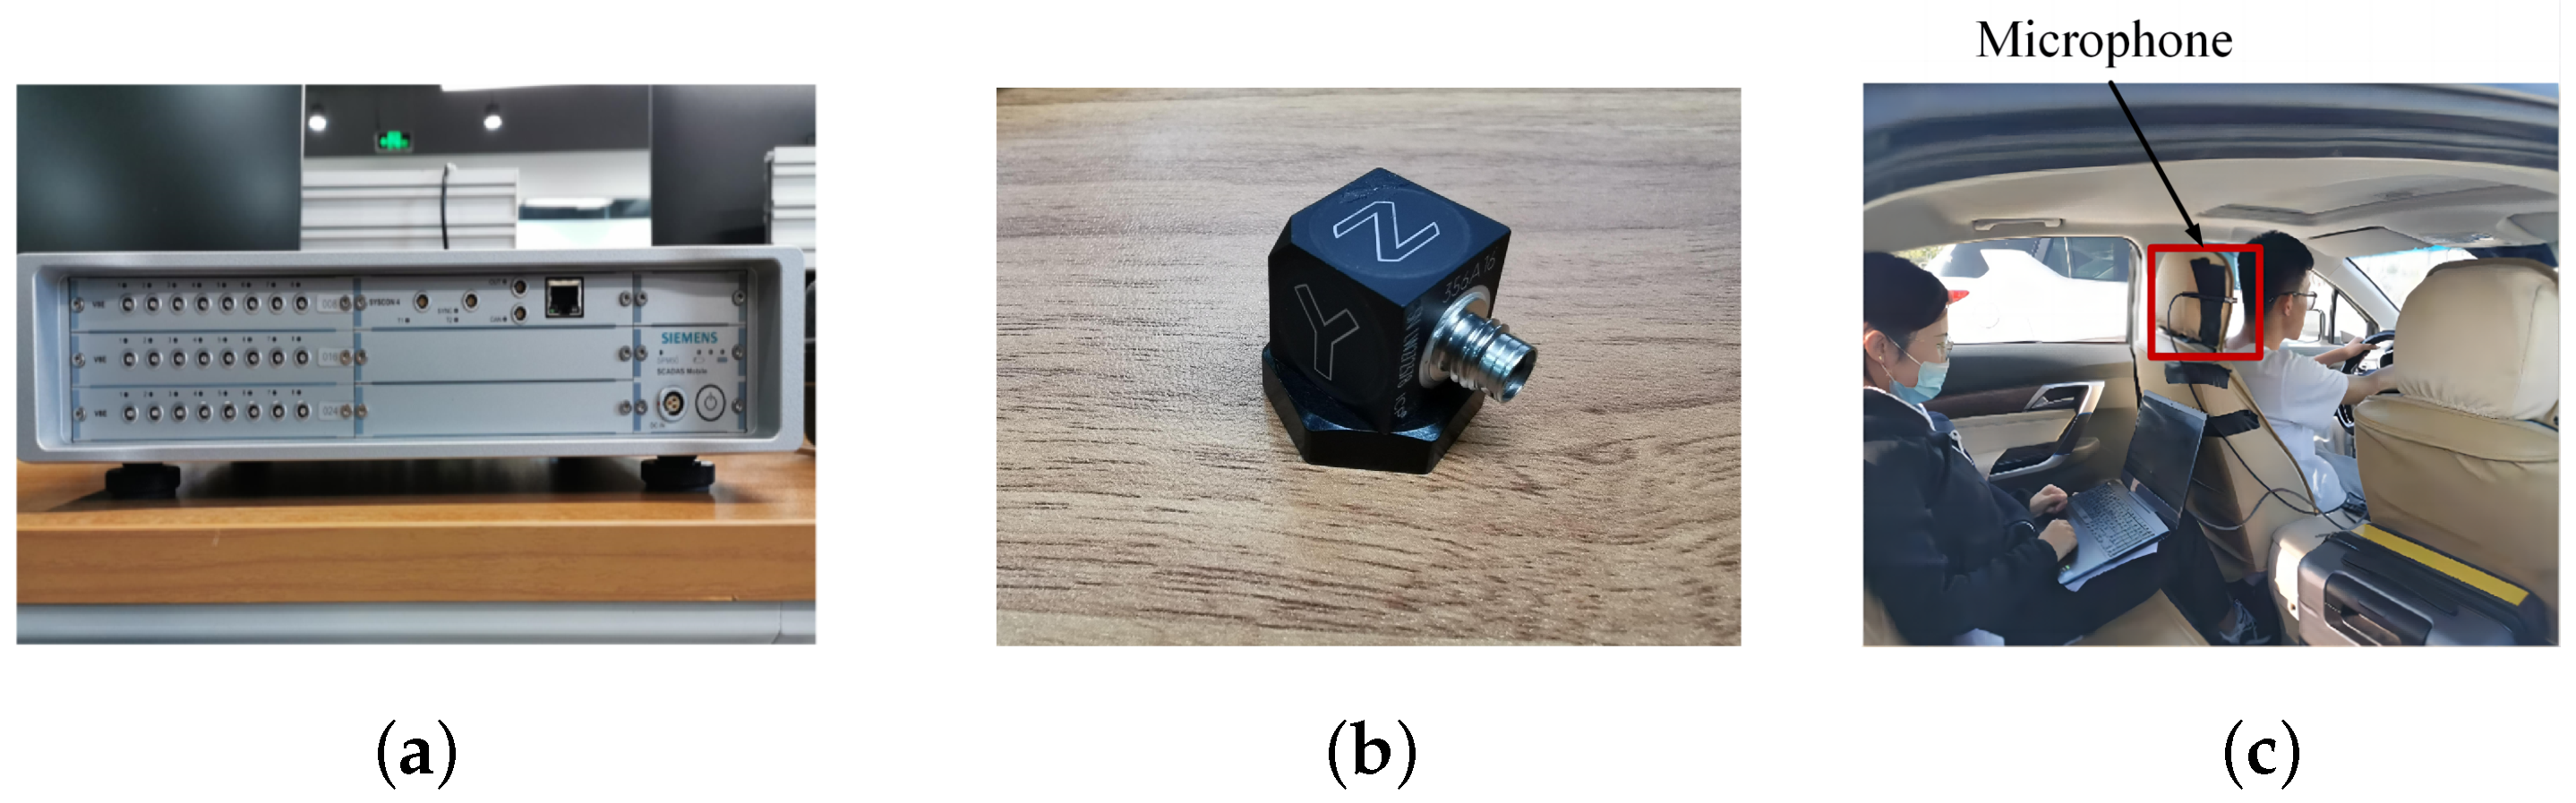
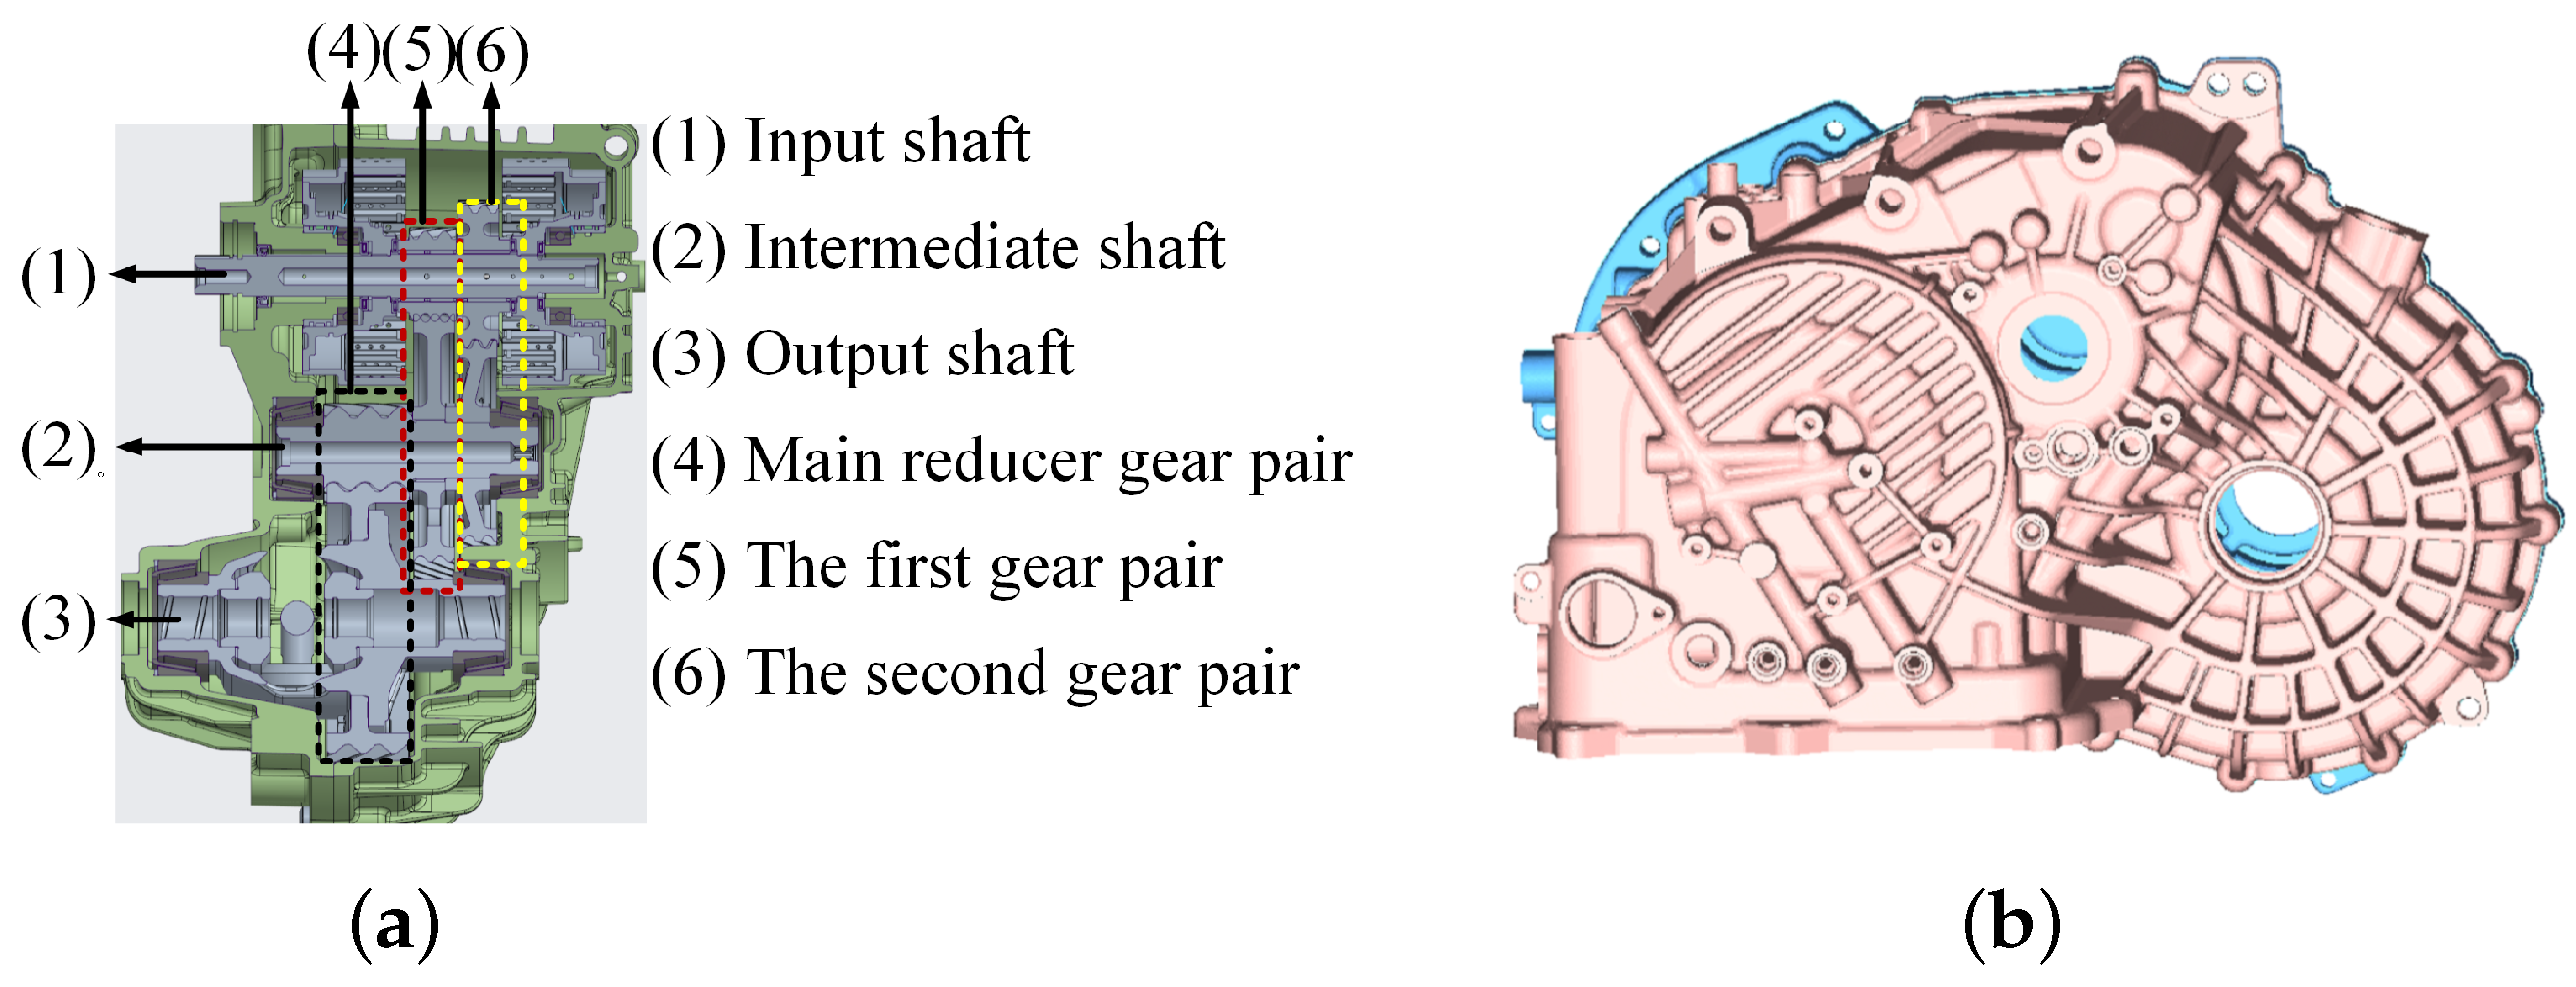
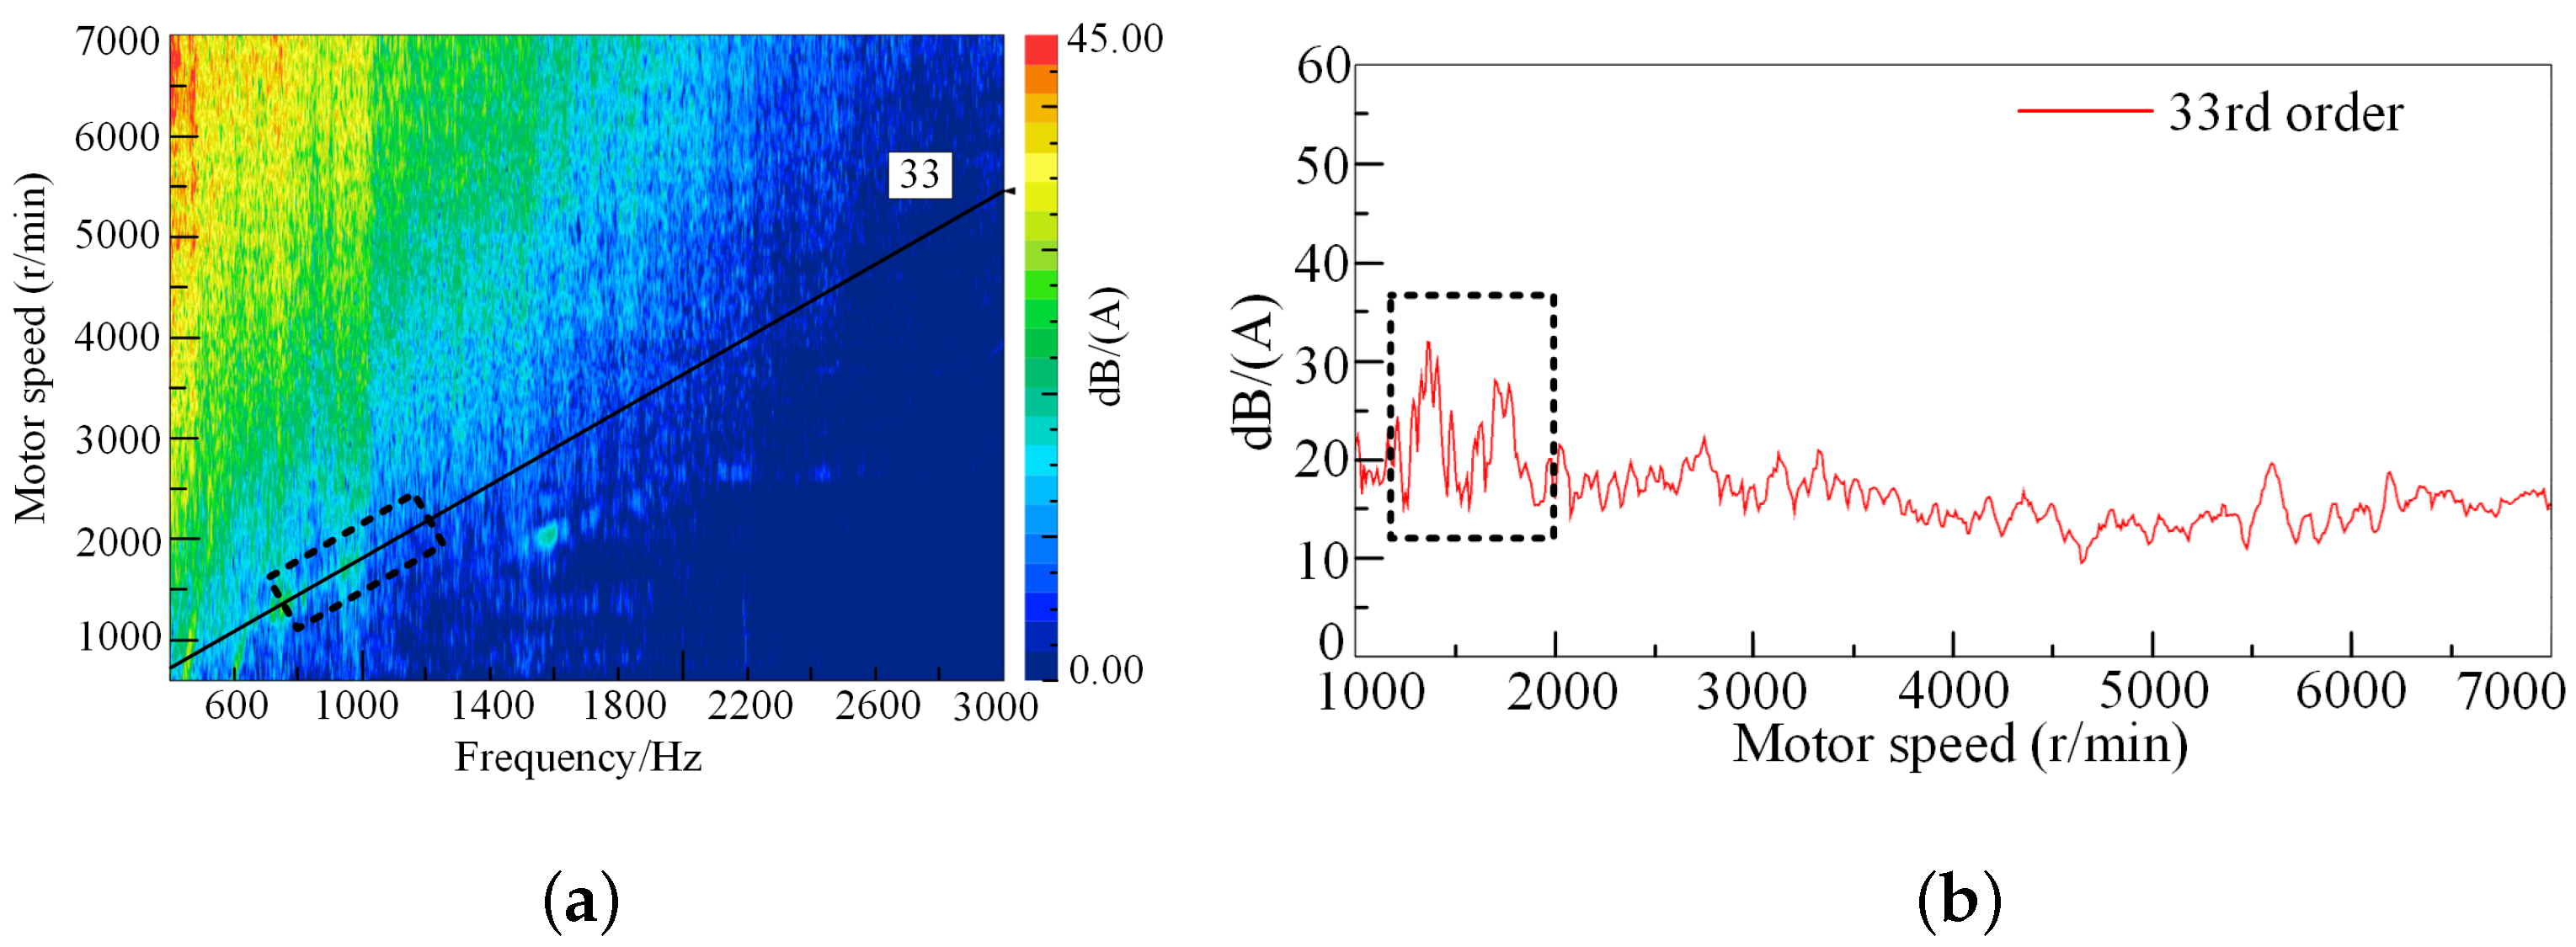
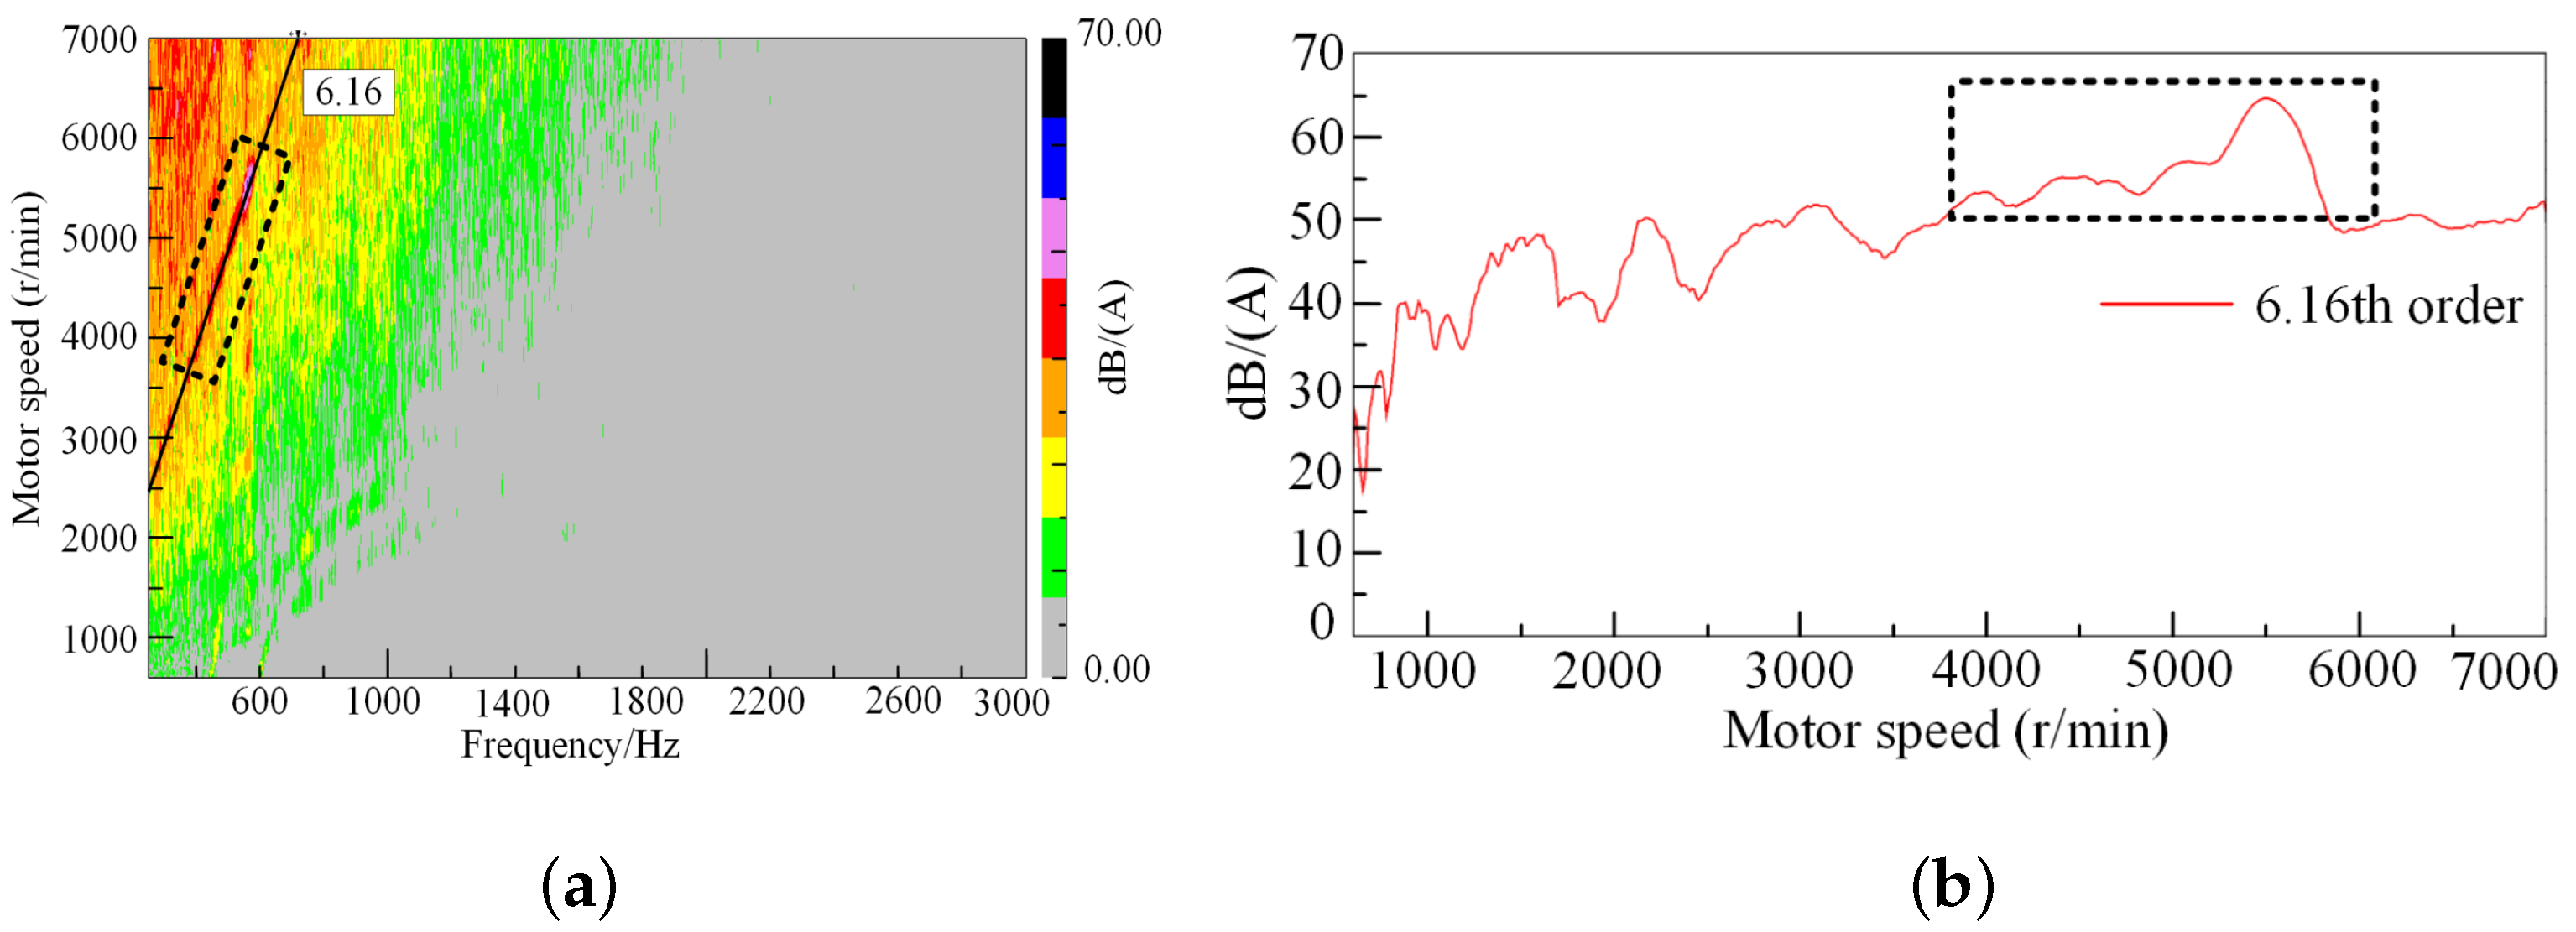
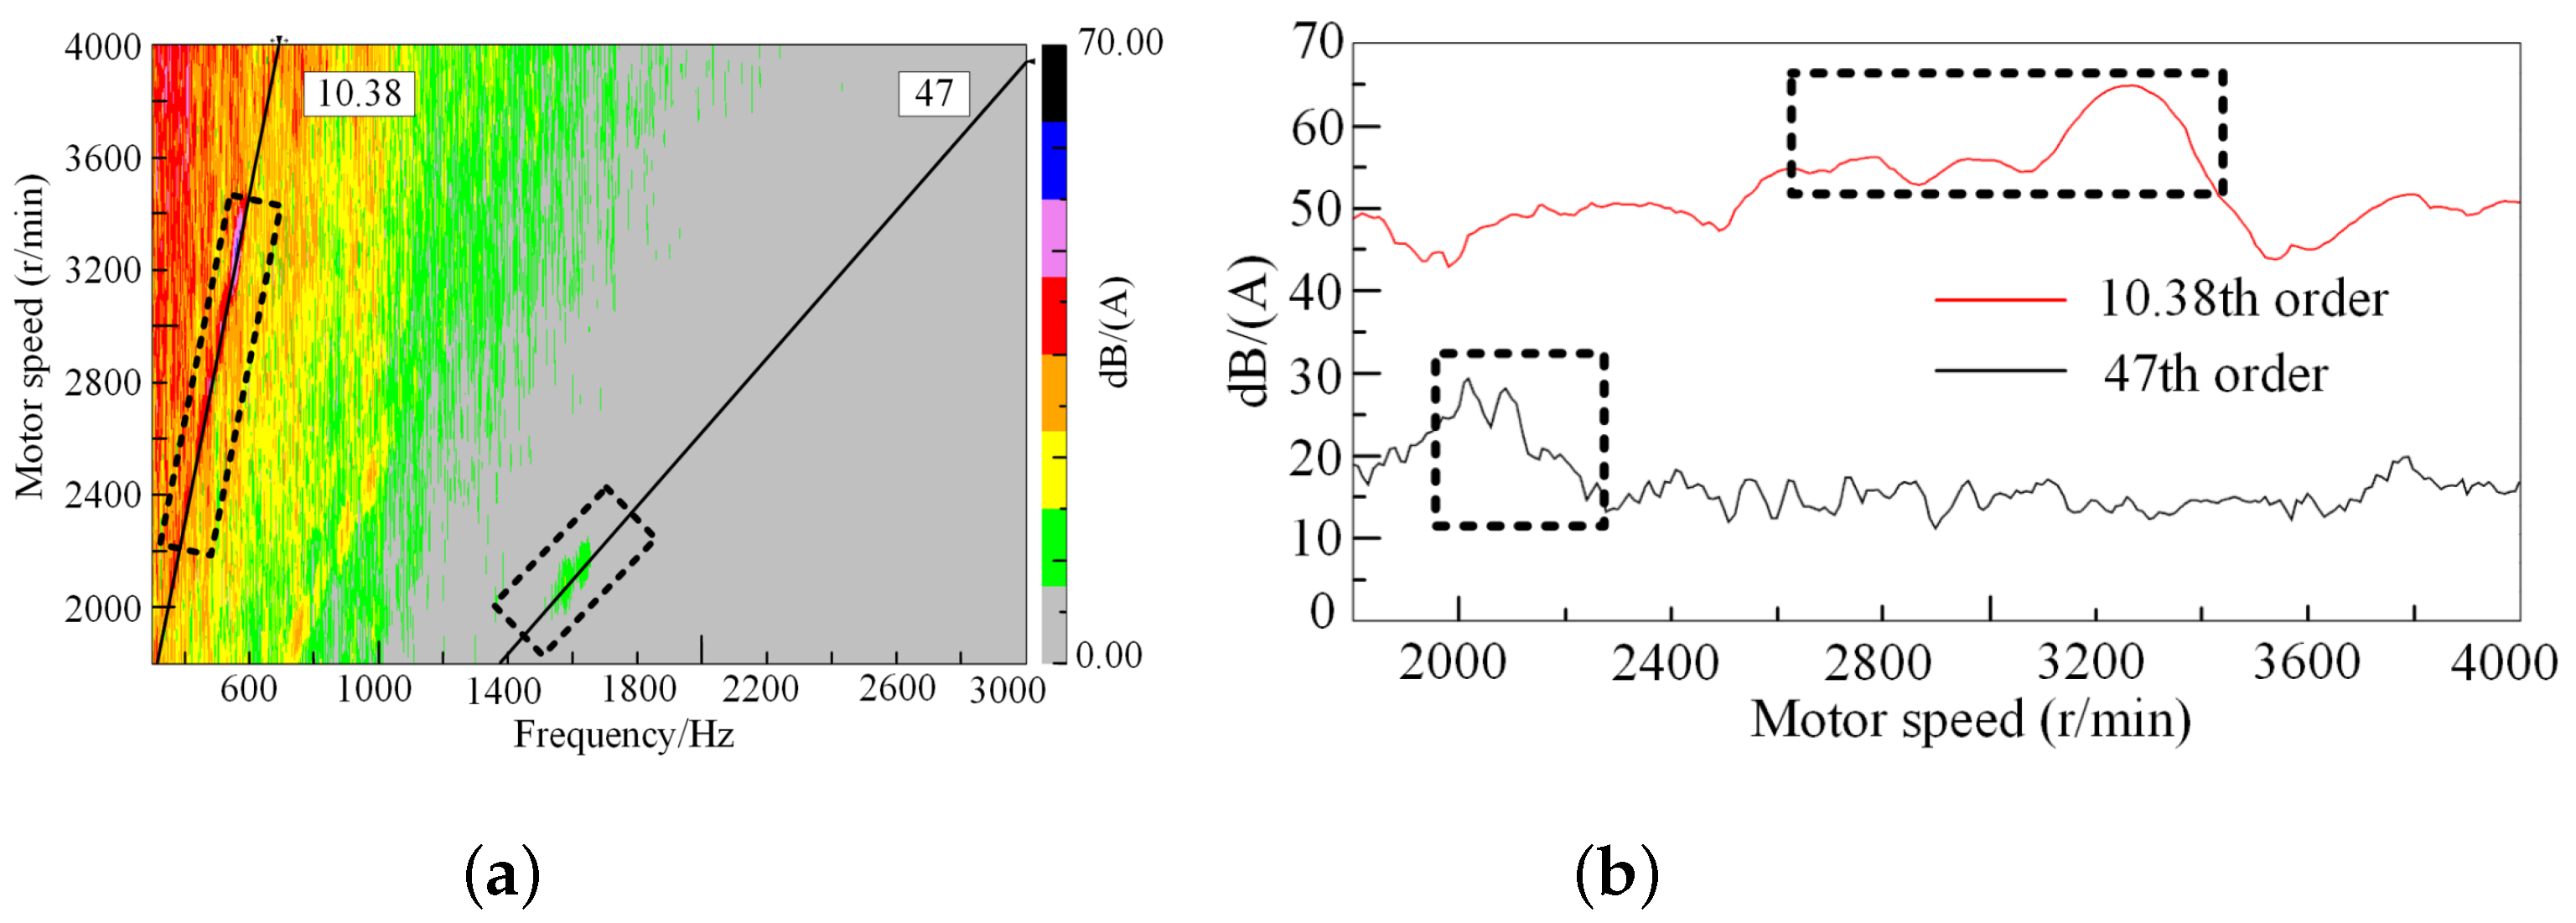
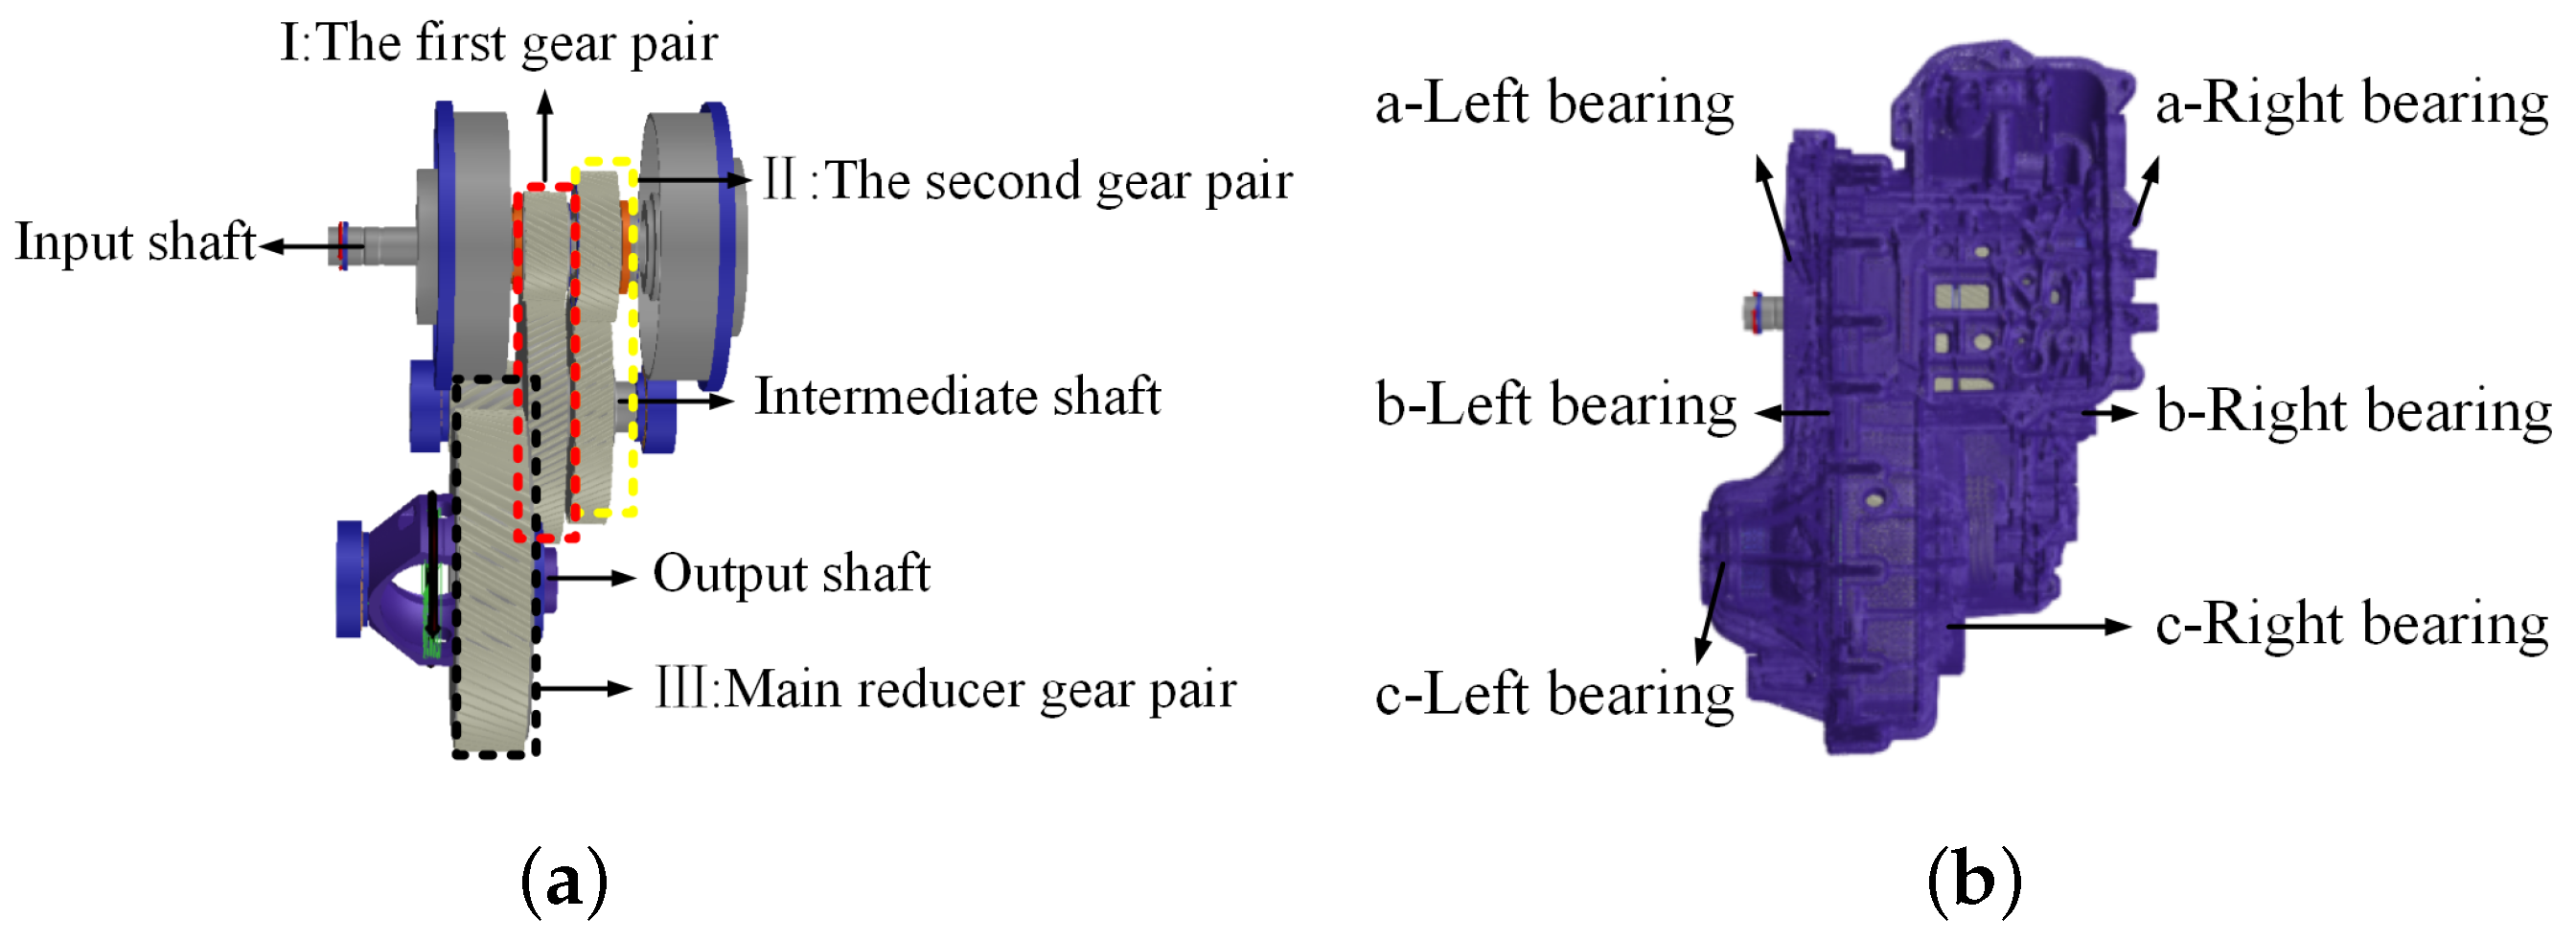
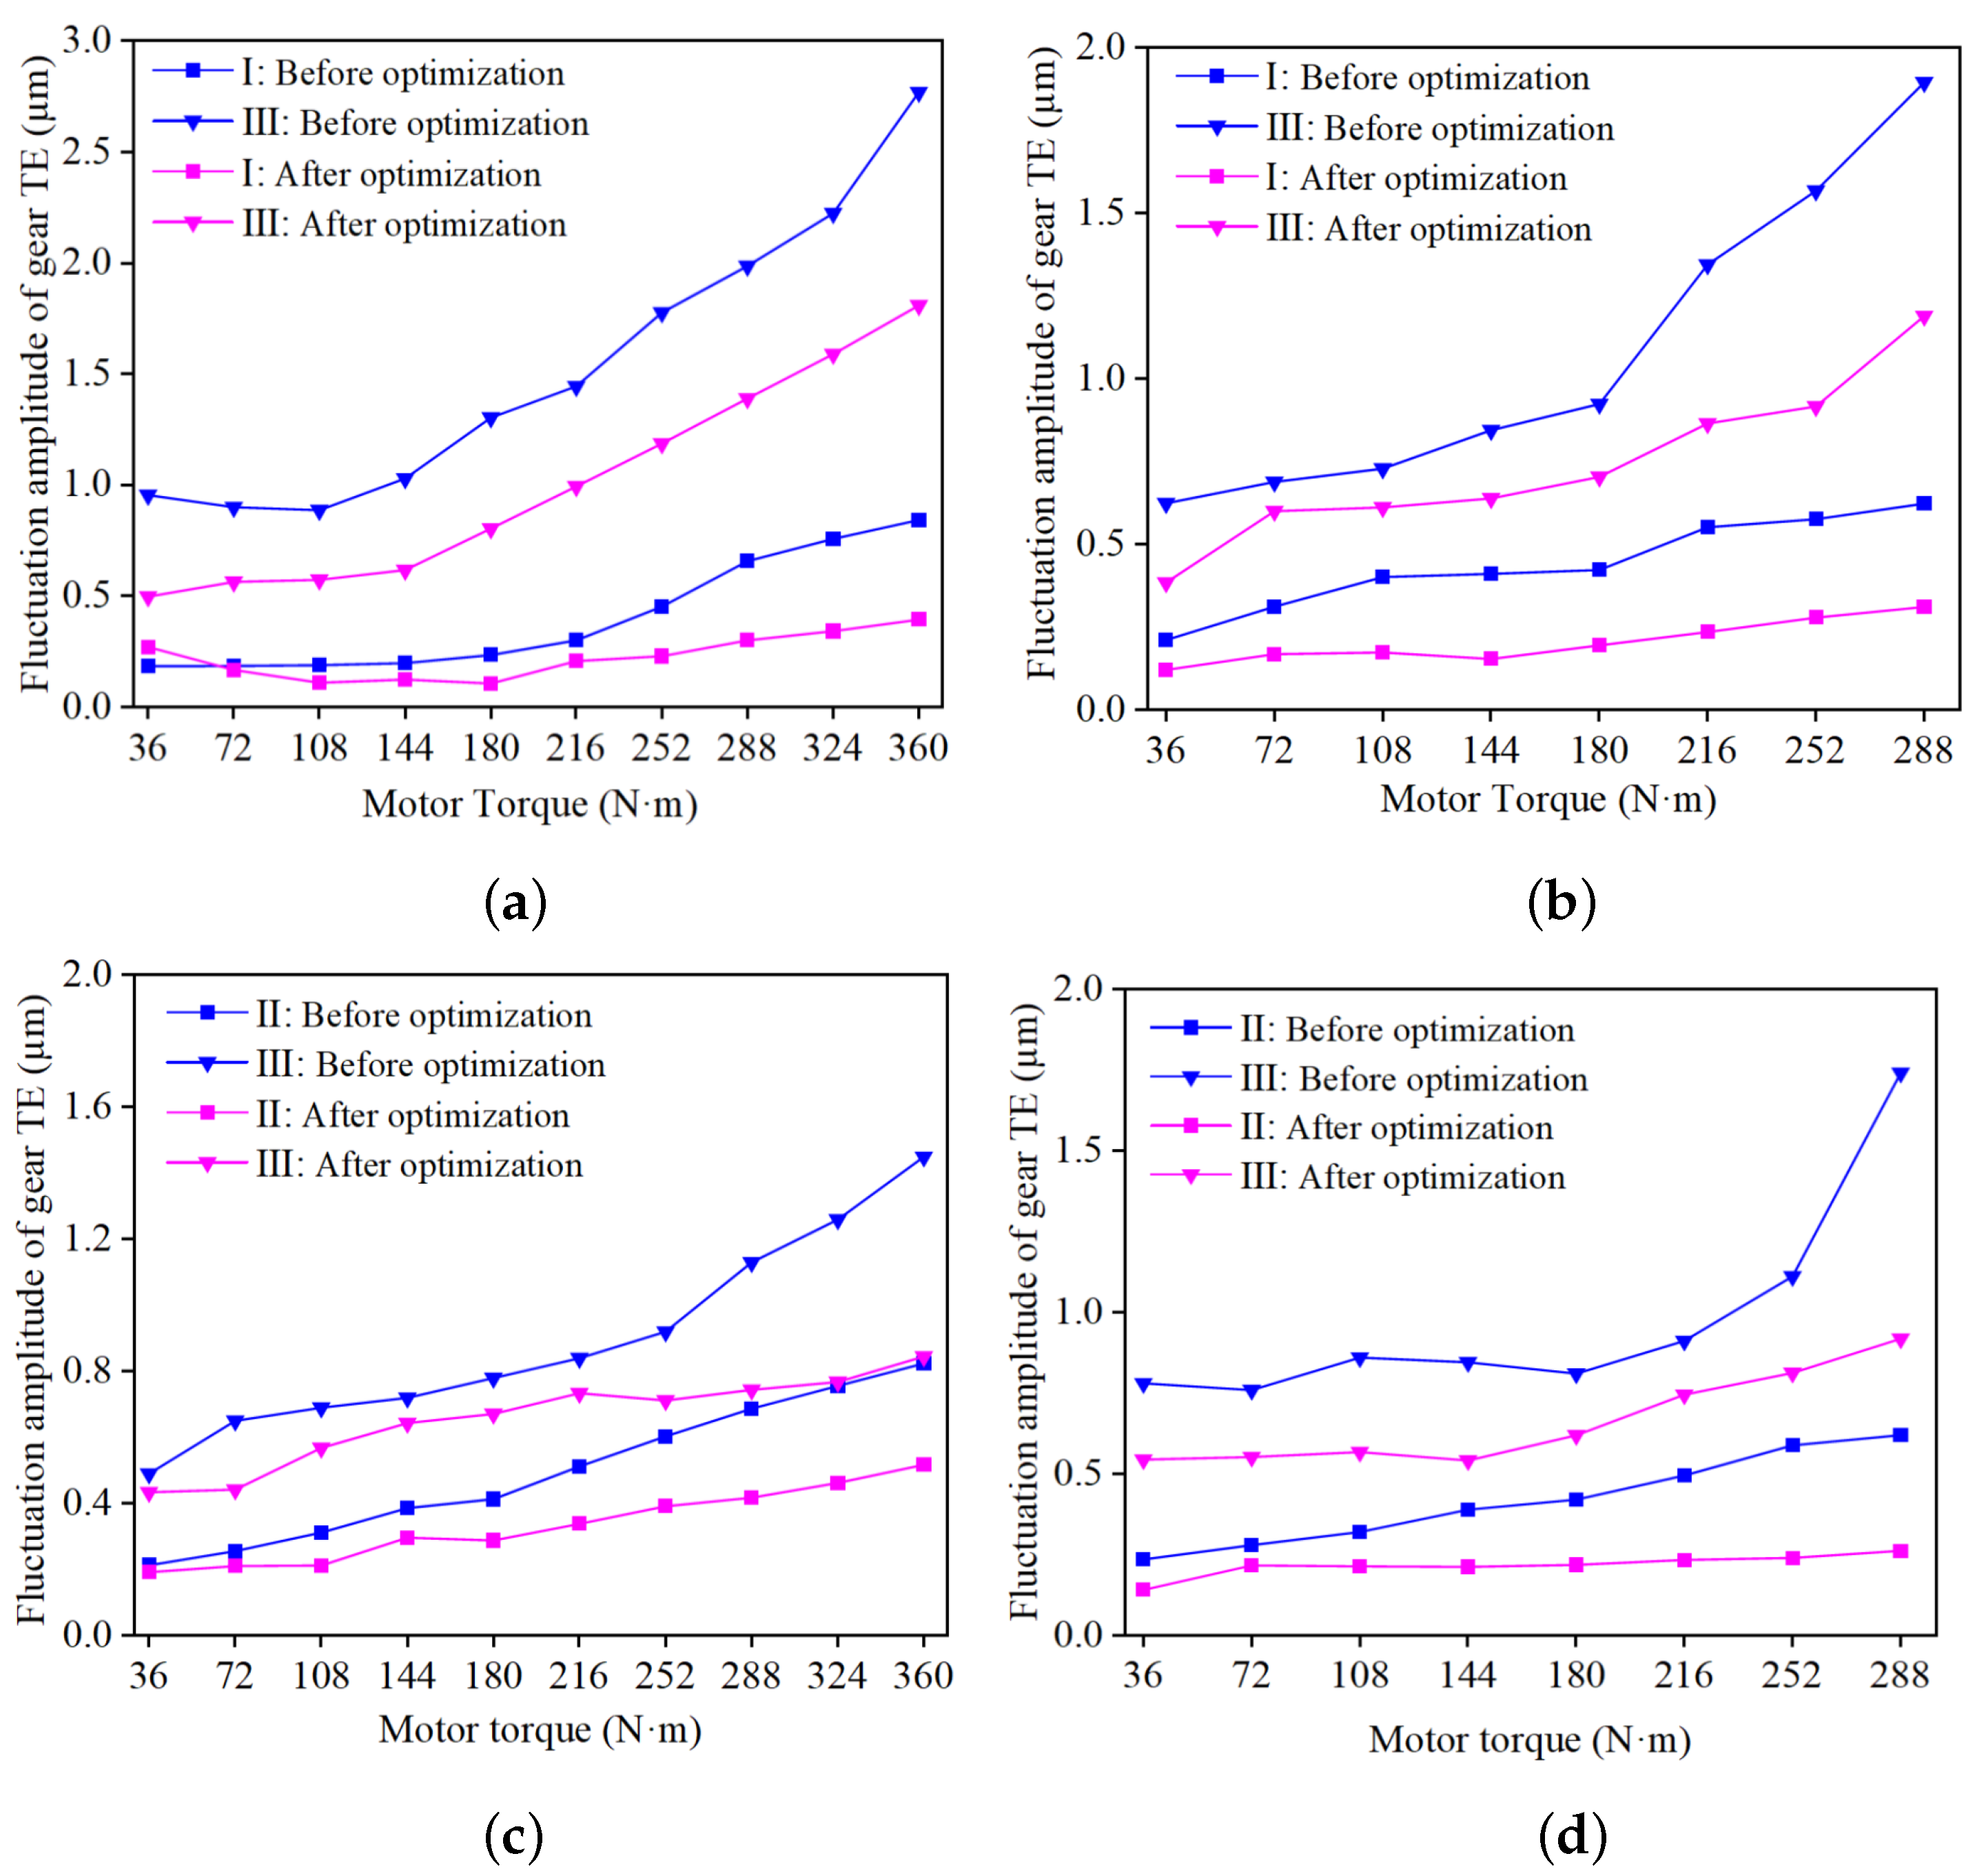
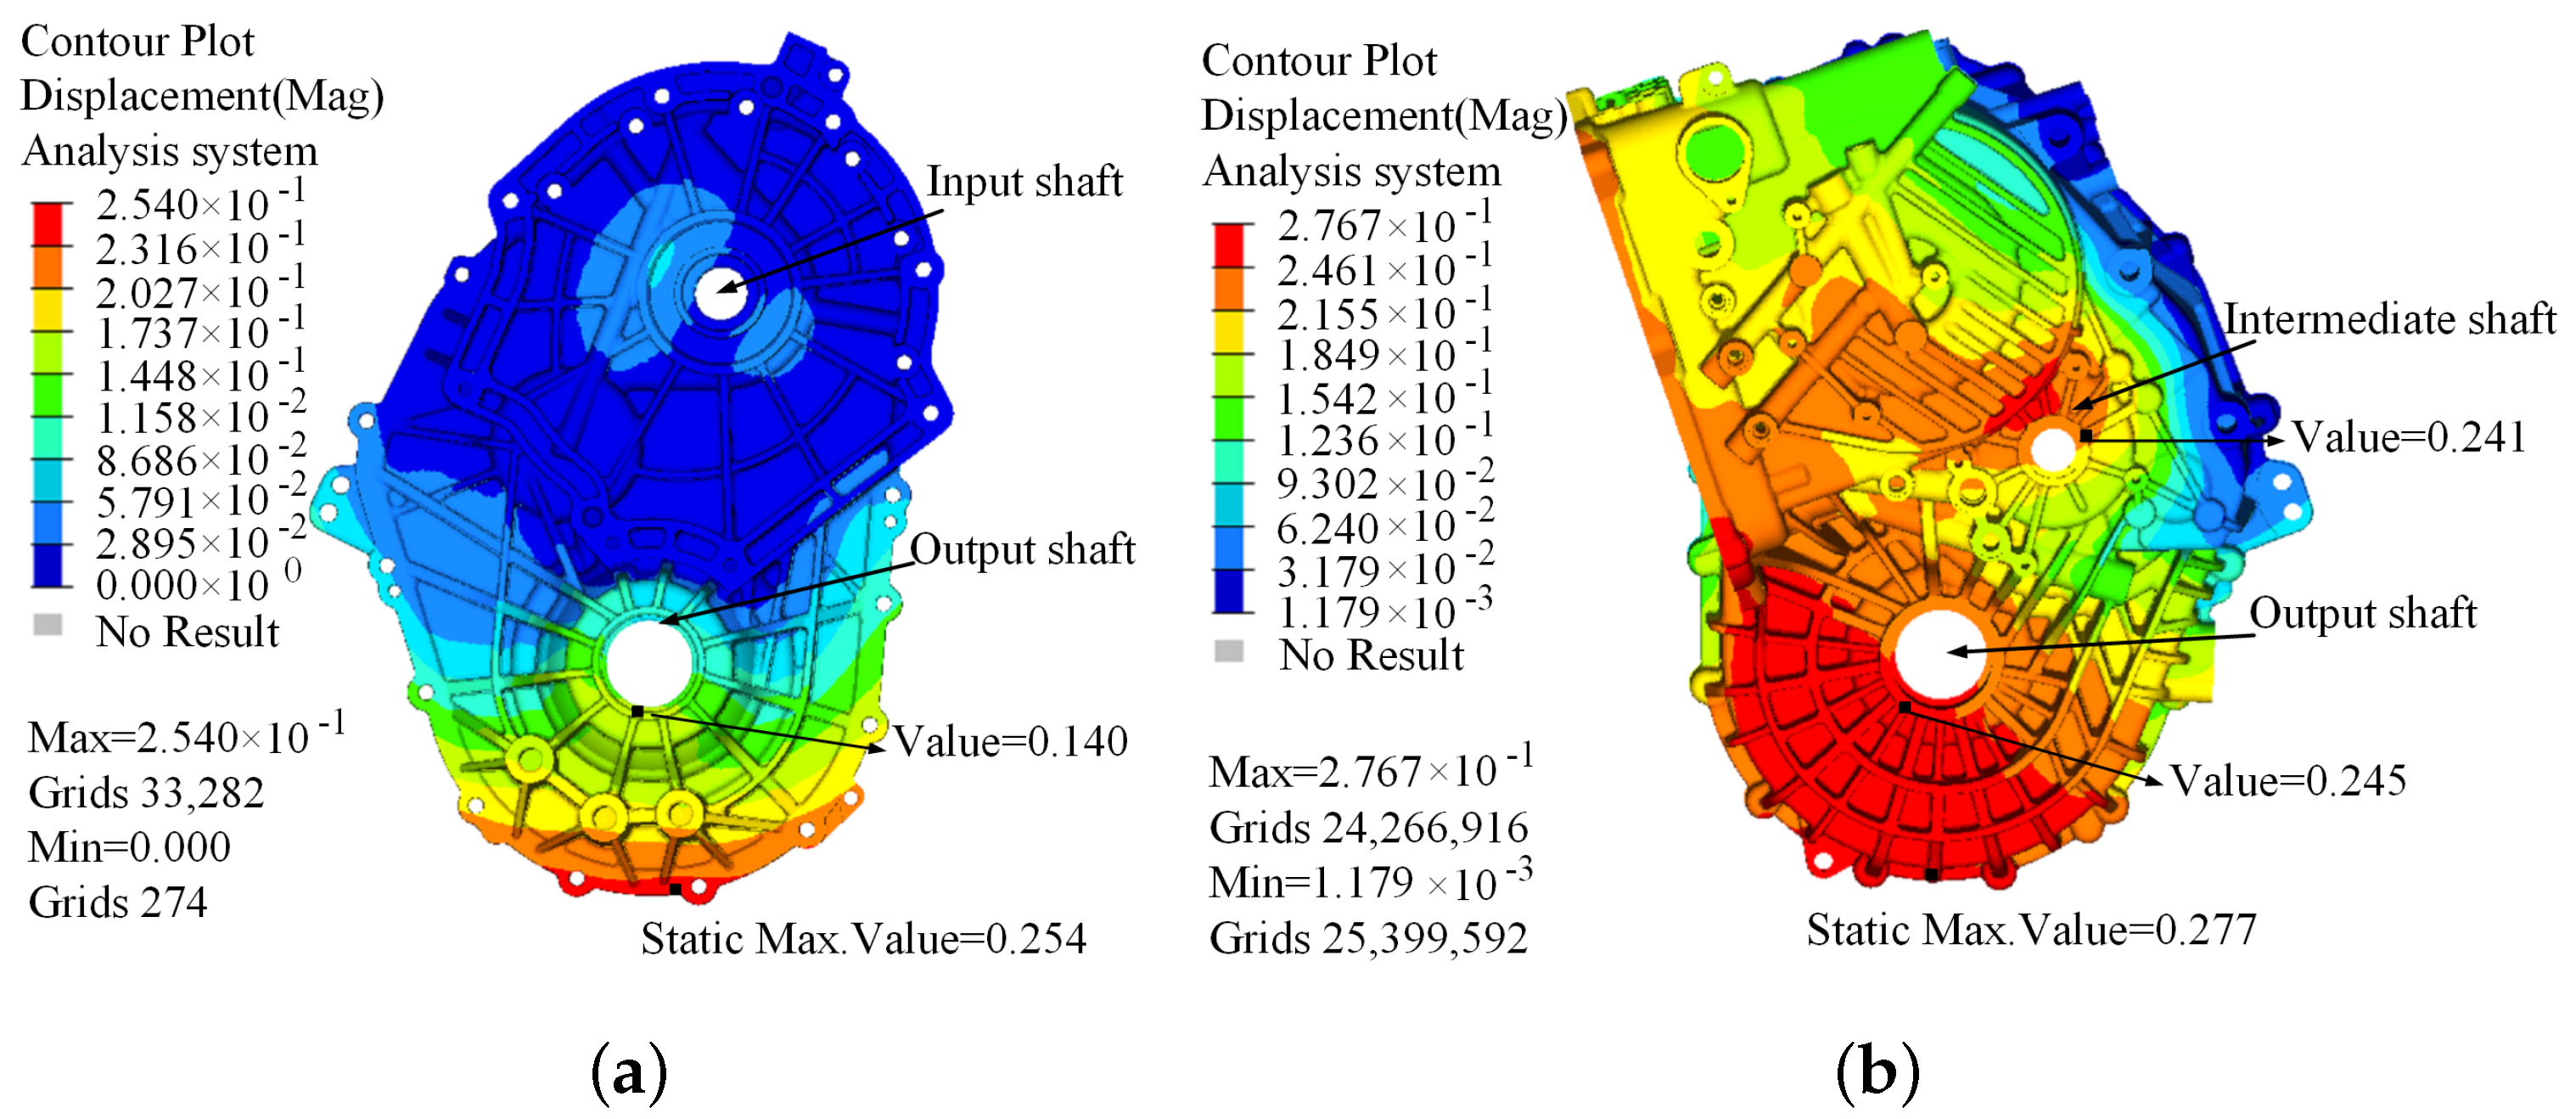
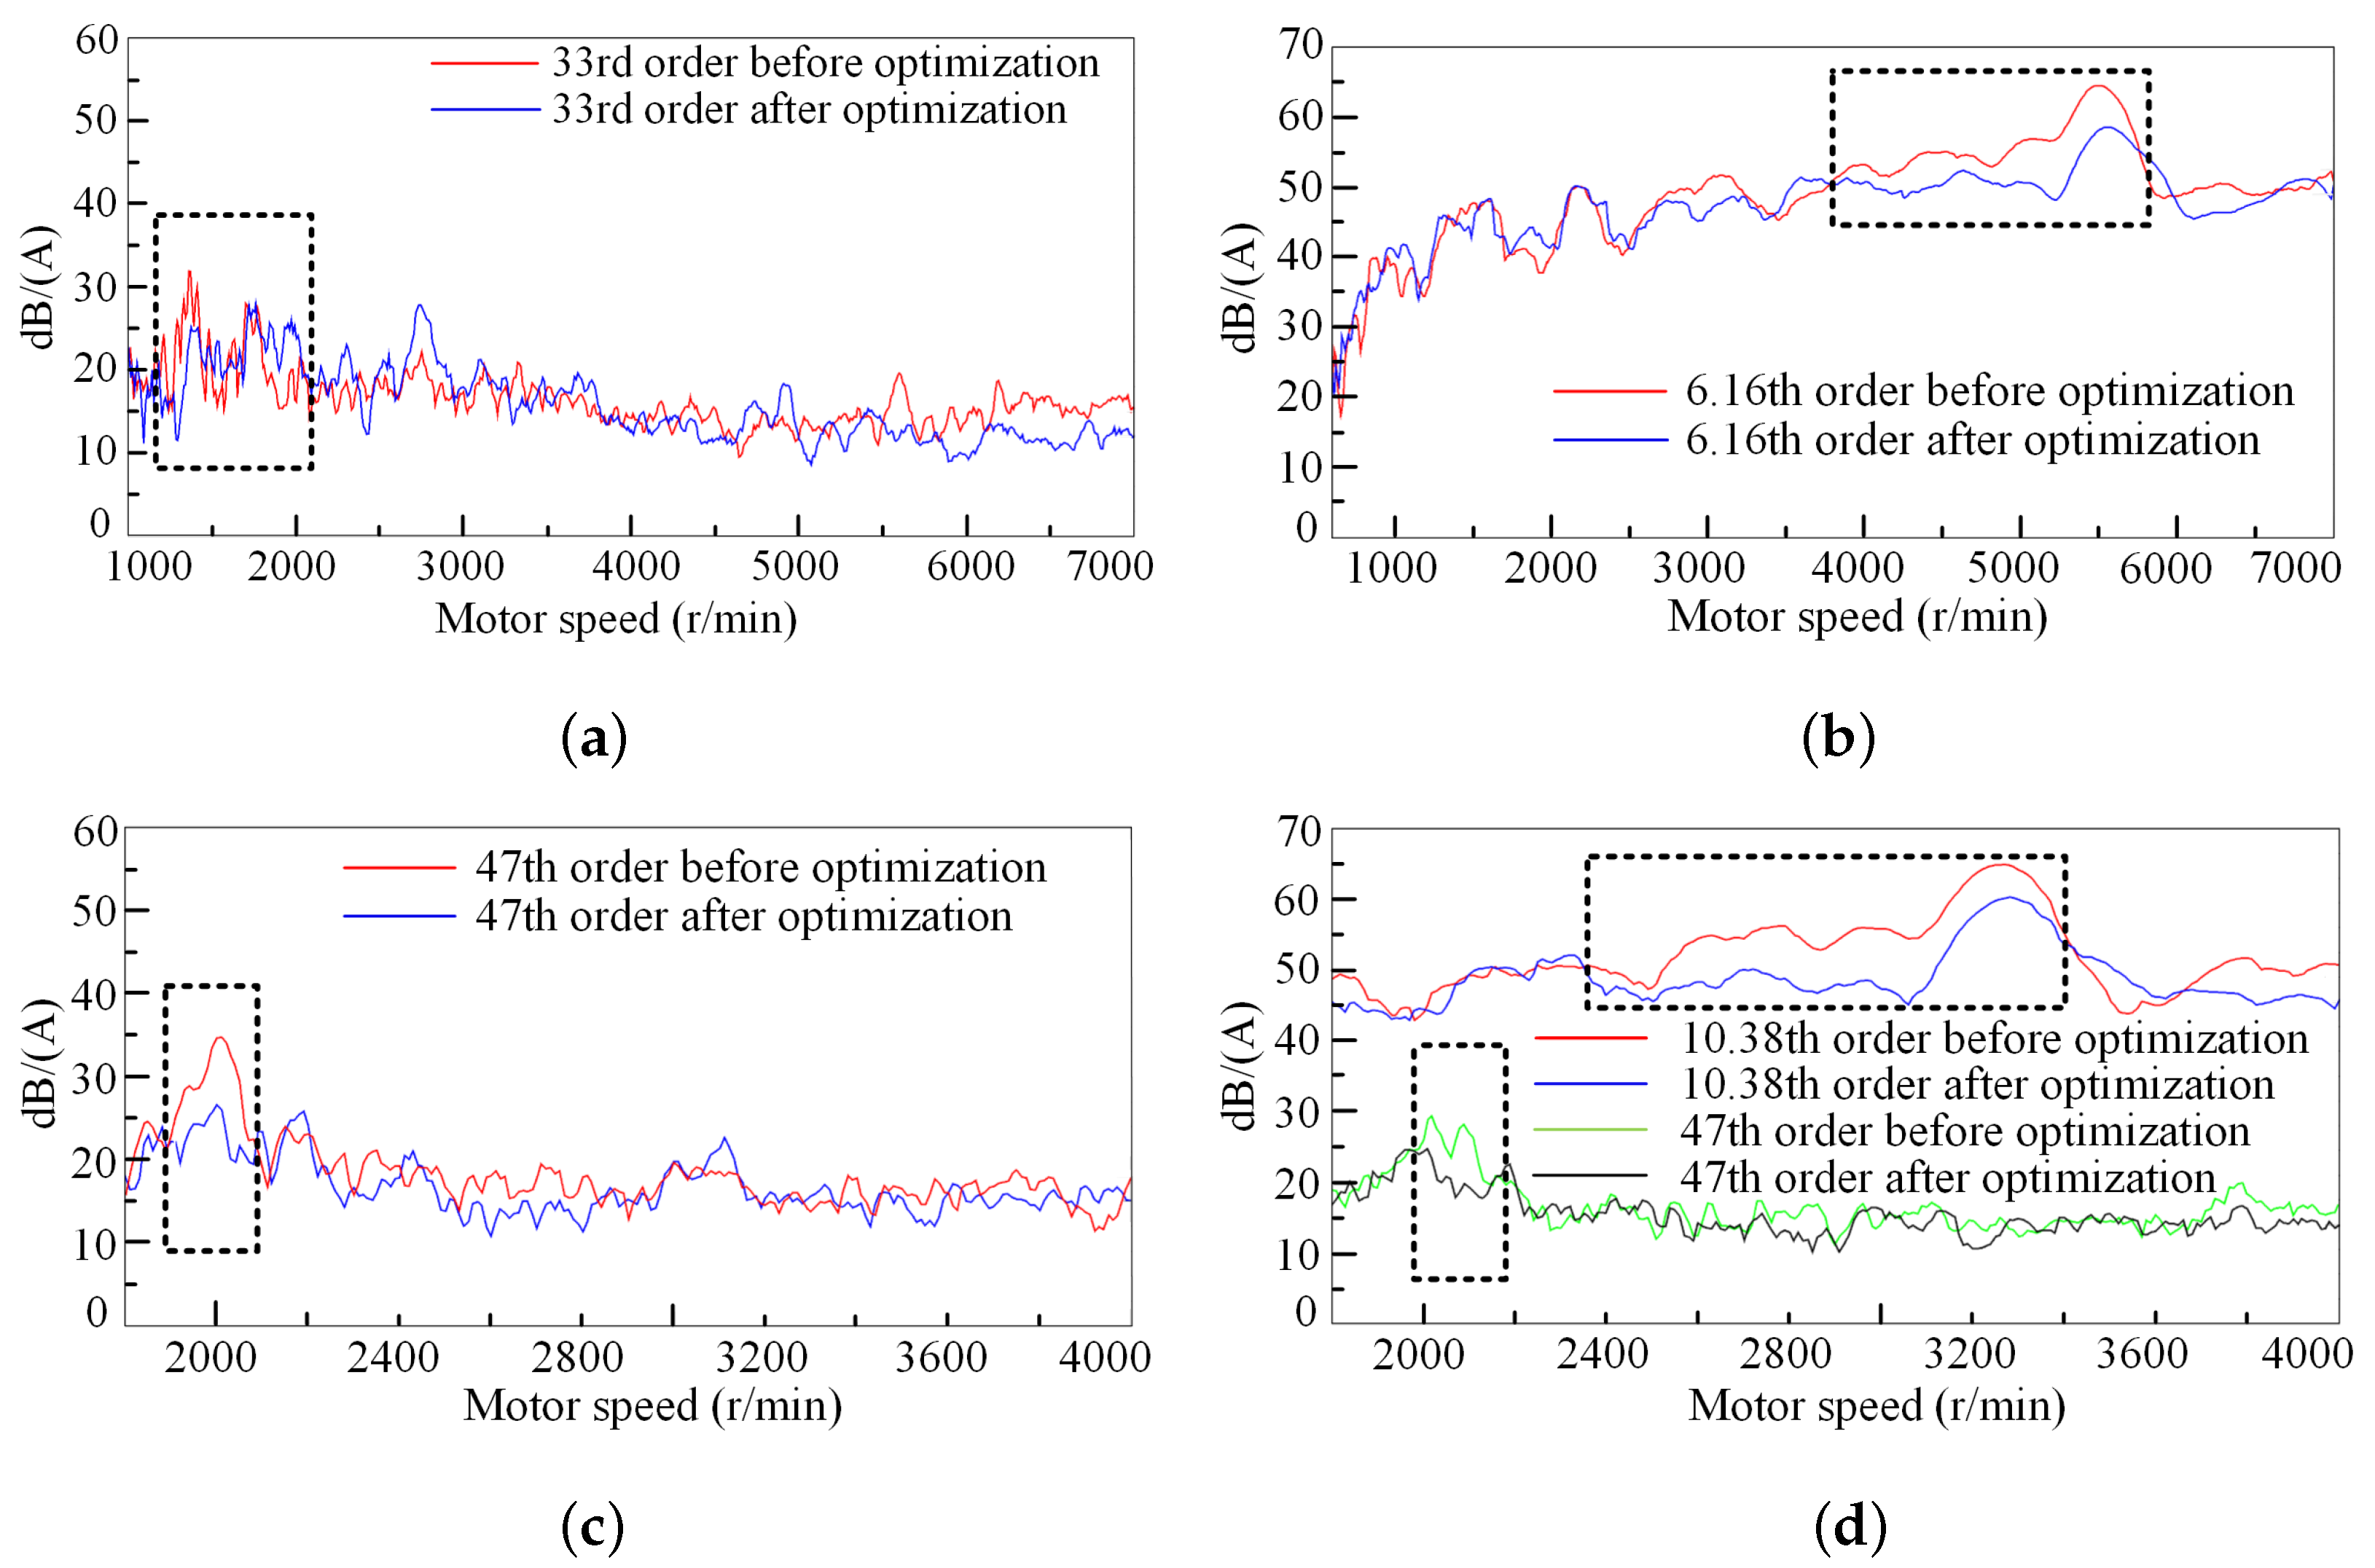
In this paper, the noise reduction method of a two-speed automatic transmission of a pure electric vehicle was explored. Firstly, subjective evaluation and data analysis were carried out based on the test results to determine the speed range where the noise problem occurred. Then, with the order tracking method, dynamic simulation model, and finite element simulation model, the optimized object was determined as the gearbox housing structure. Finally, the noise level of the transmission was decreased by optimizing the gearbox housing structure, and the optimization effect was further verified by simulation and experiments.

2. Subjective Evaluation of Noise and Test Result Analysis

2.1. Vehicle Test

In this paper, the interior noise test of a pure electric vehicle equipped with a two-speed automatic transmission was carried out according to the Chinese standard: Acoustics-Measurement of Noise inside Motor Vehicles (GB/T 18697-2002). The test was carried out with the equipment of Siemens LMS in Belgium, which can be recharged and has the characteristics of small size, high accuracy and portability. LMS Test.Lab software is widely used in the field of automobile, noise and vibration. It is specially designed for acoustic and vibration measurement and has become the main test software of many automobile companies. Test equipment mainly includes data acquisition instruments, CAN line, vibration sensor, etc., as shown in Figure 1a,b. During the test, it is necessary to ensure that the Siemens LMS equipment is grounded to avoid low-frequency interference [19]. The interior noise test is shown in Figure 1c; the microphone is located on the side of the driver’s seat, behind the driver’s right ear.
The automatic transmission has two gears and adopts parallel shaft structure. It is controlled by electric control and hydraulic pressure, and there is no power interruption during shifting. The transmission 3D structure section view is shown in Figure 2a, and the external structure of the gearbox housing is shown in Figure 2b.
Vehicle noise test conditions are shown in Table 1. The first gear acceleration, first gear coasting condition, second gear acceleration, and second gear coasting condition are mainly tested. The vehicle speed and motor speed are converted in the table.

2.2. Analysis of Test Results

Subjective evaluation was performed by three professionals, including one driver and two evaluators. The age of the three professional evaluators ranged from 23 to 26, with healthy hearing. Two professional evaluators sit in the passenger seat and the rear seat (directly behind the driver). The evaluation criteria were rated on a 10-point scale (Table 2) [20].
The comprehensive subjective descriptions from the evaluators are provided below: The noise under the first gear acceleration (15 to 30 km/h) is identifiable. The noise under the first gear coasting condition (65 to 50 km/h) is identifiable. The noise under a second gear acceleration (40 km/h) is identifiable. The noise level under the second gear coasting condition (45 to 36 km/h) is lower. The noise level under the second gear coasting condition (70 to 50 km/h) is obvious. Subjective evaluation scoring results are shown in Table 3.
The comprehensive score of subjective evaluation is 6.9, indicating that the vehicle interior noise is within an acceptable range. The main complaint of the evaluator about the sound quality is that there is a clear and identifiable noise within a certain speed range. In order to further optimize the subjective feelings of passengers, it is necessary to reduce the noise level under specific conditions.

2.3. Test Data Analysis

First, the theoretical order of the transmission system is analyzed to determine the order of different engaging gears. Second, when analyzing the measured data, there are also order noise under different conditions. Finally, the gear corresponding to noise can be determined by comparing the theoretical analysis results with the measured data. In the order tracking process, the rotation frequency of a rotating shaft is generally taken as the reference object, and the rotation frequency of this rotating shaft is defined as order 1. The calculation formula of rotating shaft frequency is
f = n 60
where n (r/min) is the rotational speed of the rotating shaft. The gear engaging frequency is
f = n · z 60
where z is the number of teeth of the gear. The order of engaging gear relative to the reference shaft is
o r d e r = z i
where i is the transmission ratio.
The numbers of driving gear teeth and driven gear teeth of the first gear pair are, respectively, 33 and 91, and the order of gear in the first gear condition is 33rd. The numbers of driving gear teeth and driven gear teeth of the second gear pair are, respectively, 47 and 77, and the order of gear in the second gear condition is 47th. The driving gear of the main reducer is 17, and the driven gear is 69. Under the first gear condition, the order of the main reducer is 6.16th, and the order of the main reducer is 10.38th under the second gear condition. The problems found in subjective evaluation were analyzed. The color map graph of the first gear acceleration condition is shown in Figure 3a. In the motor speed range of 1000 to 2000 r/min (corresponding to the subjective evaluation speed range of 15–30 km/h) and the frequency range of 550 to 1100 Hz, there is the 33rd order noise corresponding to the first gear pair. Figure 3b) shows the 33rd order noise of the first gear acceleration. In the speed range of 1000 to 2000 r/min, the noise peak was obvious. The color map graph of the first gear coasting condition is shown in Figure 4a. In the motor speed range of 5800 to 4000 r/min (corresponding to the subjective evaluation speed range of 65–50 km/h) and the frequency range of 411 to 596 Hz, there is the 6.16th order noise corresponding to the main reducer gear pair. Figure 4b shows the 6.16th order noise under the first gear coasting condition. The peak noise level reaches 64 dB in the speed range of 5800 to 4000 r/min.
The color map graph of the second gear acceleration condition is shown in Figure 5a. In the motor speed range of 1890 to 2200 r/min (corresponding to the subjective evaluation speed range of about 40 km/h) and the frequency range of 1481 to 1723 Hz, there is the 47th order noise corresponding to the second gear pair. Figure 5b shows the 47th order noise of the second gear acceleration. Under the speed of about 2000 r/min, the noise peak point is prominent and reaches 36 dB.
The color map graph of the second gear coasting condition is shown in Figure 6a. In the motor speed range of 2300 to 2000 r/min (corresponding to the subjective evaluation speed range of 45–36 km/h) and the frequency range of 1567 to 1802 Hz, there is 47th order noise corresponding to the second gear pair. In the motor speed range of 3500 to 2500 r/min, the frequency range is 432–565 Hz, and there is the 10.38th order noise, corresponding to the main reducer gear pair. The noise peaks of the 10.38th order noise and the 47th order noise under the second gear coasting conditions are, respectively, 65 dB and 30 dB (Figure 6b), and the 47th order noise level was much lower than the 10.38th order noise level and not easily identifiable in subjective evaluation.

3. Determination of Noise Sources

Subjective evaluation and data processing results indicated that the meshing transmission of three pairs of gears in the automatic transmission was the main source of identifiable noise. The reasons for the noise might be the improper design parameters of the gear itself or the gearbox housing.
Due to the existence of factors such as manufacturing and installation errors, the actual rotation position of the driven wheel is not equal to the theoretical rotation position. Therefore, transmission error (TE) refers to the difference between the actual meshing position and the theoretical meshing position of the driven wheel on the meshing line, which is an important indicator to measure gear noise. Reducing gear TE is the key to control gear noise. In order to determine the main noise cause, the simulation models of the gear transmission system and the whole gearbox were established in Romax Designer. This software can provide the most complete virtual product development environment for the design and optimization of a transmission and transmission system and can accurately analyze the gear TE. Figure 7a is the simulation model of the gear transmission system of the automatic transmission, and Figure 7b is the simulation model of the whole automatic transmission. The fluctuation amplitudes of the gear TE of the system before and after the introduction of the gearbox housing were compared and analyzed.
The comparative analysis results of gear TE are shown in Figure 8a–d and corresponding gear pair numbers are consistent with those in Figure 7a. Under the first and second gear acceleration condition and coasting condition, the fluctuation amplitude of gear TE increased with the increase in load. Under the same working conditions, the fluctuation amplitude of gear TE obtained after the introduction of gearbox housing was greater than that obtained before the introduction of gearbox housing. Under the first gear acceleration condition, the maximum difference in fluctuation amplitude of gear TE of the first gear pair was 0.652 μm, and the maximum difference in the fluctuation amplitude of gear TE of the main reduction gear pair was 1.02 μm. Under the first gear coasting condition, the maximum difference in the fluctuation amplitude of gear TE of the first gear pair was 0.88 μm, and the maximum difference of the main reduction gear pair was 1.14 μm. Under the second gear acceleration condition, the maximum difference in the fluctuation amplitude of gear TE of the second gear pair was 0.626 μm, and the maximum difference in the fluctuation amplitude of gear TE of the main reduction gear pair was 0.627 μm. Under the second gear coasting condition, the maximum difference in the fluctuation amplitude of gear TE of the second gear pair was 0.542 μm, and the maximum difference in the fluctuation amplitude of gear TE of the main reduction gear pair was 0.822 μm.
It can be seen from the above data that the gearbox housing has a great influence on the fluctuation amplitude of gear TE. When carrying the gearbox housing for simulation, the TE of gear is significantly greater than that of the gear without the gearbox housing. With the increase of input torque, the difference between them shows an increasing trend. When the fluctuation amplitude of gear TE is large, it will increase the risk of transmission assembly noise. When the torque input by the motor is transmitted to the transmission, the load is finally borne by the gearbox housing. Therefore, the influence of the gearbox housing on the fluctuation amplitude of gear TE may be due to the large deformation of the gearbox housing bearing hole caused by the load [21].
Under the first gear acceleration condition, the maximum torque was 360 N·m. The deformation of the gearbox bearing is shown in Figure 9.
Radial displacement of the bearing increased with the increase in torque.The maximum radial displacement of the front gearbox housing bearing was about 0.10 mm and that of the rear gearbox housing bearing was about 0.29 mm. Therefore, the deformation of gearbox housing had the great influence on gear TE.

4. Static and Dynamic Stiffness Analysis of Gearbox Housing

4.1. Static Stiffness Analysis of Gearbox Housing

The simulation analysis was carried out for the transmission input maximum torque of 360 N·m, and the loads in different directions of each bearing hole obtained by simulation are shown in Table 4.
Hypermesh is a professional simulation software of Altair, which can be used for static strength and dynamic stiffness simulation analysis. First, the finite element model of the gearbox housing is established. Because housing structure is complex, tetrahedral elements are used to mesh the gearbox housing. Due to the small size of some key structures of the gearbox housing, and considering the convergence, calculation accuracy, and calculation economy of the model, all the first-order elements are transformed into second-order elements. The grid size is 2 mm, the grid number is 4228488, and the node number is 4520700. Figure 10a shows the local mesh diagram of the finite element model of the gearbox housing [22]. Then, the model of the gearbox was imported into Hypermesh. The Rbe3 element was established at each bearing hole of the gearbox and then the load was applied. Full constraints were imposed on the bolt hole of the front gearbox housing connecting the gearbox with the motor. The finite element model of the housing is shown in Figure 10b [23,24].
The static stiffness simulation results of the gearbox are shown in Figure 11a,b. The maximum cumulative deformation of the front and rear gearbox housing was mainly distributed along the edge. The maximum cumulative deformation of the front gearbox housing was 0.305 mm, and the maximum cumulative deformation of the rear gearbox housing was 0.329 mm. The deformation of the input end of the front gearbox housing was small under static load, and the deformation of the output end was about 0.168 mm. The deformation of the intermediate end and output end of the rear gearbox housing was about 0.297 mm.
From the above analysis, it can be seen that the deformation of the bearing hole area of the box is large, which will have a certain impact on the reliability of the transmission system, reduce the precision of the gear transmission system, lead to larger TE of the gear, and increase the possibility of transmission noise. In order to improve the local stiffness of the gearbox bearing hole, the gearbox housing structure needs to be further optimized.

4.2. Dynamic Stiffness Analysis of Gearbox Housing

In this paper, Hyperworks software is used to analyze the dynamic stiffness of the key points of the gearbox housing. By analyzing the relationship between the acceleration response of the origin point and the dynamic stiffness, the frequency characteristic curve of the dynamic stiffness at the bearing hole is obtained, which can directly reflect the relationship between the structure and deformation of the gearbox housing and intuitively evaluate the dynamic characteristics of the gearbox housing. The excitation was applied at the bearing holes with large bearing capacity. The excitation frequency was set from 0 to 2000 Hz, and the modal frequency was set from 0 to 4000 Hz. The excitation force of 1 N was applied at the excitation point [25]. The dynamic stiffness analysis results are shown in Figure 12a–c.
When the excitation frequency was 437.2 Hz, the stiffness values in the X- and Y-directions of the output end of the front gearbox housing were, respectively, 60,256.4 N/mm and 50,124.5 N/mm, and the stiffness value in Z-direction was relatively small (23,567.9 N/mm). The stiffness values in the Y- and Z-directions of the intermediate end of the rear gearbox housing were small and, respectively, reached 19,669.4 N/mm and 20,187.6 N/mm. The stiffness in the Z-direction of the output end of the rear gearbox housing was the smallest (13,018.5 N/mm). When the excitation frequency was 605.8 Hz, the stiffness values at each position slightly fluctuated, but the fluctuations were not obvious. When the excitation frequency was 965.2 Hz, the stiffness values in the X-, Y- and Z-directions also fluctuated slightly. The stiffness value in the X-direction of the output end of the front gearbox housing was low (239,391.6 N/mm). The stiffness in the Z-direction of the intermediate end of the rear gearbox housing was low (147,495.8 N/mm). The stiffness in the Y-direction of the output end of the rear gearbox housing was relatively low (130,531.1 N/mm). The results showed that the frequency ranges of 33th order high noise under the first gear acceleration condition, 6.16th order high noise under the first gear coasting condition, and 10.38th order high noise under the second gear coasting conditions were close to the frequencies of 437.2 Hz, 605.8 Hz, and 965.2 Hz calculated in dynamic stiffness simulation.
According to the above analysis, the stiffness value of the local area of the bearing hole of the transmission gearbox was low, including the bearing hole area at the output end of the front gearbox housing, and the bearing hole area at the middle end and output end of the rear gearbox housing are weak points of vibration, and may lead to the larger amplitude of the gearbox under the excitation as well as identifiable noise. Therefore, the stiffness of the local area of the bearing hole should be improved in order to reduce the deformation.
Modal analysis of the gearbox housing was carried out to output the displacement nephogram of the gearbox housing, find out the accurate position of local deformation, and put forward the corresponding improvement measures to strengthen the overall stiffness of the gearbox housing. The first three natural frequencies (Table 5) verified the correctness of dynamic stiffness simulation.
The first three modes are shown in Figure 13a–c. The natural frequency of the first mode is 437.2 Hz, the natural frequency of the second mode is 605.8 Hz, and the natural frequency of the third mode is 965.2 Hz. In each order comparison shape, the housing on the left is not deformed, and the picture on the right is the vibration mode shape of the housing, which has a certain degree of deformation.
In the 1st mode shape, bending deformation occurred around point A. Bending deformation occurred in the 2nd mode shape and the depression occurred at part B of the gearbox housing. In the 3rd mode shape, torsional deformation occurred at part C-end and C -end. Therefore, through modal analysis, it can be determined that the output end of the front gearbox housing, the middle end of the rear gearbox housing, and the output end need to be strengthened. By increasing the thickness and quantity of the stiffeners or changing the direction of the stiffeners, the connection stiffness of the reinforcement is improved, and the large area of the housing structure is segmented to enhance the overall stiffness of the gearbox housing.

5. Structural Optimization of Gearbox Housing

5.1. Local Optimization of Gearbox Housing

According to the simulation analysis results of gearbox housing, the bearing positions of the front and rear gearbox housing were optimized. The static stiffness analysis results show that the deformation of the bearing hole area at the output end and the middle end of the rear gearbox housing is large, and adding some distributed stiffeners outside and inside can effectively reduce the deformation and enhance the stability of the housing. The dynamic stiffness simulation analysis results show that the dynamic stiffness values of the front gearbox housing output end are relatively small, and the dynamic stiffness values of the rear gearbox housing output end and the middle end also need to be appropriately improved, and the modal analysis shows that the shell is prone to deformation, so the specific optimization measures are as follows.
The optimized structure of the front gearbox housing is shown in Figure 14a,b. The reinforcement direction was adjusted, and the reinforcement thickness was increased at Part D of the output end. Seven stiffeners were added at Part E to improve the local stiffness. The structural optimization results of the rear gearbox housing are shown in Figure 14c,d. The scattering stiffener at Part F inside the output end of the rear gearbox housing was extended to the inner wall of the gearbox housing, and a part of the annular stiffener was added. The number of stiffeners was increased at Parts G and H outside of the output end, and the stiffeners were increased at Part I outside of the intermediate end of the rear gearbox housing [26,27,28,29].

5.2. Comparison of Optimization Results

5.2.1. Transmission Error after Optimization

The simulation was carried out with the gearbox model. The transmission error fluctuations under the first gear acceleration/coasting conditions before and after optimization are shown in Figure 15a,b. The transmission error fluctuations after optimization were significantly reduced. Under the acceleration conditions, the transmission error fluctuation of the first gear pair was reduced by about 43.8% after optimization, and the transmission error fluctuation of the main reduction gear pair was reduced by about 34.4%. Under the coasting conditions, the fluctuation amplitude of the transmission error of the first gear pair was reduced by about 53.3%, and the fluctuation amplitude of the transmission error of the main reduction gear pair was reduced by about 31.4%. The transmission error fluctuations under the second gear acceleration/coasting conditions before and after optimization are shown in Figure 15c,d. Under the acceleration conditions, the transmission error fluctuation of the second gear pair was reduced by about 32.9% after optimization, and the transmission error fluctuation of the main reduction gear pair was reduced by about 26.4%. Under the coasting conditions, the fluctuation amplitude of the transmission error of the second gear pair was reduced by about 27.2%, and the fluctuation amplitude of the transmission error of the main reduction gear pair was reduced by about 27.4%.
From the above analysis, it can be seen that the overall level of gear TE is reduced after the stiffness of the bearing hole area of the gearbox housing is improved, which shows that the measures to add stiffeners in the bearing hole area are effective and conducive to optimizing the noise of the automatic transmission.

5.2.2. Static Stiffness after Optimization

The static stiffness analysis of the optimized gearbox housing was carried out. The deformation nephogram of the gearbox housing under the first gear acceleration and a load of 360 N·m is shown in Figure 16a,b. The maximum cumulative deformation of the front gearbox housing was 0.254 mm, which was 16.7% lower than that before optimization. The maximum cumulative deformation of the rear gearbox housing was 0.277 mm, which was 15.8% lower than that before optimization. The deformation near the bearing of the output end of the front gearbox housing was 0.140 mm, which was 16.7% less than that before optimization. The deformation near the bearing of the output end of the rear gearbox housing was 0.245 mm, which was 17.5% less than that before optimization. The deformation near the bearing of the intermediate shaft was 0.241 mm, which was 18.6% less than that before optimization.
The static stiffness was largely improved after optimization, especially the static stiffness near the bearing hole. This can ensure that the deformation of the bearing hole area can be maintained in a small range under the condition of large torque input to the transmission, which is conducive to improving the stability of the transmission system.

5.2.3. Dynamic Stiffness after Optimization

After optimization, the natural frequencies were changed slightly, and the dynamic stiffness near each excitation point was improved (Table 6).
The dynamic stiffness analysis results are shown in Figure 17a–c. Under the first natural frequency of 445.5 Hz, the Z-direction stiffness near the excitation point of the front gearbox housing output end was increased by about 16.8%, and the X- and Y-direction stiffness values were also increased by about 14.4% and 8.6%, respectively. The stiffness values in the Y- and Z-directions of the intermediate end of the rear gearbox housing were, respectively, increased by about 16.3% and 26.5%. The Z-direction stiffness of the output end of the rear gearbox housing was increased by about 11.8%. When the 2nd order natural frequency was 593.8 Hz, the stiffness of the region near the excitation point was increased slightly, but the increase was not obvious. Under the 3rd order natural frequency of 991.7 Hz, the stiffness of the output end of the front gearbox housing was increased by about 1%. The Z-direction stiffness of the intermediate end of the rear gearbox housing was increased by about 12.5%. The X- and Z- direction stiffness values of the output end of the rear gearbox housing were, respectively, increased by about 4% and 11.3%.
The results of dynamic stiffness analysis show that the first three natural frequencies of the gearbox housing have changed, and the stiffness values of the key points have increased. This shows that the stiffness of the housing can be effectively improved by adding reinforcement, and the vibration of the housing caused by the excitation force can be reduced. This also has a good effect on controlling the transmission assembly noise.

5.3. Vehicle Test Results after Optimization

The vehicle noise test was carried out with the optimized gearbox housing. The front face of the vehicle is shown in Figure 18a, and the transmission is located below the motor control unit (MCU), which cannot be seen. Therefore, the unassembled gearbox housing model is shown. Figure 18b is the optimized front gearbox housing, and Figure 18c is the optimized rear gearbox housing.
The comparative vehicle test was carried out with the optimized gearbox. The test results under the first gear acceleration conditions are shown in Figure 19a. The 33rd order noise was not obvious after optimization, and the noise level was significantly reduced in the speed range from 1000 to 2000 r/min. The peak value was reduced by 7 dB and the peak noise was reduced below 30 dB. The noise level in other speed ranges was slightly increased, but the absolute noise level was small and the influence of noise on subjective evaluation was small. The test results under the first gear coasting conditions are shown in Figure 19b. The 6.16th order noise level was significantly reduced after optimization. The noise amplitude of the motor in the speed range from 5800 to 4000 r/min was generally reduced. Specifically, the noise level under the speed of 5500 r/min was reduced by 8 dB after optimization.
The test results under the second gear acceleration conditions are shown in Figure 19c. After optimization, the 47th order noise was not obvious and the peak noise level under the motor speed of 2000 r/min was reduced to 26 dB, which was 10 dB lower than that before optimization. The noise level under other speed ranges fluctuated slightly. The test results under the second gear coasting conditions are shown in Figure 19d. After optimization, the 10.38th order and 47th order noise levels were decreased significantly, and the 47th order noise level was decreased to 25 dB, which was 5 dB lower than that near the motor speed of 2000 r/min. In the range from 2500 to 3500 r/min, the 10.38th order noise level was decreased by an average of 8 dB.
After optimization, the same personnel conducted the subjective evaluation again. The subjective evaluation results are shown in Table 7. The evaluation score increased from 6.9 to 8.1, indicating the better comprehensive evaluation results.

6. Conclusions

In this paper, the current research on reducing the noise of two-speed automatic transmission for pure electric vehicles is systematically described, and a scheme for reducing noise by optimizing the gearbox housing is proposed. The noise can be more comprehensively understood by analyzing the noise by combining subjective and objective methods. The dynamic simulation models of the transmission system and the whole gearbox were built, respectively, to analyze the influences of the gear itself and the gearbox housing on the TE of the system. The results showed that the local deformation of the gearbox bearing hole had a great influence on the TE. The gearbox housing structure needs to be further optimized. Next, the simulation analysis of the gearbox structure was carried out, and the weak position of the housing can be found accurately, so as to determine the optimization scheme, which can effectively improve the optimization efficiency. The simulation results showed that the maximum cumulative deformation of the front gearbox housing was reduced by 16.7% after optimization. The maximum cumulative deformation of the rear gearbox housing was reduced by 15.8% after optimization. The fluctuation amplitude of TE was reduced by 53.3% at most after optimization. The test results showed that the noise levels under the two gears were obviously decreased. The optimized noise peak value decreased by 5–10 dB, and the overall subjective evaluation score was increased from 6.9 to 8.1, indicating better customer recognition. When the professional team designs the gearbox housing, the number of stiffeners should be increased in the area near the bearing hole of the housing (including the inside and outside of the housing), or its thickness should be appropriately increased to enhance the performance of the housing. These measures can ensure the stability of the gearbox housing and reduce the gear TE of the transmission system. This can also effectively shorten the research and development cycle of the gearbox housing.

Author Contributions

Conceptualization, Z.S. and B.L.; methodology, H.Y. and B.L.; formal analysis, H.Y. and X.W.; writing—original draft preparation, B.L. and H.Y.; writing—review and editing, H.Y. and X.W.; visualization, H.Y. and S.W. All authors have read and agreed to the published version of the manuscript.

Funding

The study was supported by the National Natural Science Foundation of China (Grant Nos. 51905010 and 52072018) and The National Key Research and Development Program of China (Grant No. 2018YFB2001400).

Data Availability Statement

The data used to support the findings of this study are available from the corresponding author upon request.

Conflicts of Interest

The authors declare no conflict of interest.

References

  1. Huang, X.L. Design and Development of NVH for Electric Vehicle; China Machine Press: Beijing, China, 2020. [Google Scholar]
  2. Li, M.M.; Liu, Q.W.; Dai, G.H.; Chen, W.F.; Zhu, R.P. Vibration transfer path analysis of double-layer box for marine reducer. J. Vib. Eng. Technol. 2021, 9, 233979506. [Google Scholar] [CrossRef]
  3. Camacho-Gutiérrez, S.V.; Jáuregui-Correa, J.C.; Dominguez, A. Optimization of excitation frequencies of a gearbox using algorithms inspired by nature. J. Vib. Eng. Technol. 2019, 6, 551–553. [Google Scholar] [CrossRef]
  4. Xu, X.Y.; Zhao, J.L.; Zhao, J.W.; Shi, K.; Dong, P.; Wang, S.; Liu, Y.; Guo, W.; Liu, X. Comparative study on fuel saving potential of series-parallel hybrid transmission and series hybrid transmission. Energy Convers Manag. 2021, 252, 114970. [Google Scholar] [CrossRef]
  5. Guan, K. NVH and drivability of dual clutch transmission integrated in passenger vehicle. Auto Sci.-Tech. 2020, 1, 55–63. [Google Scholar]
  6. Yang, L.B.; Xie, S.S.; Jin, W.B.; Wang, G.L.; Song, S.S. Optimization of gear whine characteristics of manual transmission. Auto Sci.-Tech. 2018, 3, 158–161. [Google Scholar]
  7. Chen, Y. Vehicle transmission gear whine measurement and investigation. J. Mech. Trans. 2011, 35, 15–19. [Google Scholar]
  8. Dong, X.L. Study on analysis and testing of vibration and noise of vehicle gearbox. Mech. Manag. Dev. 2012, 1, 53–54. [Google Scholar]
  9. Kou, R.J.; Xiao, L.W.; Li, D.; Wang, W.H. Research on reduction of transmission gear whine. Mech. Eng. 2020, 9, 5–7. [Google Scholar]
  10. Tong, Q.M.; Lei, J.Q.; Du, T.Y. Analysis and improvement of some transmission high speed rattle. Auto Parts 2021, 3, 88–91. [Google Scholar]
  11. Tosun, M.; Yildlz, M.; Ozkan, A. Investigation and refinement of gearbox whine noise. Appl. Acoust. 2018, 130, 305–311. [Google Scholar]
  12. Deng, C.H.; Deng, Q.P.; Liu, W.G.; Yu, C.; Hu, J.J.; Li, X. Analysis of vibration and noise for the powertrain system of electric vehicles under speed-varying operating conditions. Math. Probl. Eng. 2020, 2020, 6617291. [Google Scholar] [CrossRef]
  13. Zang, M.Y.; Meng, N.; Chu, S.M.; Chen, Y. Dynamic response analysis of a transmission housing under variable speed conditions. J. South China Univer. Tech. 2017, 45, 1–6. [Google Scholar]
  14. Curtis, S.; Pears, J.; Palmer, D. An analytical method to reduce gear whine noise, including validation with test data. SAE Trans. 2005, 114, 2195–2202. [Google Scholar]
  15. Singh, P.K.; Sai, K. Study of effect of variation in micro-geometry of gear pair on noise level at transmission. SAE Trans. 2015, 26, 0130. [Google Scholar]
  16. Liu, Z.T.; Liu, J.L. Effect of altitude conditions on combustion and performance of a turbocharged direct-injection diesel engine. Proc. I Mech. E Part D J. Auto Eng. 2022, 236, 582–593. [Google Scholar] [CrossRef]
  17. Liu, Z.T.; Liu, J.L. Investigation of the Effect of Simulated Atmospheric Conditions at Different Altitudes on the Combustion Process in a Heavy-Duty Diesel Engine Based on Zero-Dimensional Modeling. J. Eng. Gas. Turbines Power 2022, 144, 061013. [Google Scholar] [CrossRef]
  18. Liu, Z.T.; Liu, J.L. Machine Learning Assisted Analysis of an Ammonia Engine Performance. J. Eng. Gas. Turbines Power 2022, 144, 112307. [Google Scholar] [CrossRef]
  19. Hong, W.B.; Kang, H.B.; Zhang, Z.J. LMS Test. Lab in the transmission NVH improvement application. Auto Appl. Tech. 2019, 15, 38–41. [Google Scholar]
  20. Pang, J. Nvh Control of Automotive Body; China Machine Press: Beijing, China, 2015. [Google Scholar]
  21. Li, W.Q.; Li, W.Y.; Zhang, L. The influence of the relative radial displacement of transmission bearing seat on gear mesh TE. Auto Appl. Tech. 2021, 16, 117–119. [Google Scholar]
  22. Chu, C.M.; Du, Y.H.; Zhang, B.; Liu, Y.B. A research on optimal mesh generation in finite element analysis for transmission housing. Auto Eng. 2014, 36, 885–888+898. [Google Scholar]
  23. Song, Q.L. Finite element analysis of gearbox housing strength of a gearbox based on OptiStruct. In Proceedings of the 2017 Altair Technology Conference, Nanjing, China, 13–14 July 2017; pp. 289–293. (In Chinese). [Google Scholar]
  24. Liu, Z.T.; Zhang, Y.; Fu, J.H.; Liu, J.L. Multidimensional Computational Fluid Dynamics Combustion Process Modeling of a 6V150 Diesel Engine. J. Mech. Strength. 2022, 14, 101009. [Google Scholar] [CrossRef]
  25. Zong, B.F.; Chu, C.M.; Huang, Y.H.; Tan, H. Ansys of vibration frequency response characteristic method study. J. Mech. Strength. 2019, 41, 244–249. [Google Scholar]
  26. Liu, Z.T.; Liu, J.L. Investigation of the Effect of Altitude on in-Cylinder Heat Transfer in Heavy-Duty Diesel Engines Based on an Empirical Model. Appl. Therm. Eng. 2022, 144, 112303. [Google Scholar] [CrossRef]
  27. Liu, Z.T.; Sun, M.Y.; Huang, Y.Q.; Li, K.Y.; Li, Z.; Gan, B.; Xiao, M. Performance of parallel plate-fin heat exchanger for piston aero-engines with front-placed guide plate at high altitude. Appl. Therm. Eng. 2022, 214, 118829. [Google Scholar] [CrossRef]
  28. Yang, J. Study of Automobile Transmission Housing Design Process. Trend Summ. 2021, 10, 108–111. [Google Scholar]
  29. Afonso, S.M.B.; Sienz, J.; Belblidia, F. Structural optimization strategies for simple and integrally stiffened plates & shells. Appl. Therm. Eng. 2005, 22, 429–452. [Google Scholar]
Figure 1. Test equipment and noise test site. (a) Siemens LMS equipment. (b) Vibration sensor. (c) Interior noise test.
Vehicles 05 00014 g001
Figure 2. (a) Transmission 3D structure section view. (b) External structure of gearbox housing.
Vehicles 05 00014 g002
Figure 3. (a) Color map graph under the first gear acceleration condition; (b) 33rd order noise under the first gear acceleration condition.
Vehicles 05 00014 g003
Figure 4. (a) Color map graph under the first gear coasting condition; (b) 6.16th order noise under the first gear coasting condition.
Vehicles 05 00014 g004
Figure 5. (a) Color map graph under the second gear acceleration condition; (b) 47th order noise under the second gear acceleration condition.
Vehicles 05 00014 g005
Figure 6. (a) Color map graph under the second gear coasting condition; (b) 10.38th and 47th order noise under the second gear coasting condition.
Vehicles 05 00014 g006
Figure 7. (a) Gear transmission system model of the automatic transmission. (b) Simulation model of the whole automatic transmission.
Vehicles 05 00014 g007
Figure 8. The TE of the system before and after the introduction of the gearbox housing were compared and analyzed. (a) Fluctuation amplitude of gear TE under the first gear acceleration condition. (b) Fluctuation amplitude of gear TE under the first gear coasting condition. (c) Fluctuation amplitude of gear TE under the second gear acceleration condition. (d) Fluctuation amplitude of gear TE under the second gear coasting condition.
Vehicles 05 00014 g008
Figure 9. Radial amplitude of outer ring of bearing.
Vehicles 05 00014 g009
Figure 10. (a) Local mesh of finite element model. (b) Finite element model of gearbox housing.
Vehicles 05 00014 g010
Figure 11. The static stiffness simulation results of the gearbox housing. (a) Deformation of the front gearbox housing. (b) Deformation of the rear gearbox housing.
Vehicles 05 00014 g011
Figure 12. Dynamic stiffness simulation analysis results of gearbox housing. (a) Stiffness curve of output end of front gearbox housing. (b) Stiffness curve of intermediate end of rear gearbox housing. (c) Stiffness curve of output end of rear gearbox housing.
Vehicles 05 00014 g012
Figure 13. Comparison shape of the first three modes of the gearbox housing: (a) 1st mode shape (437.2 Hz); (b) 2nd mode shape (605.8 Hz); (c) 3rd mode shape (965.2 Hz).
Vehicles 05 00014 g013
Figure 14. (a) Exterior of the output end of the front gearbox housing. (b) Interior of the output end of the front gearbox housing. (c) Interior of the output end of the rear gearbox housing. (d) Exterior of the output end of the rear gearbox housing.
Vehicles 05 00014 g014
Figure 15. (a) Comparison of the first gear acceleration conditions before and after optimization. (b) Comparison of the first gear coasting conditions before and after optimization. (c) Comparison of the second gear acceleration conditions before and after optimization. (d) Comparison of the second gear coasting conditions before and after optimization.
Vehicles 05 00014 g015
Figure 16. (a) Deformation of front gearbox housing after optimization. (b) Deformation of rear gearbox housing after optimization.
Vehicles 05 00014 g016
Figure 17. The dynamic stiffness simulation of the optimized gearbox housing. (a) Stiffness curves of the output end of front gearbox housing after optimization. (b) Stiffness curves of the intermediate end of rear gearbox housing after optimization. (c) Stiffness curves of the output end of rear gearbox housing after optimization.
Vehicles 05 00014 g017
Figure 18. (a) Front-end view of measured vehicle. The transmission is located under the MCU. (b) Front gearbox housing after optimization. (c) Rear gearbox housing after optimization.
Vehicles 05 00014 g018
Figure 19. (a) Comparison of 33rd order noise before and after optimization. (b) Comparison of 6.16th order noise before and after optimization. (c) Comparison of 47th order noise before and after optimization. (d) Comparison of 10.38th and 47th order noise before and after optimization.
Vehicles 05 00014 g019
Table 1. Vehicle noise test conditions.
Operating ConditionsMotor Speed RangeVehicle Speed Range
First gear acceleration600–7000 r/min7–83 km/h
First gear coasting7000–600 r/min83–7 km/h
Second gear acceleration1800–4000 r/min36–80 km/h
Second gear coasting4000–1800 r/min80–36 km/h
Table 2. Evaluation criteria of vehicle noise.
Evaluation1–45–678–910
Sound qualityVery poorOn the warning lineRelatively goodVery goodPerfect
Customer recognitionThe sound is badReluctantly acceptableIdentifiableLess identifiableCannot be heard
Table 3. Subjective evaluation scoring results table.
Evaluation PersonnelProfessional Evaluator 1Professional Evaluator 2DriverAverage
Score6.96.86.76.8
Table 4. Loads of each bearing hole in different directions under peak torque (unit: N).
Front Gearbox HousingXYZ
Position of the bearing hole at input end700.29250.200
Position of the bearing hole at intermediate end6020.851050.220
Position of the bearing hole at output end22,344.103005.54−21,555.11
Rear Gearbox HousingXYZ
Position of the bearing hole at input end3100.45−2000.828000.20
Position of the bearing hole at intermediate end−16,020.364000.6616,008.33
Position of the bearing hole at output end1500.69−29,9860
Table 5. Natural frequencies of gearbox housing.
OrdersNatural Frequencies
1st order437.2 Hz
2nd order605.8 Hz
3rd order965.2 Hz
Table 6. Natural frequencies of gearbox housing.
OrdersNatural Frequency after Optimization
1st order445.5 Hz
2nd order593.8 Hz
3rd order991.7 Hz
Table 7. Subjective evaluation scoring results table.
Evaluation PersonnelProfessional Evaluator 1Professional Evaluator 2DriverAverage
Score8.18.08.28.1
Disclaimer/Publisher’s Note: The statements, opinions and data contained in all publications are solely those of the individual author(s) and contributor(s) and not of MDPI and/or the editor(s). MDPI and/or the editor(s) disclaim responsibility for any injury to people or property resulting from any ideas, methods, instructions or products referred to in the content.

