Article

Particle Size Distribution and Feed Sorting of Hay-Based and Silage-Based Total Mixed Ration of Calabrian Dairy Herds

1
Department of Health Science, University “Magna Graecia” of Catanzaro, Viale Europa, 88100 Catanzaro, Italy
2
Department of Veterinary Medicine and Animal Production, University of Naples Federico II, 80137 Napoli, Italy
3
ATS Val Padana, Via dei Toscani, 46100 Mantova, Italy
*
Author to whom correspondence should be addressed.
Dairy 2024, 5(1), 106-117; https://doi.org/10.3390/dairy5010009
Submission received: 17 November 2023 / Revised: 28 December 2023 / Accepted: 5 January 2024 / Published: 15 January 2024
(This article belongs to the Section Dairy Animal Nutrition and Welfare)

Abstract

:
Dietary particle size is one of the most relevant factors influencing rumen function and the selection of the most palatable components of the total mixed ration (TMR) by cows. The aim of this study was to evaluate the particle size distribution (PSD), homogeneity, sorting level, physically effective NDF (peNDF) content of TMRs, and production performances in Calabrian commercial dairy herds in southern Italy. The research was conducted in 13 farms, including 8 with hay-based TMR and 5 with silage-based TMR. All herds delivered fresh feed once a day. At each farm, the TMRs were examined with the Penn State Particle Separator (PSPS) to determine PSD, homogeneity, and feed sorting at two time points (i.e., at fresh feed delivery = T0 and 24 h after feed delivery = Tf). None of the diets that were evaluated met the recommended PSD, showing an excess of long fraction, very short fraction, or both. The homogeneity was good except for three diets, but particle selection raised some concerns in 85% of the farms due to the preferential consumption of the very short fraction by the cows, with rejection of the long fractions. All the diets analyzed met the Penn State University recommended neutral detergent fiber (NDF) values (>28%) except for one farm’s diet. In three of the TMRs observed, however, the content of peNDF > 8 mm was less than 15%. NDF and peNDF > 8 mm values of TMRs showed statistically significant correlations with milk fat content. Therefore, it is important to evaluate the chemical and physical properties of TMR to provide a consistent diet and prevent feed sorting.

1. Introduction

Providing an adequate ration to dairy cows is one of the most important steps to consider in order to ensure the optimization of farms’ efficiency in terms of production levels and animal welfare [1,2].
A balanced combination of ingredients in ruminant diets is currently considered a vital factor in improving the quality and quantity of dairy production; in fact, it must also take feed size into consideration, as it appears to be co-responsible for changes in dry matter intake (DMI), milk yield (MY), and the prevention of subacute ruminal acidosis (SARA) [3].
The size of forage particles depends on many factors, some of which are related to the application of good crop production techniques (i.e., harvesting forages at the proper stage of maturity and correct length of chopping).
Although there are several studies on the influence of particle size on dairy cows’ production, their results in terms of the predictability of the effect of this specific parameter on animal performances are still inconsistent. Some authors [4,5] observed no effect of particle size on DMI and milk fat and protein content, while Krause and Combs [6] recorded a significant reduction in DMI and milk fat content when smaller forage particles were administered, and opposite results were observed by Keunen et al. [7].
A correct way to evaluate the particle size of the ration is to analyze not only the length of the individual ingredients but also the values given by the measurements carried out on the total mixed ration (TMR). TMR is a commonly used feeding practice in high-producing cows and provides for a high inclusion of concentrate in the early lactation stage to face the feeding requirements of animals, which most likely leads to an increase in the risk of SARA [8]. In this scenario, providing diets with adequate fiber content and length can help maintain a healthy ruminal environment, maximizing buffering capacity and thus mitigating the effects of low pH values. An adequate physically effective NDF (peNDF) value of the diet, indeed, ensures saliva production and stimulates chewing and rumen motility, thus reducing the risk of SARA [9,10] as particles longer than a critical size are responsible for rumen motility, whereas the pelleted or grounded diet have been shown to decrease the rumination times and to lower pH [3]. When the length of the forage particle is reduced. Indeed, the chewing time, acetate-to-propionate ratio, and pH also decrease, as well as fiber digestibility. This appears to also be negatively influenced by a high non-fibrous carbohydrate (NFC) to neutral detergent fiber (NDF) ratio of the diet, presumably due to the influence of fibers on the rumen environment and microbiota, especially on fibrolytic micro-organisms [8].
In addition, it has been shown that when lactating dairy cows induced with SARA are allowed to choose their diet, they prefer long alfalfa hay over alfalfa pellets, while the control group prefers the short particle diet [7]. However, simply adding grass hay or longer forage particles to an already prepared diet does not seem to have such a large effect on rumen motility and pH levels. Kmicikewycz and Heinrichs [8] indicated that offering additional hay or longer forage to dairy cows fed starch-rich diets determined a minimal response in rumen pH and DMI. These results highlight the importance of preparing a proper TMR formulation in terms of ingredients and particle size, challenging dairy nutritionists to formulate diets that maintain high DMI, good performance, and quality without compromising rumen health.
A practical tool to achieve such goals is the Penn State Particle Separator (PSPS), developed for rapid and accurate estimation of particle size in both TMR and forages [11]. In the configuration proposed by Lammers et al. [9], the PSPS is composed of 19 and 8 mm diameter plastic sieves and a bottom pan, but most recent versions include an additional sieve with 1.18 or 4 mm holes [12]. The sieves are stacked by placing those with the largest holes on top and then gradually those with the smallest holes. Once a defined amount of TMR has been placed on top of the PSPS, it should be shaken, and after several shakes, the material collected on each sieve should be weighed [13]. Although the fraction collected by the 4 mm sieve is considered useful in producing a small but significant rumination stimulus in the dairy cow, the use of the 2-sieve PSPS is still very common [6]. On the contrary, the fraction retained by the 1.18 mm sieve, considered by Mertens to be physically effective for dairy cows at maintenance intakes, is no longer considered accurate for estimating peNDF for high-producing dairy cows [12].
The aim of the present study was to evaluate how particle size distribution and TMR selection can influence peNDF values and production performances in dairy cows at different farms in Calabria (Italy), analyzing diets by PSPS for the measurement of both homogeneity and level of diet selection.

2. Materials and Methods

2.1. On-Farm Data Collection

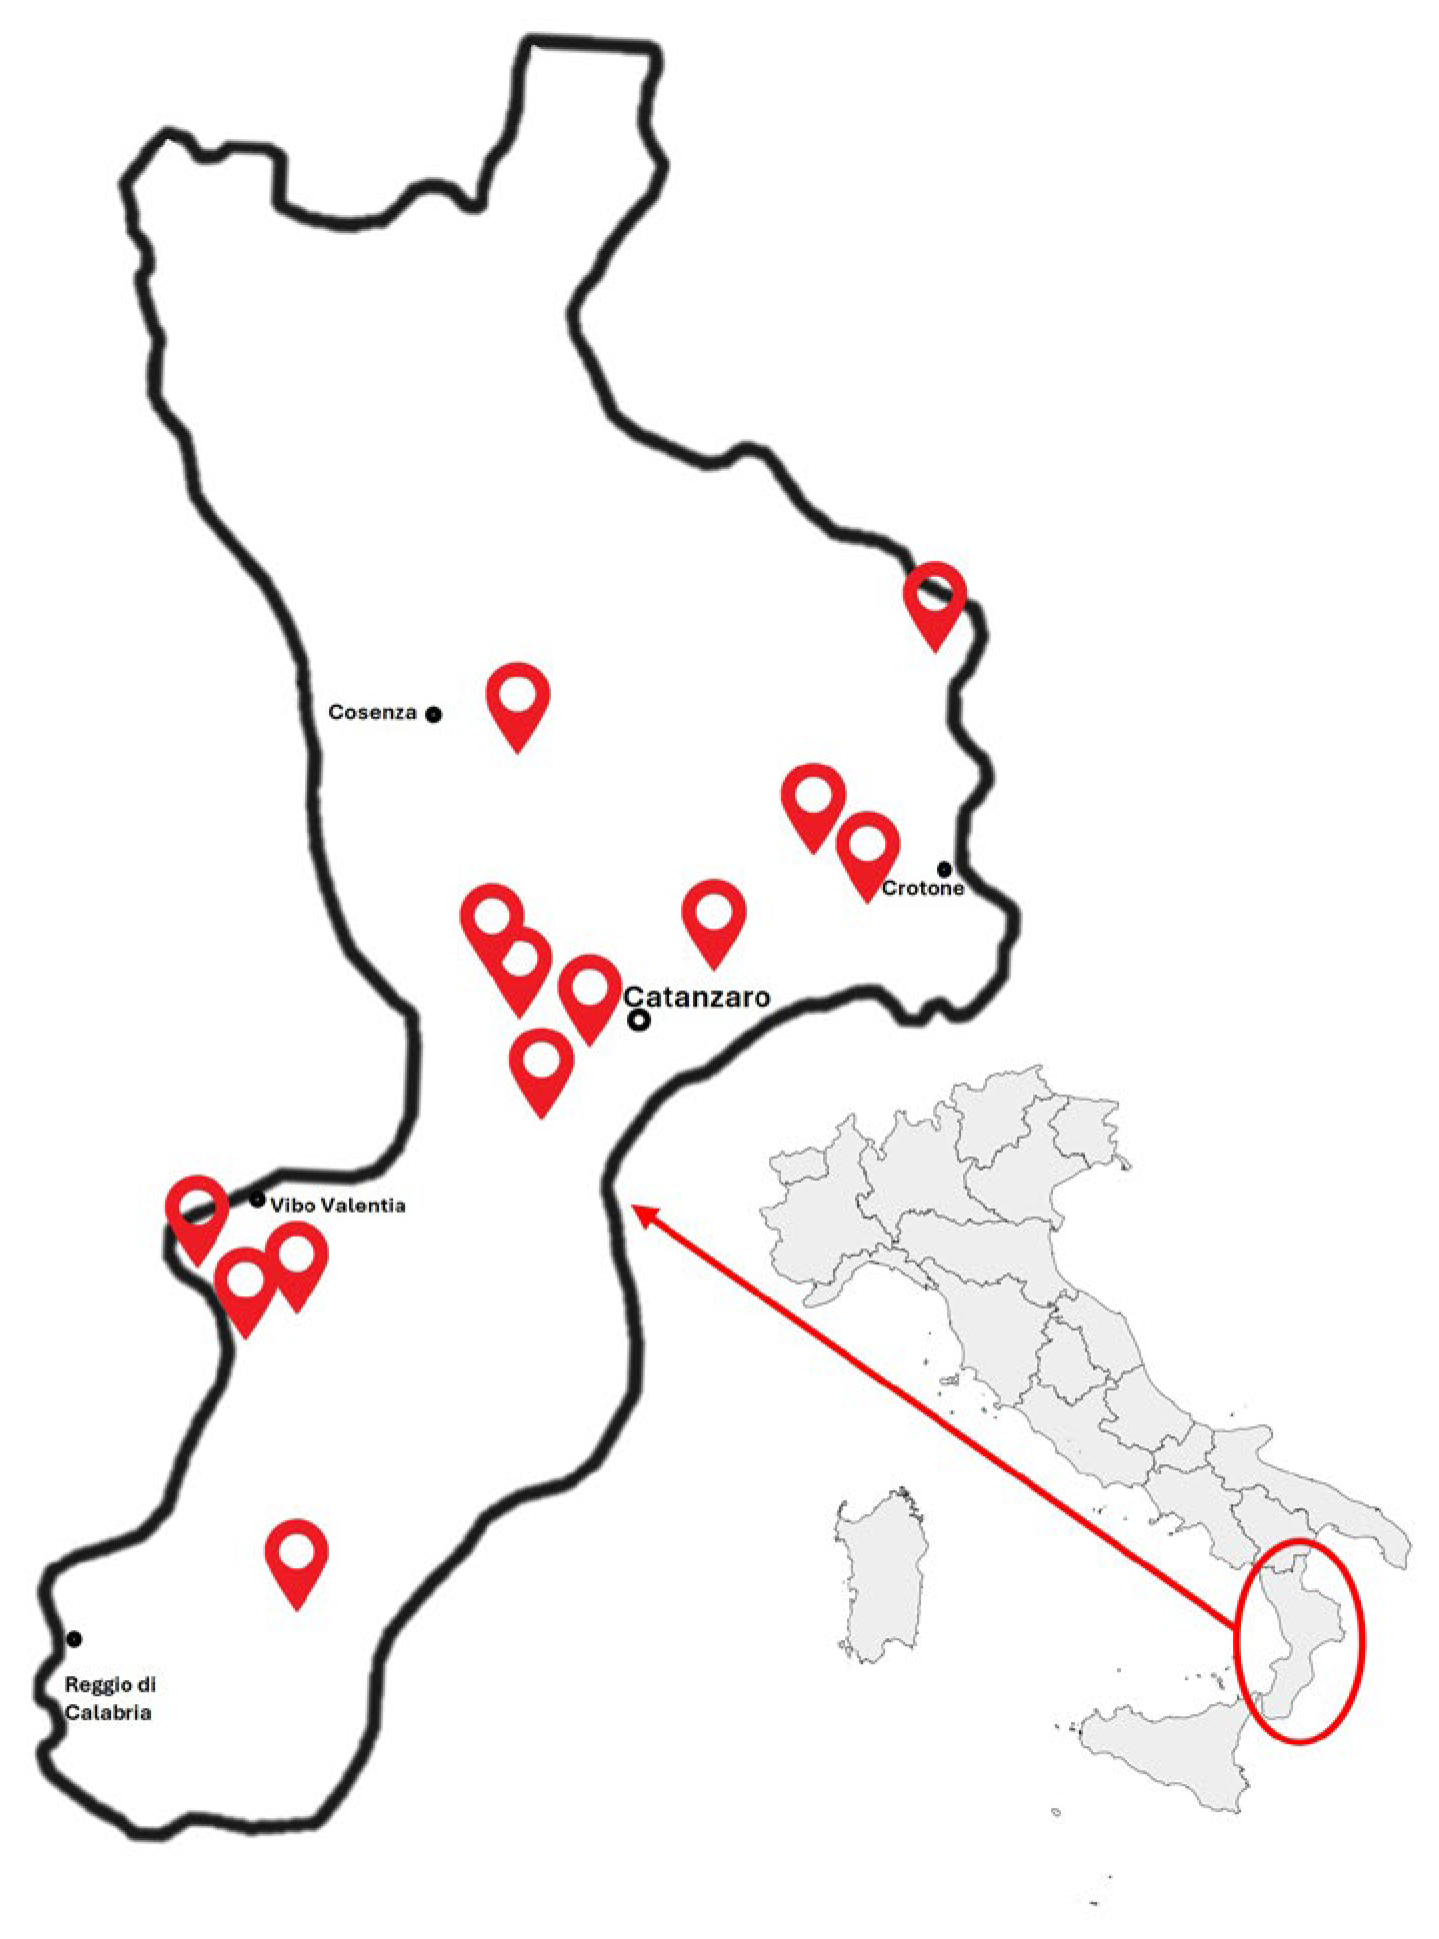
The research was conducted in 13 commercial dairy farms located in Calabria (Italy) between October 2020 and February 2021 (Figure 1). The suitability criteria for choosing these farms were mainly the use of the TMR system in cow nutrition, type of intensive farming, size of the lactating herd >30 cows, and location in the Calabria region (southern Italy). Farms that met these criteria and had expressed interest in participating were enrolled. Observations were limited to the group of cows with the highest milk production, with uniform distribution of DIM and parity of calving (multiparous).
During the first visit, a questionnaire was administered by the same operator in all companies to determine the management of the farm and of the feeding systems. All herds delivered fresh feed once a day.

2.2. PSD, Homogeneity, and Selection Measurement

On the day of the sample collection, the composition of the TMR was recorded (see Supplemental Materials). Of the 13 farms, 8 administered hay (TMR-H), and 5 administered silages (TMR-S) as the predominant forage base. All diets in the TMR-H group were prepared by adding water in the mixing wagon (8.0 ± 2.4 L), while in the TMR-S group, the addition of water as an ingredient was absent or occurred in smaller amounts (2.2 ± 2.3 L).
The amount of TMR delivered was calculated by recording the initial weight of the TMR scale and subtracting misstatements after the feed was delivered to the cows. Samples of fresh and refusal TMR were collected immediately upon delivery (T0) and approximately 24 h after delivery (Tf), respectively. In both these time points, TMR was sampled from 3 different points, at the beginning (S1), in the middle (S2), and at the end (S3) of the feeding alley (300 g per point), so that a total of 78 samples, 6 for each farm, were analyzed.
To evaluate the particle size distribution (PSD), all samples were analyzed on an as-fed basis with a Penn State Particle Separator (PSPS) [14] with a horizontal sieving frequency of 1.1 Hz or approximately 1.1 shakes per second. PSPS separated the samples into 4 fractions: long (>19 mm), medium (8–19 mm), short (4–8 mm), and very short (<4 mm, bottom pan) particles; after each fraction was weighed, its percentage on total sample weight was calculated.
The homogeneity and selection of TMRs were assessed by comparing the PSD among the three points of the alley (S1-S2, S1-S3, and S2-S3) and between the two time points (T0-Tf), respectively. Homogeneity was considered good, and the degree of selection was tolerable if differences between T0 and Tf or S1-S2, S1-S3, and S2-S3 were less than 3–5% for each class of particles [12].

2.3. Laboratory Analysis

After PSD evaluation, each of the 78 TMR samples was sealed in a plastic bag and transported to the Laboratory of Feed Analysis of Catanzaro University. For the determination of DM and NDF content, samples were oven-dried at 65 °C for 48 h and then ground to pass through a 1 mm screen (Retsch SM 100, Retsch GmbH Company, Haan, Germany).
The DM content was obtained according to the EU official method (Reg EC 152/2009); NDF was analyzed using a Velp fiber analyzer (FIWE 6) (VELP Scientifica, Usmate Velate, Italy) according to the amylase-treated, ash-corrected NDF (aNDFom) method recommended by Van Soest et al. [13]. The content of peNDF > 4 mm and peNDF > 8 mm was estimated by multiplying the NDF content of the ration, expressed on a DM basis, by the sum of the % of TMR retained by the three sieves (19 mm, 8 mm, and 4 mm) and the two sieves (19 mm, 8 mm) of the PSPS, respectively [15].
During the questionnaire, the milk production of the observed groups was reported. For milk analysis, 2 samples of 50 mL of milk were taken from the collection tank after stirring and transferred to the analysis laboratory at refrigeration temperature.
In the laboratory, the milk was aliquoted and processed as indicated by Spina et al. [16] via FOSS MilkoScan FT+. This instrument analyzes the chemical composition of milk according to the standards of the International Dairy Federation (FIL-IDF) using FT technology in the mid-infrared spectral range. Specifically, the parameters read were: Fat (%), Protein (%), Lactose (%), Cryoscopy (m °C), Casein (%), Urea (mg/dL), BHB (mM), Acetone (mM), pH, A30, K20, and r.

2.4. Statistical Analysis

All statistical analyses were performed by GraphPad PRISM version 9.2.0 for Windows, GraphPad software, La Jolla, CA, USA.
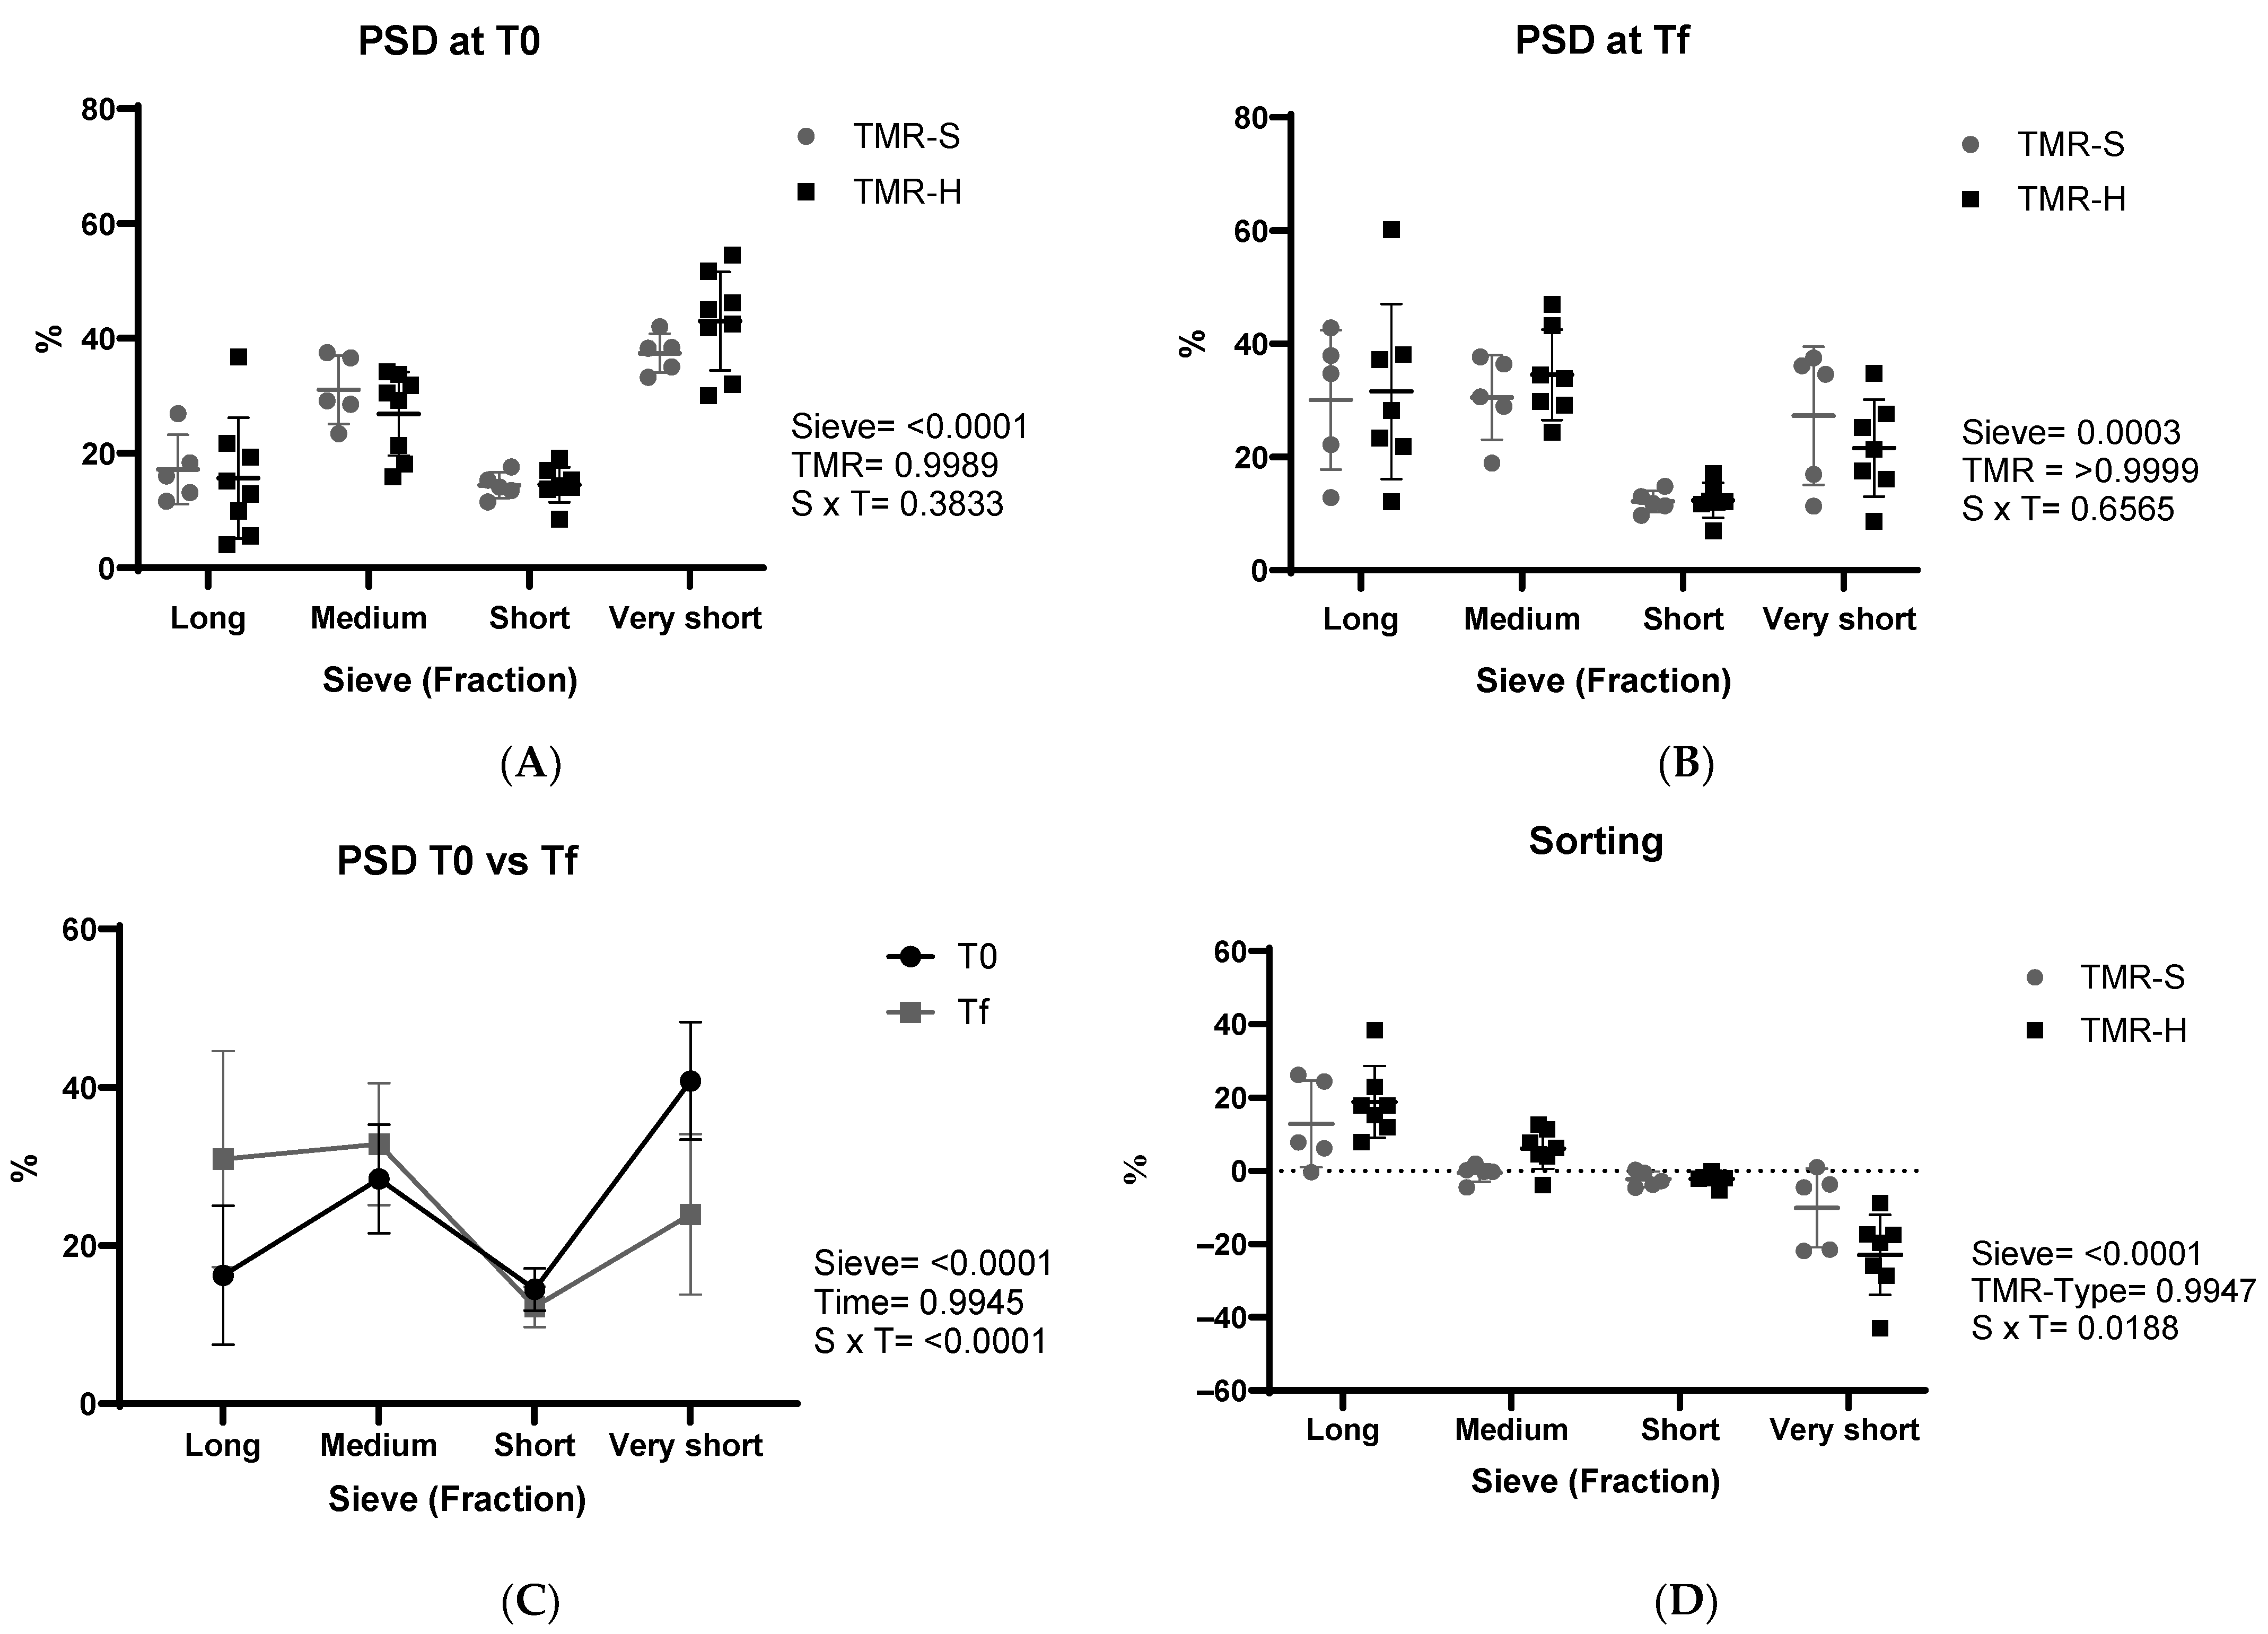
The PSD was elaborated with a linear mixed-effects model for repeated measures. The model included the effects of the type of TMR (TMR-Ty: with silage, TMR-S; with hay, TMR-H) and the Time (before the feeding, T0; 24 h after feeding, Tf) as fixed effects and the interaction between TMR-Ty and Time (TMR-Ty × Time). In another case, the model included the effect of the Sieve fractions (upper sieve > 19 mm, %; medium sieve 8–19 mm, %; lower sieve 4–8 mm, %; bottom pan < 4 mm, %), the Time (before the feeding, T0; 24 h after feeding, Tf), and the interaction between Sieve and Time as fixed effects. When not significant, the effect of the interaction was removed from the model. Šídák’s multiple comparisons test was used to evaluate the differences between the averages.
The significance threshold was set at p < 0.05, while values of p < 0.10 were considered tendentially significant.
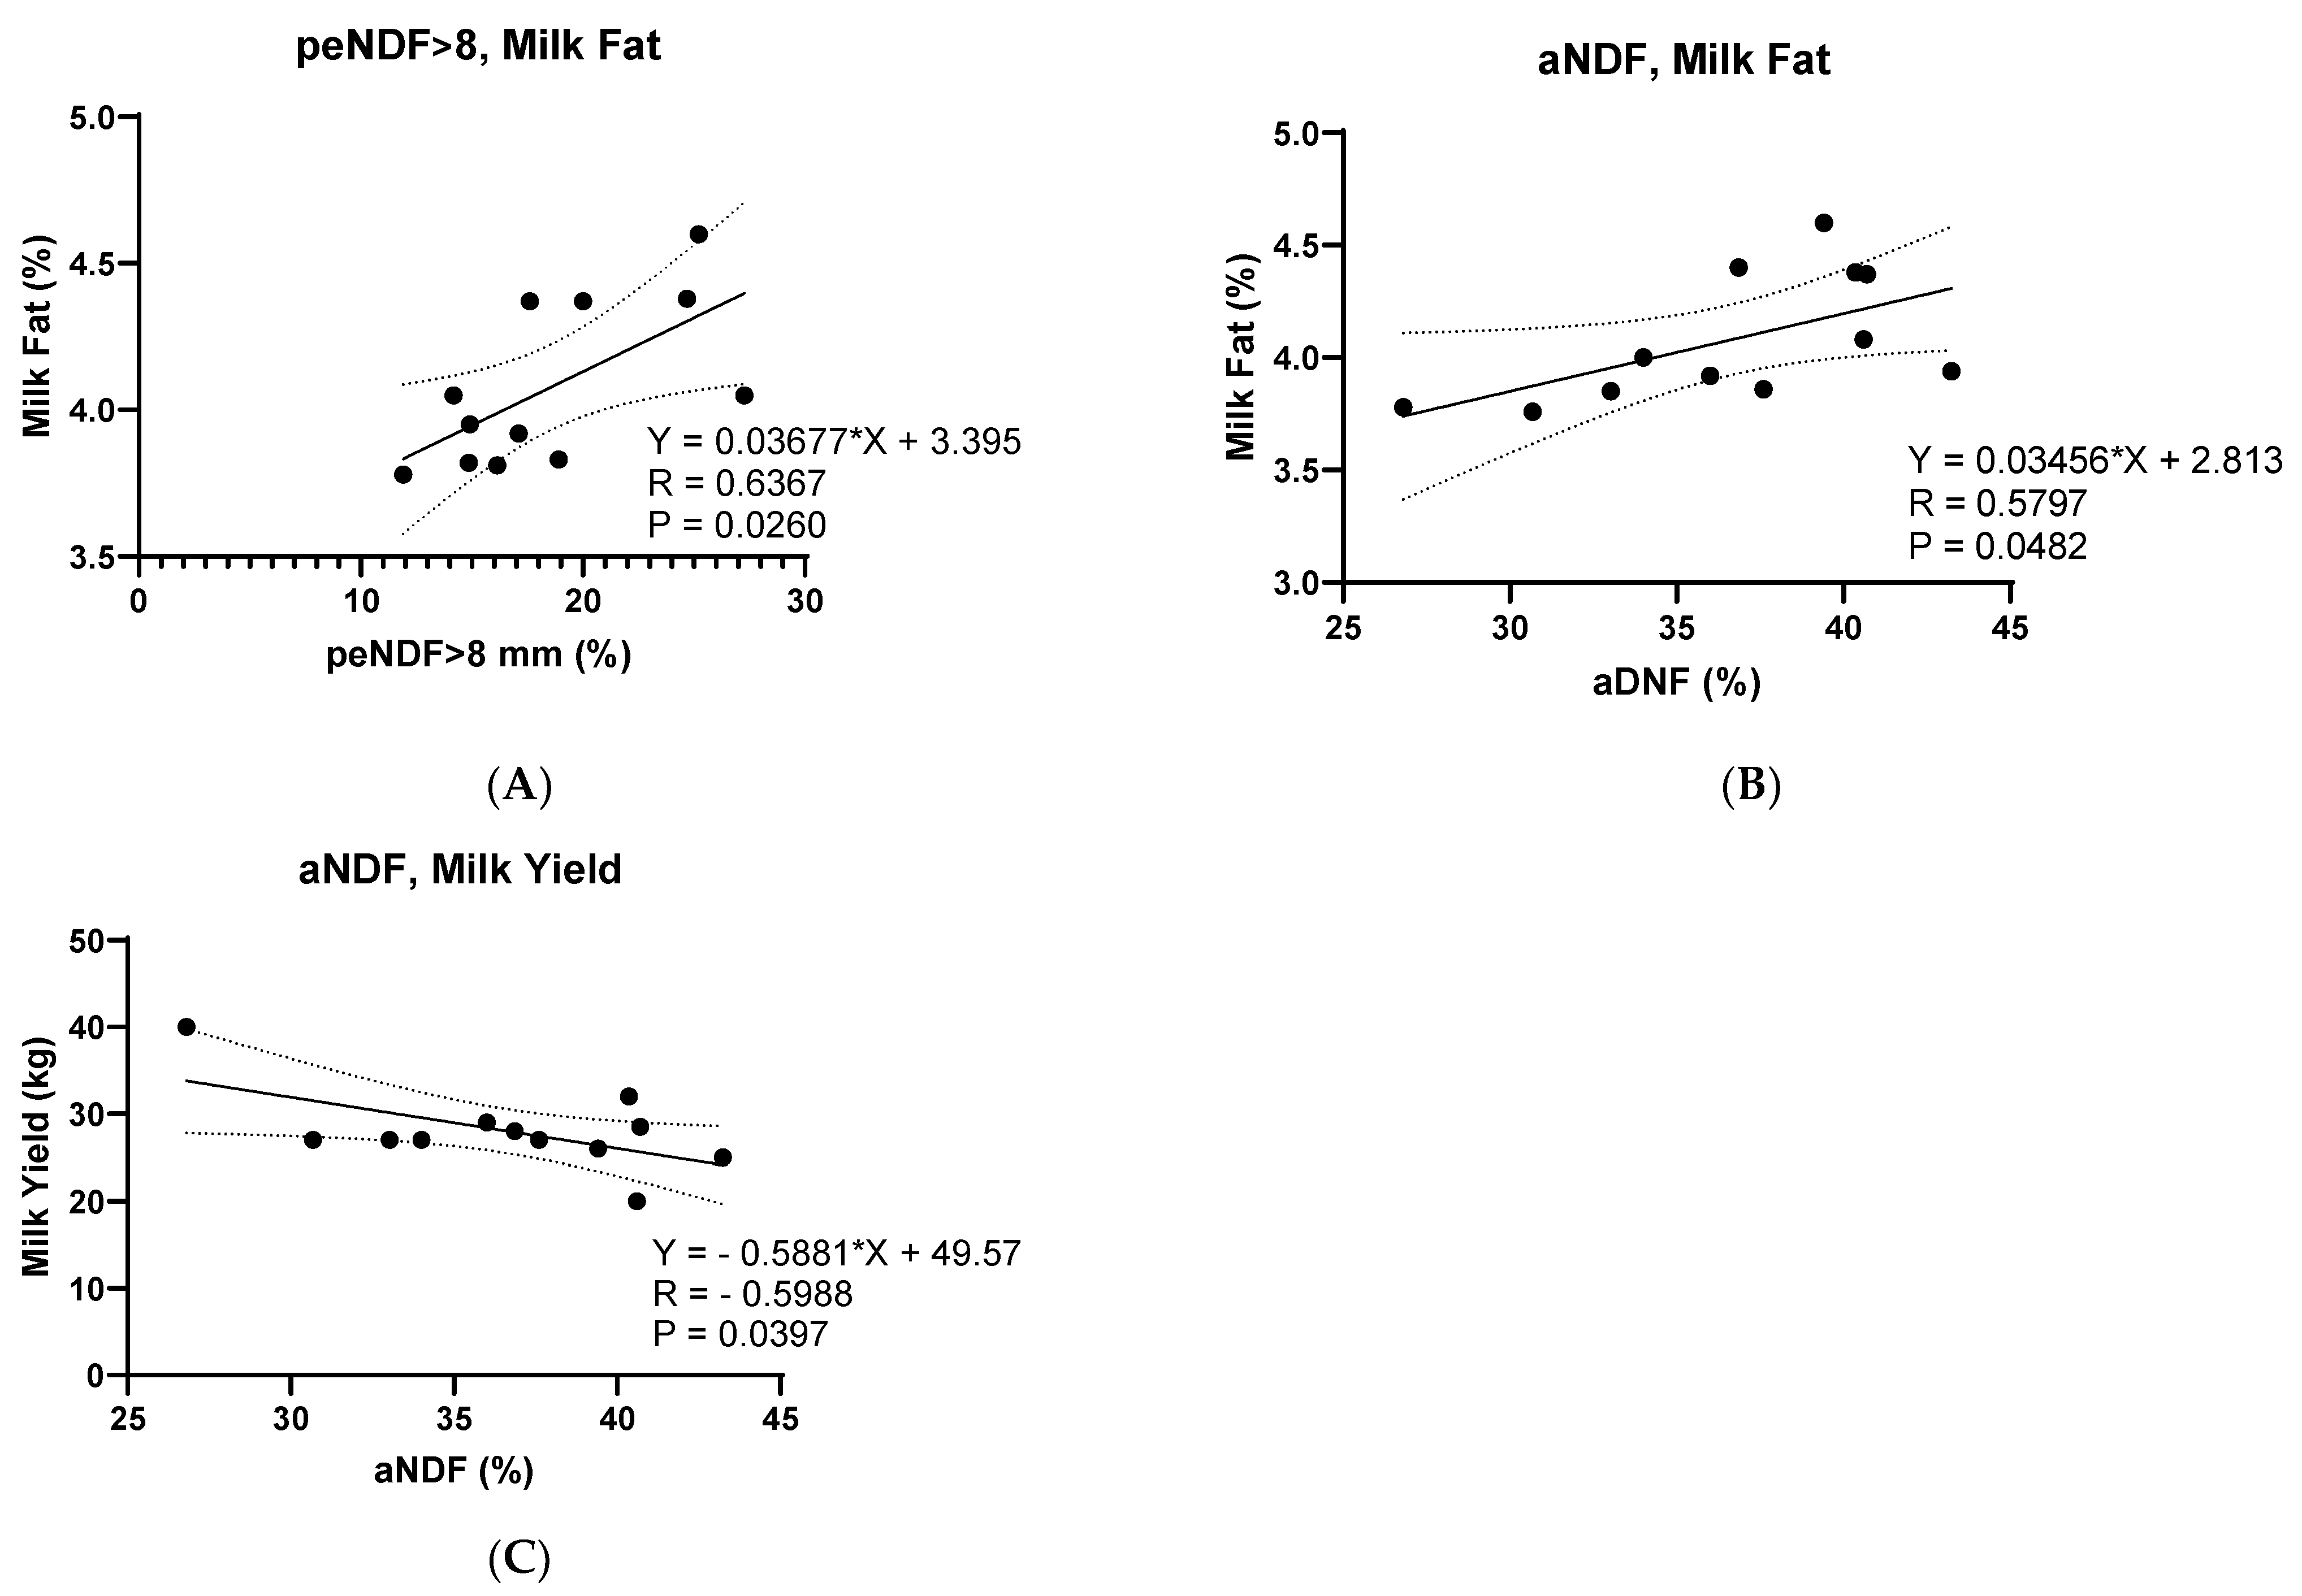
Simple correlations were determined for concentrations of aNDFom (%), peNDF > 8 mm (%), peNDF > 4 mm (%), and milk parameters: yield (kg), fat (%), protein (%), casein (%), lactose (%), urea (mg/dL), BHB (mM), and acetone (mM).

3. Results

3.1. Particle Size of TMR and Feed Sorting

The values of the c hemical characteristics of TMRs were reported in Table 1.
The results of the particle size distribution (PSD) obtained by sieving the TMRs with the PSPS system are shown in Table 2 and Figure 2A for T0 and in Table 3 and Figure 2B for Tf, together with the reference ones recommended by [13]. By comparing each sample with the reference values, it can be seen that no company strictly respected the guidelines for a good PSD. For farms producing silage-based TMRs, an excess of the longest fraction was observed, which, in three cases (TMR-S 1, 2, and 4), was considerable and was at the expense of the subsequent fraction. Considering that TMR-S 1 also showed an excess of short and very short fractions, it can be considered that this was the least compliant case of all the samples to the guidelines. Instead, TMR-S 3 and 5 came remarkably close to the standard. As regards the TMR-H group, only TMR-H 2 and 7, except from a slight excess of the shortest fraction, can be defined as “in order” with good chopping criteria.
In the remaining 6 cases, an excess of the longest fraction was noted, and consequently, the medium fraction was poor (TMR-H 1, 4, and 6) or toward the lower limit of the class (TMR-H 3, 5, and 8). This trend occurred both for T0 (Table 2) and for Tf (Table 3). No statistical difference was found between the two types of TMR at both experimental times (TMR-S vs. TMR-H, Figure 2A,B).
The pre- and post-feeding proportion of the middle and bottom sieve fractions did not differ significantly between T0 and Tf (Table 4 and Figure 2C). Instead, the proportion of the very short particle size fraction was significantly reduced in Tf while the proportion of longer particles increased (Table 4 and Figure 2C).
The degree of selection was considered tolerable and homogeneity good if differences T0-Tf or S1-S2, S1-S3, and S2-S3 were less than 3–5% for each class of particles, as indicated by [12]. As reported in Table 5, the homogeneity of the TMR prepared in 10 farms was good, while in 3 farms (TMR-S 1 and 4, and TMR-H 6), it was out of range.
The degree of selection (Table 6) was assessed by measuring the difference between the values obtained from the sieving of the refusal (Tf) and those from the freshly distributed feed (T0).
Generally, in the absence of sorting, the difference between the particle size distribution observed at Tf on the refusals and that measured at the time of unloading in the lane (T0) should be zero. The greater the deviation between Tf and T0, in absolute value, the greater the degree of selection carried out by the cows. Furthermore, for a given fraction, positive sorting values indicate “rejection”, while negative values indicate greater consumption linked to greater palatability. In general, feed sorting raised some concerns in 85% of farms due to preferential consumption of the very short fraction by cows, with a decrease in this more palatable component associated with selective refuse of the coarser fraction. As reported in Table 6 and Figure 2D, in TMR-S 4 and 5 and in TMR-H 6, there was a notable selection of the very short fractions and a simultaneous discarding of the longer fractions. The same phenomenon, although in a more attenuated way, was observed in the TMR-S 1 and 2. In the TMR-H 4, the selection was not measured as at Tf; the feed trough was found to be completely empty.
The neutral detergent fiber (aNDFom) content of all samples ranged from 26 to 44% DM with considerable variability (Table 7 and Figure 3). As regards the peNDF values detected during our investigation and measured with the two sieves (peNDF > 8 mm), the range of values fluctuates between 11% and 29%. Instead, the peNDF values measured with the three sieves (peNDF > 4 mm) were between 14 and 30% DM.
TMR refusals 24 h after ration distribution (Tf) contained a significantly higher level of peNDF > 8 mm (p = 0.02) and peNDF > 4 mm (<0.0001) compared to those of T0, while they tended to have higher levels of aNDFom (p = 0.08). The type of TMR (TMR-Ty) and the TMR-Ty × Time interaction were never significant.

3.2. Correlation between TMR Components and Nutritional Composition of Milk

Table 8 lists the main correlations examined. No significant correlations were observed between aNDFom, peNDF > 8 mm, peNDF > 4 mm, and milk components, with the exception of aNDFom and milk yield (Figure 3C), which were found to be negatively correlated; in addition, a positive correlation was observed between both peNDF > 8 mm and milk fat (Figure 3A) and aNDFom and milk fat (Figure 3B).
However, trends toward significance were noted between aNDFom and peNDF > 8 mm with acetone, where there was a positive correlation; and peNDF > 8 mm and peNDF > 4 mm with lactose, where a negative correlation was observed.

4. Discussion

The constant monitoring of the composition of the TMR, not only of the individual ingredients but also of the PSD, could be useful for good nutrition management and for the well-being of the herd [17]. Variations in the physical form of TMR can cause problems with livestock health and cow profitability [18]. As expected, in our study, the TMR physical form showed high variation among the observed dairy herds. The differences in the percentage of forage, the botanical characteristics of the forages, the type of concentrate, mixing time, and the type of mixer used account for this variability [19].
The TMRs in this study generally did not meet the particle size distribution recommended by [14]. The excess particle size fractions were mainly the long and very short ones. An excess of particles > 19 mm can favor sorting, as reported in previous studies [9,10]. In fact, cows show a preference for smaller parts of the diet, which are richer in starch and more palatable [20,21,22]. However, some studies indicate that cows, in some cases, may shift their preference toward longer particles to meet their peNDF needs [9,10,11]. The results we observed are comparable to those reported by other authors [6,10] and confirm that cows preferentially consume small particles of starchy feeds (abundant in the bottom pan) and discard those richer in fiber [23], which are abundant in the first sieve (greater than 19 mm).
An explanation for our results on PSD in all TMRs observed in this study could be due to the nature of the forage that is used in Calabria. In fact, the forage of southern Italian dairy farms is typically a mixture of hay and silage, especially triticale, sorghum, or corn silage. The hay, which is long and composed of mature grass, with a DM of around 85% and a crude ash content of around 11%, is typically harvested once around the month of May by farmers [24]. Therefore, on these Calabrian dairy farms, the practice is to add forage to the mixer wagon as long material, which yields a longer size than typical chopped or ground hay. The consequence is that the particle size of TMRs tends to be coarser, and total NDF tends to be higher than observed on US dairy farms [25]. Another hypothesis could be linked to the unsuitable quality of the mixer wagon, for example, in the case of non-performing blades [26].
The values above 8% in the first sieve favor the process of selection against long particles, leading to reductions in NDF and physically effective NDF (peNDF) intakes [27]. Homogeneity was good, so the particle size distributions of the samples along the feed bunk were similar between the three different sampling points (beginning, middle, and end of the feeding lane). This aspect indicated that the TMRs were adequately mixed and discharged homogeneously from the beginning to the end of the feed bunk. These results are also in agreement with another similar study carried out in Mexico on TMR for dairy cattle [28]. We conducted our investigation only in the autumn and winter months (from October to February) and did not evaluate the PSD of TMRs also prepared in spring/summer. According to Arzola-Álvarez et al. [28], in fact, the TMRs prepared in the month of April had a higher content of long fractions (>19 mm, upper sieve) compared to the months of May, June, July, and October, which instead did not differ from each other. However, fractions of 8 to 1.18 mm were larger in October than in August and May [28]. Presumably, changes in forage composition caused by seasons also influence the particle size distribution of TMRs.
Regarding the NDF content, all the TMRs we observed respected the minimum NDF values indicated by the NRC [29]. However, the Penn State guidelines formulated based on the productivity of the flock report more restrictive reference values in terms of fiber requirements: even for high-producing animals, the NDF content should not fall below the threshold of 28%. This aspect would lead to the inference that a sample farm (TMR-S 1), being close to the aNDF content limit (27%) and having not respected the PSD interval, may not satisfy the aNDF needs of the cows.
The selection could also have negative repercussions on the adequate ingestion of NDF: in the case of TMR-H 2, even in the presence of a diet with approximately 30% NDF, due to the greater consumption of the very short fraction and the refusals of longer fraction, it is possible that the cows consumed insufficient NDF.
However, some authors indicate that it is the level of peNDF rather than that of NDF that represents a more reliable index in the prevention of the risk of acidosis, finding a high correlation (r = 0.75) between ruminal pH and peNDF measured with the first two PSPS sieves (peNDF > 8 mm) [3,14]. Zebeli et al. [18] indicate how the high risk of acidosis derives from the concomitance of peNDF > 8 mm less than 15% and diets rich in highly fermentable carbohydrates. However, there is no risk of acidosis for diets with peNDF > 8 mm above 18%, regardless of the concentrate content.
According to these authors, half of the TMRs in our study would have protection from the SARA risk [30]. The remaining part, especially in case of inhomogeneity or selection, would be in situations of more or less high risk in relation to the lowering of peNDF > 8 mm of the diet actually consumed and its fermentable carbohydrate content [31]. Feed sorting can also influence the time course of feed consumption. In fact, some studies [9,16] have associated greater selection toward long particles in the ration with a slower feed intake rate (R2 = 0.57). In particular, in situations where cattle have spent a long time selecting a feed, this has limited their ability to maximize their intake. This phenomenon could have negative repercussions, together with the peNDF values of the diet, on milk production.
An interesting observation from our study concerned the significant correlations between aNDFom and peNDF > 8 mm levels with milk yield. Increasing both the production and composition of milk is the best outcome of good management practices on dairy farms. This study suggests that an increase in fat percentage could be achieved by increasing the proportion of aNDFom and peNDF > 8 mm in the TMR.
The increase in milk fat in diets rich in peNDF > 8 mm is probably due to various factors, such as increased chewing activity, increased ruminal fermentation and acetate production, and decreased trans fatty acid and propionate formation. All these factors increase milk fat production [18]. The limitation of the present investigation concerns the limited temporal observations carried out. In fact, in the future, the study should be deepened by carrying out measurements on several consecutive days and at several times during the day, not just T0 and Tf.

5. Conclusions

The particle size distribution observed in dairy cow rations at Calabrian farms does not meet current guidelines based on American forages and rations, being too rich in long particles and, in a smaller number of cases, in very short particles. Furthermore, the degree of selection recorded in most of the herds was also a cause for concern, especially if associated with the high use of concentrates, which could represent a potential risk for SARA. Finally, the present study showed how monitoring the aNDFom, and the peNDF content of the TMR could be useful in improving the milk fat content.

Supplementary Materials

The following supporting information can be downloaded at https://www.mdpi.com/article/10.3390/dairy5010009/s1. The main ingredients of each diet for cows high production.

Author Contributions

Conceptualization, A.A.S. and V.M.M.; methodology, A.A.S., N.P. and V.M.M.; software, V.M.M.; validation, A.A.S., V.M.M. and P.I.; formal analysis, A.A.S., P.I. and N.P.; investigation, A.A.S., A.R.M. and V.M.M.; resources, D.B.; data curation, A.A.S. and V.M.M.; writing—original draft preparation, A.A.S.; writing—review and editing, P.I., A.R.M. and V.M.M.; visualization, V.M.M. and G.P.; supervision, V.M.M. and D.B.; project administration, V.M.M.; funding acquisition, D.B. All authors have read and agreed to the published version of the manuscript.

Funding

This research received no external funding.

Institutional Review Board Statement

Ethical review and approval for this study were waived as only foods/feeds were sampled. Animals were not involved.

Informed Consent Statement

Not applicable.

Data Availability Statement

Data is contained within the article or supplementary material.

Acknowledgments

The authors thank Anselmo Poerio and Mario Di Pasquale for the technical support and for the help in the sampling.

Conflicts of Interest

The authors declare no conflicts of interest.

References

  1. Stone, W.C. Nutritional Approaches to Minimize Subacute Ruminal Acidosis and Laminitis in Dairy Cattle. J. Dairy Sci. 2004, 87, E13–E26. [Google Scholar] [CrossRef]
  2. Mastellone, V.; Musco, N.; Infascelli, F.; Scandurra, A.; D’Aniello, B.; Pero, M.E.; Iommelli, P.; Tudisco, R.; Lombardi, P. Higher forage:concentrate ratio and space availability may favor positive behaviors in dairy cows. J. Vet. Behav. 2022, 51, 16–22. [Google Scholar] [CrossRef]
  3. Schadt, I.; Ferguson, J.D.; Azzaro, G.; Petriglieri, R.; Caccamo, M.; Van Soest, P.; Licitra, G. How do dairy cows chew?—Particle size analysis of selected feeds with different particle length distributions and of respective ingested bolus particles. J. Dairy Sci. 2012, 95, 4707–4720. [Google Scholar] [CrossRef] [PubMed]
  4. Bhandari, S.K.; Ominski, K.H.; Wittenberg, K.M.; Plaizier, J.C. Effects of Chop Length of Alfalfa and Corn Silage on Milk Production and Rumen Fermentation of Dairy Cows. J. Dairy Sci. 2007, 90, 2355–2366. [Google Scholar] [CrossRef] [PubMed]
  5. Tafaj, M.; Zebeli, Q.; Baes, C.; Steingass, H.; Drochner, W. A meta-analysis examining effects of particle size of total mixed rations on intake, rumen digestion and milk production in high-yielding dairy cows in early lactation. Anim. Feed Sci. Technol. 2007, 138, 137–161. [Google Scholar] [CrossRef]
  6. Piran Filho, F.A.; Bragatto, J.M.; Parra, C.S.; Silva, S.M.S.; Roco, P.J.; Ferraretto, L.F.; Pereira, M.N.; Daniel, J.L.P. Physical effectiveness of corn silage fractions stratified with the Penn State Particle Separator for lactating dairy cows. J. Dairy Sci. 2023, 106, 6041–6059. [Google Scholar] [CrossRef] [PubMed]
  7. Keunen, J.E.; Plaizier, J.C.; Kyriazakis, L.; Duffield, T.F.; Widowski, T.M.; Lindinger, M.I.; McBride, B.W. Effects of a Subacute Ruminal Acidosis Model on the Diet Selection of Dairy Cows. J. Dairy Sci. 2002, 85, 3304–3313. [Google Scholar] [CrossRef] [PubMed]
  8. Kmicikewycz, A.D.; Heinrichs, A.J. Effect of corn silage particle size and supplemental hay on rumen pH and feed preference by dairy cows fed high-starch diets1. J. Dairy Sci. 2015, 98, 373–385. [Google Scholar] [CrossRef]
  9. Lammers, B.P.; Buckmaster, D.R.; Heinrichs, A.J. A Simple Method for the Analysis of Particle Sizes of Forage and Total Mixed Rations. J. Dairy Sci. 1996, 79, 922–928. [Google Scholar] [CrossRef]
  10. Mertens, D.R. Creating a System for Meeting the Fiber Requirements of Dairy Cows. J. Dairy Sci. 1997, 80, 1463–1481. [Google Scholar] [CrossRef]
  11. Khan, M.A.; Weary, D.M.; von Keyserlingk, M.A.G. Invited review: Effects of milk ration on solid feed intake, weaning, and performance in dairy heifers. J. Dairy Sci. 2011, 94, 1071–1081. [Google Scholar] [CrossRef] [PubMed]
  12. Heinrichs, J.; Kononoff, P. The Penn State Particle Separator; DSE: University Park, TX, USA, 2013; Volume 186, pp. 1–8. [Google Scholar]
  13. Heinrichs, P.J.; Jones, C.M. The Forage and TMR particle separator was designed to help in determining the correct forage particle length needed to improve ruminant nutrition. Coop. Ext. 2016, 38, 1–16. [Google Scholar]
  14. Kononoff, P.J.; Heinrichs, A.J.; Buckmaster, D.R. Modification of the Penn State Forage and Total Mixed Ration Particle Separator and the Effects of Moisture Content on its Measurements. J. Dairy Sci. 2003, 86, 1858–1863. [Google Scholar] [CrossRef] [PubMed]
  15. Zebeli, Q.; Aschenbach, J.R.; Tafaj, M.; Boguhn, J.; Ametaj, B.N.; Drochner, W. Invited review: Role of physically effective fiber and estimation of dietary fiber adequacy in high-producing dairy cattle. J. Dairy Sci. 2012, 95, 1041–1056. [Google Scholar] [CrossRef] [PubMed]
  16. Spina, A.A.; Ceniti, C.; Piras, C.; Tilocca, B.; Britti, D.; Morittu, V.M. Mid-infrared (MIR) spectroscopy for the detection of cow’s milk in buffalo milk. J. Anim. Sci. Technol. 2022, 64, 531–538. [Google Scholar] [CrossRef] [PubMed]
  17. Sova, A.D.; LeBlanc, S.J.; McBride, B.W.; DeVries, T.J. Accuracy and precision of total mixed rations fed on commercial dairy farms. J. Dairy Sci. 2014, 97, 562–571. [Google Scholar] [CrossRef] [PubMed]
  18. Esmaeili, M.; Khorvash, M.; Ghorbani, G.R.; Nasrollahi, S.M.; Saebi, M. Variation of TMR particle size and physical characteristics in commercial Iranian Holstein dairies and effects on eating behaviour, chewing activity, and milk production. Livest. Sci. 2016, 191, 22–28. [Google Scholar] [CrossRef]
  19. Kronqvist, C.; Petters, F.; Robertsson, U.; Lindberg, M. Evaluation of production parameters, feed sorting behaviour and social interactions in dairy cows: Comparison of two total mixed rations with different particle size and water content. Livest. Sci. 2021, 251, 104662. [Google Scholar] [CrossRef]
  20. DeVries, T.J.; Holtshausen, L.; Oba, M.; Beauchemin, K.A. Effect of parity and stage of lactation on feed sorting behavior of lactating dairy cows. J. Dairy Sci. 2011, 94, 4039–4045. [Google Scholar] [CrossRef]
  21. Miller-Cushon, E.K.; DeVries, T.J. Feed sorting in dairy cattle: Causes, consequences, and management. J. Dairy Sci. 2017, 100, 4172–4183. [Google Scholar] [CrossRef]
  22. Gao, X.; Oba, M. Characteristics of dairy cows with a greater or lower risk of subacute ruminal acidosis: Volatile fatty acid absorption, rumen digestion, and expression of genes in rumen epithelial cells. J. Dairy Sci. 2016, 99, 8733–8745. [Google Scholar] [CrossRef] [PubMed]
  23. Leonardi, C.; Shinners, K.J.; Armentano, L.E. Effect of Different Dietary Geometric Mean Particle Length and Particle Size Distribution of Oat Silage on Feeding Behavior and Productive Performance of Dairy Cattle. J. Dairy Sci. 2005, 88, 698–710. [Google Scholar] [CrossRef] [PubMed]
  24. Ceniti, C.; Costanzo, N.; Spina, A.A.; Rodolfi, M.; Tilocca, B.; Piras, C.; Britti, D.; Morittu, V.M. Fungal Contamination and Aflatoxin B1 Detected in Hay for Dairy Cows in South Italy. Front. Nutr. 2021, 8, 704976. [Google Scholar] [CrossRef] [PubMed]
  25. Caccamo, M.; Ferguson, J.D.; Veerkamp, R.F.; Schadt, I.; Petriglieri, R.; Azzaro, G.; Pozzebon, A.; Licitra, G. Association of total mixed ration particle fractions retained on the Penn State Particle Separator with milk, fat, and protein yield lactation curves at the cow level. J. Dairy Sci. 2014, 97, 2502–2511. [Google Scholar] [CrossRef] [PubMed]
  26. Wang, T.; Wen, B.; Kan, Z.; Li, J. Wear behavior of different materials applied on horizontal mixer blades used in the processing of total mixed rations. Trans. ASABE 2019, 62, 1743–1753. [Google Scholar] [CrossRef]
  27. Carneiro, J.H.; Dos Santos, J.F.; de Almeida, R. Accuracy and physical characteristics of total mixed rations and feeding sorting behavior in dairy herds of Castro, Paraná. Rev. Bras. Zootec. 2021, 50, e20200174. [Google Scholar] [CrossRef]
  28. Arzola-Álvarez, C.; Bocanegra-Viezca, J.A.; Murphy, M.R.; Salinas-Chavira, J.; Corral-Luna, A.; Romanos, A.; Ruíz-Barrera, O.; Rodríguez-Muela, C. Particle size distribution and chemical composition of total mixed rations for dairy cattle: Water addition and feed sampling effects. J. Dairy Sci. 2010, 93, 4180–4188. [Google Scholar] [CrossRef]
  29. National Research Council (NRC). Nutrient Requirements of Dairy Cattle; National Academies Press: Washington, DC, USA, 2001; pp. 601–602. ISBN 0309069971. [Google Scholar]
  30. Beauchemin, K.A. Invited review: Current perspectives on eating and rumination activity in dairy cows. J. Dairy Sci. 2018, 101, 4762–4784. [Google Scholar] [CrossRef]
  31. Stauder, A.; Humer, E.; Neubauer, V.; Reisinger, N.; Kaltenegger, A.; Zebeli, Q. Distinct responses in feed sorting, chewing behavior, and ruminal acidosis risk between primiparous and multiparous Simmental cows fed diets differing in forage and starch levels. J. Dairy Sci. 2020, 103, 8467–8481. [Google Scholar] [CrossRef]
Figure 1. Map of the study area and sampling locations. The bottom right image shows the Italian peninsula and the Calabria region (red circle). The image on the left shows the locations (red dots) of the farms where the TMR samples were collected.
Dairy 05 00009 g001
Figure 2. Individual values of PSD fraction (%) based on the type of TMR (TMR-Ty: TMR-S or TMR-H) (A) before feeding (T0) and (B) 24 h after TMR feeding (Tf); (C) PSD (Mean ± SD) in all TMRs observed (No. 13) based on the sieve (fraction) and based on the time T0-Tf; (D) sorting level (%) based on the sieve (fraction) and the type of TMR (TMR-S vs. TMR-H).
Dairy 05 00009 g002
Figure 3. (A) Correlation between peNDF > 8mm (%) at T0 and Fat (%) in the milk. (B) Correlation between aNDFom (%) at T0 and Fat (%) in the milk. (C) Correlation between aNDFom (%) of TMR and milk yield (kg). All NDF and peNDF values are referred to as dry matter content.
Dairy 05 00009 g003
Table 1. Chemical characteristics (% DM, Mean ± SD) of TMR (TMR-S with silage; TMR-H with hay)-fed dairy farms in the study.
Chemical Composition (% DM)Type of TMR
ItemTMR-STMR-H
DM 50.35 ± 4.4756.77 ± 7.14
NDF 34.22 ± 5.6837.22 ± 4.37
Starch 24.98 ± 3.1924.91 ± 6.35
CP17.61 ± 1.2016.83 ± 1.60
EE 3.53 ± 0.813.35 ± 0.76
Ash 7.17 ± 0.725.92 ± 0.78
DM = dry matter; NDF = neutral detergent fiber; CP = crude protein; EE = ether extract.
Table 2. Particle size distribution (mean ± SD) of silage-based (No. 5) and hay-based (No. 8) TMRs immediately upon delivery to dairy cows (T0).
Fraction (%)
LongMediumShortVery Short
TMR>19 mm8–19 mm4–8 mm<4 mm
1-silage 16.0 ± 1.428.5 ± 1.113.5 ± 7.0142.0 ± 16.5
2-silage 26.9 ± 1.023.4 ± 0.911.5 ± 0.538.3 ± 1.2
3-silage 13.1 ± 1.036.6 ± 0.515.3 ± 0.535.0 ± 0.5
4-silage 18.3 ± 0.629.1 ± 0.514.1 ± 0.538.4 ± 0.5
5-silage 11.6 ± 0.537.5 ± 1.217.6 ± 0.933.2 ± 0.6
1-hay9.9 ± 1.121.3 ± 0.514.3 ± 0.454.5 ± 0.6
2-hay5.6 ± 0.934.2 ± 1.014.0 ± 0.446.2 ± 1.5
3-hay12.9 ± 1.330.5 ± 1.814.1 ± 0.242.5 ± 0.8
4-hay36.8 ± 3.615.9 ± 2.215.3 ± 0.932.0 ± 2.7
5-hay19.3 ± 0.733.7 ± 1.817.0 ± 1.630.0 ± 0.9
6-hay21.7 ± 2.318.1 ± 1.18.5 ± 0.951.7 ± 3.8
7-hay4.1 ± 0.831.8 ± 1.219.1 ± 0.845.0 ± 2.1
8-hay15.1 ± 1.229.2 ± 0.813.7 ± 0.441.9 ± 1.1
Reference Values 1 (%)2–830–5010–20<40
1 TMR particle size recommendations for lactating cows [12].
Table 3. Particle size distribution (Mean ± SD) of silage-based (No. 5) and hay-based (No. 8) TMRs 24 h after TMR feeding (Tf).
Fraction (%)
LongMediumShortVery Short
TMR>19 mm8–19 mm4–8 mm<4 mm
1-silage 22.2 ± 3.930.6 ± 1.99.7 ± 0.537.5 ± 4.9
2-silage 34.7 ± 1.518.9 ± 1.411.8 ± 1.134.6 ± 3.3
3-silage 12.8 ± 1.136.4 ± 2.214.8 ± 0.136.1 ± 1.1
4-silage 42.8 ± 4.528.9 ± 0.811.4 ± 0.616.9 ± 4.0
5-silage 37.9 ± 3.537.7 ± 2.113.0 ± 0.311.3 ± 1.4
1-hay21.8 ± 3.529.1 ± 3.214.3 ± 0.434.8 ± 6.6
2-hay23.4 ± 9.946.9 ± 2.512.1 ± 2.817.5 ± 5.5
3-hay28.2 ± 6.034.5 ± 0.912.2 ± 0.825.2 ± 6.1
4-hay- ---
5-hay37.2 ± 3.329.8 ± 1.211.7 ± 0.821.3 ± 1.6
6-hay60.1 ± 3.024.4 ± 2.06.9 ± 2.48.6 ± 2.1
7-hay12.1 ± 2.043.2 ± 1.217.1 ± 0.627.6 ± 2.1
8-hay38.1 ± 7.333.8 ± 1.712.0 ± 0.116.1 ± 7.1
References Values 1 %2–830–5010–20<40
1 TMR particle size recommendations for lactating cows [12].
Table 4. Proportion of TMR retained on each PSPS sieve (%, Mean ± SD): Long = upper sieve > 19 mm; Medium = medium sieve 8–19 mm; Short = Lower sieve 4–8 mm; Very short = Bottom pan < 4 mm; based on Time: before feeding (T0) and 24 h after TMR feeding (Tf) and their Sieve × Time interaction.
Time of Feedingp-Value
Sieve (Fraction%)T0TfSieve (S)Time (T)S × T
Long16.25 ± 8.7730.94 ± 13.67<0.0001n.s.<0.0001
Medium28.46 ± 6.8732.86 ± 7.72n.s.n.s.n.s.
Short14.48 ± 2.6812.25 ± 2.56n.s.n.s.n.s.
Very short40.82 ± 7.3823.95 ± 10.13<0.0001n.s.<0.0001
n.s.= not significant.
Table 5. Homogeneity of TMRs based on silage (No. 5) and hay (No. 8). Within each particle size class, the maximum difference between the three feed lane points (S1-S2, S1-S3, and S2-S3) is reported as an absolute value. S1 = beginning, S2 = center, S3 = end of the feed lane.
Sieve Fraction (%)
LongMediumShortVery Short
TMR >19 mm8–19 mm4–8 mm<4 mm
1-silage 2.92.112.411.4
2-silage 1.51.80.92.5
3-silage 2.00.80.60.8
4-silage 1.11.11.00.9
5-silage 0.92.21.81.1
1-hay2.21.10.91.3
2-hay1.71.90.72.9
3-hay2.53.30.51.6
4-hay6.74.11.85.8
5-hay1.33.54.30.2
6-hay4.42.01.87.7
7-hay1.52.51.74.2
8-hay2.41.60.72.2
Table 6. Sorting (Mean ± SD) of TMRs based on silage (No. 5) and hay (No. 8). Positive values indicate that the fraction has been discarded, while negative values suggest an increase in consumption.
Sieve Fraction (%)
LongMediumShortVery Short
TMR>19 mm8–19 mm4–8 mm<4 mm
1-silage 6.19 ± 3.12.05 ± 3.0−3.76 ± 7.0−4.48 ± 11.4
2-silage 7.85 ± 0.9−4.47 ± 1.80.32 ± 1.5−3.70 ± 2.3
3-silage −0.33 ± 0.2−0.20 ± 2.0−0.50 ± 0.41.03 ± 1.5
4-silage 24.51 ± 5.0−0.23 ± 0.4−2.76 ± 1.0−21.52 ± 4.1
5-silage 26.28 ± 3.90.20 ± 1.4−4.59 ± 1.0−21.88 ± 2.0
1-hay11.96 ± 2.37.75 ± 3.5−0.05 ± 0.7−19.67 ± 6.2
2-hay17.85 ± 5.012.69 ± 1.6−1.92 ± 2.4−28.62 ± 5.9
3-hay15.31 ± 6.83.95 ± 1.2−1.92 ± 1.0−17.33 ± 5.3
4-hay----
5-hay17.93 ± 3.7−3.88 ± 3.0−5.32 ± 1.7−8.73 ± 1.5
6-hay38.39 ± 1.76.30 ± 2.9−1.64 ± 2.6−43.05 ± 5.9
7-hay7.92 ± 2.211.48 ± 1.1−2.00 ± 1.2−17.41 ± 3.6
8-hay23.03 ± 6.34.60 ± 0.8−1.74 ± 0.2−25.89 ± 6.1
Table 7. Content (Mean ± SD) of aNDFom (%), peNDF > 8 mm (%), and peNDF > 4 mm (%) according to TMR type (TMR-Ty: TMR-S; TMR-H) and Time (before feeding, T0; 24 h after TMR feeding, Tf).
Type of TMRTimep-Value
TMR-STMR-HT0TfTMR-TyTimeTMR-Ty × Time
aNDFom (%)34.22 ± 5.6837.22 ± 4.3736.07 ± 4.7341.18 ± 6.39n.s.0.0781n.s.
peNDF > 8 mm (%)16.56 ± 3.2421.89 ± 4.9918.78 ± 4.6326.52 ± 8.87n.s.0.0213n.s.
peNDF > 4 mm (%)24.53 ± 9.5327.33 ± 8.4721.46 ± 4.4831.36 ± 9.29n.s.0.0094n.s.
n.s.= not significant.
Table 8. Correlation coefficients and p-values between the main milk components and content of aNDFom (DM%), peNDF > 8 mm (DM%), and peNDF > 4 mm (DM%) of TMRs.
Milk ComponentaNDFom (%)peNDF > 8 mm (%)peNDF > 4 mm (%)
Yield (kg)R = −0.5988; p = 0.0397R = −0.2008; p = 0.4723R = −0.2194; p = 0.5514
Fat (%)R = 0.5797; p = 0.0482R = 0.6367; p = 0.0260R = 0.3358; p = 0.2859
Protein %R = 0.4861; p = 0.1097R = 0.2277; p = 0.2715R = 0.2465; p = 0.4400
Casein (%)R = 0.4350; p = 0.1898R = 0.1618; p = 0.1959R = 0.1558; p = 0.6288
Lactose (%)R = −0.3333; p = 0.2897R = −0.5615; p = 0.0575R = −0.5957; p = 0.0510
Urea (mg/dL)R = −0.1853; p = 0.5622R = −0.1983; p = 0.5368R = −0.2176; p = 0.4969
Acetone (mM)R = 0.5048; p = 0.0911R = 0.5721; p = 0.0519R = 0.4370; p = 0.1555
BHB (mM)R = 0.1537; p = 0.6331R = 0.2444; p = 0.4440R = 0.3098; p = 0.3271
Disclaimer/Publisher’s Note: The statements, opinions and data contained in all publications are solely those of the individual author(s) and contributor(s) and not of MDPI and/or the editor(s). MDPI and/or the editor(s) disclaim responsibility for any injury to people or property resulting from any ideas, methods, instructions or products referred to in the content.

