Article

Egyptian Jallab as Sugar Substitute, Antioxidant, and Colorant Agent in the Manufacturing of Functional Ice Cream

by
Mohamed F. Y. Hassan
1,2,*,
Khaled H. Salman
3,
Khaled G. Zaki
3,
Noha A. Hassan
2,
Hanadi Saleh S. Alahaideb
1 and
Abd-Ellah A. Abd-Alla
2
1
Department of Food Science and Human Nutrition, College of Agriculture and Veterinary Medicine, Qassim University, Buraydah 51452, Saudi Arabia
2
Department of Dairy Science, Faculty of Agriculture, Sohag University, Sohag 82755, Egypt
3
Department of Dairy Science, Faculty of Agriculture, Al-Azhar University, Assiut 71524, Egypt
*
Author to whom correspondence should be addressed.
Dairy 2024, 5(1), 118-133; https://doi.org/10.3390/dairy5010010
Submission received: 13 November 2023 / Revised: 4 December 2023 / Accepted: 5 January 2024 / Published: 15 January 2024
(This article belongs to the Section Milk Processing)

Abstract

:
Egyptian Jallab (EJ) is a conical candy (light to dark brown), manufactured from a part of sugar cane juice, that is used in the black honey industry. EJ is considered an unrefined sugar or a non-centrifugal form of sugar. The traditional use of Jallab is as candy, but it can also be used for making ice cream, cupcakes, biscuits, and toffee, as well as being used in other food applications. In this study, EJ was used as a sugar substitute in ice cream at 0, 25, 50, 75, and 100%. Total solids, titratable acidity, pH, protein, ash, fat, specific gravity, weight per gallon, viscosity, color attributes, total antioxidant activity, total phenolic content, and total flavonoid contents, as well as microbiological analyses, were tested. The total solids, protein, and ash in the Egyptian Jallab ice cream (EJIC) increased from 39.30, 4.85, and 0.87 to 41.19, 6.36, and 1.42, respectively. The gradual sugar substitution led to a significant increase in specific gravity and weight per gallon in pounds. The lightness (L*) of the ice cream decreased significantly due to the substitution of EJ for sugar. Moreover, there was a significant increase in a* (from 0.147 in control samples to 5.52 in treatment 4, which had 100% EJ). The changes in the b* values of Jallab ice cream samples were significantly increased due to the substitution of EJ for sugar. The control samples had a low value of antioxidant activity (21.53%) when compared with the treatment, which has EJ (88.82, 89.96, 91.98, and 92.14%) for EJIC1, EJIC2, EJIC3, and EJIC4, respectively. The total phenolic contents are 2.07, 3.03, 4.14, and 4.68 fold higher in the treatments with EJ substituted for sugar than in the control samples. Total flavonoid contents increased from 5.73 mg QE g−1 in control samples (TC) to 14.68, 21.54, 30.48, and 34.15 mg QE g−1 in EJIC1, EJIC2, EJIC3, and EJIC4 mg QE g−1 in ice cream samples, respectively.

1. Introduction

Egyptian Jallab (EJ) is a candy produced in the private sector alongside the sugar cane-growing regions and the manufacture of black honey in Upper Egypt. EJ is made from boiled sugarcane molasses supplied from sugarcane manufacturing units. Sugarcane juice is then condensed, evaporated, and formed into conical shapes. EJ stands out for having a high level of sugars, dietary fiber, antioxidants, and minerals in addition to its light to dark brown color. These compounds are valuable for creating nutrient-dense and healthy foods but are removed during cane sugar’s physical and chemical refinement [1]. EJ and jaggery, created by transforming sugarcane juice, are known not just as sweeteners but also as functional foods or food ingredients [2,3]. EJ, as well as jaggery, could be used in frozen desserts in this market, as has been the case with other natural-based sweeteners (such as stevia, agave, plant extracts, palm sugar, sugar beetroot molasses, and date syrup), taking into account both their sweetening and nutritional qualities [1,4]. Non-centrifugal sugar cane has been the main research topic this decade as a bioactive ingredient for the food, nutraceutical, and pharmaceutical industries [5]. Customers desire to buy ice creams that are more bioactive (i.e., have more phenolics and antioxidant activity) and have fewer artificial additives [6]. The antioxidant effects of non-centrifugal sugarcane juice are typically attributed to phenolic components, including flavonoids, phenolic acids, and polyphenols. It is believed that phenolic dietary components, especially flavonoids, may benefit human health. However, because these chemicals are undesired in sugar production, they are removed from the juice during processing [7,8,9]. In addition to having antiradical characteristics, lipid peroxidation inhibition, and protection against the oxidative and proliferative activity of cancer cell lines, some compounds made from sugarcane juice also have other beneficial qualities [10]. Adding fruit and natural sweeteners to ice cream increases its nutritional value. Ice cream affects the mind due to its organoleptic qualities and it has significance as a food that regulates body temperature [11]. Beyond taste qualities, replacing standard sweeteners like sucrose with alternative bulk sweeteners alters the stability and freezing behavior of ice cream [12,13]. Experimental trials are required to clarify the impacts of the many sucrose substitutes available on the market. As a result, the substitution approach may produce ambiguous outcomes in terms of the physicochemical and sensory aspects of the final product [14]. Due to the properties of EJ, this study aims to use EJ in the manufacturing of functional ice cream as a substitute for refined sugar, and also as a colorant and a source of antioxidants in the ice cream industry. In addition, we aim to investigate the effect of substituting EJ for sugar on the physiochemical, microbiological, and sensory properties of the resultant ice cream.

2. Materials and Methods

2.1. Materials

Whole fresh buffalo’s milk (6.0% fat) was obtained from the Herd of Animal Production Department, Faculty of Agriculture, Sohag University, Sohag, Egypt. Fresh bulk milk was separated, and cream (69% fat) was collected at the processing unit of the Department of Dairy Science, Faculty of Agriculture, Sohag University, Sohag, Egypt. Skim milk powder (95% solids not fat) was supplied by Arla Foods Company (Sønderhøj, Viby J, Denmark). EJ and sugar were obtained from the local market in Sohag governorate, Egypt. Indian-origin carboxy methyl cellulose (CMC) 95.5% assay, supplied by El Nasr Pharmaceutical Chemicals Co. Vanillin 100%, was obtained from Jia Xing Zhonghua Chemical Co., Ltd., Jiaxing, China.

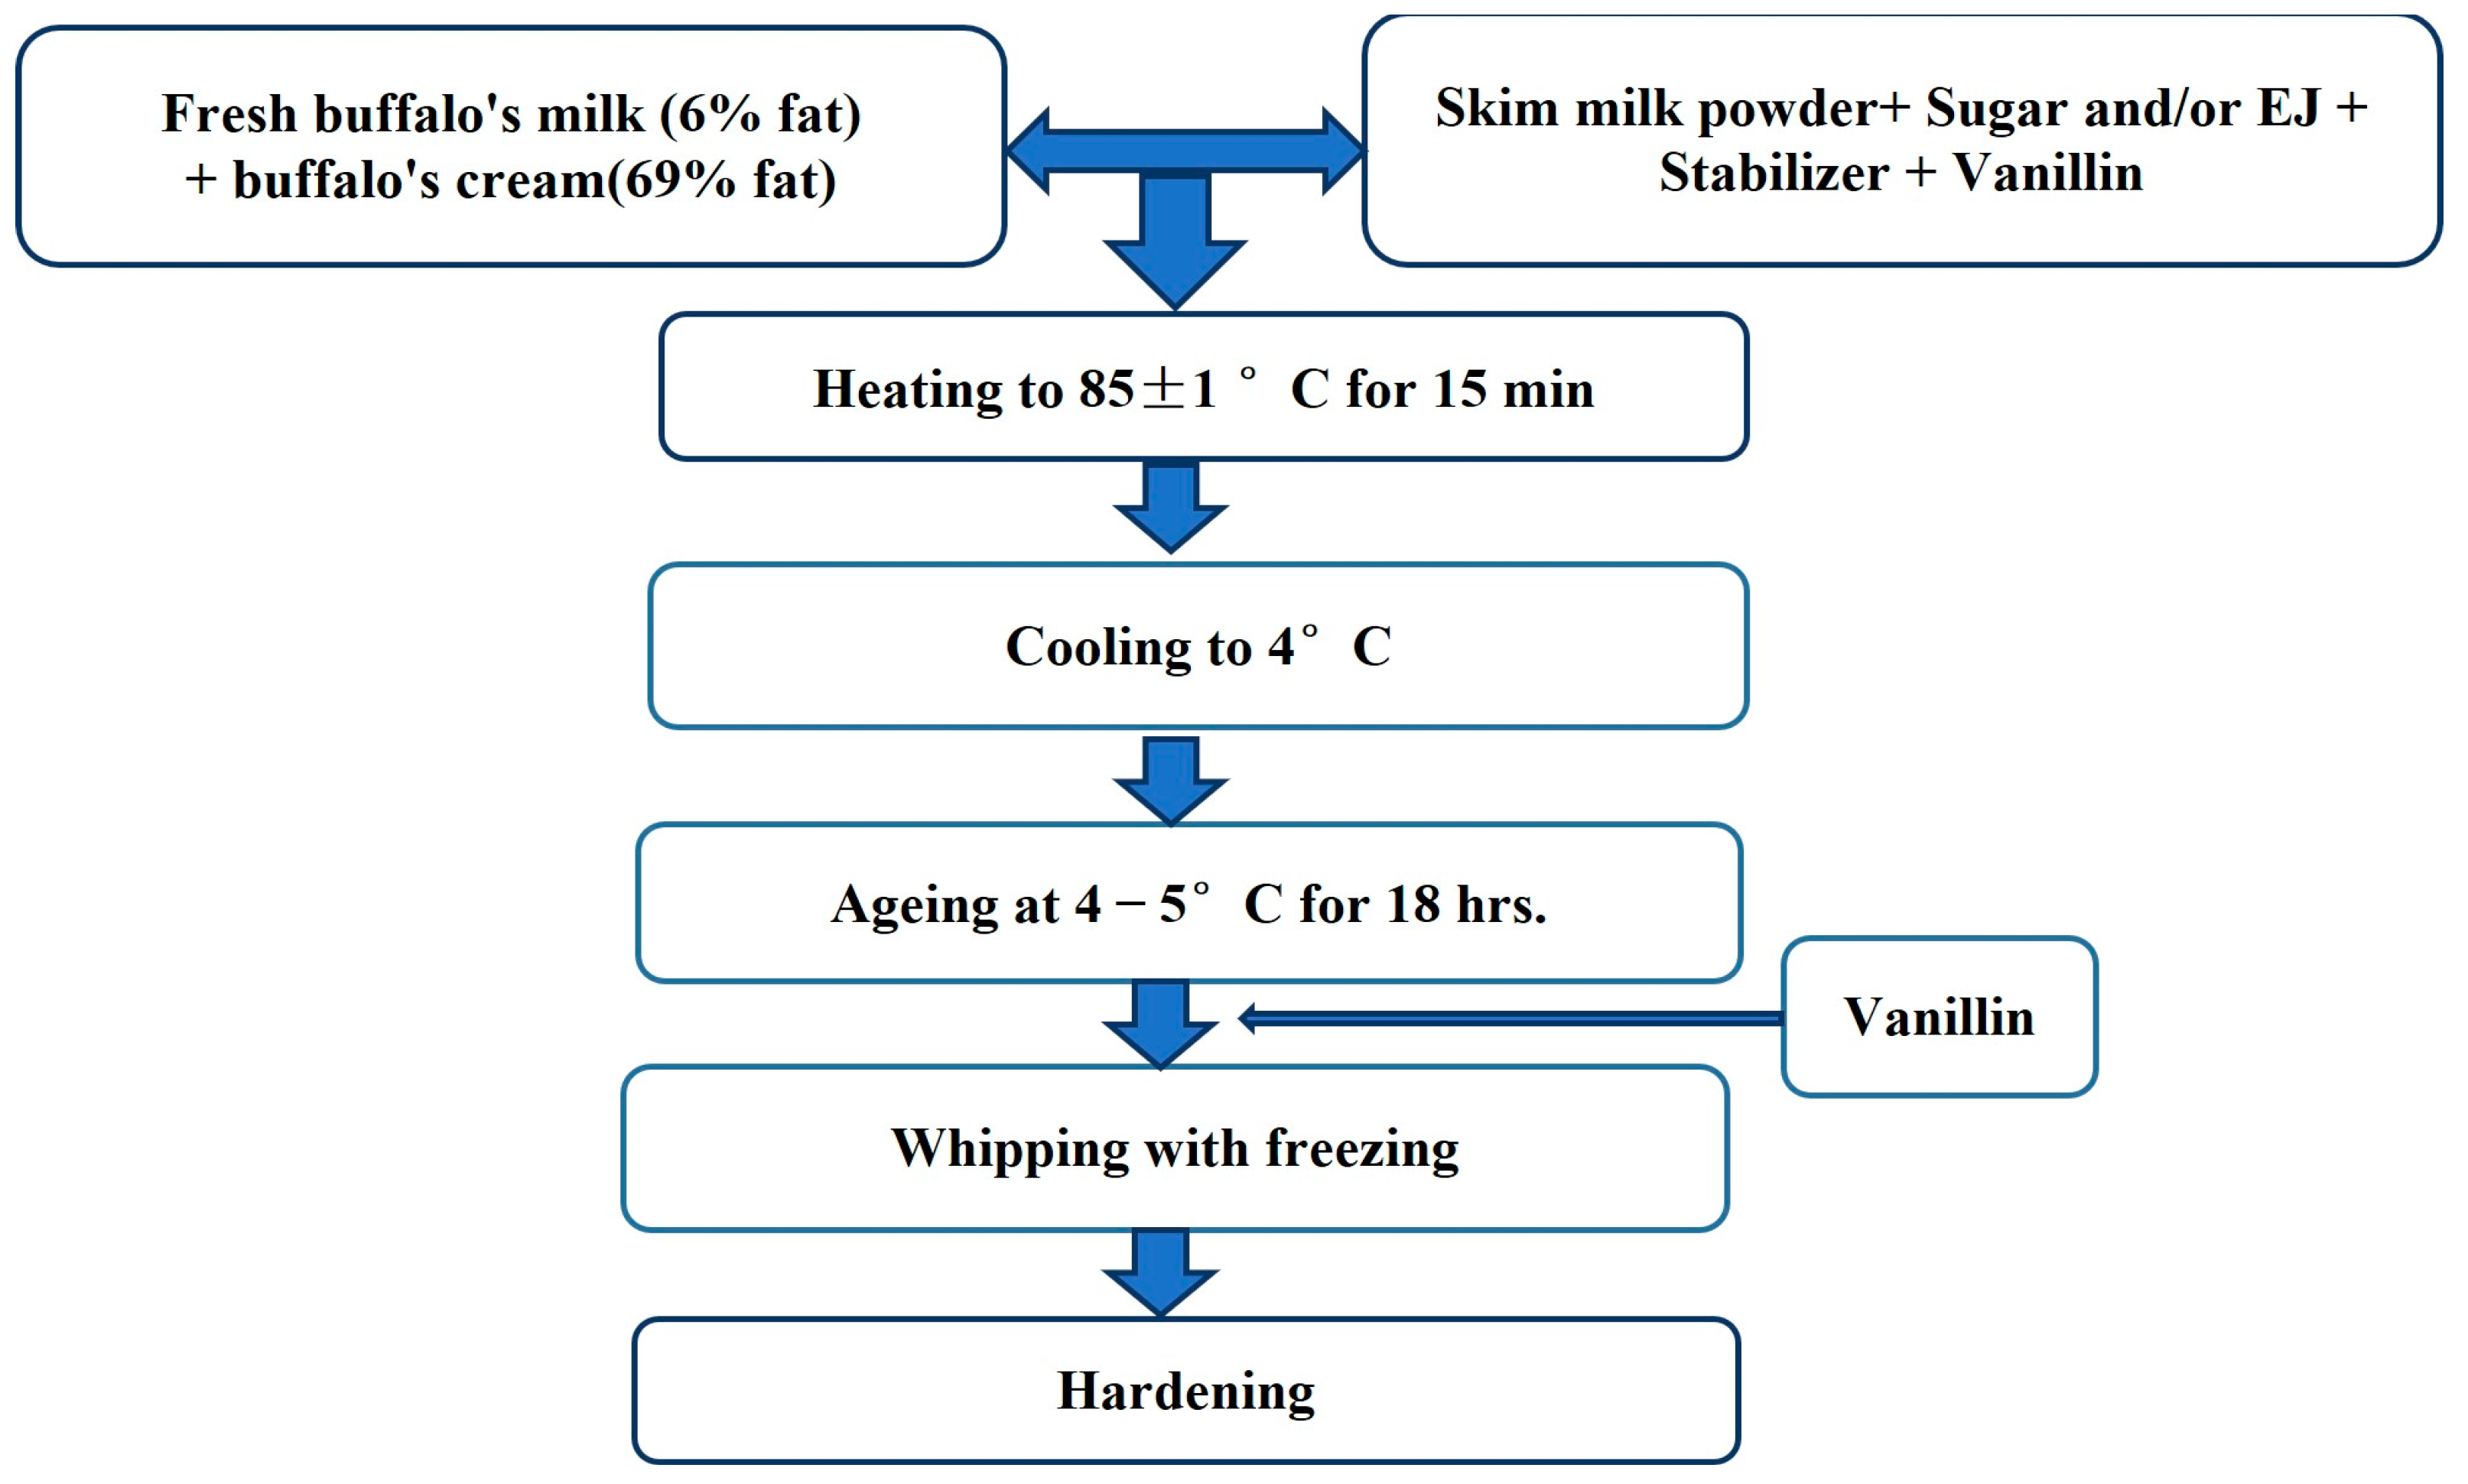
2.2. Manufacture of Egyptian Jallab Ice Cream (EJIC)

The ice cream mixes were prepared to include 11% (SNF), 10% fat, 15% sugar and/or EJ, and 0.3% CMC Table 1. The sugar was substituted by EJ as follows: Typical Control: without EJ (15% sugar), EJIC1: 25% of sugar was substituted with EJ, EJIC2: 50% of sugar was substituted with EJ, EJIC3: 75% of sugar was substituted with EJ, and EJIC4: 100% of sugar was substituted with EJ. The manufacturing protocol was followed and is shown in Figure 1. The EJIC ingredients were chosen in accordance with the necessary ratios. Table 1 contains the results of these computations. Also, Figure S1, presents the EJ and final product photos.
From this table, it is clear that the whole buffalo milk in EJIC was decreased due to increased sugar replacement, while buffalo cream and skim milk powder were increased to meet the requirement for solids-not-fat in EJIC.

2.3. Methods of Analysis

2.3.1. Analysis of the Chemical Composition of the Extract of EJby GC-MS

The components of an EJ extract were examined at the Department of Chemistry, Faculty of Science, Assiut University, Assiut, Egypt, using a gas chromatography-mass spectrometry (GC-MS) system (GC Trace 1300 Thermo Fisher Scientific, Waltham, MA, USA). The examination was carried out using a single quadruple mass spectrometer (the ISQ 7000 from Thermo Scientific). The flow rates for the carrier (He, 99.999%) and injection volumes were 1 mL min−1 and 10:1, respectively. The column temperature was initially maintained at 110 °C and kept for 5 min at a rate of 10 °C min−1, then increased to 200 °C and held for 5 min, and finally increased to 250 °C at a rate of 5 °C min−1 and held for 5 min. Throughout the analysis, the injector’s temperature was maintained at 250 °C. The ion source temperature was set to 250 °C, and the electron impact energy was 70 eV. In the 40–650 amu range, electron impact mass scan (msec−1) data were acquired [15]. Retention time (RT), molecular weight, molecular formula, and area were used to identify these components.

2.3.2. Physiochemical Analysis

Total solids, ash content, and titratable acidity were assessed according to AOAC [16]. Five grams were weighed in a dry, spotless crucible. The sample was dried in an oven at 105 °C until the weight of the dry sample no longer changed. The following equation was used to determine the moisture content:
M o i s t u r e   ( % ) = W e i g h t   b e f o r e   d r y i n g O v e n d r i e d   w e i g h t W t .   o f   s a m p l e × 100 .
The prior crucible, which was used to measure the sample’s moisture content (5 g), was heated to 550 °C in the furnace until the residue uniformly turned white. It was weighed after it had cooled in the desiccator. The steps of heating, cooling, and weighing were repeated until the weight remained constant. The ash percentages were determined using the following equation:
A s h   ( % ) = w t   o f   r e s i d u e w t   o f   s a m p l e g × 100 .
The method developed by Jacobs [17] was used to determine fat contents. Five grams of the blended sample and 10 mL of sulfuric acid (87 parts sulfuric acid, specific gravity 1.82 + 13 parts water) were added to a standard milk butyrometer. Next, 1 mL of amyl alcohol (specific gravity: 0.815) and 4.5–5.5 mL of water was added. After six minutes of centrifugation, the butyrometers were read right away. The reading needs to be adjusted by factor 2.218 because it did not provide an exact proportion of fat. Next, the following calculation was used to obtain the fat percentage:
F a t   % = R e a d i n g   o f   f a t   c o l u m n   ( 5 × 2.218 ) W t .   o f   t h e   s a m p l e   t a k e n   e x a c t l y × 100 .
IDF used the semi-micro Kjeldahl (Germany’s Gerhardt Type: VAP 200) to measure the total nitrogen level [18]. The Kjeldahl digestion container was filled with 1 g of carefully weighed samples. The Kjeldahl’s digestion tube was filled with the Kjeldahl catalyst, pure sulfuric acid (50 mL), anhydrous copper sulphate (8 g), and a few pieces of pumice stone. The temperature during the digestion process was 150 °C for 15 min, 300 °C for 15 min, and 400 °C for an hour. Following cooling, 100 mL of distilled water was cautiously added to a conical flask and shaken firmly. After that, the ammonia that had been produced was distilled out and put in a receiver with sulfuric acid. Specific gravity was determined using the methods described in AOAC [19]. By adding a known weight and volume to a chilled container (1/2 L), the frozen ice cream’s density was calculated by dividing the weight of the resulting ice cream by its volume. According to Burke [20], the weight per gallon was calculated by multiplying the density of the mix by the factor 8.34 (the weight per gallon of water in pounds). The relative viscosity was determined according to Arbuckle [21]. In the pipetting method, a measuring pipet of 50–100 mL capacity, marked at an arbitrary place below the bulb, is used to make the comparison. The sample to be tested is tempered to a standard temperature in the range of 60–70° F. The pipet is tempered by putting water into the pipet at 60–70° F. The time in seconds required to discharge the sample to the lower mark is determined for water and then for the sample being tested for comparison purposes. This method was used to calculate the melting time. After 48 h of hardening, 12 g of ice cream was scooped onto a dish and left to stand at room temperature (25 ± 1 °C) until totally melted. Time was measured with a stopwatch. Overrun was calculated based on Marshall et al. [22]. The formula below was used to determine the overrun of ice cream on a weight basis.
Overrun % = [(weight of a unit volume of mix) − (weight of a unit volume of ice cream)]/(weight of a unit volume of ice cream) × 100.

2.3.3. Color Properties

A colorimeter, the PCE-CSM4 (PCE Instruments UK Ltd., Manchester, UK), was used to assess colors. This device supports the L*, a*, and b* color space, including all visible colors’ properties, such as white, black, yellow, red, blue, and green. The device also supports CIELAB L*C*h (C* specifies chroma, and h denotes hue angle, an angular measurement of hue).

2.4. Phytochemicals and Antioxidant Activity

Sample extracts were made according to Karaman et al. [23]. Two different types of solvents (methanol and acetone 80:20, v:v) were used to extract the samples. First, 10 g of ice cream was weighed into a flask for extraction, and 90 mL of extraction solvent was added. For successful extraction, the mixture was kept in the dark for 24 h after being stirred for an hour at room temperature using a magnetic stirrer. Samples were centrifuged at 10,000 rpm for 10 min at room temperature after extraction (UNI Equip, Planegg, Germany). A 0.45 m filter was used to collect the supernatant and filter it. The antioxidant components’ activity was evaluated in the filtrate.

2.4.1. Determination of Antioxidant Activity (DPPH Assay)

With slight modifications, the method of Cervato et al. [24] was used to assess the free radical scavenging activity using 2, 2-diphenyl-1-picryl-hydrazyl. A suitable dilution of the extracts (1 mL) was combined (in triplicates) with 3 mL of a 0.1 mM methanolic solution of DPPH radicals. After the combination was left in the dark for 30 min, a spectrophotometer (Unico Spectrophotometer UV 2802, Houston, TX, USA) was used to measure the absorbance at 517 nm. The inhibition percentage was calculated using the equation shown below:
%inhibition percentage = [(Abs Control517nm − Abs Sample517nm)/Abs Control517nm] × 100.

2.4.2. Determination of Total Phenolic Content (TPC)

The total phenol concentration of samples was determined using the Folin–Ciocalteu technique, as reported by Chan et al. [25]. A test tube (in triplicates) was filled with a known dilution of 300 L of sample extracts. With distilled water, 1.5 mL of the Folin–Ciocalteu reagent was diluted ten times before being combined with 1.2 mL of the 7.5% w:v Na2CO3 solution. After shaking the mixtures, the absorbance at 765 nm was measured against a blank by dispensing 300 L of distilled water in place of the sample extract. The mixtures were then left to stand for 30 min at room temperature. The total phenolic content was calculated using a calibration curve and was represented as mg of gallic acid equivalents (mg GAEg−1).

2.4.3. Determination of Total Flavonoid Contents (TFC)

The total flavonoid contents were determined according to the method of Asha et al. [26]. A 0.5 mL extract diluted to a known concentration was added to a test tube with 1.5 mL of methanol, 0.1 mL of aluminum chloride (10%), 0.1 mL of 1M potassium acetate, and 2.8 mL of distilled water. The reaction mixture was stirred, left at room temperature for 30 min, and then centrifuged for 5 min at 5000 rpm. The total flavonoid concentration was estimated at 514 nm using the supernatant. Quercetin equivalent (QE) in mg−1 of material was used to express the total flavonoid concentration.

2.5. Sensory Evaluation

Ice cream samples were judged according to Arbuckle [27] by 12 trained panelists from the Dairy Sciences Department, Faculty of Agriculture, Sohag University, Egypt, using a score test as follows: color (10); flavor (50); body and texture (30); and melting quality (10).

2.6. Microbiological Analyses

According to Marshall et al.’s [22] protocols, total bacterial and psychrotrophic bacteria were analyzed. The coliform counts and molds and yeasts were enumerated according to IDF protocols [28], respectively.

2.7. Statistical Analysis

The data were subjected to an analysis of variance (ANOVA) with a 5% significance level using the Statistical Analysis System (SAS). The Least Significant Difference (LSD) method separated the mean differences, represented as means ± SE. The Shapiro–Wilk W test was conducted on the premise of normality, and the results were not significant.

3. Results

3.1. The Chemical Analyses of EJ

The data in Table 2 show the chemical analysis of EJ. The findings demonstrate that the composition of EJ presented high total solids, carbohydrate, protein, and ash content with 95.99, 85.37, 6.37, and 4.14%, respectively. EJ had a low moisture content of only 4.01%. Furthermore, data indicate that carbohydrates are the major constituent of the total solids. The results in the same table show that the EJ has a high level of antioxidant activity with 95.16%. Also, EJ is considered a good source of total phenolic content with 446.18 mg GAEg−1. Additionally, the total flavonoids in EJ amount to roughly 72.62 mg QEg−1.

3.2. The GC-MS of EJ

The components of the EJ extract were identified by GC/MS, as shown in Table 3. According to these data, it is evident that there were 21 identified compounds in the EJ extract, with proportions varying from 0.20 to 31.37%. The major constituent area of EJ extract is cis-13-octadecenoic acid (31.37%), followed by L-(+)-ascorbic acid, 2,6-dihexadecanoate (22.42%), and oleic acid (5.08%), while the lowest constituent area is docosanoic acid, 1,2,3-propanediol ester (0.2%).

3.3. The Chemical Composition of the EJIC

EJIC samples were prepared and tested for the following characteristics: total solids, protein, fat, ash, carbohydrate, acidity, and pH values (Table 4). The components of each mix were 10% fat, 11% MSNF, 15% sucrose and/or EJ, and 0.3% stabilizer. The data in Table 4 show that the gradual replacement of sugar with EJ significantly increased the total solids content in the EJIC. The total solids in EJIC increased from 39.30 to 41.19%. The samples of EJIC4 had the highest values of total solids, while TC had the lowest values.TC: typical control, EJIC1: 25% replacement of sugar by EJ; EJIC2: 50% replacement of sugar by EJ; EJIC3: 75% replacement of sugar by EJ; EJIC4: 100% replacement of sugar by EJ. Within the same row, means with the same superscripted letters are not statistically different at p > 0.05. Protein content in EJIC was significantly increased by substituting EJ for sugar. Fat content in EJIC was found to have a non-significant effect with an increasing substitute of sugar by EJ. The results in Table 4 showed the ash content of EJIC. The ash content of EJIC revealed a significant increase with the replacement of sugar with EJ. The gradual sugar replacement increased ash content (from 0.87 to 1.42%). The acidity of EJIC showed a significant increase with an increase in sugar substitute from EJ. The acidity values increased from 0.20 to 0.39%. The pH values in EJIC show a significant decrease as sugar is gradually replaced. The pH values declined from 6.31 in TC to 5.85 in EJIC4 samples.

3.4. The Physical Properties of the EJIC

Measurements of melting time (s), specific gravity, weight per gallon (Ib), and overrun were taken for EJIC, see Table 5. According to the findings, the gradual substitution of sugar with EJ significantly increased melting (s). The melting times of EJIC increased from 1851.0 to 2738.3 s, whereas the melting time in EJIC4 increased by about 32.36% compared to TC. From the results, the highest values of melting resistance were obtained from EJIC4 and decreased as a result of decreased sugar replacement. The specific gravity and weight per gallon of the resulting ice cream increased significantly with an increase in sugar replacement percentage. The weight per gallon and the specific gravity values increased from 3.038 to 3.717 kg and 0.810 to 0.990, respectively. The increased percentage in ice cream volume relative to the liquid mixture used is known as overrun. In the results of the overrun for the EJIC (Table 5), it was noted that there was a significant decrease as a result of sugar replacement. The highest overrun was obtained in TC (33.47%), followed by EJIC1 (31.64%), EJIC2 (30.60%), EJIC3 (29.43%), and EJIC4 (29.16%). As a result, in Table 5, the relative viscosity values significantly increased due to the replacement of sugar with EJ. The relative viscosity values increased from 1.73 in TC to 3.27 in EJIC4.
The color of food products is one of the main elements affecting how they appear. Ice cream is improved for consumer health by the inclusion of natural coloring. The color measurements (L*, a*, b*, C*, and h) were used to estimate the color properties of EJIC (Table 6). From the data, the lightness (L*) of the ice cream has decreased significantly due to the substitution of sugar with EJ. The highest lightness value was obtained from TC (55.73), while the lower value was obtained from EJIC4 (34.32). The replacement of sugar by EJ led to a significant increase in a* values (redness), from 0.147 in TC to 5.52 in EJIC4.
The strength of the color is proportional to the chroma value (C*), which shows the level of color saturation. There is an incremental increase in C* values with the increase in the replacement of sugar with EJ. Where the highest C* value was found in EJIC4, the lowest values were found in the control samples (Table 6). The hue of a color is quantified by its hue angle (hab). Another factor frequently used to determine the color of foods is the hue angle (h). From the results, the hue angle of TC ice cream samples (93.22) is located between yellow (90°) and green (180°), while the EJ ice cream, which was substituted by different ratios, had angles of (78.38, 72.57, 71.71, and 69.66) located between red (0°) and yellow (90°).

3.5. Phytochemical and Antioxidant Activity of the EJIC

The results in Table 7 show the DPPH% radical scavenging activity of EJIC. The replacement of sugar with EJ led to significant changes in DPPH% radical scavenging activity across all treatments. Furthermore, from the data, it can be noticed that EJ’s replacement of sugar greatly influenced antioxidant activity in the resultant ice cream. Hence, the control samples had a low value of antioxidant activity (21.53%) when compared with the treatment, which has EJ (88.82, 89.96, 91.98, and 92.14%) for EJIC1, EJIC2, EJIC3, and EJIC4, respectively.
The TPCs (mg GAEg−1) of EJIC samples are presented in Table 7. From the results, the values of TPC of EJIC samples were 67.67, 140.52, 204.75, 280.00, and 316.99.76mg GAEg−1 for TC, EJIC1, EJIC2, EJIC3, and EJIC4, respectively. The TPCs are 2.07, 3.03, 4.14, and 4.68 times higher in the treatments with sugar substituted by EJ than in the control samples. The TFCs in EJIC increased from 5.73 mg QE g−1 in control samples to 14.68, 21.54, 30.48, and 34.15 mg QE g−1 in EJIC samples (EJIC1, EJIC2, EJIC3, and EJIC4), respectively. The TFCs increased by 2.56, 3.76, 5.32, and 5.95 fold in EJIC samples compared to control samples. The total bacterial, psychrotrophic, yeast, mold, and coliform bacteria counts were assessed in the resultant ice cream, shown in Table 8. Total bacterial counts in ice cream treatments significantly increased with increased substitutions of sugar with EJ.

3.6. Microbiological Quality of the EJIC

The replacement of sugar with EJ had no significant effect on psychrotrophic bacteria counts in the ice cream samples (Table 8). However, there was a slight increase in psychrotrophic bacteria counts due to sugar substitution, where the counts of psychrotrophic bacteria increased from 2.30 to 2.63 log CFU g−1. The results in Table 8 show that the increase in sugar substitution led to a decrease in yeast and mold counts. The mold and yeast counts decreased from 1.74 in the control samples to 1.06 in EJIC4. Regarding the coliform bacteria counts, they were not detected in any samples in which sugar was 100% replaced by EJ.

3.7. Sensory Attributes of the EJIC

Twelve panelists from the Dairy Sciences Department, Faculty of Agriculture, Sohag University, Sohag, Egypt, used test scores as follows. The ice cream samples were evaluated for color (10), flavor (50), body and texture (30), and melting quality (10), as mentioned in Table 9. The replacement of sugar with EJ in ice cream impacted its organoleptic features, including color, flavor, body and texture, and melting quality. These characteristics represent a scoring summary for EJIC. The data in Table 9 show that the color scores in the ice cream samples decreased with an increase in the brown color due to an increasing sugar substitution percentage. The color score in the control samples is 9.55, which declined to 7.80 in the treatment with the highest sugar substitution percentage. The results in Table 9 showed that there was a significant difference in the flavor score values across all treatments; however, the flavor score of the EJIC1 was higher than that of the other ice cream treatments, while EJIC4 gained the lowest score, followed by EJIC3. The replacement of sugar with EJ in ice cream samples has no significant effect on body and texture scores. However, the body and texture scores of EJIC decreased with increasing sugar substitution percentages. The results in the same table showed that EJ’s replacement of sugar significantly affected the melting quality of EJIC. The increasing sugar substitution percentage gradually increased the melting quality scores; TC gained the lowest score, while EJIC4 gained the highest score. Regarding the overall score, the EJIC1 of EJIC, which has a 25% sugar substitution, gained the highest score (93.8), followed by the TC (92.4). In contrast, EJIC4 had the lowest scores (88.6).

4. Discussion

The chemical composition of EJ has shown positive results for ash (4.14%), protein (6.37%), carbohydrate (85.37%), antioxidant activity (95.16%), total phenolic content (446.18 mg GAEg−1), and total flavonoid contents (72.62 mg QE g−1). EJ contains 6.37% proteins and 4.14% ash, which increases the nutritional value of the resulting ice cream. The high content of total solids (95.99%) and carbohydrates (most unrefined sugar) in EJ makes it more resistant to spoilage or fermentation by microorganisms, increases its shelf life, and makes it suitable for sugar substitutes in ice cream making. The EJ has high antioxidant activity (95.16%), making it a reliable source of these compounds. The effectiveness of EJ as an antioxidant is due to its containing compounds that have antioxidant activity, such as ascorbic acid [29,30] and 9-octadecenoic acid (z)-, methyl ester [31]. EJ contains satisfactory levels of bioactive compounds (antioxidant, phenolic, and flavonoid contents) that have a beneficial effect on health. The EJ-like product (jaggery) contains 3285 μg GAEg−1 and 0.2–0.4% total phenols and flavonoids, respectively [32,33].
GC-MS has identified 20 compounds from EJ. The second major component identified from EJ is l-(+)-Ascorbic acid 2,6-dihexadecanoate with an area of 22.42%, which has magnificent antioxidant activity [34]. Quassin—also identified in the EJ component with antiplasmodial, anticancer, and anti-HIV characteristics—has drawn attention. In conjunction with the structure–activity study, its effectiveness as a combinatorial drug has restored new structural leads for developing newer drugs [35]. The EJ contained the bioactive compounds 7,8-Epoxylanostan-11-ol and 3-acetoxy, which are important for creating novel medications and pharmaceutical opportunities. To create a more effective innovative pharmaceutical, more research is being carried out to identify different pharmaceutical actions [36]. According to genetics, various chemical types, geographic origin, the season, environmental conditions, drying and extraction techniques, and other factors, the discovered components of any plant may vary [37].
The gradual replacement of sugar with EJ significantly increased the total solids content in the EJIC. The same trend was obtained by Tammam et al. [38], who reported that the total solids increased gradually when date syrup was substituted for sugar at 20, 40, 60, and 100%. Also, Junior and Lannes [39] found that higher solids were obtained from ice creams containing fructose syrup. These outcomes concur with Canella et al. [40], who produced a high-quality and better total solid goat milk separation efficiency in the first freeze concentration stage. The gradual increase in protein content of the EJIC may be due to the high protein content (6.37%), which gives the EJIC a higher nutritional value than TC. Emulsification, whipping, and water-holding capacity are among ice cream’s structural elements that are facilitated by proteins [41,42]. Milk proteins are well known for their capacity to generate foam, which is why foaming is crucial throughout the ice cream manufacturing process. Milk proteins thus play a role in maintaining the air–cream interface, which is crucial for the product’s overall structure and structural stability [43]. Fat content in EJIC was found to not change between treatments with an increasing substitute of EJ for sugar. The same results were reported by [39]. A smoother result is produced when milk fat is added to the ice cream mixture instead of water, lowering the ice phase volume of the ice cream [44]. Elevating the amount of milk fat in ice cream can result in a more velvety mouthfeel [45,46] and smaller ice crystals [47]. The gradual replacement of sugar led to a gradual increase in ash content due to the high ash content in EJ (4.14%). That made EJIC a key source of nutritional minerals, as it was reported that the ash content increased significantly when cornelian cherry (Cornus mas L.) peel was incorporated into the probiotic ice cream [48]. The acidity of EJIC showed a significant increase with an increase in sugar substitute from EJ. The acidity values increased from 0.20 to 0.39%, possibly due to the acidic compounds that EJ might contain. The same results were obtained by Tammam et al. [38], who reported that acidity values increased with increased date syrup substituted for sugar. All EJIC treatments had a pH value close to that of regular ice cream (6.3) [21]. Ozdemir et al. [13] recorded decreased pH values when replacing sugar with honey. The proteins approach an isoelectric point as a result of the desired pH drop, and the repulsion between groups that have the same electric charge enhances protein–protein interactions, which in turn stimulates the creation of a second layer around the fat globules and boosts emulsion stability [39].
The time it takes to melt ice cream completely corresponds to the melting time [49]. From the results, the highest values of melting resistance were obtained from EJIC4 and decreased as a result of decreased sugar replacement, which indicates that the addition of EJ increased the melting quality of ice cream. It is believed that, because EJ improves the viscosity of the final ice cream, it can bind water in the ice cream recipe, preventing it from melting too soon. A high viscosity coefficient value will increase the melting resistance of ice cream [50]. The increased serum micro-viscosity associated with an increase in the percentage of hydrocolloids may be the cause of the melting stability because it takes longer for the water to diffuse into the concentrated serum phase before it starts to flow from the interior to the exterior of the ice cream [51]. With an increase in sugar replacement percentage by EJ, the specific gravity of the resulting ice cream was increased significantly. According to Akbari et al. [52], ice cream’s density increased noticeably when fat levels were decreased. Youssef et al. [53] evidenced that the specific gravity of ice cream mixes increased gradually (1.109, 1.123, 1.125, and 1.127 g/cm3) for the control and mixes containing 5, 10, and 15% date pulp, respectively.
In contrast, it was 1.110, 1.114, and 1.200 gcm3 for mixes containing 5, 10, and 15% date concentrate, respectively. The overrun concerns how much air is mixed throughout manufacturing [54]. The decrease in overrun may be due to the effect of EJ on increasing viscosity, as well as the failure of an EJIC mixture to possess a high air retention capacity [55]. Moreover, the sticky qualities of EJ made it challenging to blend well, which resulted in lower levels of ice cream overflow [56]. The relative viscosity values increased with an increase in EJ. This occurs because using EJ in ice cream increases the total solid content and viscosity [57]. In this way, enhancing mix viscosity, air incorporation, body and texture, and melting qualities delay ice crystal development and growth [58]. Reduced-fat ice cream containing inulin showed a fall in freezing point and increased viscosity, according to Schaller-Povolny and Smith [59].
The color changes depending on the color of the added substances. Ice cream is improved for consumer health by the inclusion of natural coloring. The highest lightness value was obtained from TC (55.73), while the lower value was obtained from EJIC4 (34.32). The decrease in lightness has been attributed to the increased polyphenol content of the addition substance (EJ) [60,61], while according to Halim et al. [62], the addition of guar gum (94.43), xanthan gum (93.10), and carboxymethyl cellulose (93.37) had no discernible effects on the lightness value. The changes in the b* values (yellowness) of the EJIC samples were significantly increased due to the substitution of sugar with EJ. The increased a* and b* values and the decrease in L* values are due to the increase in brown color caused by the addition of EJ to the ice cream samples. That makes EJ a natural colorant in ice cream manufacturing, depending on the substitution ratio. The same results were reported by Kavaz et al. [63], who illustrate an increase in the b* value of the grape-added ice cream from 1.50 to 10.70. The color change of EJIC due to substituting sugar with EJ makes it a colorant compound, and the gradual replacement made the ice cream browner. There is an incremental increase in C* values with the increase in the replacement of sugar with EJ. This indicates that the addition of EJ to ice cream increases the color saturation or brightness.
The high content of antioxidants in EJ and EJIC makes EJ a rich source of antioxidants. Because EJ contains substances with antioxidant activity, like ascorbic acid [29,30] and 9-octadecenoic acid (z)-, methyl ester [31], it is useful as an antioxidant. Since ice cream contains a lot of antioxidants, it has many health benefits and lowers the risk of developing numerous diseases [48]. The same trend was stated by dos Santos Cruxen et al. [64]; adding more Butia fruit puree to ice cream increased free radical scavenging activity. In terms of antioxidant capacity, the close product of EJ (Jaggery) outperformed other sugars in the scavenging assay (half-maximum effective concentration: 7.81 μg mL−1) and reducing assay, demonstrating 70% DNA-protecting activity [65]. Food products like EJ that contain phenolic compounds can have their antioxidant activities increased. This suggests a positive association between the phenolic content and the antioxidant activity of spices [66]. Using herbal sources to make ice cream with bioactive ingredients like phenolic compounds is a technological alternative [67]. The present study examined the high concentration of flavonoids in EJ. Nevertheless, little data are presently accessible concerning the flavonoid composition of dairy products enhanced with sugarcane juice [68]. Ullah et al. [69] found that, when using sugar cane juice in making ice cream, the total flavonoid contents increased from 0.18 mg QE mL−1 in control samples to 0.51, 0.92, and 1.65 mg QE mL−1 in T1, T2, and T3 mg QE mL−1 in ice cream samples, respectively.
The increase in total viable counts in EJIC samples compared to control samples may have come from EJ. The opposite of these results was obtained from Tammam et al. [38], who found a decrease in total bacterial counts when substituting date syrup for sugar. Because L-(+)-Ascorbic Acid 2,6-Dihexadecanoate is present in EJ and has antibacterial capabilities, this suggests that EJ contains antimicrobial and anti-yeast compounds [70], as well as 9-octadecenoic acid (z)-, methyl ester [71]. The scores of colors in the ice cream samples decreased with an increase in the brown color due to increasing sugar substitution percentage. The color score in control samples is 9.55, which declined to 7.80 in the treatment with the highest sugar substitution percentage.

5. Conclusions

Increased dry matter content, especially in protein, was a prominent feature of EJIC ice cream. Replacement with EJ resulted in a significant increase in accessible ash content. The melting resistance of ice cream is improved with higher EJ content. There was a clear gradation in the color of the ice cream with an increase in the percentage of replacement with EJ, which allows for the use of EJ as a coloring in the manufacture of ice cream. TPC and TFC, which have all been linked to improved health, are found in EJIC ice cream. TPC and antioxidant capacity were higher in ice cream with an increasing replacement ratio. Among the ice creams we tested, ice cream with a 25% EJ substitution was well accepted. As we concluded, valuable quantities of EJ can produce up to 25% ice cream with preserved natural forms, distinct TPC, TFL, and excellent antioxidant capacity. The commercial potential for using EJ to scale production was positive, especially given the health-benefiting chemicals and sensory acceptability of the ice cream formulations produced.

Supplementary Materials

The following supporting information can be downloaded at: https://www.mdpi.com/article/10.3390/dairy5010010/s1, Figure S1: The EJ and final product photos.

Author Contributions

Conceptualization, A.-E.A.A.-A.; Methodology, M.F.Y.H., N.A.H. and A.-E.A.A.-A.; Validation, M.F.Y.H., K.H.S., N.A.H. and H.S.S.A.; Formal analysis, K.H.S., K.G.Z. and A.-E.A.A.-A.; Investigation, K.H.S., K.G.Z. and N.A.H.; Data curation, M.F.Y.H., N.A.H. and H.S.S.A.; Writing—original draft, K.H.S., K.G.Z. and A.-E.A.A.-A.; Writing—review & editing, M.F.Y.H. All authors have read and agreed to the published version of the manuscript.

Funding

Researchers would like to thank the Deanship of Scientific Research, Qassim University for funding the publication of this project.

Institutional Review Board Statement

Not applicable.

Informed Consent Statement

Not applicable.

Data Availability Statement

Data are contained within the article.

Acknowledgments

Researchers would like to thank the Deanship of Scientific Research, Qassim University for funding the publication of this project.

Conflicts of Interest

The authors declare no conflicts of interest.

Abbreviations

C.M.C.: Carboxy methyl cellulose, DPPH: 2,2-Diphenyl-1-picrylhydrazyl, EJ: Egyptian jallab, EJIC: Egyptian jallab ice cream with 0% replacement of sugar by EJ, EJIC1: Egyptian jallab ice cream with 25% replacement of sugar by EJ, EJIC2: Egyptian jallab ice cream with 50% replacement of sugar by EJ, EJIC3: Egyptian jallab ice cream with 75% replacement of sugar by EJ, EJIC4: Egyptian jallab ice cream with 100% replacement of sugar by EJ, RT: Retention time, SNF: Solids not fat, TA: Titratable acidity, TC: Typical control, TFC: Total flavonoid content, TPC: Total phenolic content, TS: Total solids.

References

  1. Yeboah, J.; Santoro, A.M.; Arrieta-Escobar, J.A.; Caballero, I.M.; Orjuela, A.; Novoa, C.F.; Fuenmayor, C.A.; Hamdani, F.E. Heuristic-based computer-aided design of ice creams and validation by using jaggery as refined sugar substitute. Chem. Eng. Res. Des. 2022, 184, 256–266. [Google Scholar] [CrossRef]
  2. Flórez Martínez, D.H. Agenda prospectiva de investigación de la cadena productiva de la panela y su agroindustria. Tecnura 2013, 17, 72–86. [Google Scholar] [CrossRef]
  3. Ordoñez-Díaz, M.M.; Rueda-Quiñónez, L.V. Evaluation of the social-environmental impacts associated with the production of panela in Santander (Colombia). Cienc. Tecnol. Agropecu. 2017, 18, 379–396. [Google Scholar] [CrossRef]
  4. Velotto, S.; Parafati, L.; Ariano, A.; Palmeri, R.; Pesce, F.; Planeta, D.; Alfeo, V.; Todaro, A. Use of stevia and chia seeds for the formulation of traditional and vegan artisanal ice cream. Int. J. Gastron. Food Sci. 2021, 26, 100441. [Google Scholar] [CrossRef]
  5. Flórez-Martínez, D.H.; Contreras-Pedraza, C.A.; Rodríguez, J. A systematic analysis of non-centrifugal sugar cane processing: Research and new trends. Trends Food Sci. Technol. 2021, 107, 415–428. [Google Scholar] [CrossRef]
  6. Sloan, A. Top 10 food trends. Food Technol. 2019, 73, 30–47. [Google Scholar]
  7. Zia, S.; Khan, M.R.; Zeng, X.A.; Sehrish; Shabbir, M.A.; Aadil, R.M. Combined effect of microwave and ultrasonication treatments on the quality and stability of sugarcane juice during cold storage. Int. J. Food Sci. Technol. 2019, 54, 2563–2569. [Google Scholar] [CrossRef]
  8. Khan, M.R.; Syed, A.; Zia, S.; Ahmed, W.; Aadil, R.M.; Manzoor, M.F.; Inam-Ur-Raheem, M.; Abid, M.; Shabbir, M.A.; Qureshi, S. Stabilization and attributive amelioration of sugarcane juice by naturally derived preservatives using aonla and moringa extract. Food Sci. Nutr. 2021, 9, 3048–3058. [Google Scholar] [CrossRef]
  9. Arif, S.; Batool, A.; Nazir, W.; Khan, R.S.; Khalid, N. Physiochemical characteristics nutritional properties and health benefits of sugarcane juice. In Non-Alcoholic Beverages; Elsevier: Amsterdam, The Netherlands, 2019; pp. 227–257. [Google Scholar]
  10. Abbas, S.R.; Sabir, S.M.; Ahmad, S.D.; Boligon, A.A.; Athayde, M.L. Phenolic profile, antioxidant potential and DNA damage protecting activity of sugarcane (Saccharum officinarum). Food Chem. 2014, 147, 10–16. [Google Scholar] [CrossRef] [PubMed]
  11. Del Giovine, L.; Bocca, A.P. Determination of synthetic dyes in ice-cream by capillary electrophoresis. Food Cont. 2003, 14, 131–135. [Google Scholar] [CrossRef]
  12. Cadena, R.; Cruz, A.; Faria, J.; Bolini, H. Reduced fat and sugar vanilla ice creams: Sensory profiling and external preference mapping. J. Dairy Sci. 2012, 95, 4842–4850. [Google Scholar] [CrossRef] [PubMed]
  13. Ozdemir, C.; Dagdemir, E.; Ozdemir, S.; Sagdic, O. The effects of using alternative sweeteners to sucrose on ice cream quality. J. Food Qual. 2008, 31, 415–428. [Google Scholar] [CrossRef]
  14. Moriano, M.E.; Alamprese, C. Honey, trehalose and erythritol as sucrose-alternative sweeteners for artisanal ice cream. A pilot study. LWT-Food Sci. Technol. 2017, 75, 329–334. [Google Scholar] [CrossRef]
  15. Senthilkumar, R.; Manivannan, R.; Balasubramanian, A.; Rajkapoor, B. Antioxidant and hepatoprotective activity of ethanol extract of Indigofera trita Linn. On CCl4 induced hepatoxicity in rats. J. Pharmacol. Toxicol. 2008, 3, 344–350. [Google Scholar]
  16. AOAC. Official Methods of Analysis of the Aoac, 17th ed.; Association of Official Analytical Chemists: Rockville, MD, USA, 2000. [Google Scholar]
  17. Jacobs, M.B. The Chemical Analysis of Foods and Food Products; D. Van Nostr and Company Inc.: London, UK, 1951. [Google Scholar]
  18. IDF. Milk Protein Determination, Determination of Nitrogen Content. Kjeldahl Method and Calculation of Crude Protein Content; Standard 20B; International Dairy Federation: Brussels, Belgium, 1993. [Google Scholar]
  19. AOCS. Official Methods and Recommended Practices of the American Oil; AOCS: Champaign, IL, USA, 1999. [Google Scholar]
  20. Burke, A.D. Practical Ice Cream Making; Olsen Publishing Co.: Ithaca, NY, USA, 1947; p. 65. [Google Scholar]
  21. Arbuckle, W.; Arbuckle, W. Calculation of Ice Cream Mixes; Springer: Boston, MA, USA, 1986; pp. 119–165. [Google Scholar] [CrossRef]
  22. Marshall, R.T.; Goff, H.D.; Hartel, R.W. Ice Cream; Springer Science & Business Media: Berlin/Heidelberg, Germany, 2003. [Google Scholar]
  23. Karaman, S.; Toker, Ö.S.; Yüksel, F.; Çam, M.; Kayacier, A.; Dogan, M. Physicochemical, bioactive, and sensory properties of persimmon-based ice cream: Technique for order preference by similarity to ideal solution to determine optimum concentration. J. Dairy Sci. 2014, 97, 97–110. [Google Scholar] [CrossRef]
  24. Cervato, G.; Carabelli, M.; Gervasio, S.; Cittera, A.; Cazzola, R.; Cestaro, B. Antioxbdant properties of oregano (Origanum vulgare) leaf extracts. J. Food Biochem. 2000, 24, 453–465. [Google Scholar] [CrossRef]
  25. Chan, E.W.C.; Lim, Y.Y.; Chew, Y.L. Antioxidant activity of Camellia sinensis leaves and tea from a lowland plantation in Malaysia. Food Chem. 2007, 102, 1214–1222. [Google Scholar] [CrossRef]
  26. Asha, K.; Sucheta, G.; Kavita, M.; Nirmala, D.; Jyoti, S. Quantification of phenolics and flavonoids by spectrophotometer from-Juglans regia. Int. J. Pharma Bio Sci. 2010, 1, PS4. [Google Scholar]
  27. Arbuckle, W.S. Ice Cream; Springer: Berlin/Heidelberg, Germany, 2013. [Google Scholar]
  28. Standard 73A; Milk and Milk Products. Enumeration of Coliforms-Colony Counts Technique and Most Probable Number Technique at 30 °C. International Dairy Federation: Brussels, Belgium, 1985.
  29. Arrigoni, O.; De Tullio, M.C. Ascorbic acid: Much more than just an antioxidant. Biochim. Biophys. Acta Gen. Subj. 2002, 1569, 1–9. [Google Scholar] [CrossRef] [PubMed]
  30. Yen, G.-C.; Duh, P.-D.; Tsai, H.-L. Antioxidant and pro-oxidant properties of ascorbic acid and gallic acid. Food Chem. 2002, 79, 307–313. [Google Scholar] [CrossRef]
  31. Albergoni, V.; Piccinni, E.; Coppellotti, O. Response to heavy metals in organisms—I. Excretion and accumulation of physiological and non physiological metals in Euglena gracilis. Comp. Biochem. Physiol. Part-C Toxicol. Pharmacol. 1980, 67, 121–127. [Google Scholar] [CrossRef] [PubMed]
  32. Barrera, C.; Betoret, N.; Seguí, L. Phenolic profile of cane sugar derivatives exhibiting antioxidant and antibacterial properties. Sugar Technol. 2020, 22, 798–811. [Google Scholar] [CrossRef]
  33. Iqbal, M.; Qamar, M.A.; Bokhari, T.H.; Abbas, M.; Hussain, F.; Masood, N.; Keshavarzi, A.; Qureshi, N.; Nazir, A. Total phenolic, chromium contents and antioxidant activity of raw and processed sugars. Inf. Process. Agric. 2017, 4, 83–89. [Google Scholar] [CrossRef]
  34. Begum, S.F.M.; Priya, S.; Sundararajan, R.; Hemalatha, S. Novel anticancerous compounds from Sargassum wightii: In silico and in vitro approaches to test the antiproliferative efficacy. J. Adv. Pharm. Educ. Res. 2017, 7, 272–277. [Google Scholar]
  35. Chakraborty, D.; Pal, A. Quassinoids: Chemistry and Novel Detection Techniques; Springer: Berlin/Heidelberg, Germany, 2013; pp. 3345–3366. [Google Scholar]
  36. Alqahtani, S.S.; Makeen, H.A.; Menachery, S.J.; Moni, S.S. Documentation of bioactive principles of the flower from Caralluma retrospiciens (Ehrenb) and in vitro antibacterial activity–Part B. Arab. J. Chem. 2020, 13, 7370–7377. [Google Scholar] [CrossRef]
  37. Jiang, Y.; Wang, D.; Li, F.; Li, D.; Huang, Q. Cinnamon essential oil Pickering emulsion stabilized by zein-pectin composite nanoparticles: Characterization, antimicrobial effect and advantages in storage application. Int. J. Biol. Macromol. 2020, 148, 1280–1289. [Google Scholar] [CrossRef] [PubMed]
  38. Tammam, A.; Salman, K.; Abd-El-Rahim, A. Date syrup as a sugar substitute and natural flavour agent in ice cream manufacture. J. Food Dairy Sci. 2014, 5, 625–632. [Google Scholar] [CrossRef]
  39. Silva Junior, E.d.; Lannes, S.C.d.S. Effect of different sweetener blends and fat types on ice cream properties. Food Sci. Technol. 2011, 31, 217–220. [Google Scholar] [CrossRef]
  40. Canella, M.; Muñoz, I.d.B.; Barros, E.; Silva, C.; Ploêncio, L.; Daguer, H.; Prudêncio, E. Block freeze concentration as a technique aiming the goatmilk concentration: Fate of physical, chemical, and rheological properties. Int. J. Eng. Sci. Res. Technol. 2019, 8, 87–104. [Google Scholar]
  41. Schmidt, K. Effect of milk proteins and stabilizer on ice milk quality. J. Food Qual. 1994, 17, 9–19. [Google Scholar] [CrossRef]
  42. Walstra, P.; Jonkman, M. The role of milkfat and protein in ice cream. Int. Dairy Fed. Spec. 1998, 3, 17–24. [Google Scholar]
  43. Turan, S.; Kirkland, M.; Trusty, P.; Campbell, I. Interaction of fat and air in ice cream. Dairy Ind. Int. 1999, 64, 27–31. [Google Scholar]
  44. Hartel, R.W. Ice crystallization during the manufacture of ice cream. Trends Food Sci. Technol. 1996, 7, 315–321. [Google Scholar] [CrossRef]
  45. Arbuckle, W.S. Ice Cream; AVI Pub. Co., Inc.: Westport, CT, USA, 1986. [Google Scholar]
  46. Keeney, P.G. Confusion over heat shock. Food Eng. 1979, 51, 116–118. [Google Scholar]
  47. Kilara, A.; Chandan, R.C. Frozen dairy foods. In Milk and Dairy Products in Human Nutrition: Production, Composition and Health; John Wiley & Sons: Hoboken, NJ, USA, 2013; pp. 435–457. [Google Scholar]
  48. Haghani, S.; Hadidi, M.; Pouramin, S.; Adinepour, F.; Hasiri, Z.; Moreno, A.; Munekata, P.E.; Lorenzo, J.M. Application of Cornelian cherry (Cornus mas L.) peel in probiotic ice cream: Functionality and viability during storage. Antioxidants 2021, 10, 1777. [Google Scholar] [CrossRef]
  49. Asminaya, N.S.; Kurniawan, W.; Apriansyah, A.; Kimestri, A.B. Physical Quality Test of Ice Cream Sweetened Using Honey. In Proceedings of the International Conference on Improving Tropical Animal Production for Food Security (ITAPS 2021); Advances in Biological Sciences Research; Atlantis Press, Springer Nature: Dordrecht, The Netherlands, 2022; pp. 411–415. [Google Scholar] [CrossRef]
  50. Muse, M.; Hartel, R.W. Ice cream structural elements that affect melting rate and hardness. J. Dairy Sci. 2004, 87, 1–10. [Google Scholar] [CrossRef] [PubMed]
  51. Milani, E.; Koocheki, A. The effects of date syrup and guar gum on physical, rheological and sensory properties of low fat frozen yoghurt dessert. Int. J. Dairy Technol. 2011, 64, 121–129. [Google Scholar] [CrossRef]
  52. Akbari, M.; Eskandari, M.H.; Niakosari, M.; Bedeltavana, A. The effect of inulin on the physicochemical properties and sensory attributes of low-fat ice cream. Int. Dairy J. 2016, 57, 52–55. [Google Scholar] [CrossRef]
  53. Youssef, K.M.; El-Hady, A.; El-Sayed, A.; Moussa-Ayoub, T.E.; El-Samahy, S.K. Rheological behavior and some quality parameters of date ice cream. J. Agric. Vet. Sci. 2014, 6, 149–160. [Google Scholar] [CrossRef]
  54. Cruz, A.G.; Antunes, A.E.; Sousa, A.L.O.; Faria, J.A.; Saad, S.M. Ice-cream as a probiotic food carrier. Food Res. Int. 2009, 42, 1233–1239. [Google Scholar] [CrossRef]
  55. Camelo-Silva, C.; Barros, E.L.d.S.; Canella, M.H.M.; Verruck, S.; Prestes, A.A.; Vargas, M.O.; Maran, B.M.; Esmerino, E.A.; Silva, R.; Balthazar, C.F. Application of skimmed milk freeze concentrated in production of ice cream: Physical, chemical, structural and rheological properties. Food Sci. Technol. 2021, 42, e12221. [Google Scholar] [CrossRef]
  56. Rahim, N.; Sarbon, N. Acacia honey lime ice cream: Physicochemical and sensory characterization as effected by different hydrocolloids. Int. Food Res. J. 2019, 26, 883–891. [Google Scholar]
  57. Cornelia, M.; Tunardy, A.M.; Sinaga, W.S. The effect of cinnamon extract (Cinnamomum burmanii L.) addition towards the characteristics of soy milk ice cream. In Proceedings of the 6th International Conference of Food, Agriculture, and Natural Resource (IC-FANRES 2021), Tangerang, Indonesia, 4–5 August 2021; pp. 32–38. [Google Scholar]
  58. Nielsen, B. Combined Emulsifier/Stabilizers for Ice Cream; Pascal and Francis Bibliographic Databases; Inist-CNRS: Vandœuvre-lès-Nancy, France, 1978. Available online: https://pascal-francis.inist.fr/vibad/index.php?action=getRecordDetail&idt=PASCAL7810468802 (accessed on 12 November 2023).
  59. Schaller-Povolny, L.; Smith, D. Original papers-Viscosity and freezing point of a reduced fat ice cream mix as related to inulin content. Milchwissenschaft 2001, 56, 25–28. [Google Scholar]
  60. Cliff, M.A.; King, M.C.; Schlosser, J. Anthocyanin, phenolic composition, colour measurement and sensory analysis of BC commercial red wines. Food Res. Int. 2007, 40, 92–100. [Google Scholar] [CrossRef]
  61. Figueiredo-González, M.; Cancho-Grande, B.; Simal-Gándara, J. Garnacha Tintorera-based sweet wines: Chromatic properties and global phenolic composition by means of UV–Vis spectrophotometry. Food Chem. 2013, 140, 217–224. [Google Scholar] [CrossRef] [PubMed]
  62. Halim, N.; Shukri, W.; Lani, M.; Sarbon, N. Effect of different hydrocolloids on the physicochemical properties, microbiological quality and sensory acceptance of fermented cassava (tapai ubi) ice cream. Int. Food Res. J. 2014, 21, 1825. [Google Scholar]
  63. Kavaz, A.; Yüksel, M.; Dağdemir, E. Determination of certain quality characteristics, thermal and sensory properties of ice creams produced with dried Besni grape (Vitis vinifera L.). Int. J. Dairy Technol. 2016, 69, 418–424. [Google Scholar] [CrossRef]
  64. dos Santos Cruxen, C.E.; Hoffmann, J.F.; Zandoná, G.P.; Fiorentini, Â.M.; Rombaldi, C.V.; Chaves, F.C. Probiotic butiá (Butia odorata) ice cream: Development, characterization, stability of bioactive compounds, and viability of Bifidobacterium lactis during storage. LWT-Food Sci. Technol. 2017, 75, 379–385. [Google Scholar] [CrossRef]
  65. Nayaka, M.H.; Sathisha, U.V.; Manohar, M.; Chandrashekar, K.; Dharmesh, S.M. Cytoprotective and antioxidant activity studies of jaggery sugar. Food Chem. 2009, 115, 113–118. [Google Scholar] [CrossRef]
  66. Jessica Elizabeth, D.L.T.; Gassara, F.; Kouassi, A.P.; Brar, S.K.; Belkacemi, K. Spice use in food: Properties and benefits. Crit. Rev. Food Sci. Nutr. 2017, 57, 1078–1088. [Google Scholar] [CrossRef]
  67. Gremski, L.A.; Coelho, A.L.K.; Santos, J.S.; Daguer, H.; Molognoni, L.; do Prado-Silva, L.; Sant’Ana, A.S.; da Silva Rocha, R.; da Silva, M.C.; Cruz, A.G. Antioxidants-rich ice cream containing herbal extracts and fructooligossaccharides: Manufacture, functional and sensory properties. Food Chem. 2019, 298, 125098. [Google Scholar] [CrossRef] [PubMed]
  68. Kadam, U.S.; Ghosh, S.B.; De, S.; Suprasanna, P.; Devasagayam, T.; Bapat, V.A. Antioxidant activity in sugarcane juice and its protective role against radiation induced DNA damage. Food Chem. 2008, 106, 1154–1160. [Google Scholar] [CrossRef]
  69. Ullah, R.; Nadeem, M.; Ayaz, M.; Tayyab, M.; Imran, M.; Sajid, R. Antioxidant characteristics of ice cream supplemented with sugarcane (Saccharum officinarum L.) juice. Food Sci. Biotechnol. 2015, 24, 1227–1232. [Google Scholar] [CrossRef]
  70. Okwu, D.E.; Ighodaro, B.U. GC-MS evaluation of bioactive compounds and antibacterial activity of the oil fraction from the leaves of Alstonia boonei De Wild. Der Pharma Chem. 2010, 2, 261–272. [Google Scholar]
  71. Ouyang, H.; Kong, X.; He, W.; Qin, N.; He, Q.; Wang, Y.; Wang, R.; Xu, F. Effects of five heavy metals at sub-lethal concentrations on the growth and photosynthesis of Chlorella vulgaris. Chin. Sci. Bull. 2012, 57, 3363–3370. [Google Scholar] [CrossRef]
Figure 1. Ice cream preparation procedure.
Dairy 05 00010 g001
Table 1. Different formulas of prepared ice cream supplemented with EJ amount per 100 g mix.
FormulaBuffalo Milk
(6% Fat)
Buffalo’s Cream
(69% Fat)
Dried Skim
Milk 95% SNF
SugarCMCEJTotal
TC71.458.284.97150.30100
EJIC170.698.345.0311.250.34.39100
EJIC269.898.425.17.50.38.79100
EJIC369.118.495.173.750.313.18100
EJIC468.338.565.2400.317.57100
Table 2. Chemical analyses of EJ.
ComponentsRatio
Total solids (%)95.99
Ash (%)4.14
Protein (%)6.37
Lipid (%)0.11
Carbohydrate (%)85.37
Total antioxidant activity (%)95.16
Total phenolic content (mg GAE g−1)446.18
Total flavonoid contents (mg QE g−1)72.62
Table 3. The compounds of EJ extract identified using gas chromatography-mass spectrometry (GC-MS).
SCompound NameRt (min)Peak Area %
1trans-13-Octadecenoic acid34.502.70
210-Octadecenoic acid, methyl ester39.181.55
3L-(+)-Ascorbic acid 2,6-dihexadecanoate40.4722.42
4Quassin43.122.77
59-Octadecenoic acid (Z)-, tetradecyl ester43.422.35
69-Octadecenoic acid (Z)-, 2-hydroxy-1-(hydroxymethyl)ethyl ester44.480.64
716-Octadecenoic acid, methyl ester45.141.00
8Cyclopropanedodecanoic acid, 2-octyl-, methyl ester45.211.04
9cis-13-Octadecenoic acid46.3431.37
10Oleic Acid46.775.08
11Docosanoic acid, 1,2,3-propanetriyl ester48.540.69
127,8-Epoxylanostan-11-ol, 3-acetoxy49.152.51
13Oleic acid, 3-(octadecyloxy)propyl ester49.211.33
148,14-Seco-3,19-epoxyandrostane-8,14-dione,
17-acetoxy-3á-methoxy-4,4-dimethyl-
49.262.32
152,16-didehydro-20-hydroxy-19-oxo-, methyl ester49.932.20
165H-Cyclopropa[3,4]benz[1,2-e]azulen-5-one,3,9,9a-tris(acetyloxy)
-3-[(acetyloxy)methyl]-2-chloro-1,1a,1b,2,3,4,4a,7a,7b,8,9,9a-
dodecahydro-4a,7b-dihydroxy-1,1
,6,8-tetramethyl-,[1aR-(1aà,1bá,2à,3á,4aá,7aà,7bà,8à,9á,9aà)]-
50.430.62
17Dodecanoic acid,1a,2,5,5a,6,9,10,10a-octahydro-5a-hydroxy-4-
(hydroxymethyl)
-1,1,7,9-tetramethyl-6,11-dioxo-1H-2,8a-methanocyclopenta
[a]cyclopropa[e]cyclodecen-5-yl
ester, [1aR-(1aà,2à,5á,5aá,8aà,9à,10aà)]-
55.791.00
18Oleic acid, 3-(octadecyloxy)propyl ester58.361.60
19Docosanoic acid, 1,2,3-propanetriyl ester60.200.20
203,5,9-Trioxa-5-phosphaheptacos-18-en-1-aminium,4-hydroxy
-N,N,N-trimethyl-10-oxo-7-[(1-oxo-9-octadecenyl)oxy]-, hydroxide,
inner salt, 4-oxide, (R)-
70.210.29
Table 4. The effect of sugar substitution with EJ on the chemical composition of the EJIC. (Mean ± SE), n = 3.
ComponentsTreatmentsp-Value
TCEJIC1EJIC2EJIC3EJIC4
Total solids %39.30 e
±0.05
39.86 d
±0.05
40.15 c
±0.09
40.91 b
±0.02
41.19 a
±0.01
0.001
Protein %4.85 a
±0.02
4.86 b
±0.08
5.00 bc
±0.03
5.18 c
±0.16
6.36 c
±0.01
0.001
Fat %9.97 a
±0.03
9.90 a
±0.06
9.70 b
±0.06
9.90 a
±0.06
9.90 a
±0.06
0.048
Ash %0.87 e
±0.001
0.96 d
±0.001
0.98 c
±0.002
1.13 b
±0.004
1.42 a
±0.002
0.001
TA0.20 e
±0.003
0.23 d
±0.001
0.28 c
±0.002
0.33 b
±0.002
0.39 a
±0.001
0.001
pH6.31 a
±0.003
6.12 ab
±0.003
6.10 ab
±0.009
5.95 b
±0.003
5.85 c
±0.012
0.001
TC: Typical control, EJIC1: 25% replacement of sugar by EJ; EJIC2: 50% replacement of sugar by EJ; EJIC3: 75% replacement of sugar by EJ; EJIC4: 100% replacement of sugar by EJ. Within the same row, means with the same superscripted letters are not statistically different at p > 0.05.
Table 5. The effect of sugar substitution by EJ on melting time, specific gravity, weight per gallon, and overrun of EJIC. (Mean ± SE), n = 3.
ComponentsTreatmentsp-Value
TCEJIC1EJIC2EJIC3EJIC4
Melting time
(s)
1851.0 e
±20.50
2215.0 d
±19.52
2411.7 c
±16.17
2552.7 b
±10.67
2738.3 a
±17.53
0.001
Specific gravity0.810 e
±0.0013
0.831 d
±0.0029
0.866 c
±0.0003
0.899 b
±0.0001
0.990 a
±0.0024
0.001
Weight per
gallon (kg)
3.038 e
±0.005
3.117 d
±0.011
3.252 c
±0.001
3.375 b
±0.001
3.717 a
±0.009
0.001
Over run33.47 a
±0.27
31.64 b
±0.32
30.60 c
±0.17
29.43 d
±0.27
29.16 d
±0.01
0.001
Relative viscosity1.73 c
±0.026
1.73 c
±0.054
1.82 c
±0.003
2.48 b
±0.064
3.27 a
±0.023
0.001
TP: typical control, EJIC1: 25% replacement of sugar by EJ; EJIC2: 50% replacement of sugar by EJ; EJIC3: 75% replacement of sugar by EJ; EJIC4: 100% replacement of sugar by EJ. Within the same row, means with the same superscripted letters are not statistically different at p > 0.05.
Table 6. Color attributes of EJIC prepared with different substitution ratios of sugar to EJ. (Mean ± SE), n = 3.
ComponentsTreatmentsp-Value
TCEJIC1EJIC2EJIC3EJIC4
L*55.73 a
±3.74
49.99 a
±1.92
41.72 b
±0.40
38.66 bc
±0.29
34.32 c
±1.50
0.001
a*0.147 c
±0.05
3.48 b
±0.24
4.79 a
±0.57
5.42 a
±0.28
5.52 a
±0.57
0.001
b*11.44 d
±0.36
14.59 cd
±0.44
15.15 bc
±0.50
16.60 b
±0.57
16.90 a
±0.43
0.001
C*11.45 c
±0.36
15.56 bc
±0.51
15.90 bc
±0.65
17.25 b
±0.46
17.50 a
±0.72
0.001
h93.22 a
±2.51
78.38 b
±0.52
72.57 c
±1.37
71.71 c
±1.23
69.66 c
±0.35
0.001
TC: Typical control, EJIC1: 25% replacement of sugar by EJ; EJIC2: 50% replacement of sugar by EJ; EJIC3: 75% replacement of sugar by EJ; EJIC4: 100% replacement of sugar by EJ. Within the same row, means with the same superscripted letters are not statistically different at p > 0.05.
Table 7. The effect of sugar substitution with EJ on the DPPH inhibition (%), total phenolic content (TPC), and total flavonoid content (TFC) of EJIC (Mean ± SE), n = 3.
ComponentsTreatmentsp-Value
TCEJIC1EJIC2EJIC3EJIC4
DPPH%21.53 c
±0.90
88.82 b
±0.20
89.96 b
±0.07
91.98 a
±0.08
92.14 a
±0.08
0.001
TPC
(mg GAE g−1)
67.67 e
±6.38
140.52 d
±9.20
204.75 c
±6.48
280.00 b
±7.63
316.99 a
±4.76
0.001
TFC
(mg QE g−1)
5.73 e
±0.02
14.68 d
±0.08
21.54 c
±0.09
30.48 b
±0.11
34.15 a
±0.16
0.001
TC: typical control, EJIC1: 25% replacement of sugar by EJ; EJIC2: 50% replacement of sugar by EJ; EJIC3: 75% replacement of sugar by EJ; EJIC4: 100% replacement of sugar by EJ. Within the same row, means with the same superscripted letters are not statistically different at p > 0.05.
Table 8. The effect of sugar substitution with EJ on the microbiological properties (log cfu g−1) of EJIC (Mean ± SE), n = 3.
ComponentsTreatmentsp-Value
TCEJIC1EJIC2EJIC3EJIC4
Total bacterial
count
5.34 b
±0.17
5.94 b
±0.05
6.04 b
±0.05
6.19 b
±0.03
6.22 a
±0.06
0.001
Psychrotrophic
bacteria
2.30 a
±0.22
2.31 a
±0.04
2.46 a
±0.26
2.53 a
±0.24
2.63 a
±0.21
0.753
Yeast and molds
count
1.74 a
±0.55
1.39 a
±0.23
1.21 a
±0.28
1.13 a
±0.12
1.06 a
±0.33
0.635
Coliform bacteriaNDNDNDNDND-
TC: control, EJIC1: 25% replacement of sugar by EJ; EJIC2: 50% replacement of sugar by EJ; EJIC3: 75% replacement of sugar by EJ; EJIC4: 100% replacement of sugar by EJ. Within the same row, means with the same superscripted letters are not statistically different at p > 0.05. ND: Not detected.
Table 9. The effect of sugar substitution with EJ on the organoleptic properties of EJIC (Mean ± SE), n = 3.
ComponentsTreatmentsp-Value
TCEJIC1EJIC2EJIC3EJIC4
Color9.55 a
±0.15
8.90 ab
±0.27
8.45 bc
±0.26
8.00 c
±0.29
7.80 c
±0.34
0.001
Flavor46.45 ab
±1.03
47.95 a
±0.45
45.55 ab
±0.74
45.20 b
±0.78
44.40 b
±1.04
0.039
Body and texture28.50 a
±0.42
28.40 a
±0.39
28.45 a
±0.39
27.15 a
±0.66
27.45 a
±0.58
0.172
Melting quality7.90 b
±0.35
8.55 ab
±0.25
8.35 ab
±0.31
8.90 a
±0.23
8.95 a
±0.22
0.048
Overall score92.4 a
±1.35
93.8 a
±1.19
90.8 ab
±1.24
89.25 b
±1.74
88.6 b
±1.89
0.011
TC: typical control, EJIC1: 25% replacement of sugar by EJ; EJIC2: 50% replacement of sugar by EJ; EJIC3: 75% replacement of sugar by EJ; EJIC4: 100% replacement of sugar by EJ. Within the same row, means with the same superscripted letters are not statistically different at p > 0.05.
Disclaimer/Publisher’s Note: The statements, opinions and data contained in all publications are solely those of the individual author(s) and contributor(s) and not of MDPI and/or the editor(s). MDPI and/or the editor(s) disclaim responsibility for any injury to people or property resulting from any ideas, methods, instructions or products referred to in the content.

