Article

Cheese and Yogurt By-Products as Valuable Ingredients for the Production of Prebiotic Oligosaccharides

1
Laboratory of Food Chemistry and Technology, School of Chemical Engineering, National Technical University of Athens, Zografos Campus, 9 Iroon Polytechneiou Street, 15772 Athens, Greece
2
Laboratory of Biotechnology, School of Chemical Engineering, National Technical University of Athens, Zografos Campus, 9 Iroon Polytechneiou Street, 15772 Athens, Greece
*
Author to whom correspondence should be addressed.
Dairy 2024, 5(1), 78-92; https://doi.org/10.3390/dairy5010007
Submission received: 28 November 2023 / Revised: 5 January 2024 / Accepted: 9 January 2024 / Published: 12 January 2024
(This article belongs to the Special Issue Delivering Sustainable Dairy Products with Added Value)

Abstract

:
The growing global market of dairy products has led to the need for alternative approaches regarding whey valorization, which is the primary by-product of cheese and strained yogurt production. In this context, prebiotic galactooligosaccharides can be produced enzymatically from whey using commercially available β-galactosidases. A comparative study was conducted to assess the production of galactooligosaccharides from sweet and acid whey, thereby employing two commercial β-galactosidases from Aspergillus oryzae and Kluyveromyces lactis. The study considered the initial lactose content and enzyme load as variables. The maximum yields of galactooligosaccharides in concentrated sweet whey (15% w/v initial lactose) and raw acid whey (3.1% w/v initial lactose) reached 34.4 and 14.7% with lactase from Kluyveromyces lactis (0.13 U/mL), respectively. The corresponding galactooligosaccharide yields for lactase from Aspergillus oryzae were equal to 27.4 and 24.8% in the most concentrated sweet and acid whey, respectively, using enzyme loads of 2 U/mL in sweet whey and 1 U/mL in acid whey. Concerning the profile of the produced galactooligosaccharides, the Kluyveromyces lactis lactase hydrolyzed lactose more rapidly and resulted in higher levels of allolactose and lower levels of 6-galactosyl-lactose, compared to the lactase from Aspergillus oryzae, and achieved in both cases a polymerization degree of up to six.

1. Introduction

Whey is a major by-product of the dairy industry. It is a yellowish liquid containing mainly lactose, galactose, lactic acid, whey proteins, and minerals. Depending on the different final products and their production process, two main types of whey are eliminated: sweet whey (SW) and acid whey (AW). The main difference between the two types of whey is their acidity, specifically their lactic acid content. Acid whey contains higher amounts of lactic acid of up to 0.53% w/v and, thus, has a pH value of 4.21–4.48. This is attributed to the related production processes in which casein precipitation is performed by acid coagulation during milk fermentation with lactic acid bacteria or mineral acids, such as in the production of Greek strained yogurt or some fresh cheeses (e.g., cottage cheese) [1,2]. Sweet whey is separated from casein precipitate during industrial processes involving the rennet clotting of milk casein, such as in hard and semihard cheese making, thus exhibiting lower lactic acid content (0.25 ± 0.03% w/v) and a higher pH value (6.0–6.5) [1,3].
The amounts of SW and AW produced annually are quite high, and their management by dairy industries is challenging. The production of 1 kg of cheese involves the elimination of 9 kg of SW [4], while during the production of strained yogurt, the ratio of product to AW mass is 1:2 [5]. The global production of cheese in 2022 amounted to about 20,376 kilotons [6], which equates to approximately 183.4 million tons of SW. As for Greek strained yogurt, its production in the USA in 2015 amounted to 771 kilotons, thus leading to the elimination of more than 2 million tons of acid whey [7]. The global cheese market is predicted to grow by 9.4% over the next decade [6], while the corresponding market growth for Greek strained yogurt is projected to reach 11.1% by 2032 [8]. Due to the substantial volumes of whey discarded by dairy industries each year, it is mandatory to employ specific processes for their disposal in an environmentally reliable manner or their utilization as a food ingredient.
Numerous approaches are reported for whey valorization, yet each presents challenges during implementation. The application of whey as a fertilizer by spraying it over fields gives rise to significant issues, including the release of strong off-odors and an increased biological load that contributes to eutrophication. Additionally, the incorporation of whey into animal feed is hampered by the inability of mature animals to digest lactose. Furthermore, whey’s bioconversion into biofuels is hindered by the significant costs associated with the processes required, thereby outweighing the cost of the end-product. Moreover, the biochemical oxygen demand levels of whey (over 40,000 ppm) render it unsuitable for discharge into the environment without pretreatment [1]. Conventional biological treatment plants are ill suited for managing whey, as they become overloaded when processing it [5,9,10]. As a result, the quest for sustainable and commercially viable alternative methods for utilizing SW and AW, despite its challenges, remains important for the dairy industry.
A sustainable solution regarding SW and AW management is the isolation of certain compounds from them, such as whey proteins and lactose. The utilization of whey for the production of whey protein concentrate and isolate and the isolation of lactose via crystallization are practices that have been successfully put into implementation for several decades from dairy industries as a solution for whey valorization [1,4]. However, the vast amounts of whey produced annually and the growing market of cheese and yogurt products result in large amounts of whey remaining unexploited. Toward an alternative route for whey valorization, the conversion of lactose into prebiotic galactooligosaccharides (GOSs) stands out [11]. For this application, β-galactosidase, a widely applied enzyme used for the production of non- or low-lactose products, can be employed. The β-galactosidase is a glycosyl hydrolase that primarily catalyzes lactose hydrolysis, i.e., the disruption of the glycosidic bond between the glucose and galactose in the lactose molecule. Nevertheless, β-galactosidase simultaneously catalyzes a lactose oligomerization reaction called transgalactosylation. In this reaction, the enzyme is initially bonded with the galactosyl moiety of the lactose by releasing the glucose monomer, followed by the catalysis of a GOS formation via the creation of a glycosidic bond between the galactosyl moiety and another monosaccharide, disaccharide, or oligosaccharide. The two reactions of hydrolysis and transgalactosylation are kinetically controlled, since their rate depends on the lactose concentration and enzyme load in the reaction mixture [12,13,14]. Consequently, it becomes essential to gain an understanding of the time progression of this enzymatic reaction in order to identify the optimal point at which the highest GOS yields can be achieved.
Galactooligosaccharides are considered to exhibit prebiotic properties in a similar manner to human milk oligosaccharides. They promote the growth of intestinal microflora, mineral absorption, and enhance the human immune system [15,16]. The bioconversion of whey lactose directly into prebiotic GOSs can increase its added value and contribute to the partial resolution of the management issue that has emerged due to whey accumulation, therein having significant environmental ramifications. The GOS-rich syrup that results from this process can be incorporated in various products within the same industry, either directly or post drying, to increase their nutritional value or to create new ones. Hence, the transformation of a low-value by-product into a GOS-rich product with significant nutritional and commercial value through a practically zero-effluent process aligns with the principles of the circular economy initiative.
The research regarding lactose bioconversion into GOSs has been focused on the use of primarily pure lactose solutions as substrates by employing either commercial [14,17,18] or recombinant thermophilic lactases [19,20]. Few studies can be found regarding the investigation of GOS production by applying β-galactosidases directly into SW and AW, as well as the effects that other whey components can have on the GOS yield. In a study by Fischer and Kleinschmidt (2015), the use of two commercially available lactases from Aspergillus oryzae and Kluyveromyces lactis was studied in the two main types of whey. Their research was conducted using one enzyme load (50 U/g) and two lactose concentrations (38 and 200 g/L) and yielded promising results, with the GOS yields reaching as high as 33.45% of the total sugars [21]. Simović et al. (2019) investigated the synthesis of GOSs from concentrated sweet whey (40% w/w) using immobilized β-galactosidase from A. oryzae, and they reported GOS yields of up to 15.5% of the initial lactose content [22]. Additionally, Zerva et al. (2021) studied the utilization of Greek yogurt AW for GOS production using a novel thermostable lactase from Thermothielavioides terrestris, thereby mentioning GOS yields of up to 19.4% of the initial lactose content [23]. The aforementioned results indicate a great potential for prebiotic GOS production directly from dairy by-products that is of minimum financial, yet high nutritional value. However, more thorough research is required to verify the optimum conditions that maximize GOS production in terms of temperature, substrate acidity, lactose concentration, enzyme activity, and process time by comparing different lactose and enzyme sources.
Within the context of dairy by-products valorization to high-value products, this study aims to comparatively investigate the GOS production from the bioconversion of the lactose of SW and AW with the use of two commercial lactases from the fungus A. oryzae and the yeast K. lactis, as well as to define the optimum process conditions resulting in GOS yield maximization.

2. Materials and Methods

2.1. Whey Supply and Determination of Components

Sweet whey eliminated during hard or semihard cheese production from sheep and goat milk was acquired by a leading Greek dairy industry and was preserved under freezing (−25 °C) before utilization. An array of chemical analyses was conducted to fully characterize SW. The concentrations of individual sugars were quantified using the high-performance anion exchange chromatography with pulsed amperometric detection (HPAEC-PAD) technique, as outlined in Section 2.4, using D-lactose monohydrate ≥ 98.0% (HPLC grade, CAS number: 64044-51-5), D-(+)-galactose (Ph. Eur., BP, CAS number: 59-23-4), and D-(+)-glucose monohydrate [Ph. Eur., BP, Ph. Franç., 7.0–9.5% water (Karl Fischer), CAS number: 14431-43-7] as standards (Sigma-Aldrich, St. Louis, MO, USA). Total nitrogen content was assessed using the Kjeldahl method [24], and total protein concentration was calculated using the conversion factor of 6.41 [25]. Fat was determined using the Röse-Gottlieb method [26]. Lactic acid concentration was measured using a methodology described by Borshchevskaya et al. (2016) [27]. The solid residue was gravimetrically measured by subjecting whey to a 24 h drying process at 105 ± 3 °C. The ash content of both whey samples was determined via incineration at 500–550 °C for 16 h. The pH value was determined using an Amel 338 pH meter (AMEL Instruments, Milano, Italy) equipped with a 12 mm glass electrode (Hanna Instruments, Winsocket, RI, USA). All measurements were conducted in triplicate. The whey concentration up to 15% w/v lactose content was achieved using a Hei-VAP Value Digital Rotary Evaporator (Heidolph Instruments, Schwabach, Germany). The proximate analysis for AW was previously performed, and the corresponding results were retrieved according to Limnaios et al. (2023) [28] for the purpose of a comprehensive comparative study.

2.2. Commercial Biocatalysts

Galactooligosaccharide production from SW and AW was performed via the application of two industrially applied lactases: one β-galactosidase sourced from the yeast Kluyveromyces lactis (Kerry Group plc, Tralee, Kerry, Ireland) and one derived from the fungus Aspergillus oryzae (Sigma-Aldrich, St. Louis, MO, USA). Optimum reaction temperature in terms of activity and thermostability have been determined at 35 and 45 °C for the lactase from K. lactis and A. oryzae, respectively, while corresponding optimum pH values have been determined as 4.5 and 7.2, respectively, according to our previous study [28].

2.3. Enzymatic Bioconversion of Whey Lactose

Enzymatic reactions conducted in order to produce GOSs from SW and AW took place in both non-concentrated SW and AW with initial lactose contents (clac(0)) of 5.1 and 3.1% w/v, respectively, as well as in SW and AW concentrates with clac(0) values of 10% and 15% w/v, respectively. Each reaction was carried out in duplicate at the optimal reaction conditions of each lactase, as mentioned in Section 2.2, and the process is described in Limnaios et al. (2023) [28].

2.4. Determination of Enzymatic Bioconversion Products

Enzymatic bioconversion products were identified using high-performance liquid chromatography with a refractive index detector (HPLC-RID) according to the methodology described by Fischer and Kleinschmidt (2015) with slight modifications [21]. Briefly, a Microsorb-MV 100 NH2 (250 mm × 4.6 mm) column with a Polaris 5 NH2 MetaGuard guard column (Agilent Technologies, Inc., Santa Clara, CA, USA) was used for the HPLC-RID analysis. The analysis was performed at ambient temperature with 70% acetonitrile (HPLC grade, Fisher Scientific International, Inc., Pittsburgh, PA, USA) in water (HPLC grade, Fisher Scientific International, Inc., Pittsburgh, PA, USA) as the eluent, with a flow rate of 1.3 mL/min. The quantification of the products was performed through calibration curves of standard sugars, i.e., D-(+)-galactose (Ph. Eur., BP, CAS number: 59-23-4) for monosaccharides, D-lactose monohydrate ≥ 98.0% (HPLC grade, CAS number: 64044-51-5) for disaccharides, D-(+)-raffinose pentahydrate ≥ 99.0% (suitable for microbiology, CAS number: 17629-30-0) for trisaccharides, and stachyose hydrate ≥ 98% (CAS number: 54261-98-2) for oligosaccharides with polymerization degree above 3 (Sigma-Aldrich, St. Louis, MO, USA). All analyses were performed in triplicate.
Further separation of the produced GOSs according to their degree of polymerization at the optimum reaction conditions in each case was achieved through high-performance anion exchange chromatography with pulsed amperometric detection (HPAEC-PAD), thus following the methodology described in Limnaios et al. (2023) [28]. All analyses were performed in duplicate.

2.5. Data and Statistical Analysis

The GOS yield (yGOS) and the lactose hydrolysis degree (hlac) were calculated according to Equations (1) and (2), respectively:
y G O S = c G O S c l a c 0 100 %
h l a c = c l a c 0 c l a c c l a c 0 100 %
where clac is the lactose concentration at each time (% w/v), clac(0) is the initial lactose concentration (% w/v), and cGOS is the galactooligosaccharide concentration at each time (% w/v), which were measured via the HPLC-RID method described in Section 2.4.
Analysis of variance (ANOVA) at a significance level of 95% was performed for the analysis of the obtained maximum GOS yields under different enzymatic bioconversion conditions (STATISTICA® 7.0, StatSoft Inc., Tulsa, OK, USA), which was followed by Duncan’s post hoc comparison test (a = 0.05) to evaluate when significant differences were observed.

3. Results and Discussion

3.1. Raw Materials Charactrerization

The sweet and acid whey composition analysis is shown in Table 1. The compositions of SW and AW were significantly (p < 0.05) different for all measured compounds besides Na+. Sweet whey had a higher total sugar concentration compared to AW. The total sugar concentration for SW and AW was on average 56.33 ± 0.82 g/L and 38.72 ± 2.81 g/L, respectively, which comprised 50.76 ± 0.80 g/L of lactose, 0.88 ± 0.16 g/L of galactose, and no glucose in the case of SW and 31.18 ± 2.34 g/L of lactose, 7.42 ± 1.56 g/L of galactose, and 0.12 ± 0.09 g/L of glucose in the case of AW. The protein concentration was much higher in SW than in AW, thereby amounting to 14.06 ± 0.42 g/L and 2.752 ± 0.421 g/L, respectively. The lactic acid concentration was higher in AW compared to SW (1.37 ± 0.05 over 0.578 ± 0.003 g/L), thereby resulting in pH values of 4.4 ± 0.2 and 6.2 ± 0.1, respectively, which was expected due to the different production process of each whey [1]. Additionally, the SW and AW compositions included a broad range of metal cations, which predominantly consisted of K+ (1363 ± 92 and 1131 ± 38 mg/L, respectively), Na+ (384.4 and 343.2 ± 50.4 mg/L, respectively), Ca2+ (344.5 ± 73.0 and 1175 ± 28 mg/L, respectively), and Mg2+ (14.92 ± 1.87 and 29.26 ± 6.20 mg/L, respectively). These findings are representative of liquid whey samples, since similar whey compositions have been specified in other studies [2,3,4,21]. The knowledge of the precise whey composition becomes crucial when investigating the enzymatic conversion of the lactose contained in dairy by-products into GOSs due to the fact that the enzymes involved in GOS synthesis can be influenced by whey compounds, especially by metal cations [21].

3.2. Enzymatic Bioconversion of Lactose in Dairy By-Products

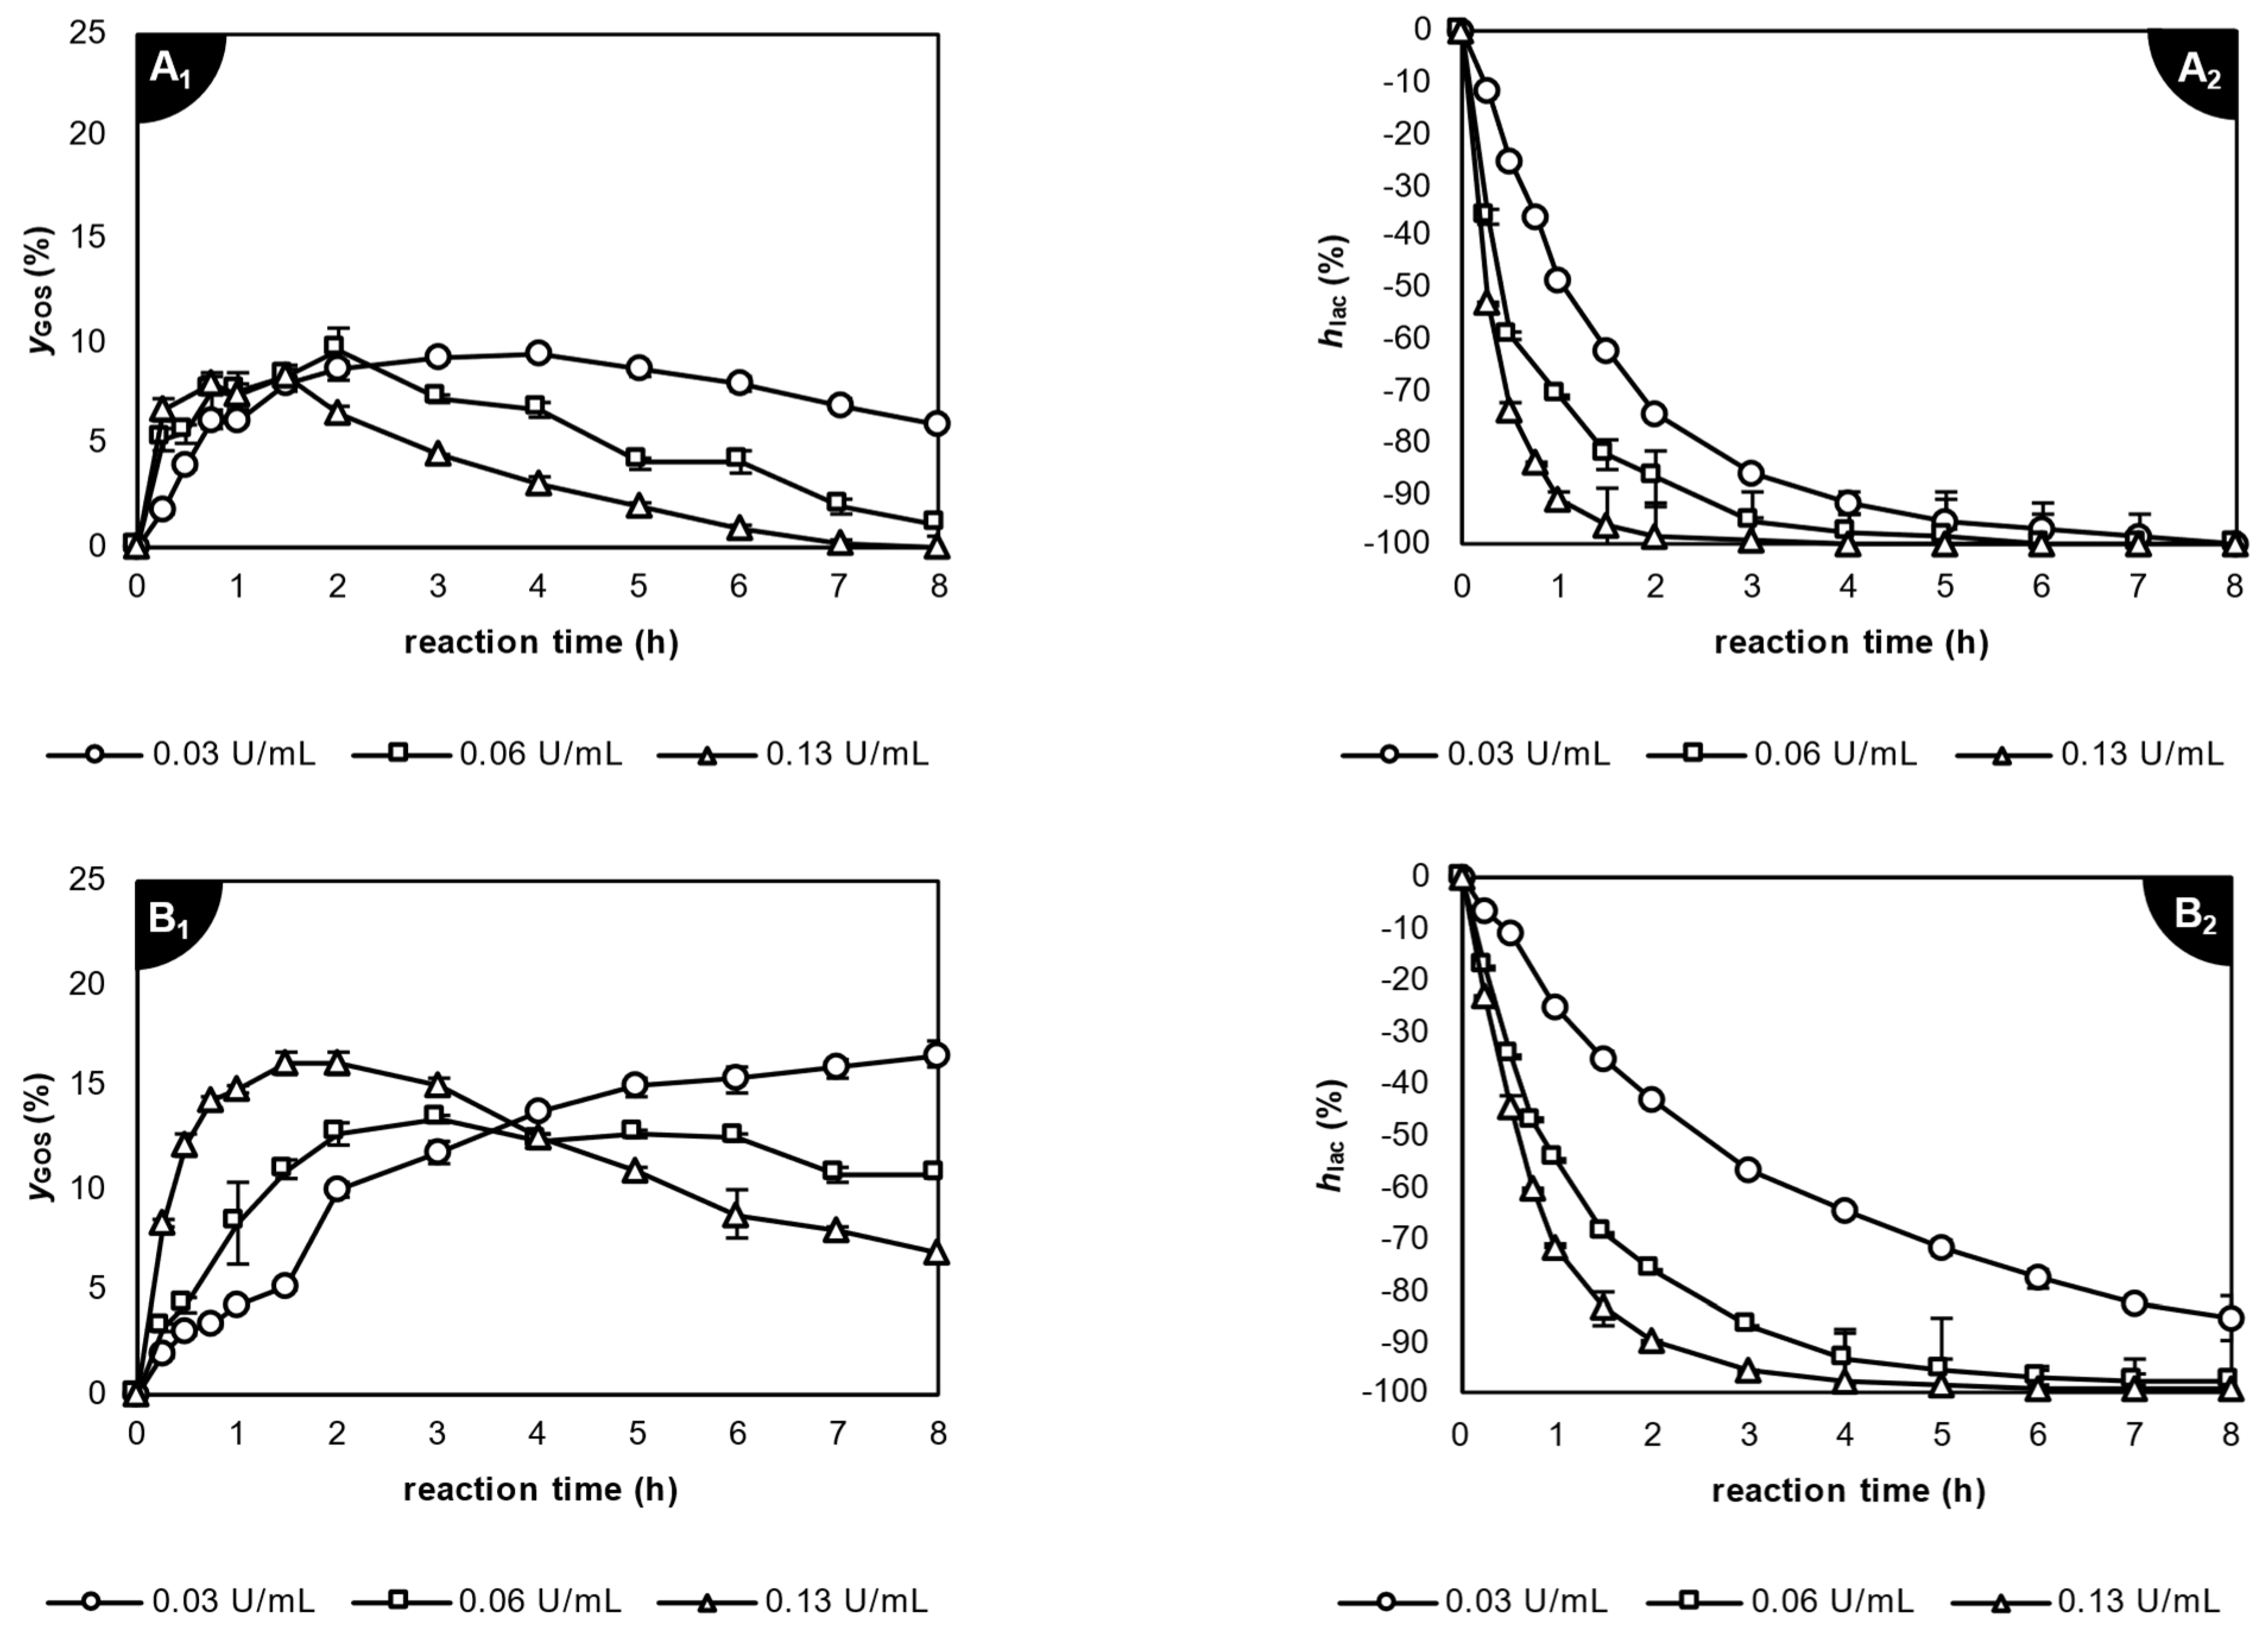
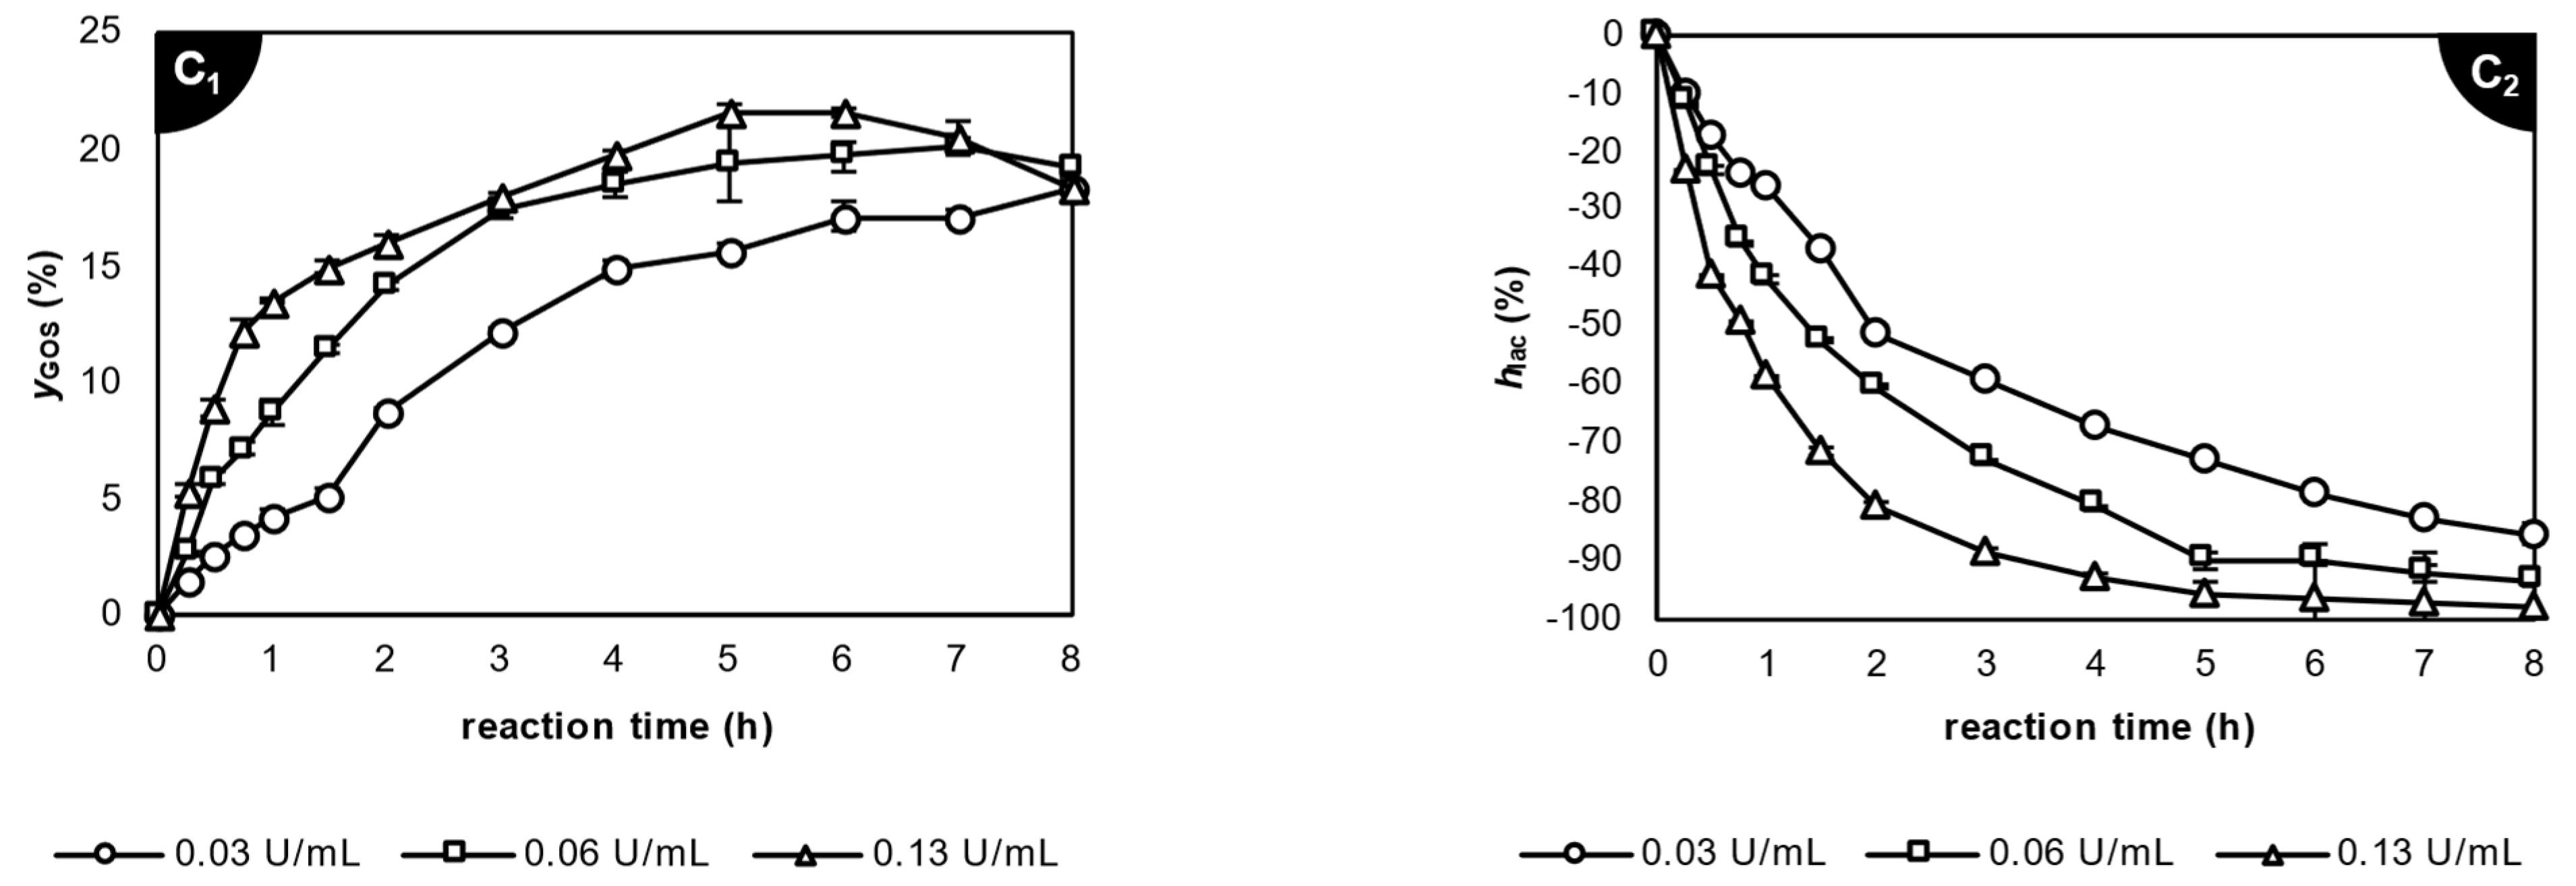
3.2.1. Utilization of Lactase from Kluyveromyces lactis

Figure 1 illustrates the GOS yields (yGOS) attained through the utilization of the lactase from K. lactis in the SW over time. In most cases, especially when high enzyme loads were applied in whey with a low initial lactose content, the yGOS exhibited an initial increase in the onset of transgalactosylation, which was followed by reaching a peak and, subsequently, a decline. This pattern indicates the disintegration of the generated GOSs, which can be elucidated by the previously described catalytic mechanism. The GOS synthesis rate is time-dependent, and GOSs act as both a product and a substrate during the two reaction stages. In the early stages of the reaction, GOSs are produced more rapidly than they are hydrolyzed, primarily owing to the fact that lactose is plentiful in the reaction mixture and is highly available for GOS synthesis. With lactose consumption, the GOS production rate decreases, while the hydrolysis rate increases. When the maximum GOS yield is achieved, these two rates become equal. As lactose is depleted, the enzyme is more likely to hydrolyze a GOS instead of lactose. Consequently, the GOS concentration diminishes [12,13,14]. When low enzyme loads were applied in highly concentrated whey, e.g., when an enzyme load of 0.13 U/mL of the K. lactis lactase was applied in concentrated SW with clac(0) equal to 10 or 15% w/v (Figure 1(B1,C1)), the aforementioned peak was not observed during the eight-hour enzymatic reaction owing to the low reaction rate that leads to maximization of the yGOS at longer reaction times.
Regarding the use of K. lactis lactase in non-concentrated SW, the oligosaccharide yielding was relatively poor. The maximum yGOS and the corresponding hlac values achieved in each case are presented in Table 2. A maximum yGOS of 9.64 ± 1.09% was attained with an enzyme load of 0.06 U/mL after 2 h of catalysis. A statistically similar (p > 0.05) maximum yGOS was attained in raw SW using half the enzyme load, yet the duration until yGOS maximization increased two times. When concentrated SW with a clac(0) of 10% w/v was used, the maximum yGOS values attained were higher: up to 16.5 ± 0.7% (0.03 U/mL, 8 h). Statistically similar (p > 0.05) results were attained with an enzyme load of 0.13 U/mL and 2 h of catalysis. The optimum results were attained with this lactase in the most condensed sweet whey (clac(0) = 15% w/v). The highest yGOS of 21.7 ± 0.2% was attained with an enzyme load of 0.13 U/mL and 5 h of catalysis, with the hlac at this point being equal to 95.6 ± 1.5%. A statistically similar (p > 0.05) maximum yGOS was attained with an enzyme load of 0.06 U/mL and 7 h of catalysis, while the lactose had been hydrolyzed in this case by 92.3 ± 1.2%.
According to the data retrieved from our previous study [28], which are presented comparatively in Table 2, the utilization of K. lactis lactase in AW presented greater GOS productivity in non-concentrated than in concentrated whey. The data for AW were retrieved from our previous study [28] and were explicitly included in Table 2, as they are part of an overall statistical analysis in order to compare the maximum yGOS achieved in SW and AW with the same biocatalyst. A maximum yGOS of 23.7 ± 1.4% was attained with an enzyme load of 0.13 U/mL and 1.5 h of catalysis in non-concentrated AW, which was accompanied by an hlac of approximately 76.0%. Increasing the clac(0) in AW lead to lower GOS productivity due to the significant influence of the metals found in AW, such as K+, Na+, and Ca2+, which enhance the hydrolytic activity of K. lactis lactase. Concentrated whey contains these cations in higher quantities, which may favor lactose hydrolysis over GOS production and consequently result in lower values of yGOS. This was not observed in the GOS synthesis from concentrated SW using this lactase. The main difference in the metal cation composition of SW compared to AW was found in the Ca2+ and Mg2+ concentrations (Table 1). Thus, it is concluded that the increased concentration of these cations in AW either enhances lactose hydrolysis or inhibits transgalactosylation reaction. In our previous study [28], it was observed that Ca2+ makes K. lactis lactase more active, while Mg2+ acts as an inhibitor, even at low concentrations (24.31 mg/L).
The use of K. lactis lactase in pure lactose solutions has been studied by González-Delgado et al. (2016), wherein they reported a maximum yGOS of 12.18%, when an enzyme load of 5 U/mL was used in a solution with a clac(0) of 25% w/v, after 3 h of catalysis [29]. The reported findings differ from the results of our study, because the use of less enzyme load in concentrated SW with a clac(0) of 15% w/v resulted in greater GOS productivity (21.7%). This can be attributed to the several cations found in SW that have been reported to make K. lactis lactase more active [21]. Mano et al. (2019) investigated the GOS production from whey permeate with a clac(0) of 30% w/v by applying 50 Units of K. lactis lactase per lactose gram (15 U/mL enzyme load) and mentioned a maximum yGOS of 25% after 2 h of catalysis [30]. These findings are quite close to the results presented in this study, though in our case, quite a lower enzyme load was required to achieve a high yGOS in a SW substrate with half the lactose content. Additionally, Fischer and Kleinschmidt (2015) researched the use of K. lactis lactase in both dairy by-products with clac(0) values of 3.8 and 20% w/v and reported a relatively low maximum yGOS equal to 4.30 and 10.56% for non-concentrated SW and AW, respectively, and a high maximum yGOS of 32.56 and 33.45% for concentrated SW and AW, respectively [21]. These findings agree with this study only regarding the facts that (a) higher values of maximum yGOS were attained in the AW compared to the SW, and (b) the use of concentrated whey resulted in higher values of the maximum yGOS. However, our results showed that by using non-concentrated whey, significantly higher values of maximum yGOS than those reported by Fischer and Kleinschmidt (2015) could be obtained, especially when using AW instead of SW. Furthermore, by using concentrated whey, a maximum yGOS of 20% and above could be achieved depending on the clac(0) of the substrate.

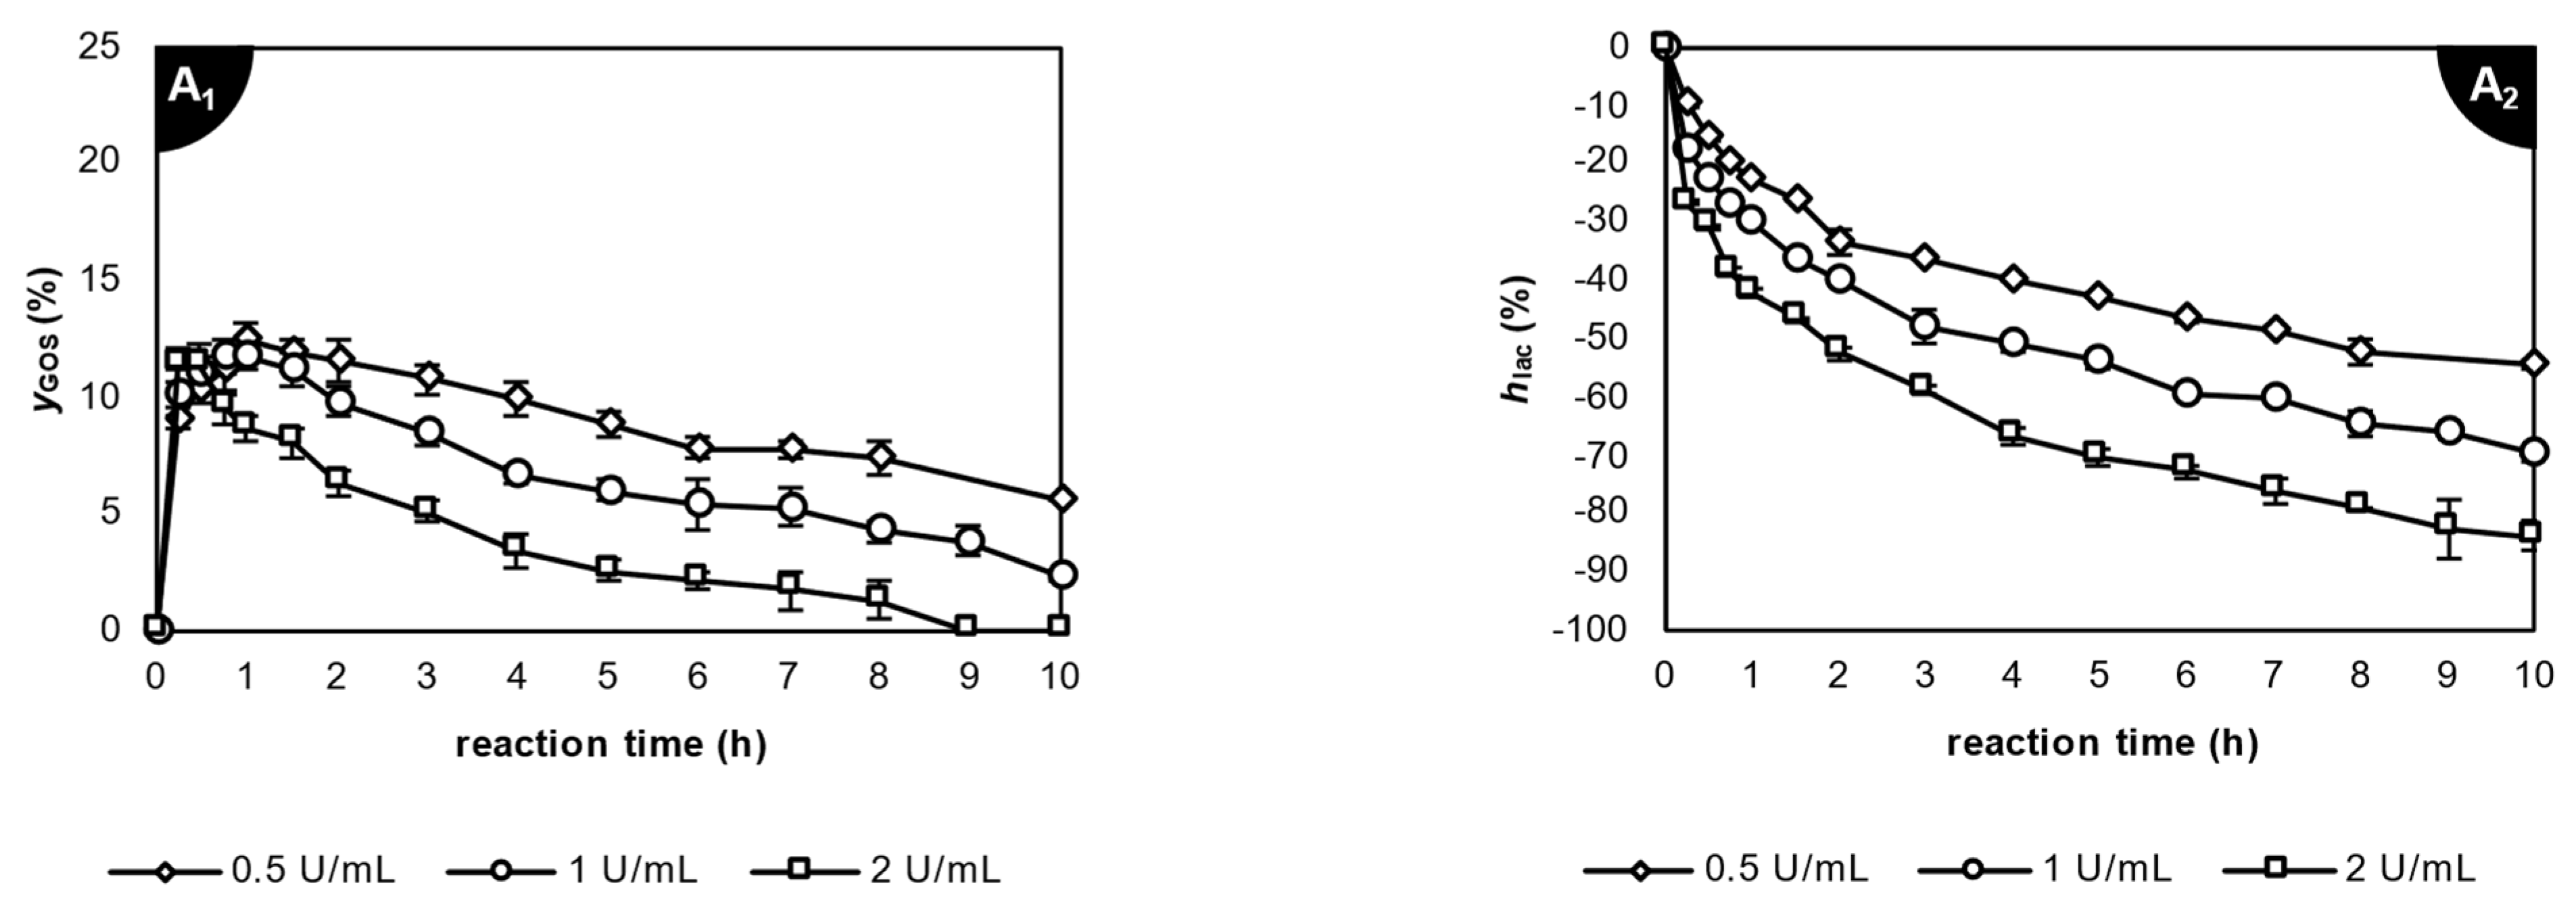
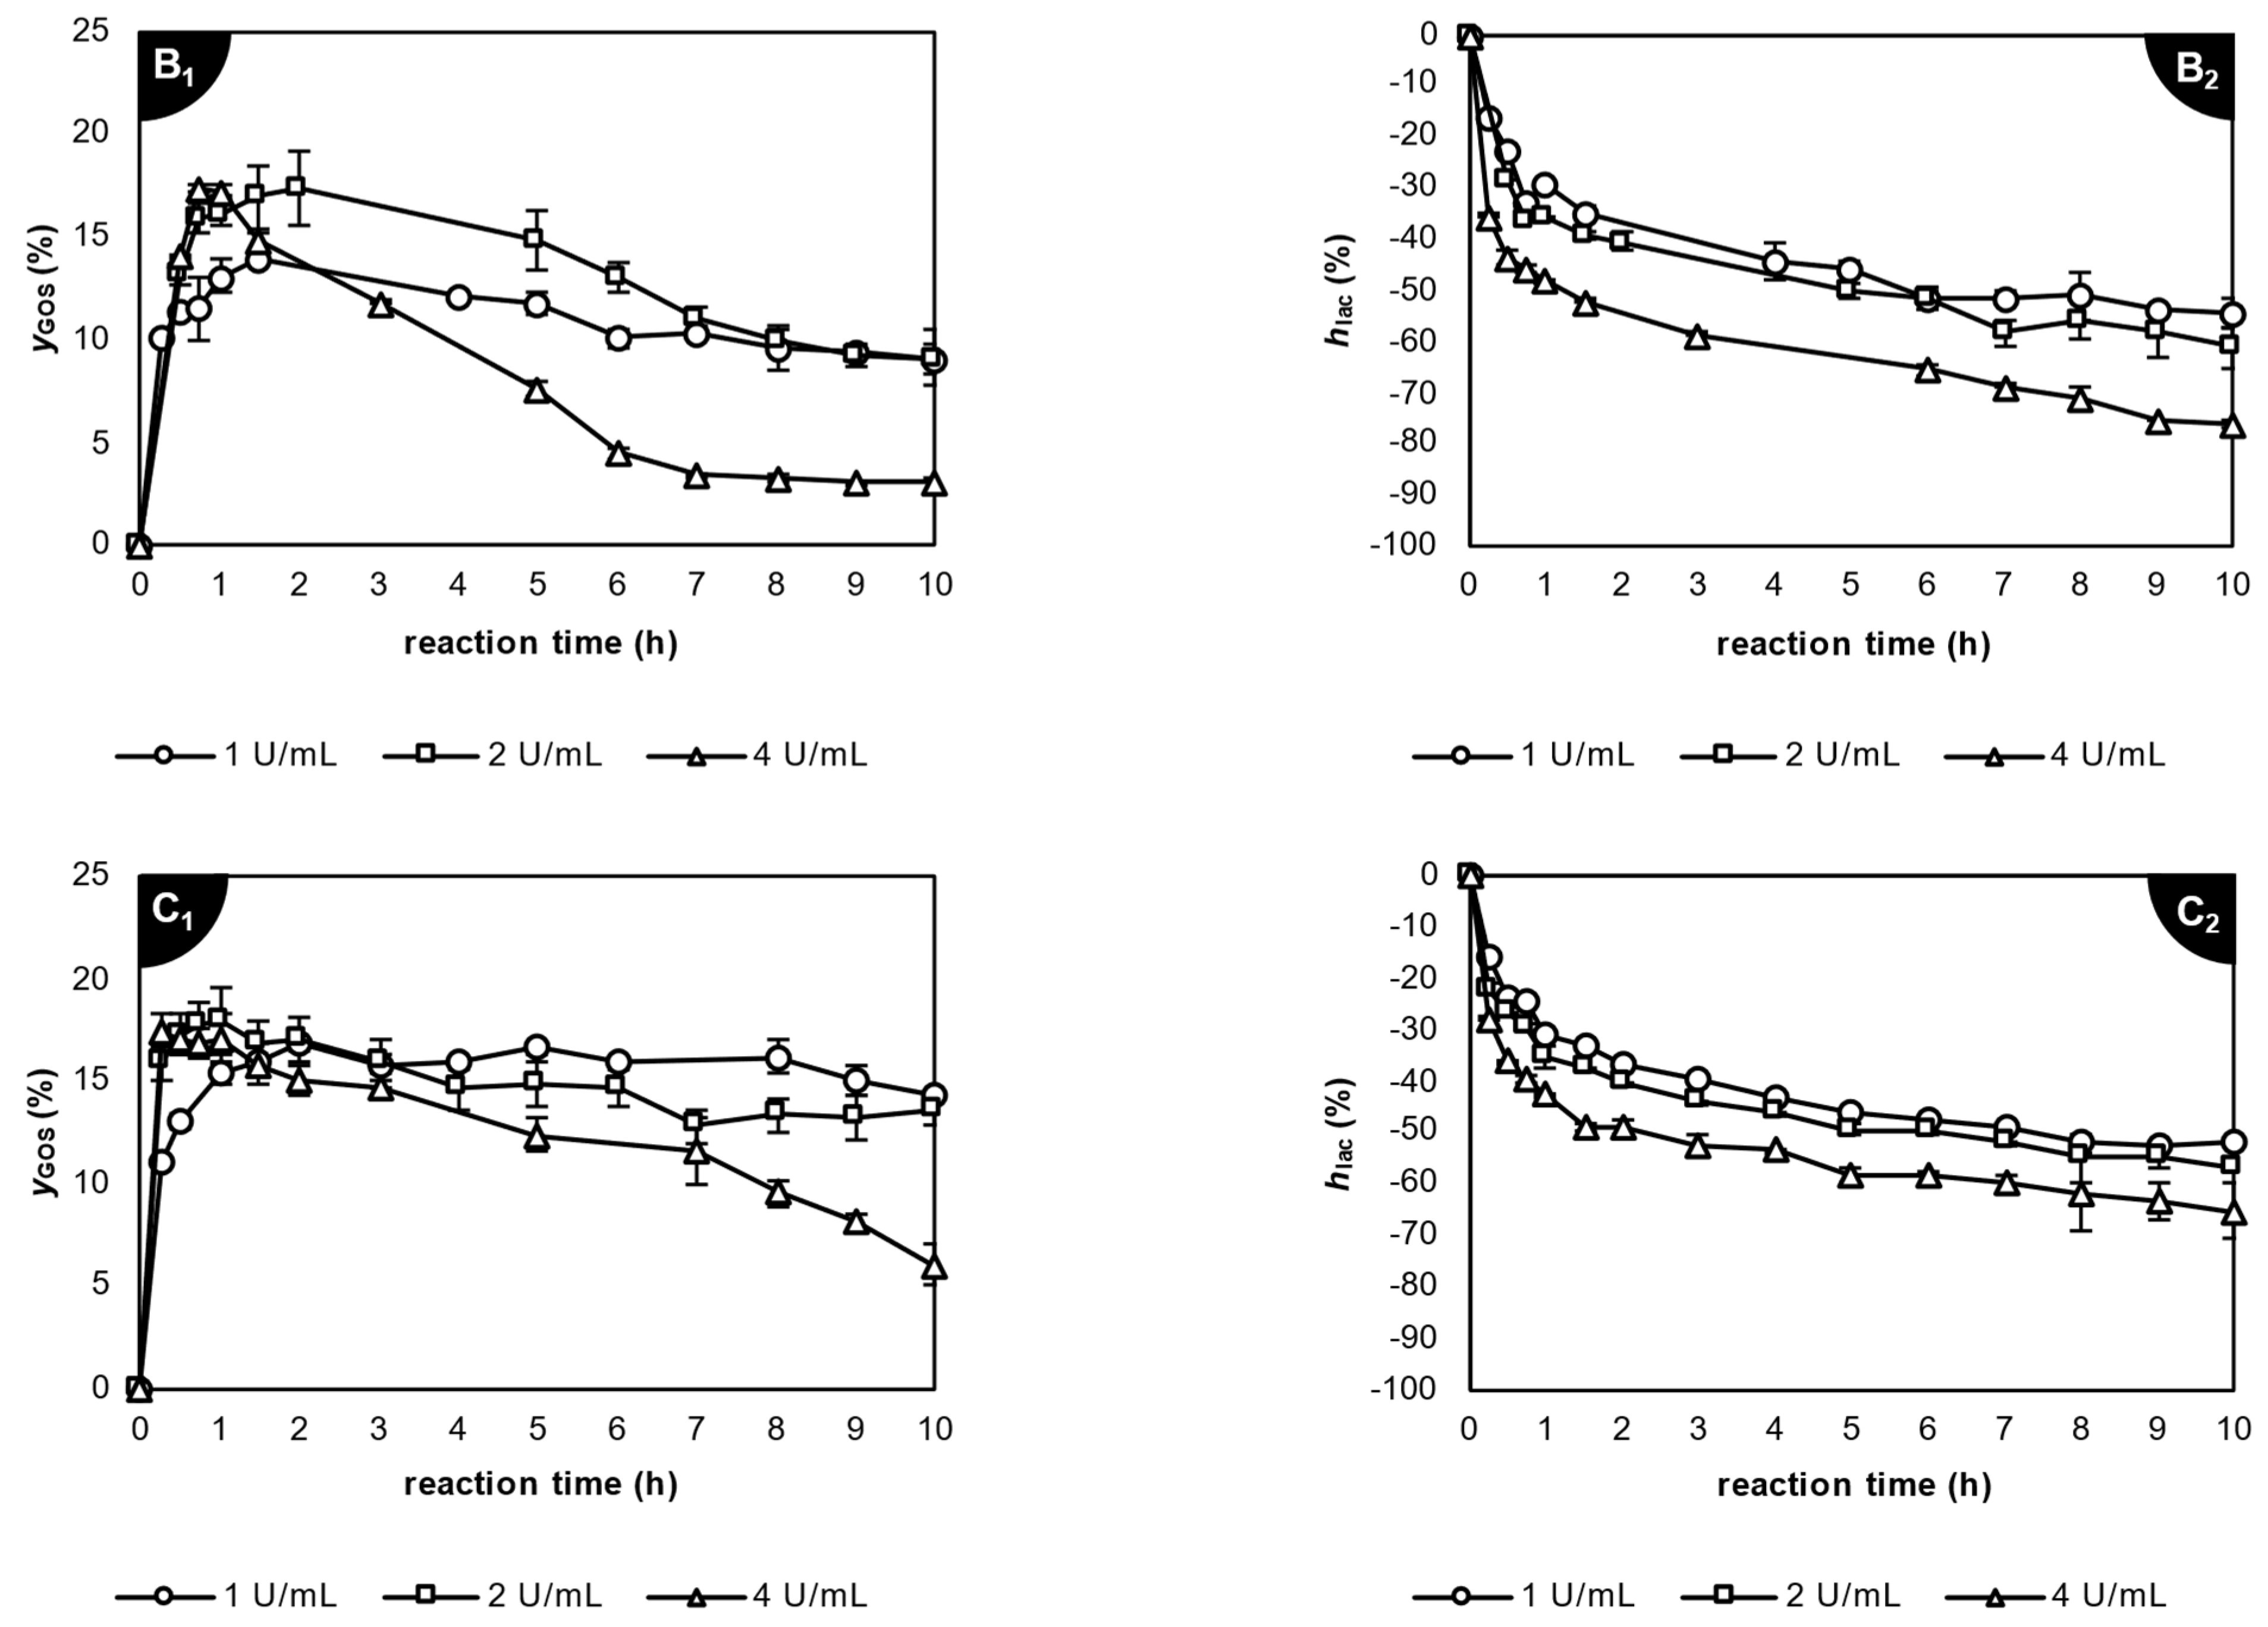
3.2.2. Utilization of Lactase from Aspergillus oryzae

Figure 2 shows the yGOS with respect to the reaction time attained through the utilization of varying enzyme loads of A. oryzae lactase in SW and AW. Similarly to the behavior observed with from the K. lactis lactase, the yGOS initially exhibited an increase, which was followed by reaching a peak value and subsequent decline. The intensity of GOS hydrolysis was more pronounced when starting with lower values of clac(0) and higher enzyme loads. This outcome is attributed to the fact that a higher enzyme concentration was available within the whey. With a high clac(0), the lactose remains abundant for a longer time, thereby enabling the production of more GOSs prior to their hydrolysis. This phenomenon allows for the accumulation of a greater quantity of GOSs before hydrolysis becomes prevalent.
In non-concentrated SW, considerably low and statistically similar (p > 0.05) maximum yGOS values were obtained, thus reaching up to 12.4 ± 0.7% with an enzyme load of 0.5 U/mL and 1 h of catalysis, with an accompanying hlac of 22.3% (Table 2). Similarly, according to the data retrieved from our previous study [28], the use of the A. oryzae lactase in non-concentrated AW also resulted in low yGOS values, which were up to 9.59 ± 0.56% (1 U/mL, 1 h), with an accompanying hlac of 29.6%. Concentrating the SW before the catalysis led to higher yGOS values. Specifically, in SW with a clac(0) of 10% w/v, the maximum yGOS reached up to approximately 17.3% with an enzyme load of either 2 or 4 U/mL after 2 h or 45 min of catalysis and with hlac values of 40.5 and 46.0%, respectively. In the more concentrated SW with a clac(0) of 15% w/v, even greater values of yGOS were measured, although more time was needed for the achievement of the highest yGOS. The maximum yGOS reached up to 17.9 ± 1.6% by applying an enzyme load of 2 U/mL after 1 h of catalysis, with an accompanying hlac of 35.5%. According to the results obtained from the application of A. oryzae lactase in concentrated AW with a clac(0) of 10% w/v, statistically not different (p > 0.05) maximum yGOS values of up to 18.5 ± 0.4% were attained with the application of enzyme loads ranging from 1 to 4 U/mL. In the more concentrated AW with a clac(0) of 15% w/v, the maximum yGOS reached up to 14.9 ± 0.7% (1 U/mL, 10 h), with an accompanying hlac of 59.9% [28]. This value was significantly lower (p < 0.05) than the maximum yGOS achieved in the concentrated SW with the same enzyme. Conclusively, for the same enzyme load, the increase in the clac(0) of the whey resulted in the achievement of an increased yGOS. Characteristically, using an enzyme load of 2 U/mL in the SW, the yGOS increased significantly (p < 0.05) from 11.4 ± 0.8% in non-concentrated SW to 17.9 ± 1.6% in SW with a clac(0) of 15% w/v. Additionally, in most cases, the increase in the enzyme load resulted in an increase in the lactose hydrolysis degree. For example, in the case of the AW with a clac(0) of 15% w/v, the increase in the enzyme load from 1 to 4 U/mL resulted in a significant (p < 0.05) increase in the hlac value at the time of maximization of the yGOS from 31.2 ± 0.7 to 42.1 ± 0.5%.
Urrutia et al. (2013) and Jenab et al. (2018) studied the application of A. oryzae lactase in standard lactose systems with clac(0) values of 40% w/v and reported maximum yGOS values of 26.8% and 23.0%, respectively [17,31]. These findings are in agreement with our study, but the lactase from A. oryzae was applied in solutions with much higher lactose concentrations. On the other hand, Simović et al. (2019) researched the application of A. oryzae lactase in concentrated SW (clac(0) = 40% w/v) for GOS production but reported lower maximum GOS yields than those of the present study, which were up to 15.5% (for the highest GOS concentration of 62 g/L) [22].
Table 2. Maximum galactooligosaccharide yield (yGOS(max)), time to achieve yGOS(max) (tGOS(max)), and lactose hydrolysis degree (hlac) for all investigated cases of galactooligosaccharide synthesis using sweet and acid whey.
Whey TypeLactase OriginT (°C)pHclac(0) (% w/v)AE (U/mL)yGOS(max) (%)tGOS(max) (h)hlac (%)
sweetKluyveromyces
lactis
357.25.10.039.41 ± 0.22 cd491.8 ± 2.4 pq
0.069.64 ± 1.09 d286.9 ± 5.4 no
0.137.99 ± 0.55 bc0.7583.8 ± 0.1 n
100.0316.5 ± 0.7 lmno885.3 ± 4.3 no
0.0613.4 ± 0.3 fghi387.1 ± 0.3 no
0.1316.1 ± 0.5 klmn289.5 ± 0.1 op
150.0318.3 ± 0.5 op885.5 ± 1.9 no
0.0620.3 ± 0.3 qr792.3 ± 1.2 pq
0.1321.7 ± 0.2 r595.6 ± 1.5 q
Aspergillus
oryzae
454.55.10.512.4 ± 0.7 efg122.3 ± 0.4 b
111.8 ± 0.6 ef130.1 ± 0.4 cd
211.4 ± 0.8 e0.2526.7 ± 0.3 c
10114.0 ± 0.1 ghij1.534.8 ± 1.3 ef
217.3 ± 1.8 nop240.5 ± 2.1 hi
417.3 ± 0.1 nop0.7546.0 ± 0.9 j
15116.8 ± 0.3 mno236.5 ± 0.1 fgh
217.9 ± 1.6 nop135.5 ± 2.0 fg
417.5 ± 0.8 nop0.2527.7 ± 0.1 cd
acid *Kluyveromyces
lactis
357.23.10.0621.2 ± 1.8 r378.9 ± 5.5 m
0.1323.7 ± 1.4 s1.576.0 ± 1.1 m
0.2615.6 ± 1.2 jklm0.7570.6 ± 1.8 l
100.0613.0 ± 0.6 efgh446.3 ± 4.8 j
0.1314.9 ± 1.8 ijkl249.3 ± 0.8 j
0.2612.4 ± 1.0 efg131.2 ± 3.4 de
150.0621.3 ± 1.1 r668.3 ± 4.6 l
0.1314.8 ± 1.1 hijkl354.0 ± 4.0 k
0.2618.8 ± 2.3 pq1.557.0 ± 4.0 k
Aspergillus
oryzae
454.53.10.55.88 ± 1.11 a335.6 ± 0.1 fg
16.67 ± 0.46 ab238.5 ± 0.2 fghi
27.86 ± 0.10 bc0.517.8 ± 0.3 a
10114.4 ± 0.3 hijk631.3 ± 0.2 de
213.4 ± 0.2 fghi339.7 ± 1.4 ghi
413.3 ± 0.6 fghi1.539.2 ± 1.1 ghi
15114.9 ± 0.7 ijkl1031.2 ± 0.7 de
212.3 ± 0.8 efg941.6 ± 0.2 i
412.3 ± 0.6 efg442.1 ± 0.5 i
clac(0): initial lactose content. AE: enzyme load. *—Data retrieved from Limnaios et al. (2023) for comparison [28]. Different letters within the same column indicate significant differences between means (± standard deviation) as determined using Duncan’s post hoc test for a significance level of p = 0.05.

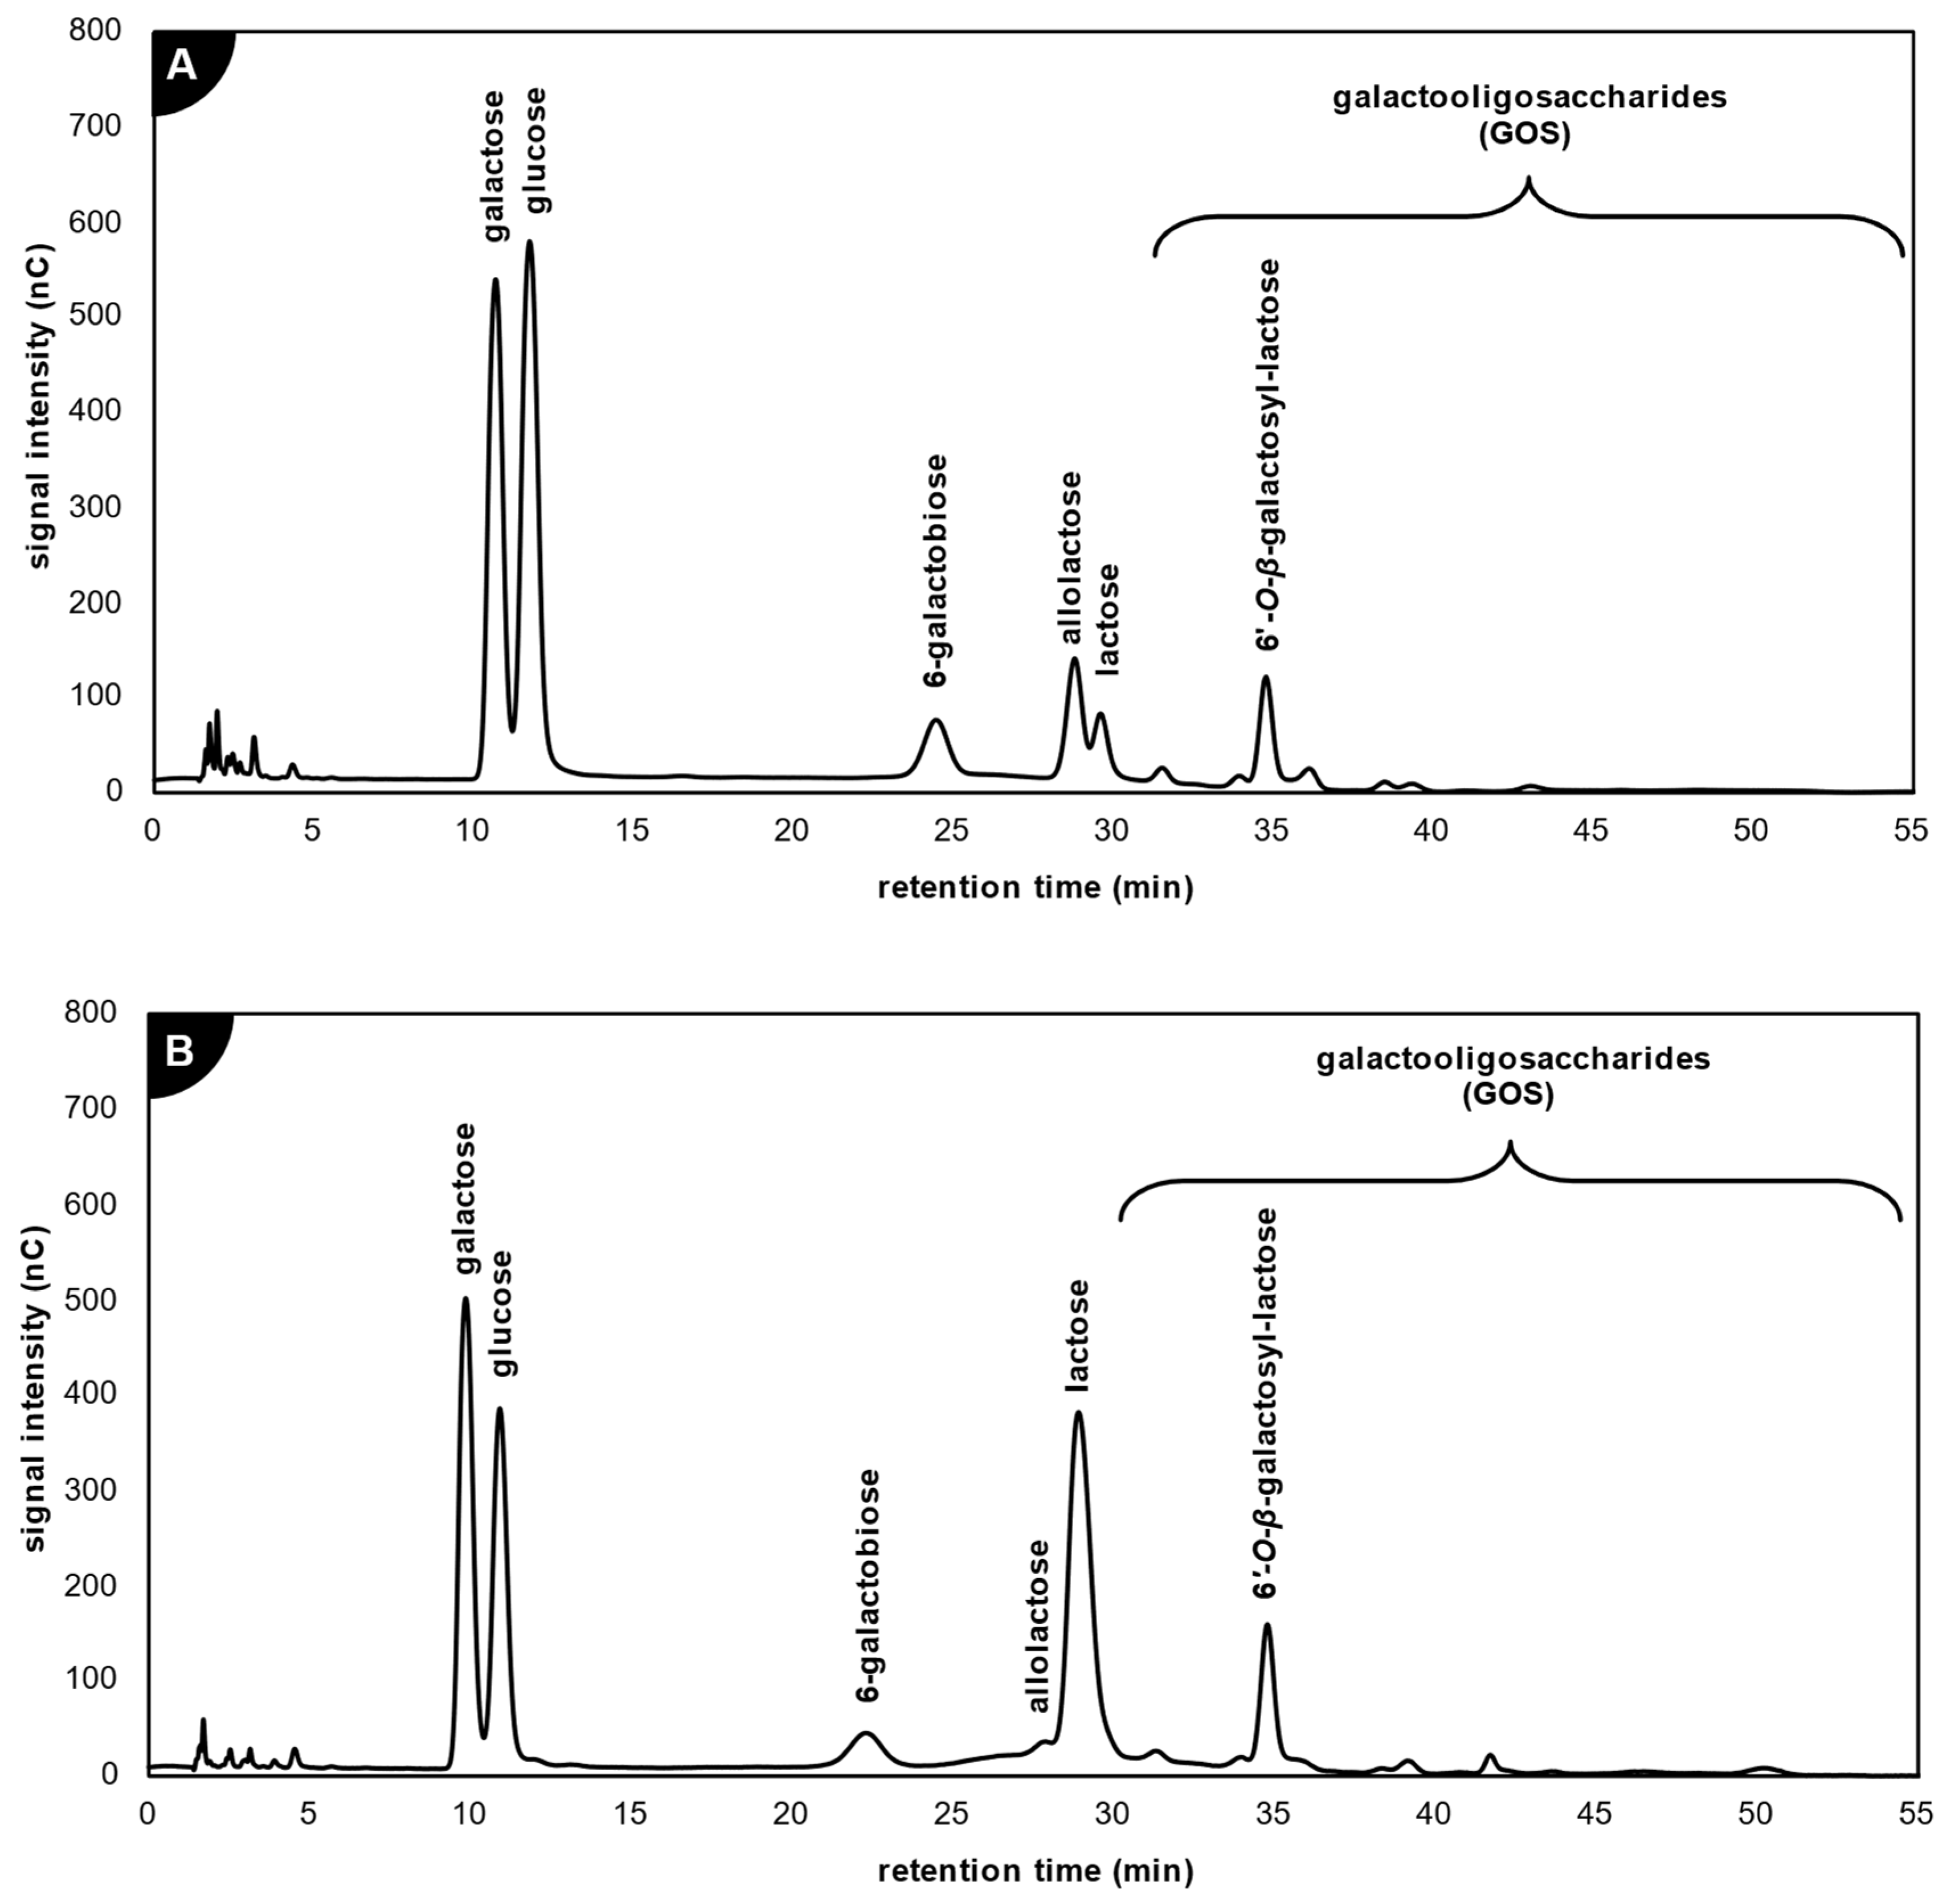
3.3. Profiles of Galactooligosaccharides Produced from Sweet and Acid Whey

The application of a lactase of different origin in SW and AW has an effect not only on the evolution of the enzymatic reaction and the maximum yGOS achieved but also on the profile of the produced oligosaccharides. For the visualization of the different GOS profiles achieved by applying a different enzyme in a different substrate, Figure 3 displays two characteristic chromatograms for the results of the enzymatic reactions conducted using the two different β-galactosidases on SW and AW that were obtained using the HPAEC-PAD analysis.
It is known that the primary oligosaccharides synthesized by the lactases from A. oryzae and K. lactis are the trisaccharide 6′-O-β-galactosyl-lactose and the disaccharides 6-galactobiose and allolactose, while the tetra-, penta- and hexasaccharides are produced in trace quantities [17]. Based on the HPAEC-PAD analysis, the primary oligosaccharide synthesized was detected at 35.6 min of elution and was assumed to be 6′-O-β-galactosyl-lactose, since it is the dominant oligosaccharide that is produced by lactases from K. lactis and A. oryzae, which is consistent with the findings from related studies employing similar GOS identification methods [14,17]. The second most plentiful transgalactosylation product was 6-galactobiose, which was identified using an available standard. Finally, a third reaction product that was produced in significant amounts in most cases was allolactose, which was eluted immediately prior to lactose and was again identified based on data from the literature [14,17]. The utilization of the β-galactosidase from K. lactis in both the SW and AW led to the formation of different profiles of GOSs in comparison to the use of the lactase from A. oryzae.
The lactase obtained from K. lactis broke down lactose more rapidly and resulted in higher levels of allolactose and less 6′-O-β-galactosyl-lactose. In contrast, the A. oryzae lactase produced greater amounts of 6′-O-β-galactosyl-lactose and lesser amounts of allolactose. Specifically, under optimal catalytic conditions using the β-galactosidase from K. lactis in the SW (clac(0) = 15% w/v, 0.13 U/mL, 5 h, 35 °C, pH = 7.2), the enzymatic reaction led to the formation of a GOS mixture consisting of 21.6% allolactose and 31.6% 6′-O-β-galactosyl-lactose, while the hlac was equal to 95.6%. According to the results of our previous study [28], with the optimal reaction conditions using the same lactase in the AW (clac(0) = 3.1% w/v, 0.13 U/mL, 1.5 h, 35 °C, pH = 7.2), the corresponding percentages of allolactose and 6′-O-β-galactosyl-lactose in the GOS mixture were 7.13% and 31.5%, respectively, while the degree of lactose hydrolysis rose to 76.0%.
The utilization of A. oryzae lactase in SW at the optimal catalysis conditions (clac(0) = 15% w/v, 2 U/mL, 1 h, 45 °C, pH = 4.5) led to the formation of a GOS mixture consisting of 68.0% 6′-O-β-galactosyl-lactose, while no production of allolactose was detected. Concerning the use of this lactase in AW at the optimal catalytic conditions (clac(0) = 15% w/v, 1 U/mL, 10 h, 45 °C, pH = 4.5), a GOS mixture consisting of 5.82% allolactose and 40.5% 6′-O-β-galactosyl-lactose was produced [28]. As for 6-galactobiose, the use of the K. lactis lactase in both the SW and AW resulted in similar percentages of the disaccharide in the produced GOS mixture (14.8 and 13.6%, respectively). On the contrary, the type of whey had a major effect on the production of 6-galactobiose when the lactase from A. oryzae was used. Specifically, in the GOS mixture produced from SW, the percentage of 6-galactobiose was quite low (2.05%), while the use of AW as the substrate resulted in a high percentage of this disaccharide in the GOS mixture (28.3%) at the optimum conditions [28]. The utilization of A. oryzae lactase in both the SW and AW led to significantly lower values of the hlac (35.5 and 31.2%, respectively).
Rico-Rodríguez et al. (2021) investigated the utilization of both lactases individually and concurrently in enzymatic reactions involving pure lactose and cheese whey with clac(0) values of 40% w/w. Their findings revealed that when using lactose, the highest yGOS reached 32.7 and 41.7% of the total sugar content when utilizing the fungal and yeast lactase, respectively. In the whey, the respective maximum yGOS values were 35.6 and 29.6% of the total sugars. Furthermore, it was noted that the simultaneous use of the enzymes yielded GOS quantities comparable to those obtained when the enzymes were used individually, yet there were notable distinctions in the GOS product profiles in terms of their polymerization degree [32].

4. Conclusions

In this study, a comparative investigation of prebiotic galactooligosaccharide production was conducted, via the application of two commercially available biocatalysts from K. lactis and A. oryzae, utilizing SW and AW as substrates. The application of the β-galactosidase from K. lactis in SW and AW resulted in higher GOS yields compared to the use of the A. oryzae lactase. Maximum yGOS values of 21.7 and 23.7% were achieved with the K. lactis enzyme in concentrated SW and in raw AW, respectively. The application of the lactase from A. oryzae in concentrated SW and AW resulted in maximum yGOS values of 17.9 and 14.9%, respectively. Concerning the produced GOS profiles, the most abundant oligosaccharides were allolactose, 6-galactobiose, and 6′-O-β-galactosyl-lactose. The GOS profile analysis showed that both the type of whey and the lactase origin play a significant role in the GOSs that are produced. The yeast lactase broke down lactose more rapidly and resulted in high levels of allolactose and low levels of 6′-O-β-galactosyl-lactose, while the fungal lactase synthesized more 6′-O-β-galactosyl-lactose and less allolactose. Moreover, the application of the yeast lactase from K. lactis in AW led to the production of significantly lower levels of allolactose compared to that produced from SW, while in the case of the fungal lactase from A. oryzae, a significant increase in the levels of allolactose and 6-galactobiose were observed when the enzyme was applied in AW as compared to SW. These observations suggest that, despite the optimum conditions needed to be applied in order to maximize the yGOS, the use of a specific enzyme and/or whey substrate may lead to the selective production of certain GOSs. The high levels of GOS productivity with the use of the two commercially available lactases directly in SW and AW can facilitate an efficient process with a high profitable benefit for the dairy industry, thereby offering a practical and environmentally friendly solution for addressing the issue of sweet and acid whey management.

Author Contributions

Conceptualization, A.L., M.T., E.T. and P.T.; methodology, A.L. and M.T.; validation, A.L. and M.T.; formal analysis, A.L. and M.T.; investigation, A.L., E.Z. and M.T.; writing—original draft preparation, A.L. and M.T.; writing—review and editing, M.T., E.T. and P.T.; visualization, A.L.; supervision, E.T. and P.T.; project administration, M.T. and P.T.; funding acquisition, P.T. All authors have read and agreed to the published version of the manuscript.

Funding

This research has been cofinanced by the European Regional Development Fund of the European Union and Greek national funds through the Operational Program Competitiveness, Entrepreneurship and Innovation under the call RESEARCH-CREATE-INNOVATE (Project PERIOROU, ID: T2EDK-00783, MIS 5074577), as well as the European Structural and Investment Funds and Greek national funds through the action “Supporting enterprises from creative research projects in agri-food, creative industry, ICT, health and biotechnology” of the Operational Program “Epirus 2014–2020” (Project INEPICWHEY, ID: EP1AB-0028208, MIS 5033108).Dairy 05 00007 i001

Institutional Review Board Statement

Not applicable.

Data Availability Statement

Data are contained within the article.

Conflicts of Interest

The authors declare no conflicts of interest.

References

  1. Jelen, P. WHEY PROCESSING | Utilization and Products. Encycl. Dairy Sci. 2011, 731–737. [Google Scholar] [CrossRef]
  2. Menchik, P.; Zuber, T.; Zuber, A.; Moraru, C.I. Short Communication: Composition of Coproduct Streams from Dairy Processing: Acid Whey and Milk Permeate. J. Dairy Sci. 2019, 102, 3978–3984. [Google Scholar] [CrossRef] [PubMed]
  3. Nishanthi, M.; Vasiljevic, T.; Chandrapala, J. Properties of Whey Proteins Obtained from Different Whey Streams. Int. Dairy J. 2017, 66, 76–83. [Google Scholar] [CrossRef]
  4. Božanić, R.; Barukčić, I.; Lisak, K.; Tratnik, J.; Tratnik, L. Possibilities of Whey Utilisation. Austin J. Nutr. Food Sci. 2014, 2, 1–7. [Google Scholar]
  5. Rocha-Mendoza, D.; Kosmerl, E.; Krentz, A.; Zhang, L.; Badiger, S.; Miyagusuku-Cruzado, G.; Mayta-Apaza, A.; Giusti, M.; Jiménez-Flores, R.; García-Cano, I. Invited Review: Acid Whey Trends and Health Benefits. J. Dairy Sci. 2021, 104, 1262–1275. [Google Scholar] [CrossRef] [PubMed]
  6. OECD. OECD-FAO Agricultural Outlook 2023–2032; OECD-FAO Agricultural Outlook; OECD: Paris, France, 2023; ISBN 9789264619333. [Google Scholar]
  7. Erickson, B.E. Acid Whey: Is the Waste Product an Untapped Goldmine? Companies, Food Scientists Develop Innovative Solutions to Handle Tons of Greek Yogurt Byproduct. Chem. Eng. News 2017, 95, 26–30. [Google Scholar]
  8. Greek Yogurt Market. 2022. Available online: https://www.factmr.com/report/269/greek-yogurt-market (accessed on 28 December 2023).
  9. Smithers, G.W. Whey and Whey Proteins-From “Gutter-to-Gold”. Int. Dairy J. 2008, 18, 695–704. [Google Scholar] [CrossRef]
  10. Ketterings, Q.; Czymmek, K.; Gami, S.; Godwin, G.; Ganoe, K. Guidelines for Land Application of Acid Whey; Cornell University Department of Animal Science Publication Series; Cornell University: Ithaca, NY, USA, 2017; Volume 247. [Google Scholar]
  11. Fischer, C.; Kleinschmidt, T. Synthesis of Galactooligosaccharides in Milk and Whey: A Review. Compr. Rev. Food Sci. Food Saf. 2018, 17, 678–697. [Google Scholar] [CrossRef]
  12. Gosling, A.; Stevens, G.W.; Barber, A.R.; Kentish, S.E.; Gras, S.L. Recent Advances Refining Galactooligosaccharide Production from Lactose. Food Chem. 2010, 121, 307–318. [Google Scholar] [CrossRef]
  13. Torres, D.P.M.; Gonçalves, M.d.P.F.; Teixeira, J.A.; Rodrigues, L.R. Galacto-Oligosaccharides: Production, Properties, Applications, and Significance as Prebiotics. Compr. Rev. Food Sci. Food Saf. 2010, 9, 438–454. [Google Scholar] [CrossRef] [PubMed]
  14. Yin, H.; Bultema, J.B.; Dijkhuizen, L.; van Leeuwen, S.S. Reaction Kinetics and Galactooligosaccharide Product Profiles of the β-Galactosidases from Bacillus Circulans, Kluyveromyces Lactis and Aspergillus Oryzae. Food Chem. 2017, 225, 230–238. [Google Scholar] [CrossRef] [PubMed]
  15. Barile, D.; Rastall, R.A. Human Milk and Related Oligosaccharides as Prebiotics. Curr. Opin. Biotechnol. 2013, 24, 214–219. [Google Scholar] [CrossRef] [PubMed]
  16. Rodriguez-Colinas, B.; Fernandez-Arrojo, L.; Ballesteros, A.O.; Plou, F.J. Galactooligosaccharides Formation during Enzymatic Hydrolysis of Lactose: Towards a Prebiotic-Enriched Milk. Food Chem. 2014, 145, 388–394. [Google Scholar] [CrossRef] [PubMed]
  17. Urrutia, P.; Rodriguez-Colinas, B.; Fernandez-Arrojo, L.; Ballesteros, A.O.; Wilson, L.; Illanes, A.; Plou, F.J. Detailed Analysis of Galactooligosaccharides Synthesis with β-Galactosidase from Aspergillus Oryzae. J. Agric. Food Chem. 2013, 61, 1081–1087. [Google Scholar] [CrossRef] [PubMed]
  18. Srivastava, A.; Mishra, S.; Chand, S. Transgalactosylation of Lactose for Synthesis of Galacto-Oligosaccharides Using Kluyveromyces Marxianus NCIM 3551. N. Biotechnol. 2015, 32, 412–418. [Google Scholar] [CrossRef] [PubMed]
  19. Yañez-Ñeco, C.V.; Cervantes, F.V.; Amaya-Delgado, L.; Ballesteros, A.O.; Plou, F.J.; Arrizon, J. Synthesis of β(1 → 3) and β(1 → 6) Galactooligosaccharides from Lactose and Whey Using a Recombinant β-Galactosidase from Pantoea Anthophila. Electron. J. Biotechnol. 2021, 49, 14–21. [Google Scholar] [CrossRef]
  20. Zeuner, B.; Nyffenegger, C.; Mikkelsen, J.D.; Meyer, A.S. Thermostable β-Galactosidases for the Synthesis of Human Milk Oligosaccharides. N. Biotechnol. 2016, 33, 355–360. [Google Scholar] [CrossRef] [PubMed]
  21. Fischer, C.; Kleinschmidt, T. Synthesis of Galactooligosaccharides Using Sweet and Acid Whey as a Substrate. Int. Dairy J. 2015, 48, 15–22. [Google Scholar] [CrossRef]
  22. Simović, M.; Milivojević, A.; Ćorović, M.; Banjanac, K.; Bezbradica, D. Whey Valorization Using Transgalactosylation Activity of Immobilized β-Galactosidase. Int. J. Food Sci. Technol. 2019, 54, 3074–3082. [Google Scholar] [CrossRef]
  23. Zerva, A.; Limnaios, A.; Kritikou, A.S.; Thomaidis, N.S.; Taoukis, P.; Topakas, E. A Novel Thermophile β-Galactosidase from Thermothielavioides Terrestris Producing Galactooligosaccharides from Acid Whey. N. Biotechnol. 2021, 63, 45–53. [Google Scholar] [CrossRef]
  24. Kjeldahl, J. Neue Methode Zur Bestimmung Des Stickstoffs in Organischen Körpern. Z. Anal. Chem. 1883, 22, 366–382. [Google Scholar] [CrossRef]
  25. van Boekel, M.A.J.S.; Ribadeau Dumas, B. Addendum to the Evaluation of the Kjeldahl Factor for Conversion of the Nitrogen Content of Milk and Milk Products to Protein Content. Neth. Milk Dairy J. 1987, 41, 281–284. [Google Scholar]
  26. O’Connor, T.P.; O’Brien, N.M. LIPIDS | Analytical Methods. Encycl. Dairy Sci. 2002, 1583–1587. [Google Scholar]
  27. Borshchevskaya, L.N.; Gordeeva, T.L.; Kalinina, A.N.; Sineokii, S.P. Spectrophotometric Determination of Lactic Acid. J. Anal. Chem. 2016, 71, 755–758. [Google Scholar] [CrossRef]
  28. Limnaios, A.; Tsevdou, M.; Tsika, E.; Korialou, N.; Zerva, A.; Topakas, E.; Taoukis, P. Production of Prebiotic Galacto-Oligosaccharides from Acid Whey Catalyzed by a Novel β-Galactosidase from Thermothielavioides Terrestris and Commercial Lactases: A Comparative Study. Catalysts 2023, 13, 1360. [Google Scholar] [CrossRef]
  29. González-Delgado, I.; López-Muñoz, M.J.; Morales, G.; Segura, Y. Optimisation of the Synthesis of High Galacto-Oligosaccharides (GOS) from Lactose with β-Galactosidase from Kluyveromyces Lactis. Int. Dairy J. 2016, 61, 211–219. [Google Scholar] [CrossRef]
  30. Mano, M.C.R.; Paulino, B.N.; Pastore, G.M. Whey Permeate as the Raw Material in Galacto-Oligosaccharide Synthesis Using Commercial Enzymes. Food Res. Int. 2019, 124, 78–85. [Google Scholar] [CrossRef]
  31. Jenab, E.; Omidghane, M.; Mussone, P.; Armada, D.H.; Cartmell, J.; Montemagno, C. Enzymatic Conversion of Lactose into Galacto-Oligosaccharides: The Effect of Process Parameters, Kinetics, Foam Architecture, and Product Characterization. J. Food Eng. 2018, 222, 63–72. [Google Scholar] [CrossRef]
  32. Rico-Rodríguez, F.; Noriega, M.A.; Lancheros, R.; Serrato-Bermúdez, J.C. Kinetics of Galactooligosaccharide (GOS) Production with Two β-Galactosidases Combined: Mathematical Model and Raw Material Effects. Int. Dairy J. 2021, 118, 105015. [Google Scholar] [CrossRef]
Figure 1. Yields of 1 galactooligosaccharides (yGOS) and 2 lactose hydrolysis (hlac) over catalysis time with lactase from Kluyveromyces lactis in sweet whey with initial lactose contents of (A1,A2) 5.1% w/v, (B1,B2) 10% w/v, and (C1,C2) 15% w/v, which were calculated via the analysis of the reactions’ samples using the high-performance liquid chromatography with refractive index detector method.
Dairy 05 00007 g001aDairy 05 00007 g001b
Figure 2. Yields of 1 galactooligosaccharides (yGOS) and 2 lactose hydrolysis (hlac) over catalysis time with lactase from Aspergillus oryzae in sweet whey with initial lactose contents of (A1,A2) 5.1% w/v, (B1,B2) 10% w/v, and (C1,C2) 15% w/v, which were calculated via the analysis of the reactions’ samples using the high-performance liquid chromatography with refractive index detector method.
Dairy 05 00007 g002aDairy 05 00007 g002b
Figure 3. High-performance anion exchange chromatography with pulsed amperometric detection chromatograms of the oligomerization compounds via the use of lactase from (A) Kluyveromyces lactis in sweet whey and (B) Aspergillus oryzae in acid whey at the optimum reaction conditions. Allolactose and 6′-O-β-galactosyl-lactose were determined following the results from Urrutia et al. (2013) [17].
Dairy 05 00007 g003
Table 1. Proximate analysis of the major dairy by-products.
CompoundSweet WheyAcid Whey *
Concentration (g/L)
Total sugars56.33 ± 0.82 a38.72 ± 2.81 b
of which:Lactose50.76 ± 0.80 a31.18 ± 2.34 b
Galactose0.88 ± 0.16 a7.42 ± 1.56 b
Glucosen.d.0.12 ± 0.09
Total proteins14.06 ± 0.42 a2.752 ± 0.421 b
Fat0.037 ± 0.009 a0.719 ± 0.120 b
Lactic acid0.578 ± 0.003 a1.37 ± 0.05 b
Solid residue73.49 ± 1.40 a53.75 ± 2.50 b
Ash4.489 ± 0.960 a8.964 ± 0.198 b
K+1.363 ± 0.092 a1.131 ± 0.038 b
Na+0.3844 ± 0.0255 a0.3432 ± 0.0504 a
Ca2+0.3445 ± 0.0730 a1.175 ± 0.028 b
Mg2+0.01492 ± 0.00187 a0.02926 ± 0.00620 b
n.d.: not detected. *—Data retrieved from our previous study [28] for comparative purposes. Different letters within the same row indicate significant differences between means (± standard deviation) as determined using Duncan’s post hoc test for a significance level of p = 0.05.
Disclaimer/Publisher’s Note: The statements, opinions and data contained in all publications are solely those of the individual author(s) and contributor(s) and not of MDPI and/or the editor(s). MDPI and/or the editor(s) disclaim responsibility for any injury to people or property resulting from any ideas, methods, instructions or products referred to in the content.

