Article

Effect of Calving Season on Productive Performance of Dairy Cows

1
Department of Ecology and Animal Hygiene, Faculty of Agriculture, Trakia University, 6000 Stara Zagora, Bulgaria
2
Department of Animal Husbandry—Ruminant Animals and Animal Products Technologies, Faculty of Agriculture, Trakia University, 6000 Stara Zagora, Bulgaria
*
Author to whom correspondence should be addressed.
Dairy 2024, 5(1), 217-228; https://doi.org/10.3390/dairy5010018
Submission received: 30 November 2023 / Revised: 12 January 2024 / Accepted: 1 March 2024 / Published: 7 March 2024
(This article belongs to the Section Dairy Animal Nutrition and Welfare)

Abstract

:

Simple Summary

In the last decade, we have been witnessing serious climate changes related to global warming. This affects all living beings, including dairy cows. As the climate warms, dairy cows in temperate climate zones experience heat stress (HS), which affects the quantity and quality of milk they produce. In the present scientific work, the influence of the calving season on the yield and composition of cows’ milk was studied. As a result of the study, it was found that cows that calved in summer, under conditions of HS, had the lowest milk yields for lactation, the lowest milk yields at the peak of lactation, and the lowest fat content compared to cows that calved in other seasons of the year. Regarding the protein content of the milk, a tendency was found for cattle that calved in the summer to have the highest values of this trait.

Abstract

The aim of the present research was to study the influence of the calving season in conditions of the upcoming climate changes on the productive traits of dairy cows in Bulgaria. The study was conducted on a cattle farm with a capacity of 500 dairy cows, which were loose-housed in open free-stall barns (shed-type). In the research, 286 lactations of 199 Holstein cattle from the studied farm were included. The cows with the highest average milk yield for lactation—8522.2 kg—calved in the spring, while the cows with the lowest milk yield—8082.7 kg—calved in the summer. Cows that calved in the spring had the highest maximum daily milk yield (lactation peak)—38 kg—whereas cows that calved in the summer had the lowest—35.7 kg. Regarding the composition indicators of milk, fat, and protein content, no significant effect of the calving season was found, but there was a tendency for the lowest values for the percentage of fat in milk to be reported for cows that calved in the summer—3.68%—and the highest for those calved in the spring—3.71%. Regarding the percentage of protein in the milk, the lowest values were observed for cows that calved in autumn—3.19%—and the highest for cows that calved in summer—3.27%.

1. Introduction

Environmental conditions are a major stressor that affects animals and can lead to serious changes in their physiological indicators [1]. Until recently, it was assumed that high ambient temperatures negatively affected animals mainly in tropical regions. Nowadays, we are witnessing appreciable global warming, resulting in a rise in ambient temperature in more northern latitudes with temperate climates also [2,3,4].
For Europe, temperature increases are expected in all seasons [5]. Regional climate models expect strong warming which is particularly pronounced in winter in large parts of northeastern Europe. The strongest summer warming is expected to be observed in southern and southwestern Europe. Along with rising temperature, changes in humidity (precipitation) and wind speed and direction are also expected.
There is evidence that animals in European countries will face heat stress (HS), with climate change leading to hotter summers and an increased risk of extreme weather events [6,7]. As a result of climate change, HS in dairy cows is becoming an increasingly widely discussed topic. Additionally, in some regions of the world, the problem of HS in dairy cows is becoming more pronounced and at a much faster rate than in others [8]. According to some authors, such as Hempel et al. [9], in Europe, over 30% of the days of the year will have critical conditions in terms of HS for cows and may cause up to a 2.8% drop in milk productivity compared to current conditions.
Research conducted by the Department of Meteorology of the National Institute of Meteorology and Hydrology at the Bulgarian Academy of Sciences [10] predicts increases in the annual air temperature in Bulgaria by 2050 and 2080, respectively, from 1.6 °C to 3.1 °C and from 2.9 °C to 4.1 °C. In general, the increase in temperature is expected to be greater during the summer season (July to September).
Climate change is a problem facing farmers in many regions of the world, especially in the livestock industry. Although dairy cattle are able to cope with a wide range of climatic conditions, the sustainability of their productivity is potentially challenged by climate change, especially for larger breeds such as Holsteins [11]. The negative impact of HS on the amount of milk produced by cows is also reported by a number of authors [12,13], and in addition, there are studies that report a deterioration of milk quality in terms of protein content [14] and fat content [15]. In Bulgaria, Penev et al. [16] studied the relationship between HS and daily milk yield among dairy cows. The authors found variations in both the daily milk production and its quality, including fat content and the distribution percentage of fatty acids, among cows during spring and summer, which was attributed to the impact of HS. André et al. [17] pointed out that the effect of HS depends on the conditions of the particular farm. Therefore, it is recommended to quantify the effect of HS using milk production data collected from each specific farm situation.
All of this provides the basis for conducting a study on the influence of the calving season and related climatic factors on the indicators of milk productivity in dairy cows housed in a semi-open free-stall barn, under the climatic conditions of central Southern Bulgaria.

2. Materials and Methods
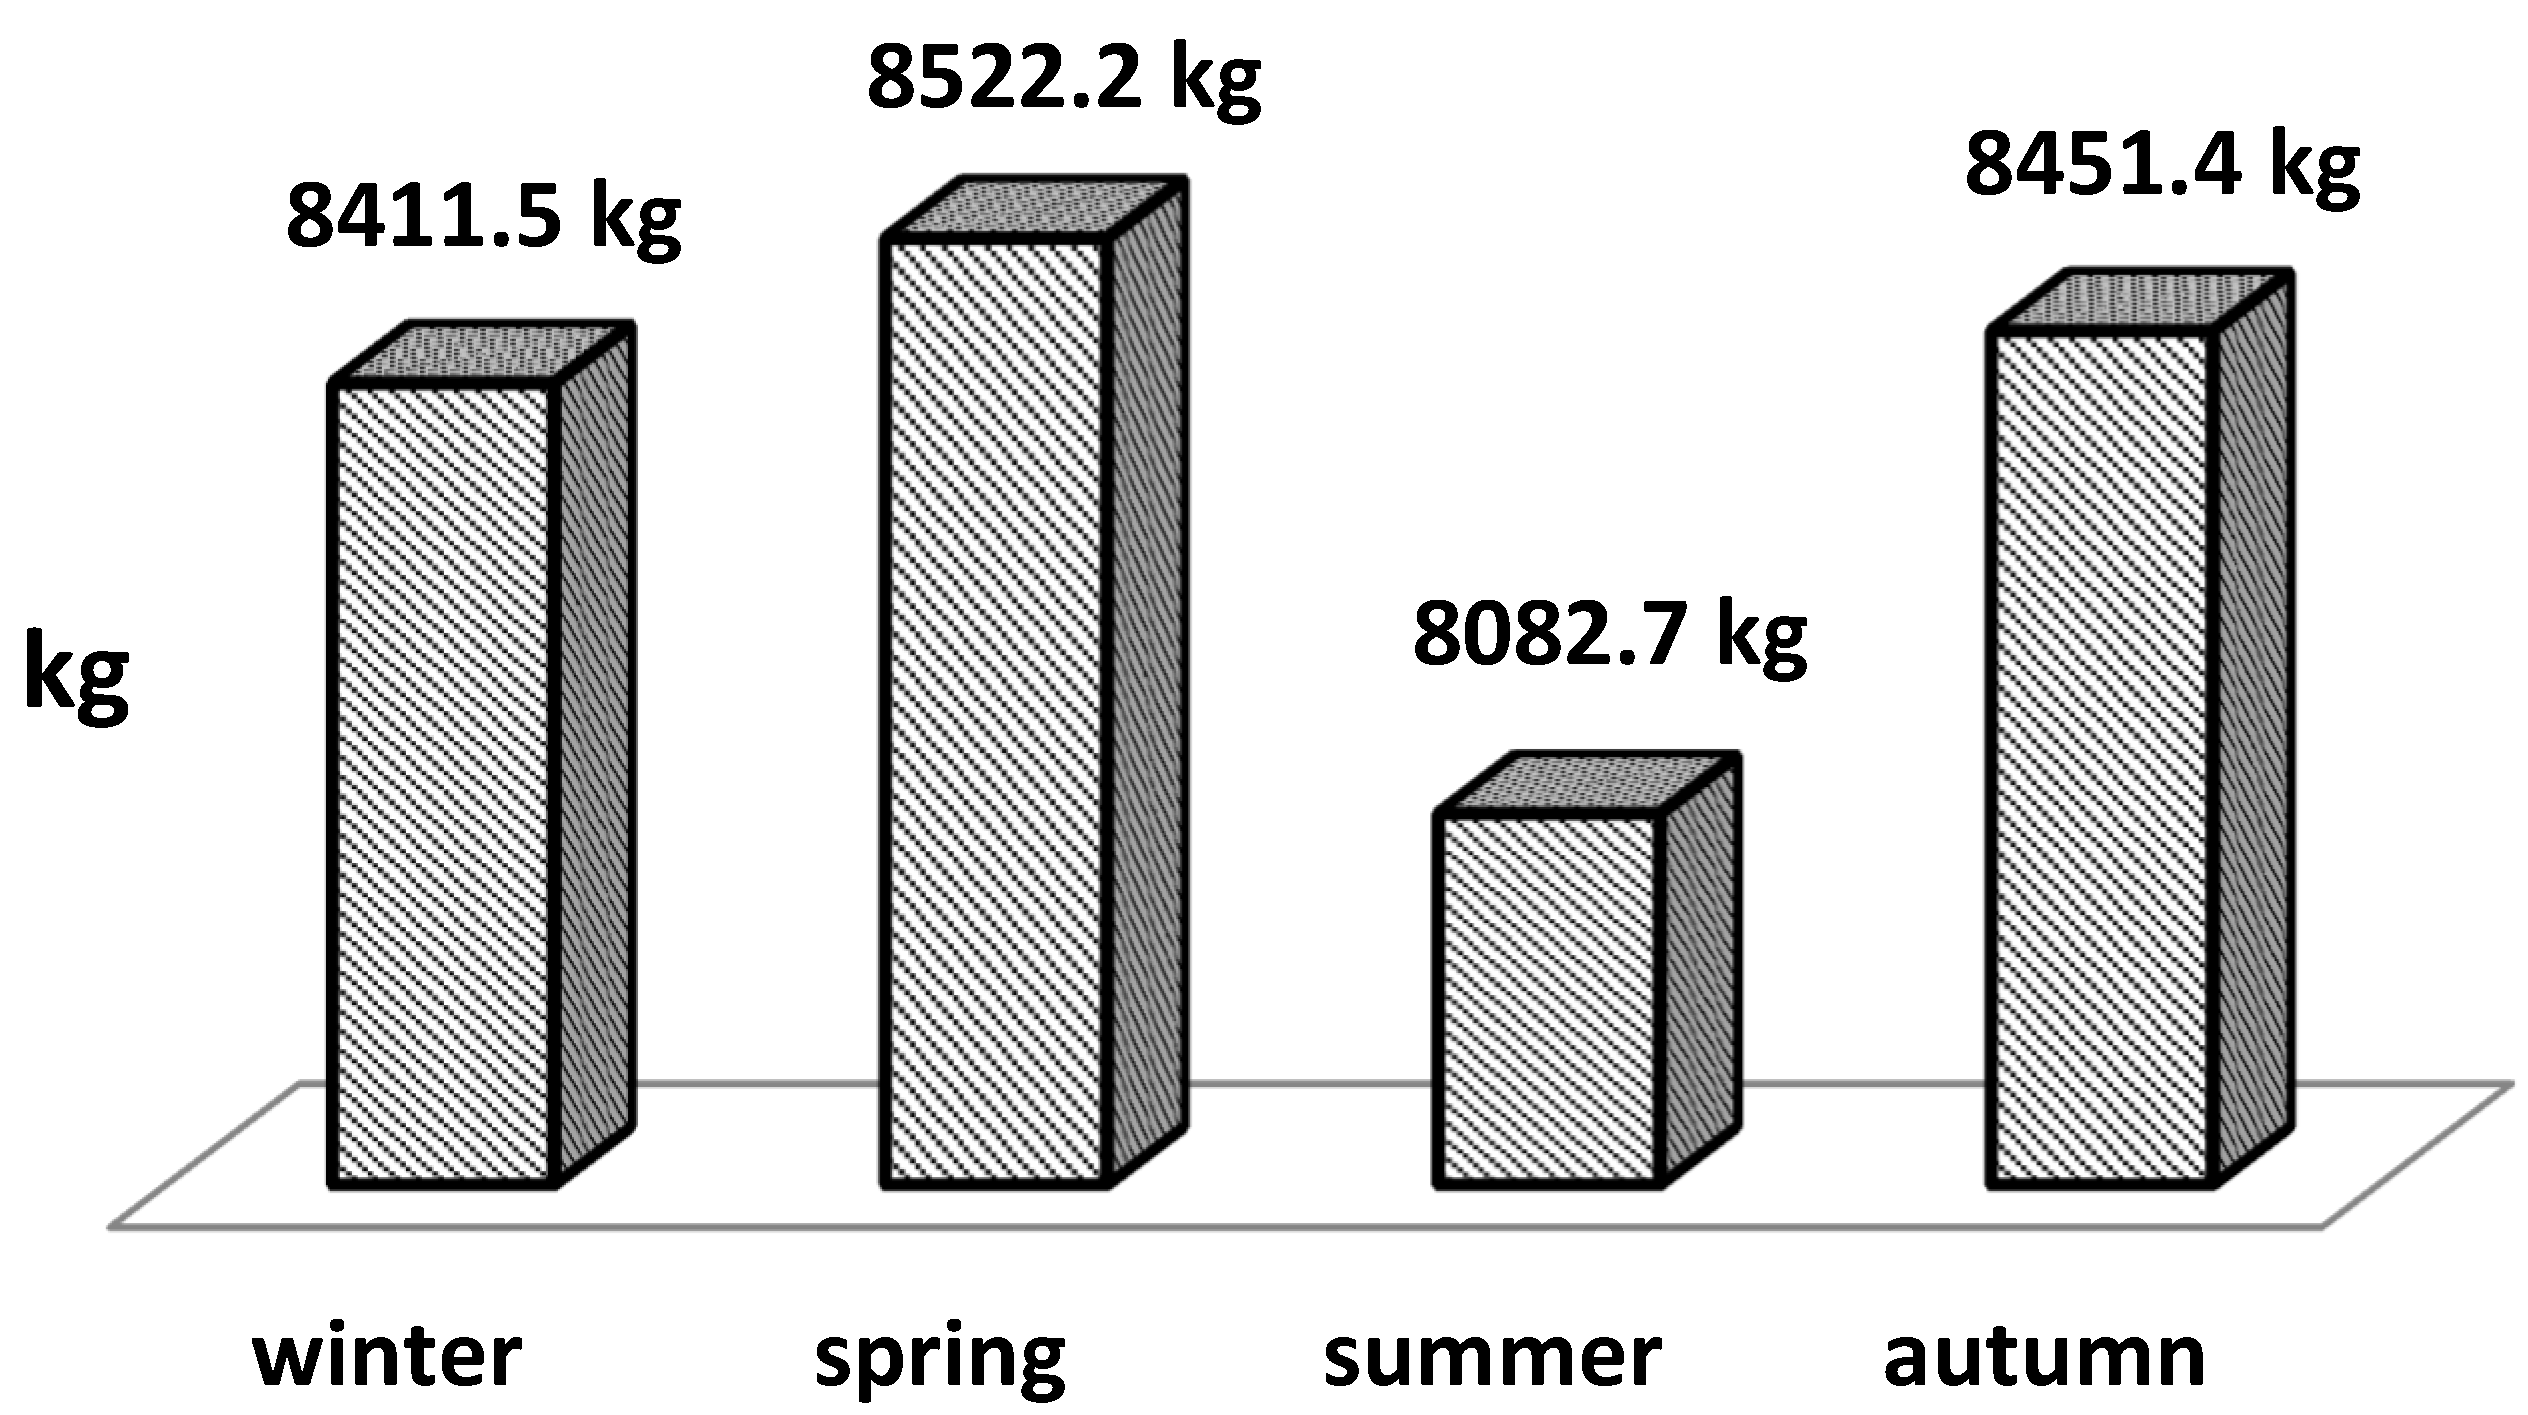
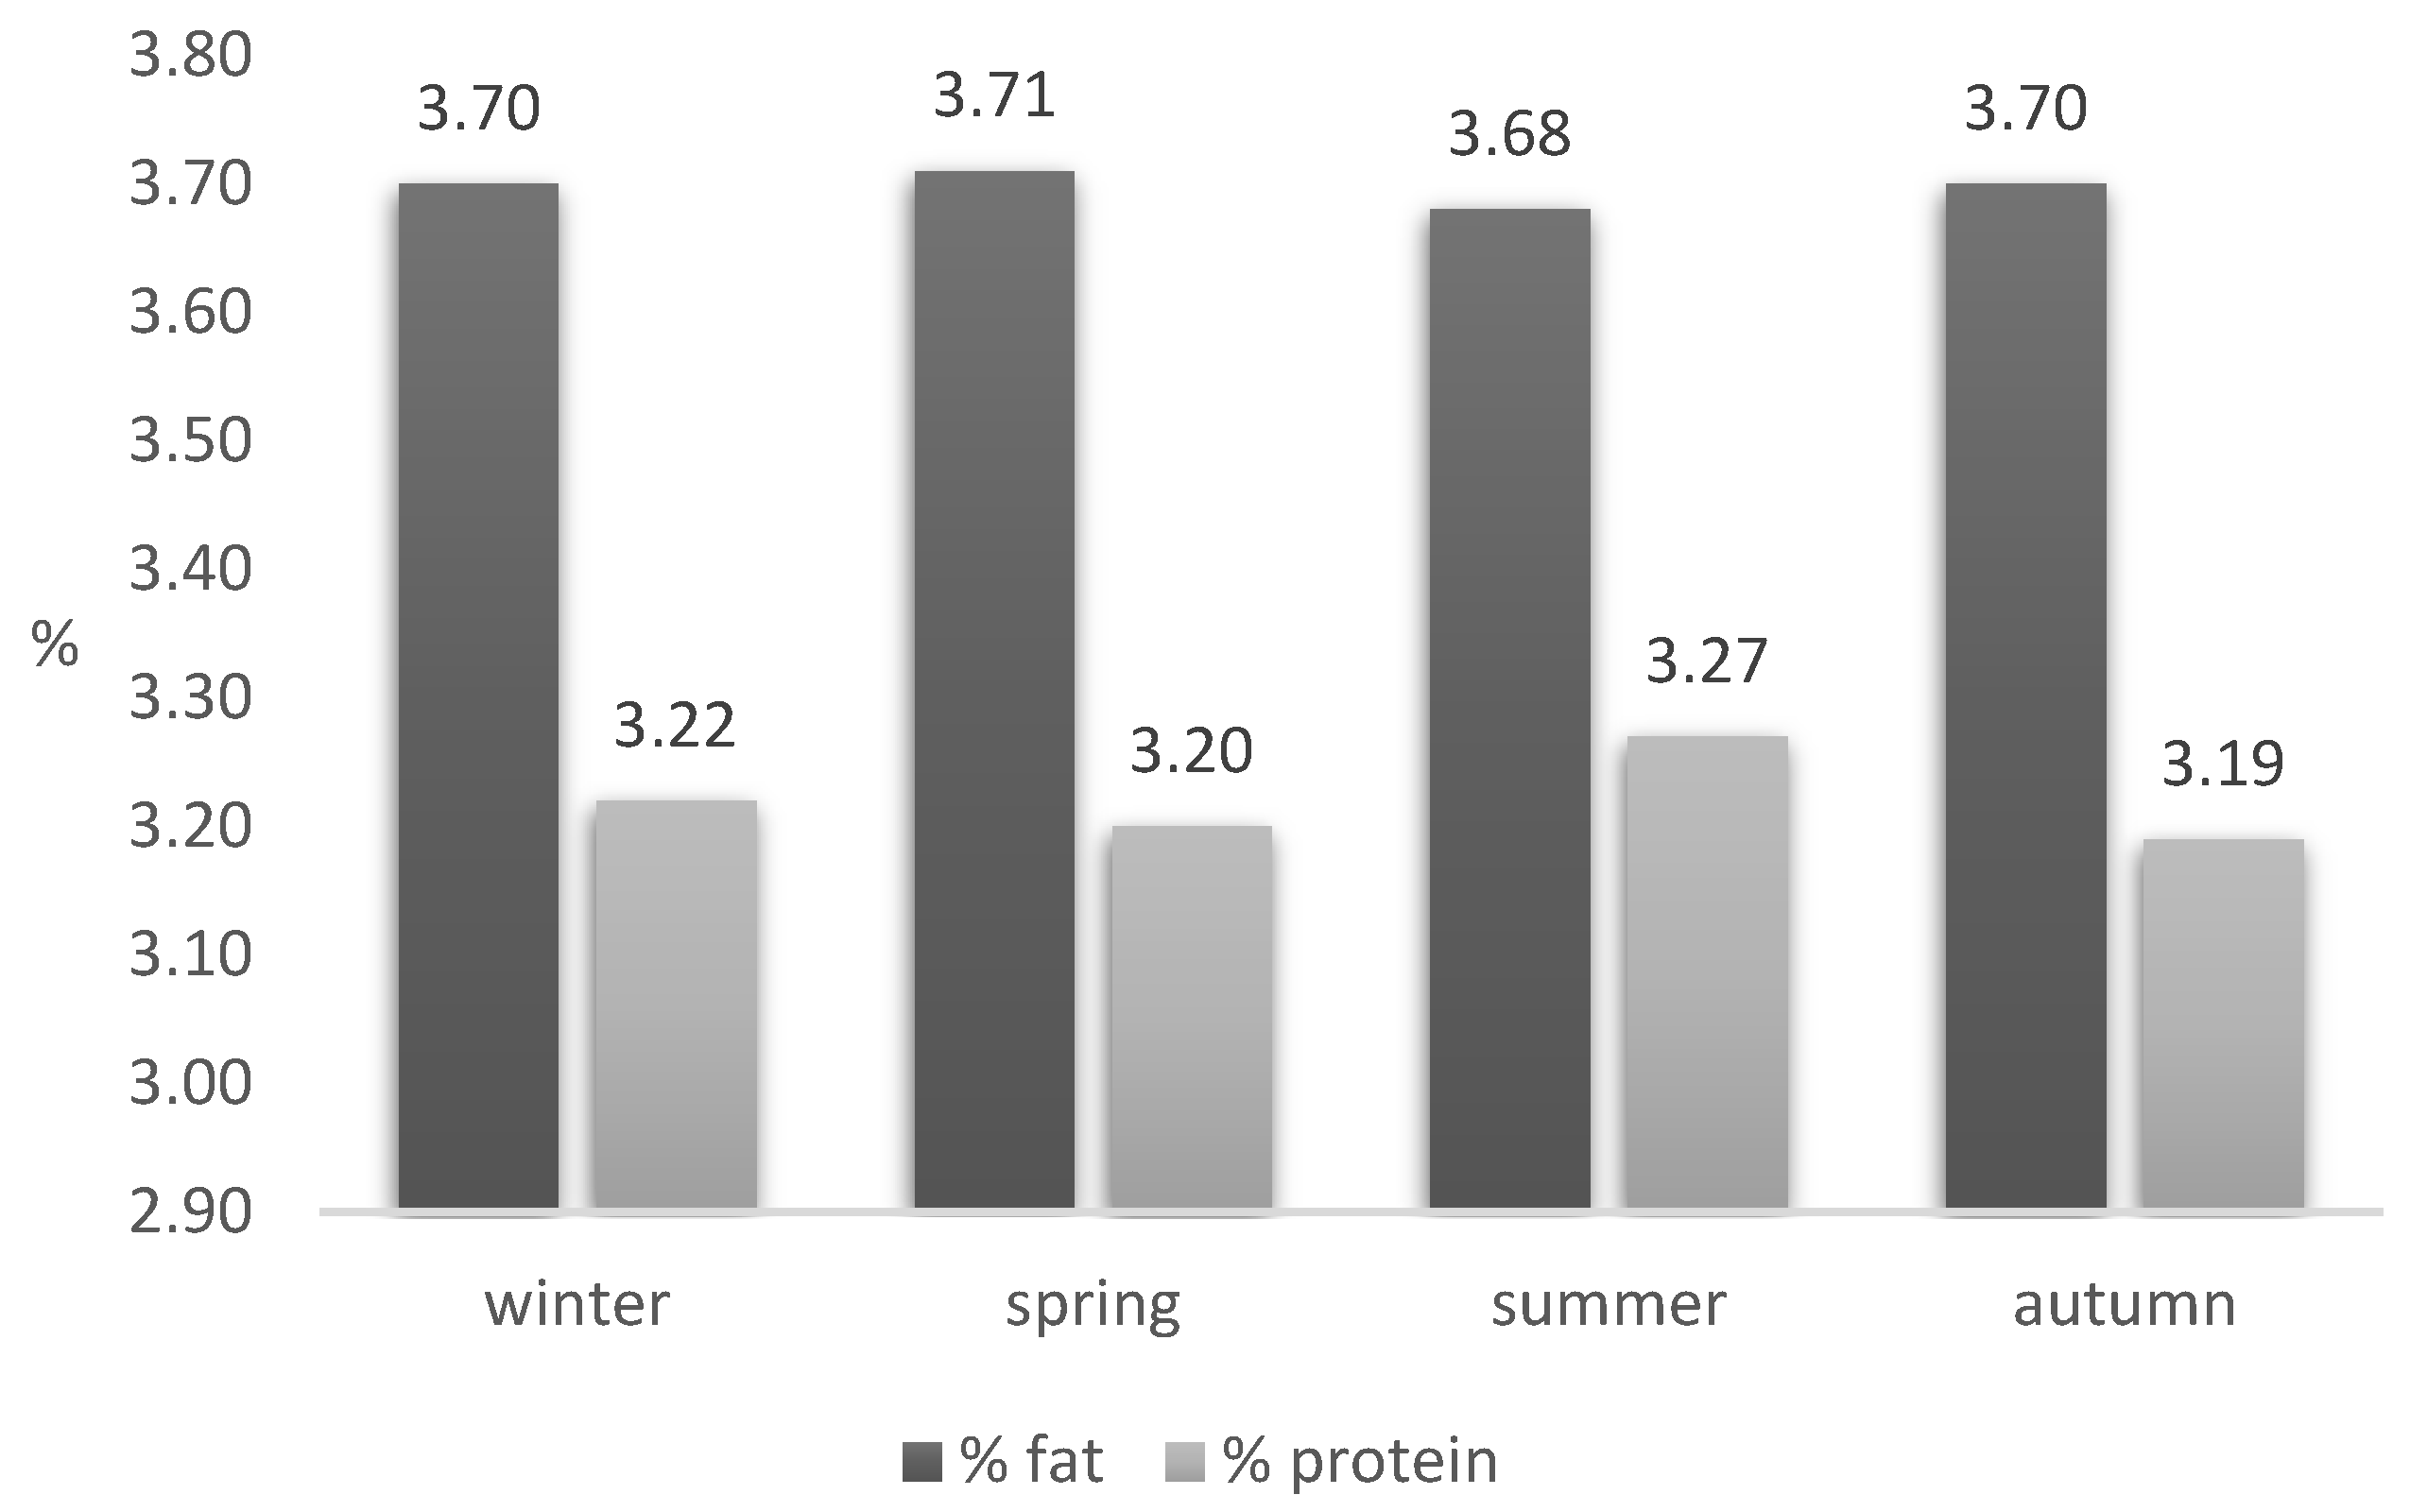
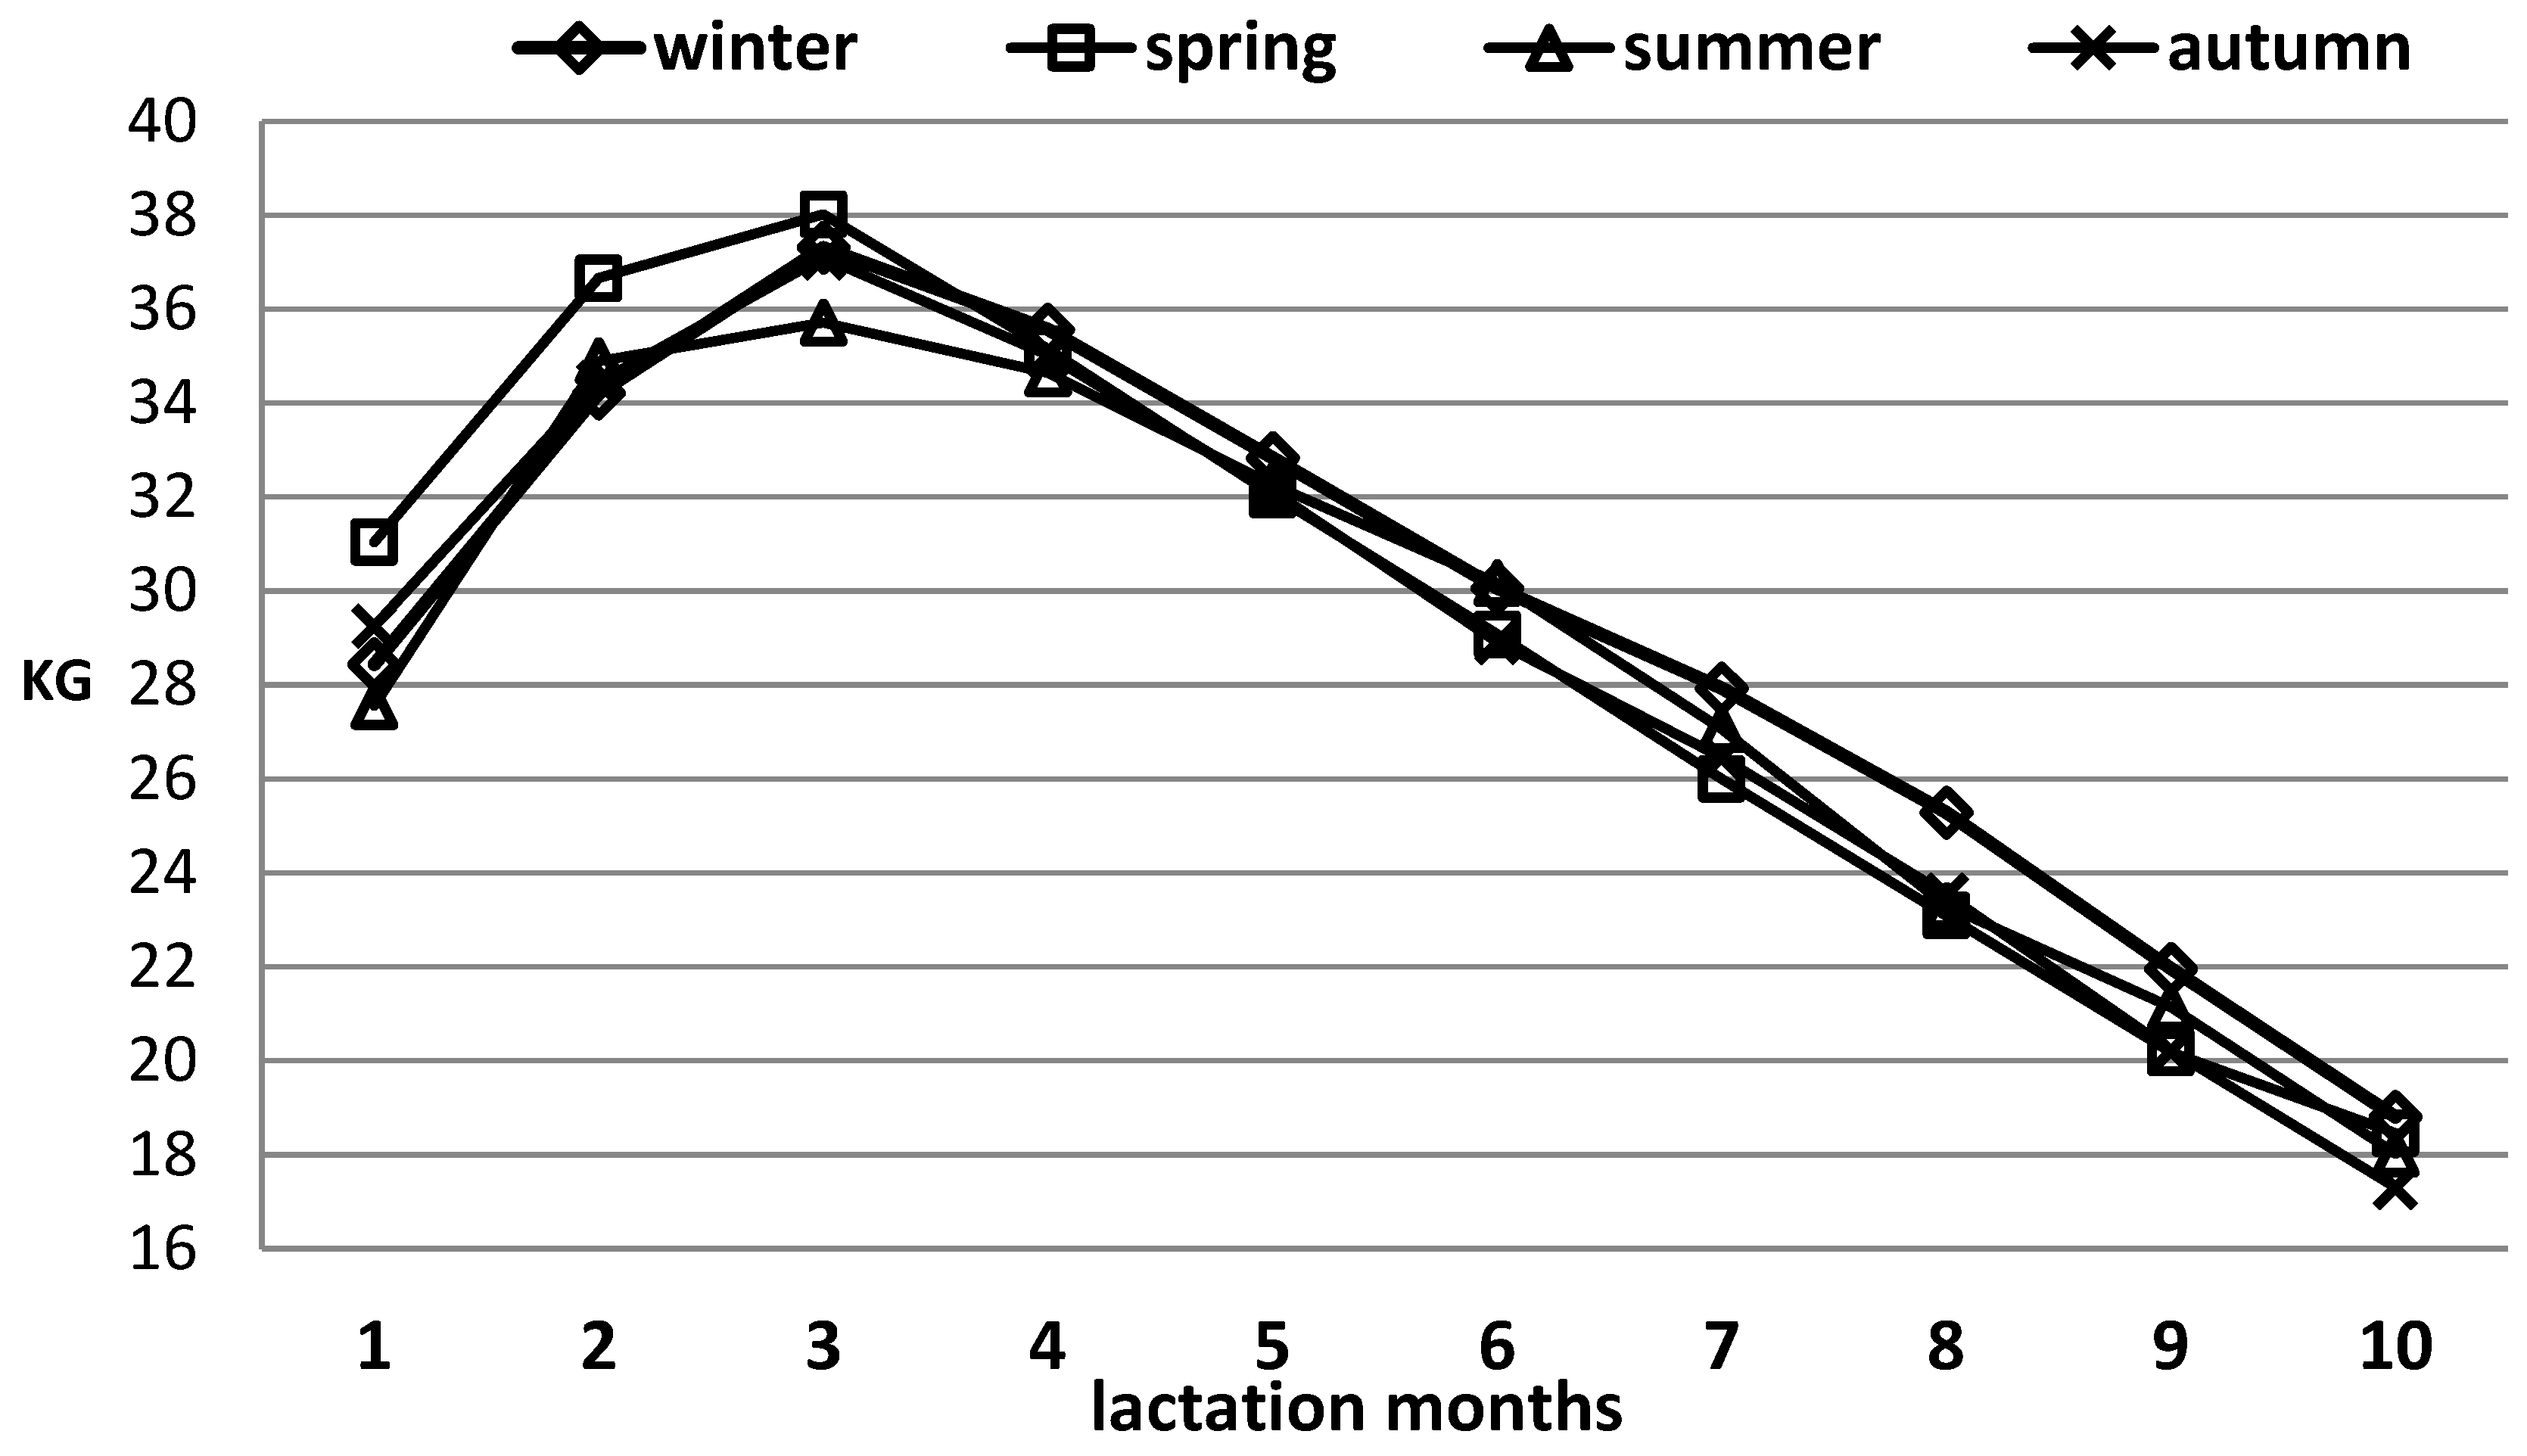
The research was conducted on a cattle farm located in Parvomai Municipality, Plovdiv Region, with GPS coordinates of 41.951257, 25.085302. The farm had a capacity of 500 dairy cows, including lactating cows, dry cows, heifers, and calves. Cows were raised under conditions of an open shed-type, free-stall dairy-barn production system. The farm had four production buildings and a milking parlor.
The study included 286 lactations of 199 Holstein cows from the studied farm. Only lactation records with at least 8 controls per lactation were used, totaling 2744 monthly controls for the period of 2017–2022. The distribution of cows by calving season is as follows: spring season: 92 cows (921 controls), summer season: 78 cows (703 controls), autumn season: 54 cows (533 controls), and winter season: 62 cows (587 test days). Milk performance traits—milk yield, percentage of fat, and protein in milk—were assessed for standard lactations with durations ranging from 240 to 305 days. Lactations from the first to the third, inclusive, were covered; later lactations exhibited wide variations in duration and productivity and uneven performance by calving season and were therefore excluded from the study. On average, for the studied 6 years, 12.6% of the cows calved in the same season for their different lactations.
The average and maximum THI values by year for the same season were close, with small differences (Table 1). This indicates a regular recurrence of the main climatic factors (temperature and air humidity) in the area of the studied farm. During the summer months, risk values were reported for both the maximum and average daily THI values, which were over 83 (ranging from 83.87 to 85.49 for different years).
The cows included in the study were fed year-round with a total mixed ration of constant composition tailored to the physiological conditions and productivity levels of the animals, and they were provided constant access to water. Data on the main climatic factors for the farm’s area—temperature and air humidity—were obtained from the nearest meteorological station in the city of Plovdiv, covering the period from 2017 to 2022. From the temperature and humidity data, the values of the temperature–humidity index (THI) were calculated using the formula proposed by Thom [18]:
0.8 × T 0 + B 0 100 × T 0 + 14.4 + 46.4
where T0 is the air temperature in °C, and B0 is the percentage of air humidity.
To report the effect of calving season, all calvings were distributed by season based on the calving date, as follows: from 1 December to 28 February (or 29th)—winter; from 1 March to 31 May—spring; from 1 June to 31 August—summer; and from 1 September to 30 November—autumn.
Lactation stages included the following: 1—from the 1st to the 30th day, 2—from the 31st to the 60th day, 3—from the 61st to the 90th day, 4—from the 91st to the 120th day, 5—from the 121st to the 150th day, 6—from the 151st to the 180th day, 7—from the 181st to the 210th day, 8—from the 211th to the 240th day, 9—from the 241st to the 270th day, and 10—from the 271st to the 305th day.
The MS Excel package Windows 8.1. was used for basic statistical processing of the data, and the corresponding STATISTICA modules of Stat Soft version 5.0 (copyright 1990–1995, Microsoft Corp. Redmond, WA 98052-7329, USA) were used to obtain means, errors, and analysis of variance.
The following model was used to evaluate the influence of the factors on the productive traits for 305 days lactation:
Y i j k = μ + L i + S j + e i j k
where Yijk is the dependent variable (milk yield, average fat %, or average protein %), μ is the average for the model, Li is the lactation number effect, Sj is the calving season effect, and eijk is the random residual effect.
The following model was used to assess the influence of the controlled factors on the productive signs for a test day:
Y i j k l = μ + L i + S j + P l k + e i j k l
where Yijkl is the dependent variable (milk yield, fat %, or protein %), μ is the average for the model, Li is the lactation number effect, Sj is the calving season effect, Plk is the lactation stage effect, and eijk is the random residual effect.
Through analysis of variance (ANOVA) for the model, the least-squares mean (LSM) was obtained through classes of the fixed factors.

3. Results

The average milk yield for the 305-day lactation of the cows included in the study was 8277.6 kg, with an average percentage of fat of 3.69% and of protein of 3.22% (Table 2). Cows in their third lactation had the highest milk yield—8688.4 kg—followed by those in their second lactation with 8415.7 kg, and the lowest was observed in first-lactation cows with 8068.8 kg. This distribution in milk yield is considered normal and biologically determined. No such pattern was observed in the average percentages of fat and protein in milk for the 305-day lactation. Although with slight differences, both the average fat and protein percentages were highest in second-lactation cows, at 3.71% and 3.26%, respectively. First- and third-lactation cows had slightly lower values. The differences between the average values for the two productive traits among cows with different numbers of lactations were very small.
In Figure 1, the variations in the average monthly minimum, maximum, and average daily temperatures (A) and THI values (B) for the farm area for the 6 years of the study (2017–2022) are presented. The average minimum temperatures by month were relatively high, with the lowest recorded in the winter season—around and slightly below 0 °C. The lowest minimum temperatures, which were below 0 °C, were reported in February in 2017 and 2021, indicating that the farm area had a mild climate without extreme low temperatures. Average daily temperatures were also high, with minimum daily temperatures of around 5 °C recorded during the winter months. Relatively high daily temperatures—over 20 °C—were measured for a rather long period, from June to September. Maximum temperatures reached quite high values, with temperatures above 25 °C reported from May to September. The highest air temperature was recorded in July 2021—40.6 °C.
Since the risk of temperature stress is determined not only by air temperature but also by humidity and other climatic indicators, Figure 1B shows the variation in THI values, which reflects the combined effect of temperature and humidity.
Considered in this aspect, the daily average THI values by calendar month for the period of 2017–2022 were over 60 from May to September. For the same period, the maximum daily values of the THI exceeded 72, posing a risk for heat stress occurrence.
From the analysis of variance (Table 3), it was found that the milk yield for the 305-day lactation was significantly affected by the lactation number (p < 0.001) and calving season (p < 0.05). Neither of the two controlled factors had a significant effect on the average milk fat and protein percentages. As reported in the average values (Table 2), the differences by lactation number were very small for both traits.
The dependence of 305-day lactation milk yield on the lactation number was reported and commented upon based on the average values of this trait, and the trend was also confirmed by the obtained LS mean values from the model. Figure 2 presents the LS mean values for milk yield depending on the calving season. The highest milk yield was reported for cows that calved in spring—8522.2 kg—followed by those that calved in autumn and winter—8451.4 kg and 8411.5 kg, respectively. The cows that calved in summer had the lowest milk yield for standard lactation, at 8082.7 kg. The dependency of standard-lactation milk yield on calving seasons is shown in Figure 2.
Figure 3 presents LS means from the model for the effect of calving season on milk fat and protein % values for 305-day lactation. Cows that calved in summer had the highest value for protein %—3.27—and the lowest for fat %—3.68. The lowest value for protein %—3.19—was reported among cows that calved during autumn.
Table 4 presents the average values for the productive traits for a test day by lactation number. Although with small differences, there was a certain tendency for higher values in later lactations for the traits of milk yield and % fat in milk for a test day. No difference was reported in % protein for a test day depending on the lactation number.
From the analysis of variance for the influence of the controlled factors on the three productive traits for a test day, it was found that milk yield was significantly influenced by lactation number (p < 0.05), calving season (p < 0.05), and lactation period (p < 0.001) (Table 5). Regarding the fat percentage for a test day, only the lactation number had a statistically significant effect (p < 0.01), as evident from the average values presented in Table 4. A significant effect on protein percentage for a test day was only found for the lactation period (p < 0.05).
Figure 4 shows the lactation curves depending on the calving season. The highest milk yield for a test day (peak of lactation)—38.0 kg—was reached by lactations that started in the spring; these also had the highest milk yield from the beginning of lactation until the 30th day—31.0 kg. After the peak, these lactations showed a significant decline in milk yield for a test day.

4. Discussion

Taking into account that the study included only the first to third lactations (predominantly the first), the reported productivity (Table 2) was relatively high for the breed in our country. According to data from the Executive Agency of Selection and Reproduction in Animal Breeding, the average milk yield of controlled cows of the black-and-white breed (including Holsteins) in our country is 5300–5600 kg, with 3.6–3.8% fat and 3.2–3.3% protein in the milk [19].
The higher productivity of the farm was attributed to constant work and selection aimed at increasing the productivity of the farmed cows, as well as providing them with adequate rations consistent with their physiological needs.
According to data from the National Institute of Meteorology and Hydrology [10], 2020 was the second-warmest year for our country since 1930. The average annual temperature was 12.4 °C, which was 1.9 °C higher than the climatic norm for the period of 1961–1990. The average annual maximum temperature was 18.7 °C, exceeding the climatic norm by 2.9 °C. The highest maximum temperature for 2020, 40.8 °C, was recorded on July 31 in the town of Lyubimets, Haskovo Region, which is in the same region as the studied farm.
According to several authors, a THI value above 72 has been accepted as the threshold for inducing heat stress (HS) in the tropics [20,21], while in temperate zones, milk yield in high-producing cows may be affected at a THI value lower than 60 [22,23].
As mentioned, the cows were housed in open barns (shed-type, without solid walls), which means that there was almost no isolation of the animals from external climatic conditions such as temperature and humidity. The THI values for the farm area (Figure 1B) showed that the cows were exposed to conditions at risk of inducing HS to varying degrees for a long period, approximately 5 months of the year, almost around the clock.
In a study by Penev et al. [24], the season also had a significant effect on the milk yield of cows (p < 0.001) but not on milk composition parameters, which was also confirmed by the present study (Table 3). The standard lactation milk yield was 4 to 5% lower than that reported for the other calving seasons (Figure 2). Gantner et al. [25] found that THI values often exceeded 72 in the three regions (eastern, Mediterranean, and central) of Croatia in spring and summer, during which cows tend to develop HS. During autumn and winter when THI values are typically lower than 72, cows rarely experience HS. Additionally, milk yields differed significantly between periods with HS conditions and periods without HS (p < 0.01), indicating that milk yield from dairy cows in regions with different climates can be significantly affected when THI values reach HS levels. Liu et al. [26] found that the milk yield of Holstein cows decreased by 10% to 40% in summer compared to that in winter [27], further highlighting the impact of HS on milk production. According to the research of several authors [26,28,29,30], the risk of HS occurs when THI values exceed 68 or 72. According to Jeon et al. [31], it is more accurate to study the influence of the maximum values of the THI (THI_max) on the quantity and quality of milk.
As reported (Table 3), no significant effect of calving season and lactation number was found on the average milk fat percentage for standard lactation. Between the LS means for the three calving seasons, winter, spring, and autumn (Figure 3), it can be observed that there was no difference in the mean milk fat percentages (3.70% and 3.71%), but a lower mean value—3.68%—was reported for the summer season, although with a small difference. André et al. [17] found a milk loss of 31.4 kg/cow/year due to HS, which is 0.32% of the farm-averaged production of 9855 kg/cow/year. This loss is low compared to losses in the United States [32], which range from 68 (Wyoming) to 2072 (Louisiana) kg/cow/year. In a study by Bernabucci et al. [14], however, the lowest protein values in milk were found precisely during the summer season. The authors also demonstrated a decrease in αS-CN and β-CN proteins at the expense of unidentified proteins, which led to a deterioration of the coagulation properties of milk obtained from cows in summer. Despite the observed trends in the difference in milk fat and protein values presented in Figure 4, the analysis of variance (Table 3) showed that the calving season did not significantly affect these traits. Since the cows on the farm were under the same conditions of rearing and the same composition of rations throughout the year, the main reason can be sought in the changes in climatic and, as a consequence, microclimatic conditions by season. The optimal climatic conditions during the spring months allowed a relatively high peak to be reached at the beginning of lactation, but after the third–fourth month of lactation, the summer months came with high daily temperatures and THI values (Figure 1 and Figure 2). This led to a steeper decline in milk yield after the peak. The high milk yield at the peak of lactation, however, provided the highest reported milk yield for the 305-day lactation (Figure 3). These results confirm research by other authors [33,34], who also found the highest daily milk yield in spring-calving cows.
Lactations started in autumn and winter had almost identical lactation curves. At the beginning of lactation (up to the 30th day), their milk yields were 28.4 and 29.3 kg, and at the peak, 37.3 and 37.1 kg, respectively. A difference appeared at the end of lactation, when lactations started in winter had a slightly higher daily milk yield than those started in autumn. The similar lactation curves of the autumn and winter calvings were also consistent with the almost identical milk yields for 305 days of lactation (Figure 1).
The lactation curve for lactations that started in the summer had the most undesirable characteristics. The daily milk yield at the beginning (until the 30th day) was the lowest compared to the others—27.6 kg—as was the peak, which was not clearly expressed, at 35.7 kg. It can be said that after the end of the summer period, the curve was slightly stabilized. In these lactations, the lowest milk yield for a 305-day lactation was also reported (Figure 3). M’Hamdi et al. [35] also found a negative influence of HS on the lactation curves of dairy cows depending on the temperature–humidity index values.
According to Joksimović-Todorović et al. [36], constant selection for higher milk yield leads to increased sensitivity of cows to HS. This is the reason why high-producing dairy cows are more sensitive to HS than cows with lower genetic potential for milk production [37]. Also, dairy cows in the beginning of lactation have small chances of overcoming HS, and thus it has the strongest effect on milk production in the first 60 days of lactation. The negative energy balance in dairy cows at the beginning of lactation is further increased by creating and radiating higher amounts of heat energy during the period when the animals consume less feed [36].
This was one of the reasons why the lactation curve in summer tended to decrease compared to spring, during which the lactation curve was maintained at high levels. Additionally, when cows calve in early spring and summer, high summer temperatures coincide with the lactation peak when cows are more sensitive to HS [21]. High-producing cows are most sensitive to the influence of heat at the beginning of lactation, and in cases where the body temperature is higher than 39 °C, the milk yield decreases significantly [20]. At an external temperature of 35 °C, the amount of milk decreases by 33%, and at a temperature of 40 °C, by 50% [38].
Sacido et al. [39] and Segnalini et al. [40] indicated that in heat-stressed dairy cows, milk production decreased by between 10 and 30%, with significant reductions in fat and protein. At a temperature above 30 °C, the amount of milk decreases by up to 30%, while the fat content is reduced from 3.6% to 3.2% and the protein content from 3.34% to 3%. Also, Kadzere et al. [21] point to the fact that at a temperature of 35 °C, the amount of milk decreases by 33%, and at 40 °C, it decreases by 50%. The same authors indicated that the percentage of milk fat was reduced by 39.7% and the protein by 16.9%.
West et al. [41] found that the milk yield of Holstein cows decreased by 0.88 kg per unit increase in the average THI value, and daily milk yield decreased by 0.85 kg for each degree (°C) of increase in the average air temperature.
High daytime temperatures during the summer period and inadequate cooling of dairy cows have a negative effect, which is particularly pronounced in terms of milk yield and, to some extent, milk fat. M’Hamdi et al. [35] found an effect of HS on both the fat content and protein content of milk. In our study, however, differences in milk protein values by season were not found. This may be due to the selection for higher performance regarding milk composition and protein content at the studied farm as well as the level of feeding, which does not change throughout the year. Other authors, such as Garner et al. [42], also found an increase in the percentage of protein in milk when the yield decreases in conditions of HS [43], which is most likely caused by the milk’s higher concentration [44]. Given that this was a sample of all animals on the farm, the total milk losses, as expressed in quantity and composition quality, could be considerable for dairy cattle farms in Bulgaria.

5. Conclusions

For the research period from 2017 to 2022 in the region of central southern Bulgaria, significantly high values of the maximum and average daily temperatures and THI values, representing a risk of heat stress for dairy cows, were reported for a rather long period of about 5 months (from May to September). Based on the conducted research, it can be claimed that there was a significant difference in the productivity of cows that calved during the different seasons of the year. The cows with the lowest milk yield calved in the summer, and the cows with the highest milk yield calved in the spring. The influence of the season on the amount of milk affects the milk yield of the lactation curve, which also reflects on the total amount of milk for the entire lactation. The calving season affects not only the quantity but also the quality of the milk produced.

Author Contributions

Conceptualization, M.S. and D.D.; methodology, T.P. and D.D.; software, I.M.; validation, I.M., T.P. and D.D.; formal analysis, D.D.; investigation, T.P.; resources, M.S.; data curation, D.D.; writing—original draft preparation, M.S. and T.P.; writing—review and editing, D.D. and I.M.; visualization, I.M.; supervision, T.P.; project administration, T.P.; funding acquisition, T.P. All authors have read and agreed to the published version of the manuscript.

Funding

This investigation was funded by the Bulgarian Ministry of Education and Science (MES) in the frames of the Bulgarian National Recovery and Resilience Plan, “Innovative Bulgaria” Component, project No.: BG-RRP-2.004-0006-C02, “Development of research and innovation at Trakia University in service of health and sustainable well-being”.

Institutional Review Board Statement

Not applicable.

Informed Consent Statement

Not applicable.

Data Availability Statement

All data presented in this study are available on request from the corresponding author.

Acknowledgments

The authors acknowledge Nadejda Ilieva and Veska Stoianova for their technical support.

Conflicts of Interest

The authors declare no conflicts of interest.

References

  1. Mazzullo, G.; Rifici, C.; Lombardo, S.F.; Agricola, S.; Rizzo, M.; Piccione, G. Seasonal variations of some blood parameters in cow. Large Anim. Rev. 2014, 20, 81–84. [Google Scholar]
  2. Renaudeau, D.; Collin, A.; Yahav, S.; De Basilio, V.; Gourdine, J.L.; Collier, R.J. Adaptation to hot climate and strategies to alleviate heat stress in livestock production. Animal 2012, 6, 707–728. [Google Scholar] [CrossRef] [PubMed]
  3. Segnalini, M.; Bernabucci, U.; Vitali, A.; Nardone, A.; Lacetera, N. Temperature humidity index scenarios in the Mediterranean basin. Int. J. Biometeorol. 2013, 57, 451–458. [Google Scholar] [CrossRef] [PubMed]
  4. Fournel, S.; Ouellet, V.; Charbonneau, É. Practices for alleviating heat stress of dairy cows in humid continental climates: A literature review. Animals 2017, 7, 37. [Google Scholar] [CrossRef] [PubMed]
  5. Kjellström, E.; Nikulin, G.; Strandberg, G.; Christensen, O.B.; Jacob, D.; Keuler, K.; Lenderink, G.; van Meijgaard, E.; Schär, C.; Somot, S.; et al. European climate change at global mean temperature increases of 1.5 and 2 °C above pre-industrial conditions as simulated by the EURO-CORDEX regional climate models. Earth Syst. Dynam. 2018, 9, 459–478. [Google Scholar] [CrossRef]
  6. Novak, P.; Vokralova, J.; Broucek, J. Effects of the stage and number of lactation on milk yield of dairy cows kept in open barn during high temperatures in summer months. Arch. Anim. Breed. 2009, 52, 574–586. [Google Scholar] [CrossRef]
  7. Hill, D.L.; Wall, E. Weather influences feed intake and feed efficiency in a temperate climate. J. Dairy Sci. 2017, 100, 2240–2257. [Google Scholar] [CrossRef]
  8. Meehl, G.A.; Tebaldi, C. More intense, more frequent, and longer lasting heat waves in the 21st century. Science 2004, 305, 994–997. [Google Scholar] [CrossRef]
  9. Hempel, S.; Menz, C.; Pinto, S.; Galán, E.; Janke, D.; Estellés, F.; Müschner-Siemens, T.; Wang, X.; Heinicke, J.; Zhang, G.; et al. Heat stress risk in European dairy cattle husbandry under different climate change scenarios—Uncertainties and potential impacts. Earth Syst. Dynam. 2019, 10, 859–884. [Google Scholar] [CrossRef]
  10. National Institute of Meteorology and Hydrology. Annual Hydrometeorological Bulletin for 2020; National Institute of Meteorology and Hydrology: Sofia, Bulgaria, 2021; p. 50. [Google Scholar]
  11. Marumo, J.L.; Lusseau, D.; Speakman, J.R.; Mackie, M.; Hambly, C. Influence of environmental factors and parity on milk yield dynamics in barn-housed dairy cattle. J. Dairy Sci. 2021, 105, 1225–1241. [Google Scholar] [CrossRef]
  12. Cowley, F.C.; Barber, D.G.; Houlihan, A.V.; Poppi, D.P. Immediate and residual effects of heat stress and restricted intake on milk protein and casein composition and energy metabolism. J. Dairy Sci. 2015, 98, 2356–2368. [Google Scholar] [CrossRef]
  13. Brouček, J.; Novák, P.; Vokřálová, J.; Šoch, M.; Kišac, P.; Uhrinčať, M. Effect of high temperature on milk production of cows from free-stall housing with natural ventilation. Slovak J. Anim. Sci. 2009, 42, 167–173. [Google Scholar]
  14. Bernabucci, U.; Basiricò, L.; Morera, P.; Dipasquale, D.; Vitali, A.; Piccioli Cappelli, F.; Calamari, L. Effect of summer season on milk protein fractions in Holstein cows. J. Dairy Sci. 2015, 98, 1815–1827. [Google Scholar] [CrossRef]
  15. Reyad, M.; Sarker, M.A.H.; Uddin, M.E.; Habib, R.; Rashid, M.H.U. Effect of heat stress on milk production and its composition of Holstein Friesian crossbred dairy cows. Asian J. Med. Biol. Res. 2016, 2, 190–195. [Google Scholar] [CrossRef]
  16. Penev, T.; Dimov, D.; Marinov, I.; Angelova, T. Study of influence of heat stress on some physiological and productive traits in Holstein-Friesian dairy cows. Agron. Res. 2021, 19, 210–223. [Google Scholar] [CrossRef]
  17. André, G.; Engel, B.; Berentsen, P.B.M.; Vellinga, T.V.; Oude Lansink, A.G.J.M. Quantifying the effect of heat stress on daily milk yield and monitoring dynamic changes using an adaptive dynamic model. J. Dairy Sci. 2011, 94, 4502–4513. [Google Scholar] [CrossRef] [PubMed]
  18. Thom, E.C. Cooling degree days. Air Cond. Heat. Vent. 1958, 55, 65–69. [Google Scholar]
  19. Yordanov, G.; Venev, I.; Peeva, C.; Raychev, E.; Nikolova, L.; Cholakova, B.; Georgiev, V.; Georgieva, E.; Stoijanov, S.; Ivanov, I.; et al. Livestock Breeds in Republic of Bulgaria; Executive Agency of Selection and Reproduction in Animal Breeding: Sofia, Bulgaria, 2017; pp. 77–79. [Google Scholar]
  20. Ravagnolo, O.; Miztal, I. Genetic component of heat stress in dairy cattle, parameter estimation. J. Dairy Sci. 2000, 83, 2126–2130. [Google Scholar] [CrossRef] [PubMed]
  21. Kadzere, C.T.; Murphy, M.R.; Silanikove, E.N.; Maltz, E. Heat stress in lactating dairy cows: A review. Livest. Prod. Sci. 2002, 77, 59–91. [Google Scholar] [CrossRef]
  22. Brugemann, K.; Gernand, E.; Von Borste, U.K.; Konig, S. Defining and evaluating heat stress thresholds in different dairy cow production systems. Arch. Tierz. 2012, 55, 13–24. [Google Scholar] [CrossRef]
  23. Gorniak, T.; Meyer, U.; Sudekum, K.H.; Danicke, S. Impact of mild heat stress on dry matter intake, milk yield and milk composition in mid-lactation Holstein dairy cows in a temperate climate. Arch. Anim. Nutr. 2014, 68, 358–369. [Google Scholar] [CrossRef]
  24. Penev, T.; Gergovska, Z.; Marinov, I.; Kirov, V.; Stankov, K.; Mitev, Y.; Miteva, C. Effect of season, lactation period and number of lactation on mastitis incidence and milk yields in dairy cows. Agric. Sci. Technol. 2014, 6, 231–238. [Google Scholar]
  25. Gantner, V.; Mijić, P.; Kuterovac, K.; Solić, D.; Gantner, R. Temperature-humidity index values and their significance on the daily production of dairy cattle. Mljekarstvo 2011, 61, 56–63. [Google Scholar]
  26. Liu, J.; Li, L.; Chen, X.; Lu, Y.; Wang, D. Effects of heat stress on body temperature, milk production, and reproduction in dairy cows: A novel idea for monitoring and evaluation of heat stress—A review. Asian Australas. J. Anim. Sci. 2019, 32, 1332. [Google Scholar] [CrossRef] [PubMed]
  27. Du Preez, J.H.; Giesecke, W.H.; Eisenberg, B.E. Heat stress in dairy cattle and other livestock under southern African conditions. III. Monthly temperature-humidity index mean values and their significance in the performance of dairy cattle. Onderstepoort J. Vet. Res. 1990, 57, 243–248. [Google Scholar] [PubMed]
  28. NRC. Nutrient Requirements of Dairy Cattle, 7th ed.; National Academy Press: Washington, DC, USA, 2001. [Google Scholar]
  29. Key, N.S.; Sneeringer, D.; Marquardt. Climate Change, Heat Stress, and US Dairy Production. USDA-ERR-175 Economic Research Report. 2014. Available online: https://www.ers.usda.gov/webdocs/publications/45279/49164_err175.pdf?v=2468.4 (accessed on 11 January 2024).
  30. Lim, D.H.; Kim, T.I.; Park, S.M.; Ki, K.S.; Kim, Y. Evaluation of heat stress responses in Holstein and Jersey cows by analyzing physiological characteristics and milk production in Korea. J. Anim. Sci. Technol. 2021, 63, 872. [Google Scholar] [CrossRef] [PubMed]
  31. Jeon, E.; Jang, S.; Yeo, J.-M.; Kim, D.-W.; Cho, K. Impact of Climate Change and Heat Stress on Milk Production in Korean Holstein Cows: A Large-Scale Data Analysis. Animals 2023, 13, 2946. [Google Scholar] [CrossRef] [PubMed]
  32. St-Pierre, N.R.; Cobanov, B.; Schnitkey, G. Economic losses from heat stress by US livestock industries. J. Dairy Sci. 2003, 86, E52–E77. [Google Scholar] [CrossRef]
  33. Hristev, H.; Gergovska, Z.; Ivanova, R. Influence of the daily milk yield level on some physiological parameters of dairy cows reared under the same temperature and humidity conditions. Bulg. J. Agric. Sci. 2022, 28 (Suppl. S1), 65–71. [Google Scholar]
  34. Ivanova, R.; Hristev, H.; Gergovska, Z. Influence of the level of daily milk yield on some blood biochemical parameters in dairy cows reared under the same temperature and humidity conditions. Bulg. J. Agric. Sci. 2022, 28 (Suppl. S1), 55–64. [Google Scholar]
  35. M’Hamdi, N.; Darej, C.; Attia, K.; El Akram Znaidi, I.; Refka, K.; Hanane, D.; Rachid, B.; Rahma, T.; Lamjed, M.; Moez, A. Modelling THI effects on milk production and lactation curve parameters of Holstein dairy cows. J. Therm. Biol. 2021, 99, 102917. [Google Scholar] [CrossRef]
  36. Joksimović-Todorović, M.; Davidović, V.; Hristov, S.; Stanković, B. Effect of heat stress on milk production in dairy cows. Biotechnol. Anim. Husb. 2011, 27, 1017–1023. [Google Scholar] [CrossRef]
  37. Allen, J.D.; Hall, L.W.; Collier, R.J.; Smith, J.F. Effect of core body temperature, time of day, and climate conditions on behavioral patterns of lactating dairy cows experiencing mild to moderate heat stress. J. Dairy Sci. 2015, 98, 118–127. [Google Scholar] [CrossRef]
  38. West, J.W. Effects of heat-stress on production in dairy cattle. J. Dairy Sci. 2003, 86, 2131–2144. [Google Scholar] [CrossRef]
  39. Sacido, M.B.; Loholaberry, F.; Sanchez, N.; Intruvini, J. Effect of Caloric Stress on Milk Production and Animal Comfort. In Proceedings of the International Grassland Congress Proceedings, Sao Pedro, Brazil, 11–21 February 2001. [Google Scholar]
  40. Segnalini, M.; Nardone, A.; Bernabucci, U.; Vitali, A.; Ronchi, B.; Lacetera, N. Dynamics of the temperature-humidity index in the Mediterranean basin. Int. J. Biometeorol. 2011, 55, 253–263. [Google Scholar] [CrossRef]
  41. West, J.; Mullinix, B.; Bernard, J. Effects of hot, humid weather on milk temperature, dry matter intake, and milk yield of lactating dairy cows. J. Dairy Sci. 2002, 86, 232–242. [Google Scholar] [CrossRef]
  42. Garner, J.; Douglas, M.; Williams, S.; Wales, W.; Marett, L.; Nguyen, T.; Reich, C.; Hayes, B. Genomic selection improves heat tolerance in dairy cattle. Sci. Rep. 2016, 6, 34114. [Google Scholar] [CrossRef] [PubMed]
  43. Corazzin, M.; Saccà, E.; Lippe, G.; Romanzin, A.; Foletto, V.; Da Borso, F.; Piasentier, E. Effect of heat stress on dairy cow performance and on expression of protein metabolism genes in mammary cells. Animals 2020, 10, 2124. [Google Scholar] [CrossRef] [PubMed]
  44. Moore, S.S.; Costa, A.; Penasa, M.; Callegaro, S.; De Marchi, M. How heat stress conditions affect milk yield, composition, and price in Italian Holstein herds. J. Dairy Sci. 2023, 106, 4042–4058. [Google Scholar] [CrossRef] [PubMed]
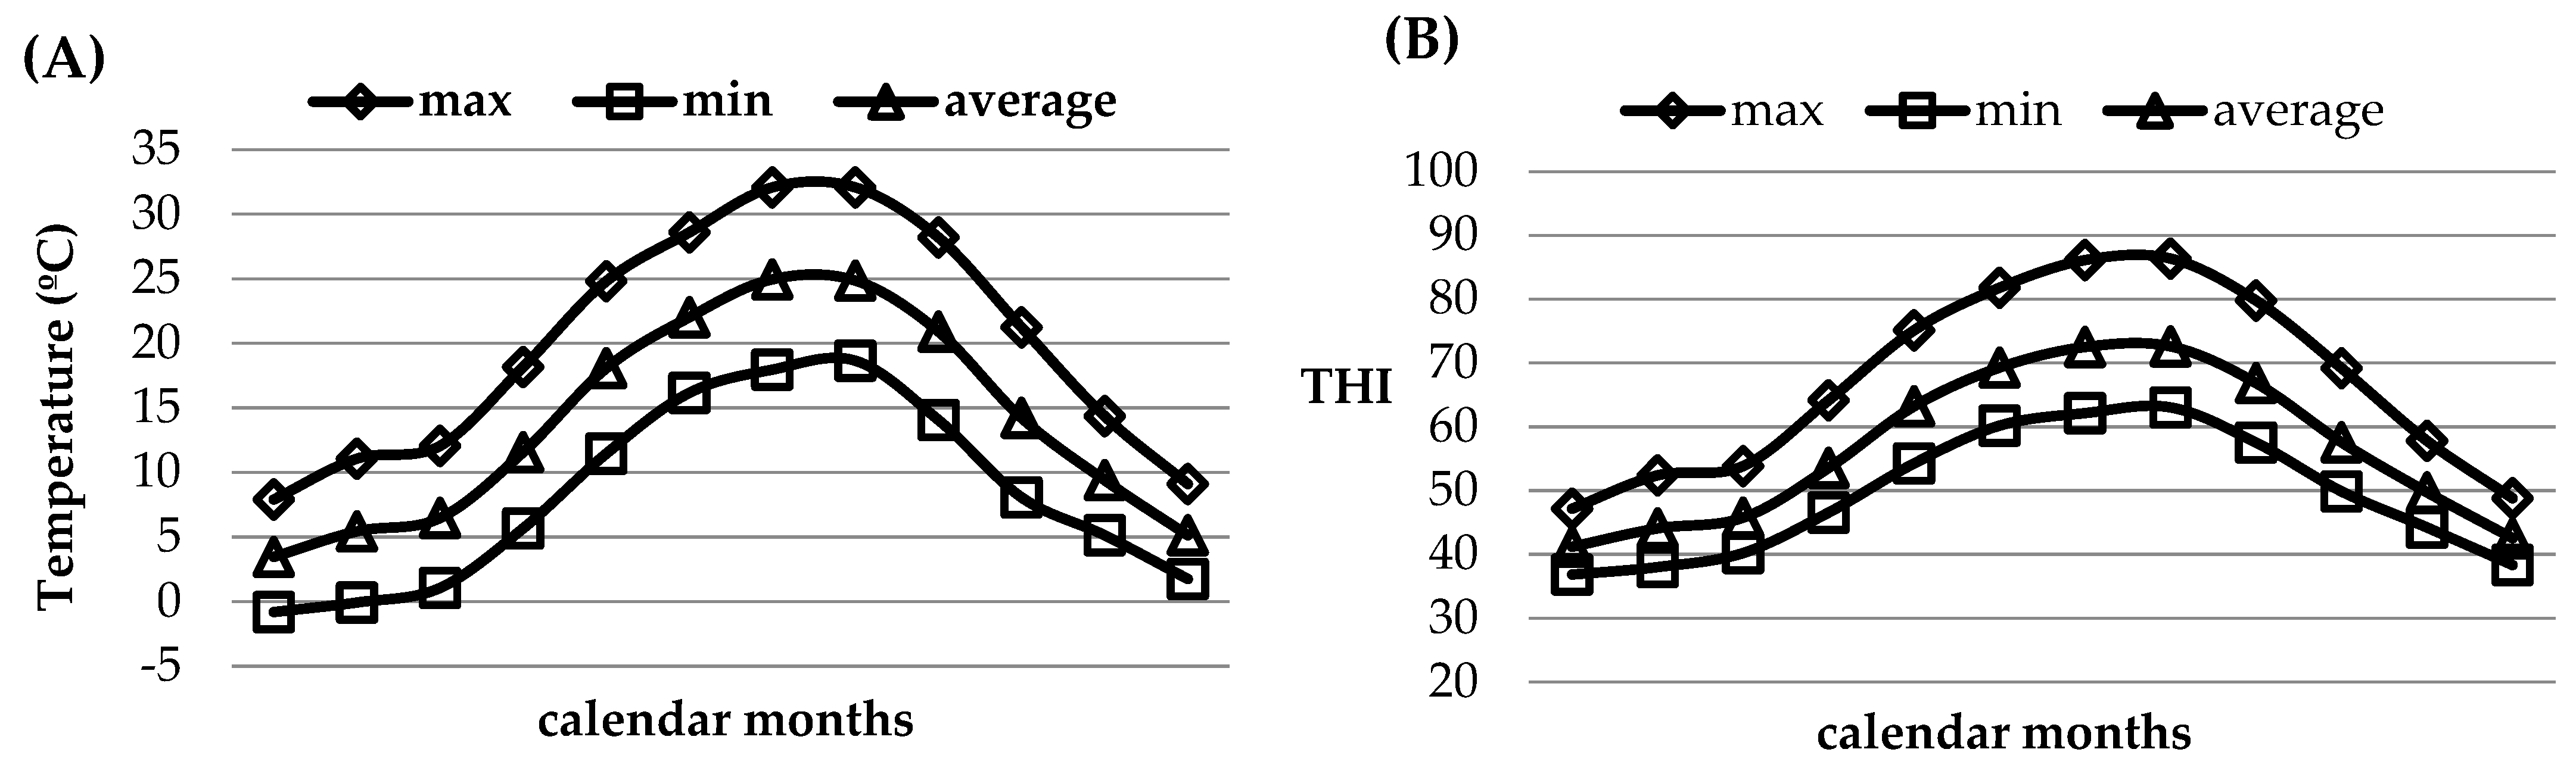
Figure 1. Average monthly maximum, minimum, and average daily temperatures (A) and THI (temperature–humidity index) values (B) for the farm area for the 6 years by month.
Dairy 05 00018 g001
Figure 2. LS mean milk-yield values for 305-day lactation depending on calving season.
Dairy 05 00018 g002
Figure 3. LS mean protein and fat % values for 305-day lactation depending on calving season.
Dairy 05 00018 g003
Figure 4. Lactation curves depending on calving season.
Dairy 05 00018 g004
Table 1. Average and maximum THI values by seasons and years of the study.
SeasonNumber of ObservationsMaximum THI ValuesAverage THI Values
2017
Spring9264.27 ± 1.1854.20 ± 0.88
Summer8885.49 ± 0.4871.72 ± 0.31
Autumn9070.65 ± 1.1769.12 ± 0.88
Winter9049.75 ± 0.9142.55 ± 0.63
2018
Spring9263.25 ± 1.1753.41 ± 0.82
Summer8884.46 ± 0.6670.96 ± 0.43
Autumn9071.39 ± 1.2159.67 ± 0.81
Winter9048.87 ± 0.7542.42 ± 0.57
2019
Spring8265.01 ± 1.5954.56 ± 1.19
Summer8284.68 ± 0.5871.88 ± 0.30
Autumn9069.41 ± 1.0758.23 ± 0.80
Winter9049.62 ± 0.7942.91 ± 0.56
2020
Spring9265.76 ± 1.1455.24 ± 0.85
Summer8883.87 ± 0.5870.51 ± 0.41
Autumn9068.77 ± 1.3057.90 ± 1.07
Winter6248.32 ± 0.7941.89 ± 0.60
2021
Spring9363.48 ± 1.1953.59 ± 0.93
Summer6085.08 ± 1.0071.40 ± 0.64
Autumn9063.92 ± 1.1855.25 ± 0.86
Winter9048.80 ± 0.8742.11 ± 0.61
2022
Spring8265.01 ± 1.5954.56 ± 1.19
Summer9284.68 ± 0.5871.88 ± 0.30
Autumn9069.41 ± 1.0758.23 ± 0.80
Winter9049.62 ± 0.7942.91 ± 0.56
Table 2. Average values and variation in the main productive traits for 305-day lactation by lactation number.
Lactation NumberNumber Productive Traits for 305-Day Lactation
Milk Yield, kgAverage Fat, %Average Protein, %
nx ± SeSDx ± SeSDx ± SeSD
First1508068.78 ± 90.201104.753.68 ± 0.010.1633.21 ± 0.010.096
Second908415.67 ± 147.461398.913.71 ± 0.020.1823.26 ± 0.050.473
Third468688.41 ± 268.521819.523.70 ± 0.030.1663.20 ± 0.020.103
Total2868277.57 ± 79.951352.083.69 ± 0.010.1703.22 ± 0.020.277
Table 3. Analysis of variance for the influence of the controlled factors on the productive traits for 305-day lactation.
Sources of VariationDegrees of FreedomProductive Traits for a 305-Day Lactation
Milk Yield, kgAverage Fat, %Average Protein, %
(n − 1)MSF  PMSF  PMSF  P
Total for the model56,345,1483.750.0160.56-0.1081.50-
Lactation number28.014.730.0331.15-0.1712.37-
Calving season34.722.790.0060.20-0.0670.92-
Error2801.69 0.029 0.072
Significance at p < 0.05; significance at p < 0.01; significance at p < 0.001; - no significant effect.
Table 4. Average values and variation in productive traits for a test day by lactation number.
Lactation Number Number Productive Traits for a Test Day
Milk Yield, kg% Fat% Protein
nx ± SeSDx ± SeSDx ± SeSD
First147928.69 ± 0.228.373.68 ± 0.010.313.21 ± 0.010.20
Second89029.25 ± 0.339.853.70 ± 0.010.273.21 ± 0.010.19
Third37529.83 ± 9.5510.653.73 ± 0.020.353.21 ± 0.010.21
Total274429.01 ± 0.189.213.69 ± 0.010.303.21 ± 0.000.19
Table 5. Analysis of variance for influence of controlled factors on milk yield for a test day.
Sources of VariationDegrees of FreedomTest-Day Milk YieldTest-Day Fat %Test-Day Protein %
(n − 1)MSF  PMSF  PMSF  P
Total for the model147083.76144.96 ***0.161.69-0.061.87-
Lactation number21964.01 *0.465.0 **0.010.4-
Calving season31483.03 *0.090.09-0.080.69-
Lactation period910,926223.59 ***1.121.3-0.092.1 *
Error272940 0.09 0.03
* significance at p < 0.05; ** significance at p < 0.01; *** significance at p < 0.001; - no significant effect.
Disclaimer/Publisher’s Note: The statements, opinions and data contained in all publications are solely those of the individual author(s) and contributor(s) and not of MDPI and/or the editor(s). MDPI and/or the editor(s) disclaim responsibility for any injury to people or property resulting from any ideas, methods, instructions or products referred to in the content.

