Carbon Footprint and Carbon Sink of a Local Italian Dairy Supply Chain


Abstract
:1. Introduction
2. Materials and Methods
2.1. Goal and Scope
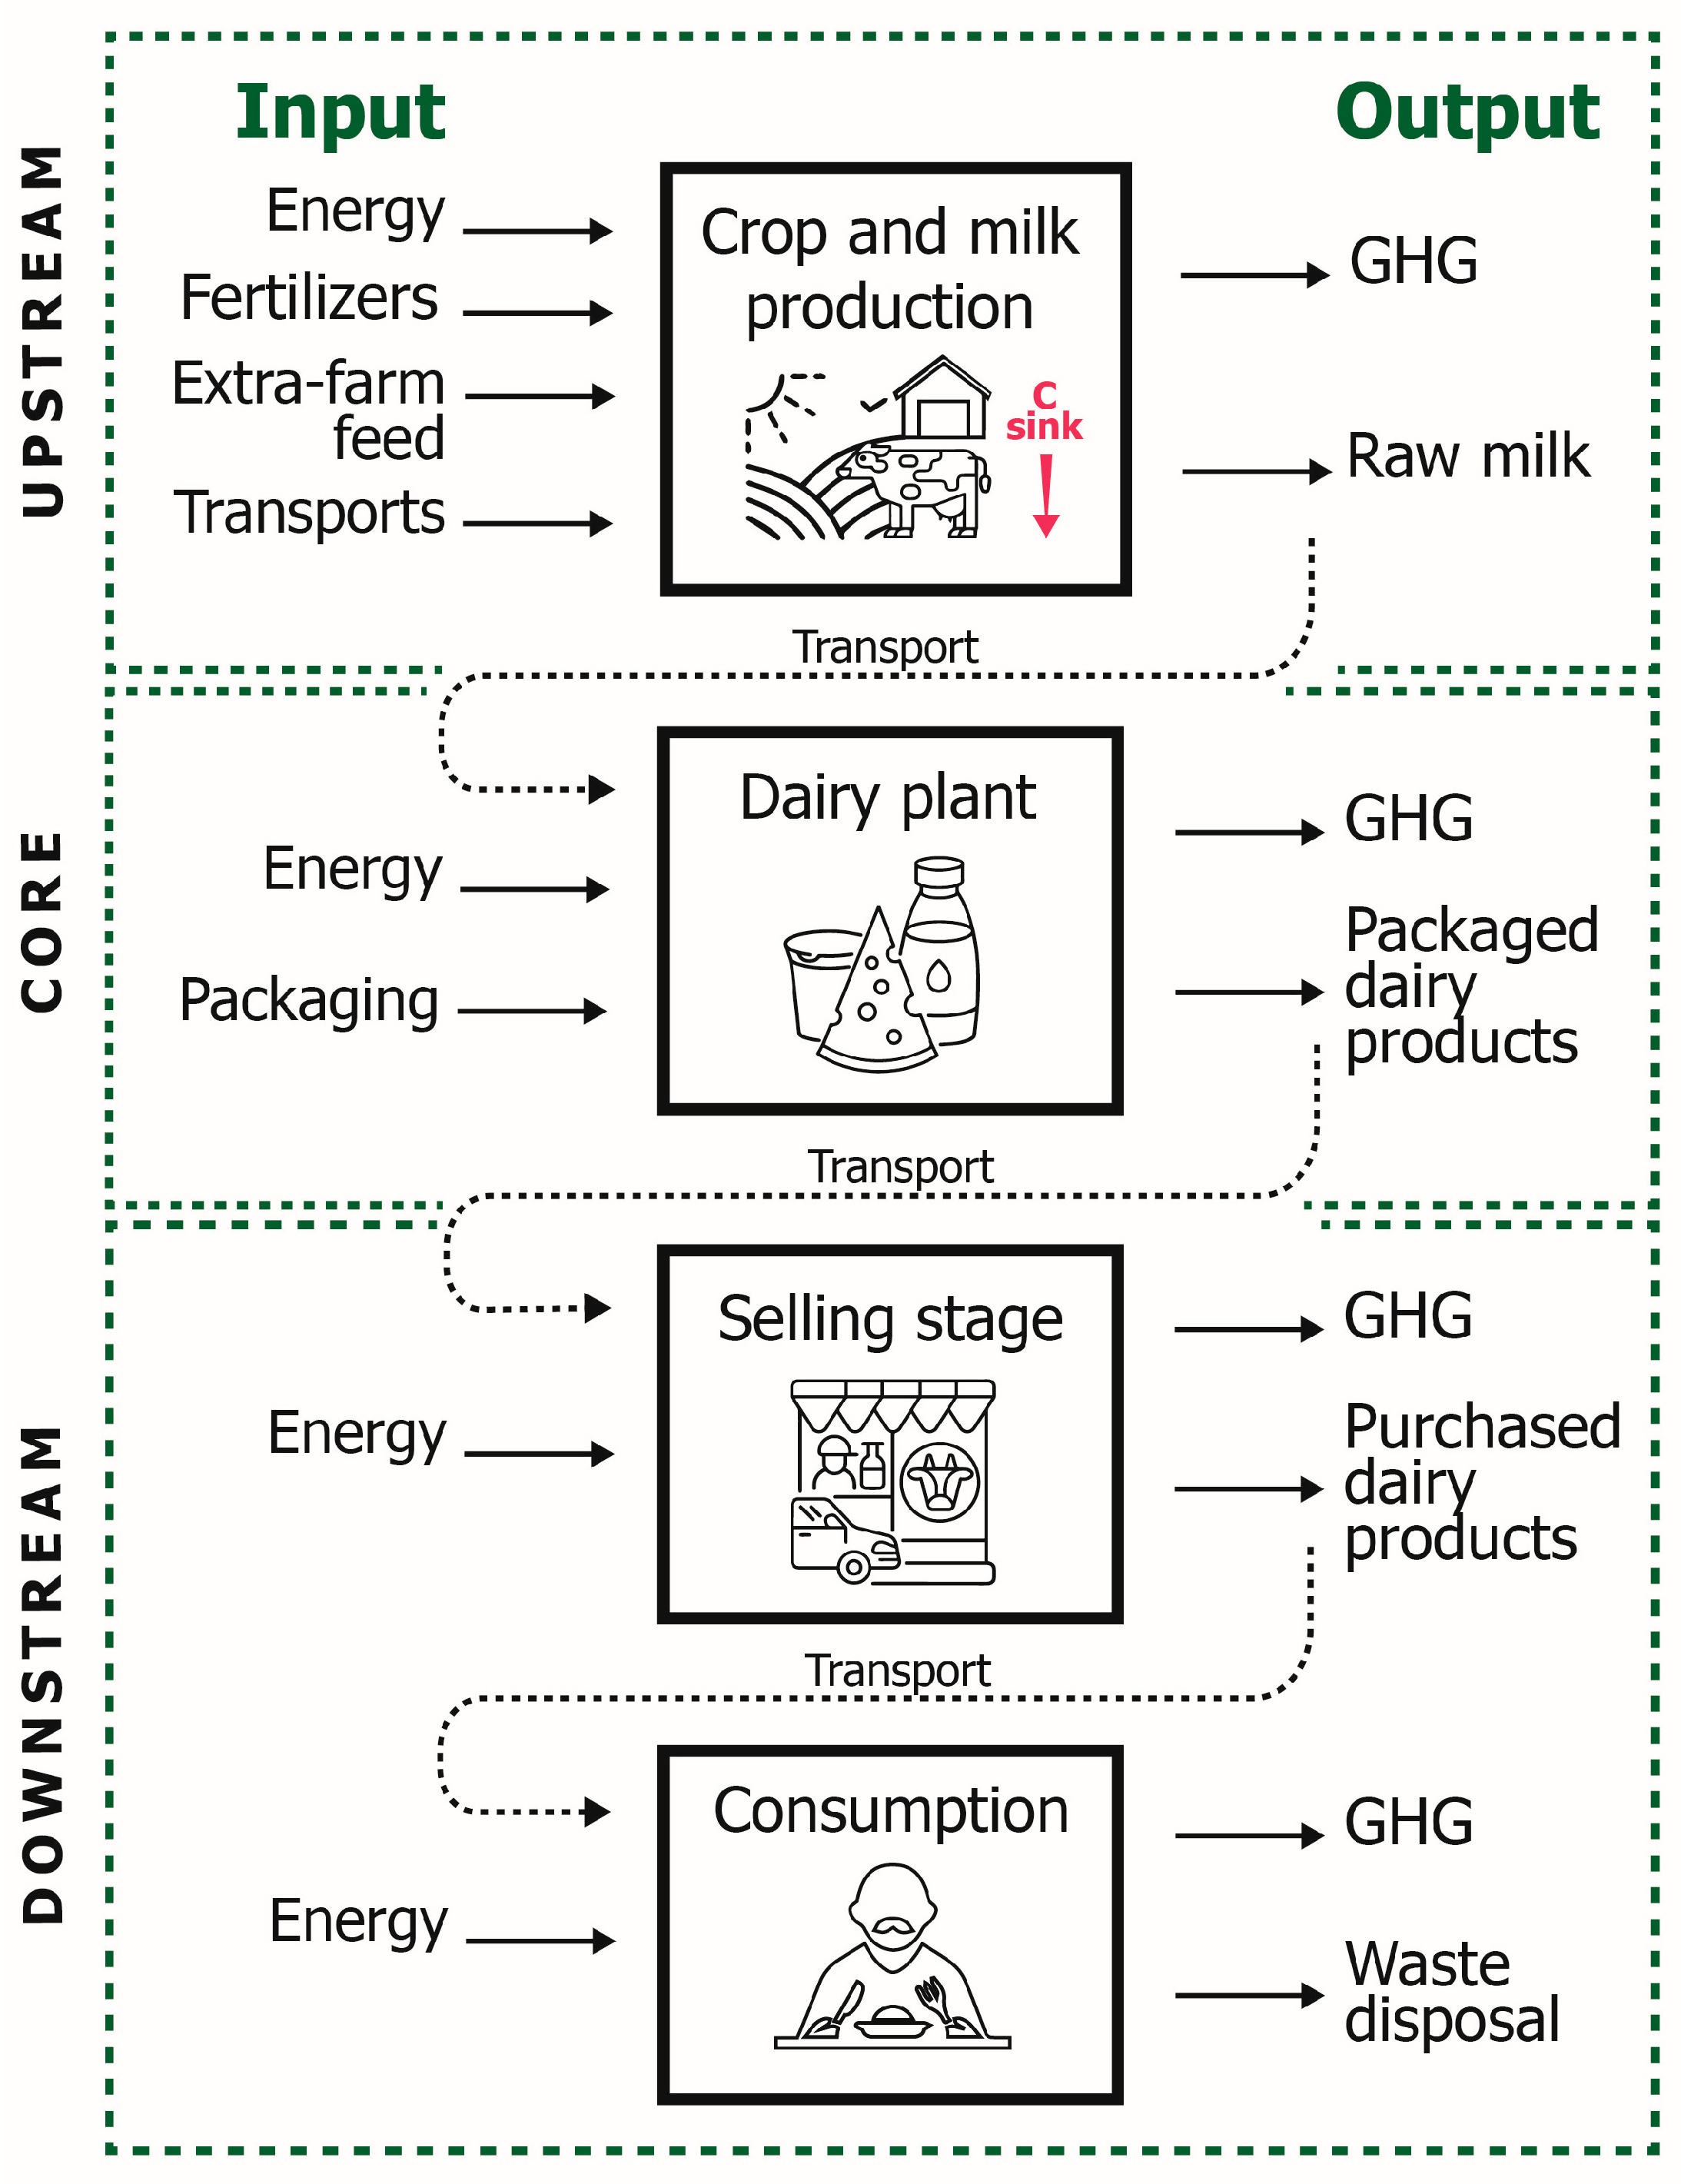
2.2. Functional Units and System Boundaries
2.3. Significance Analysis
2.4. Life Cycle Inventory
2.4.1. Upstream—Dairy Farm
2.4.2. Core—Dairy Plant
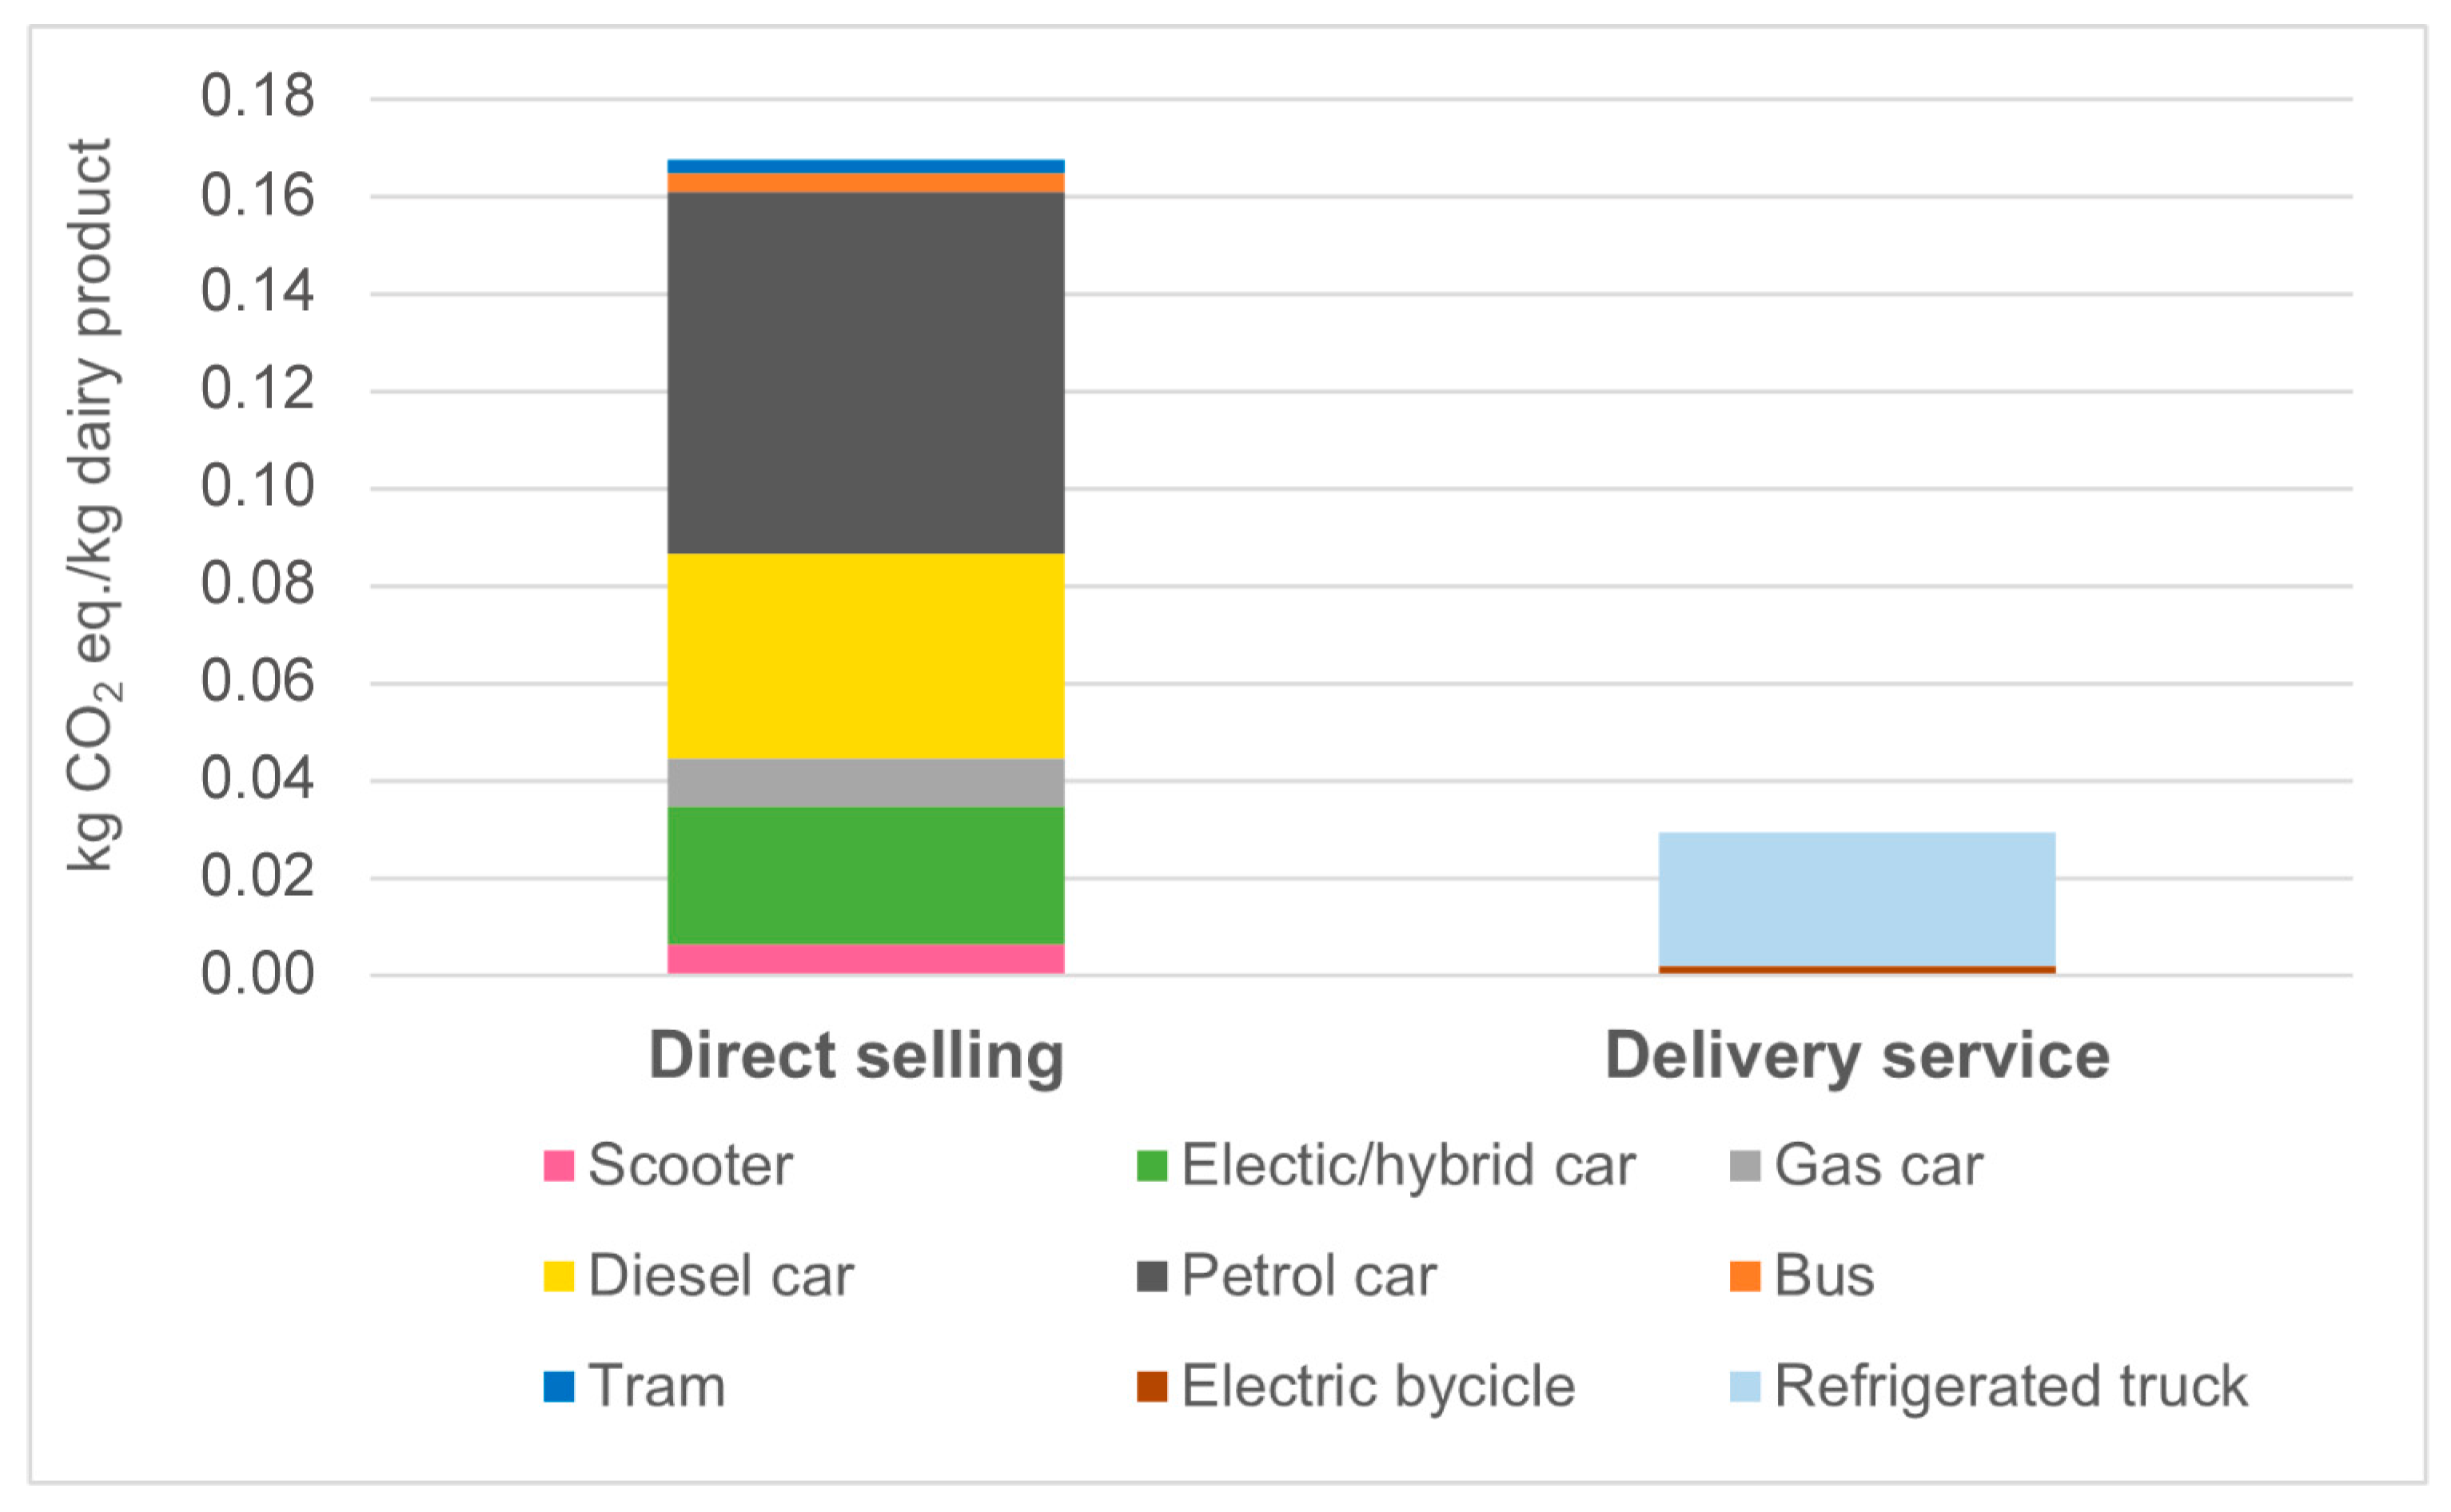
2.4.3. Downstream—Selling and Consumption
2.5. Allocation Criteria
2.6. Life Cycle Inventory Analysis
Impact Assessment
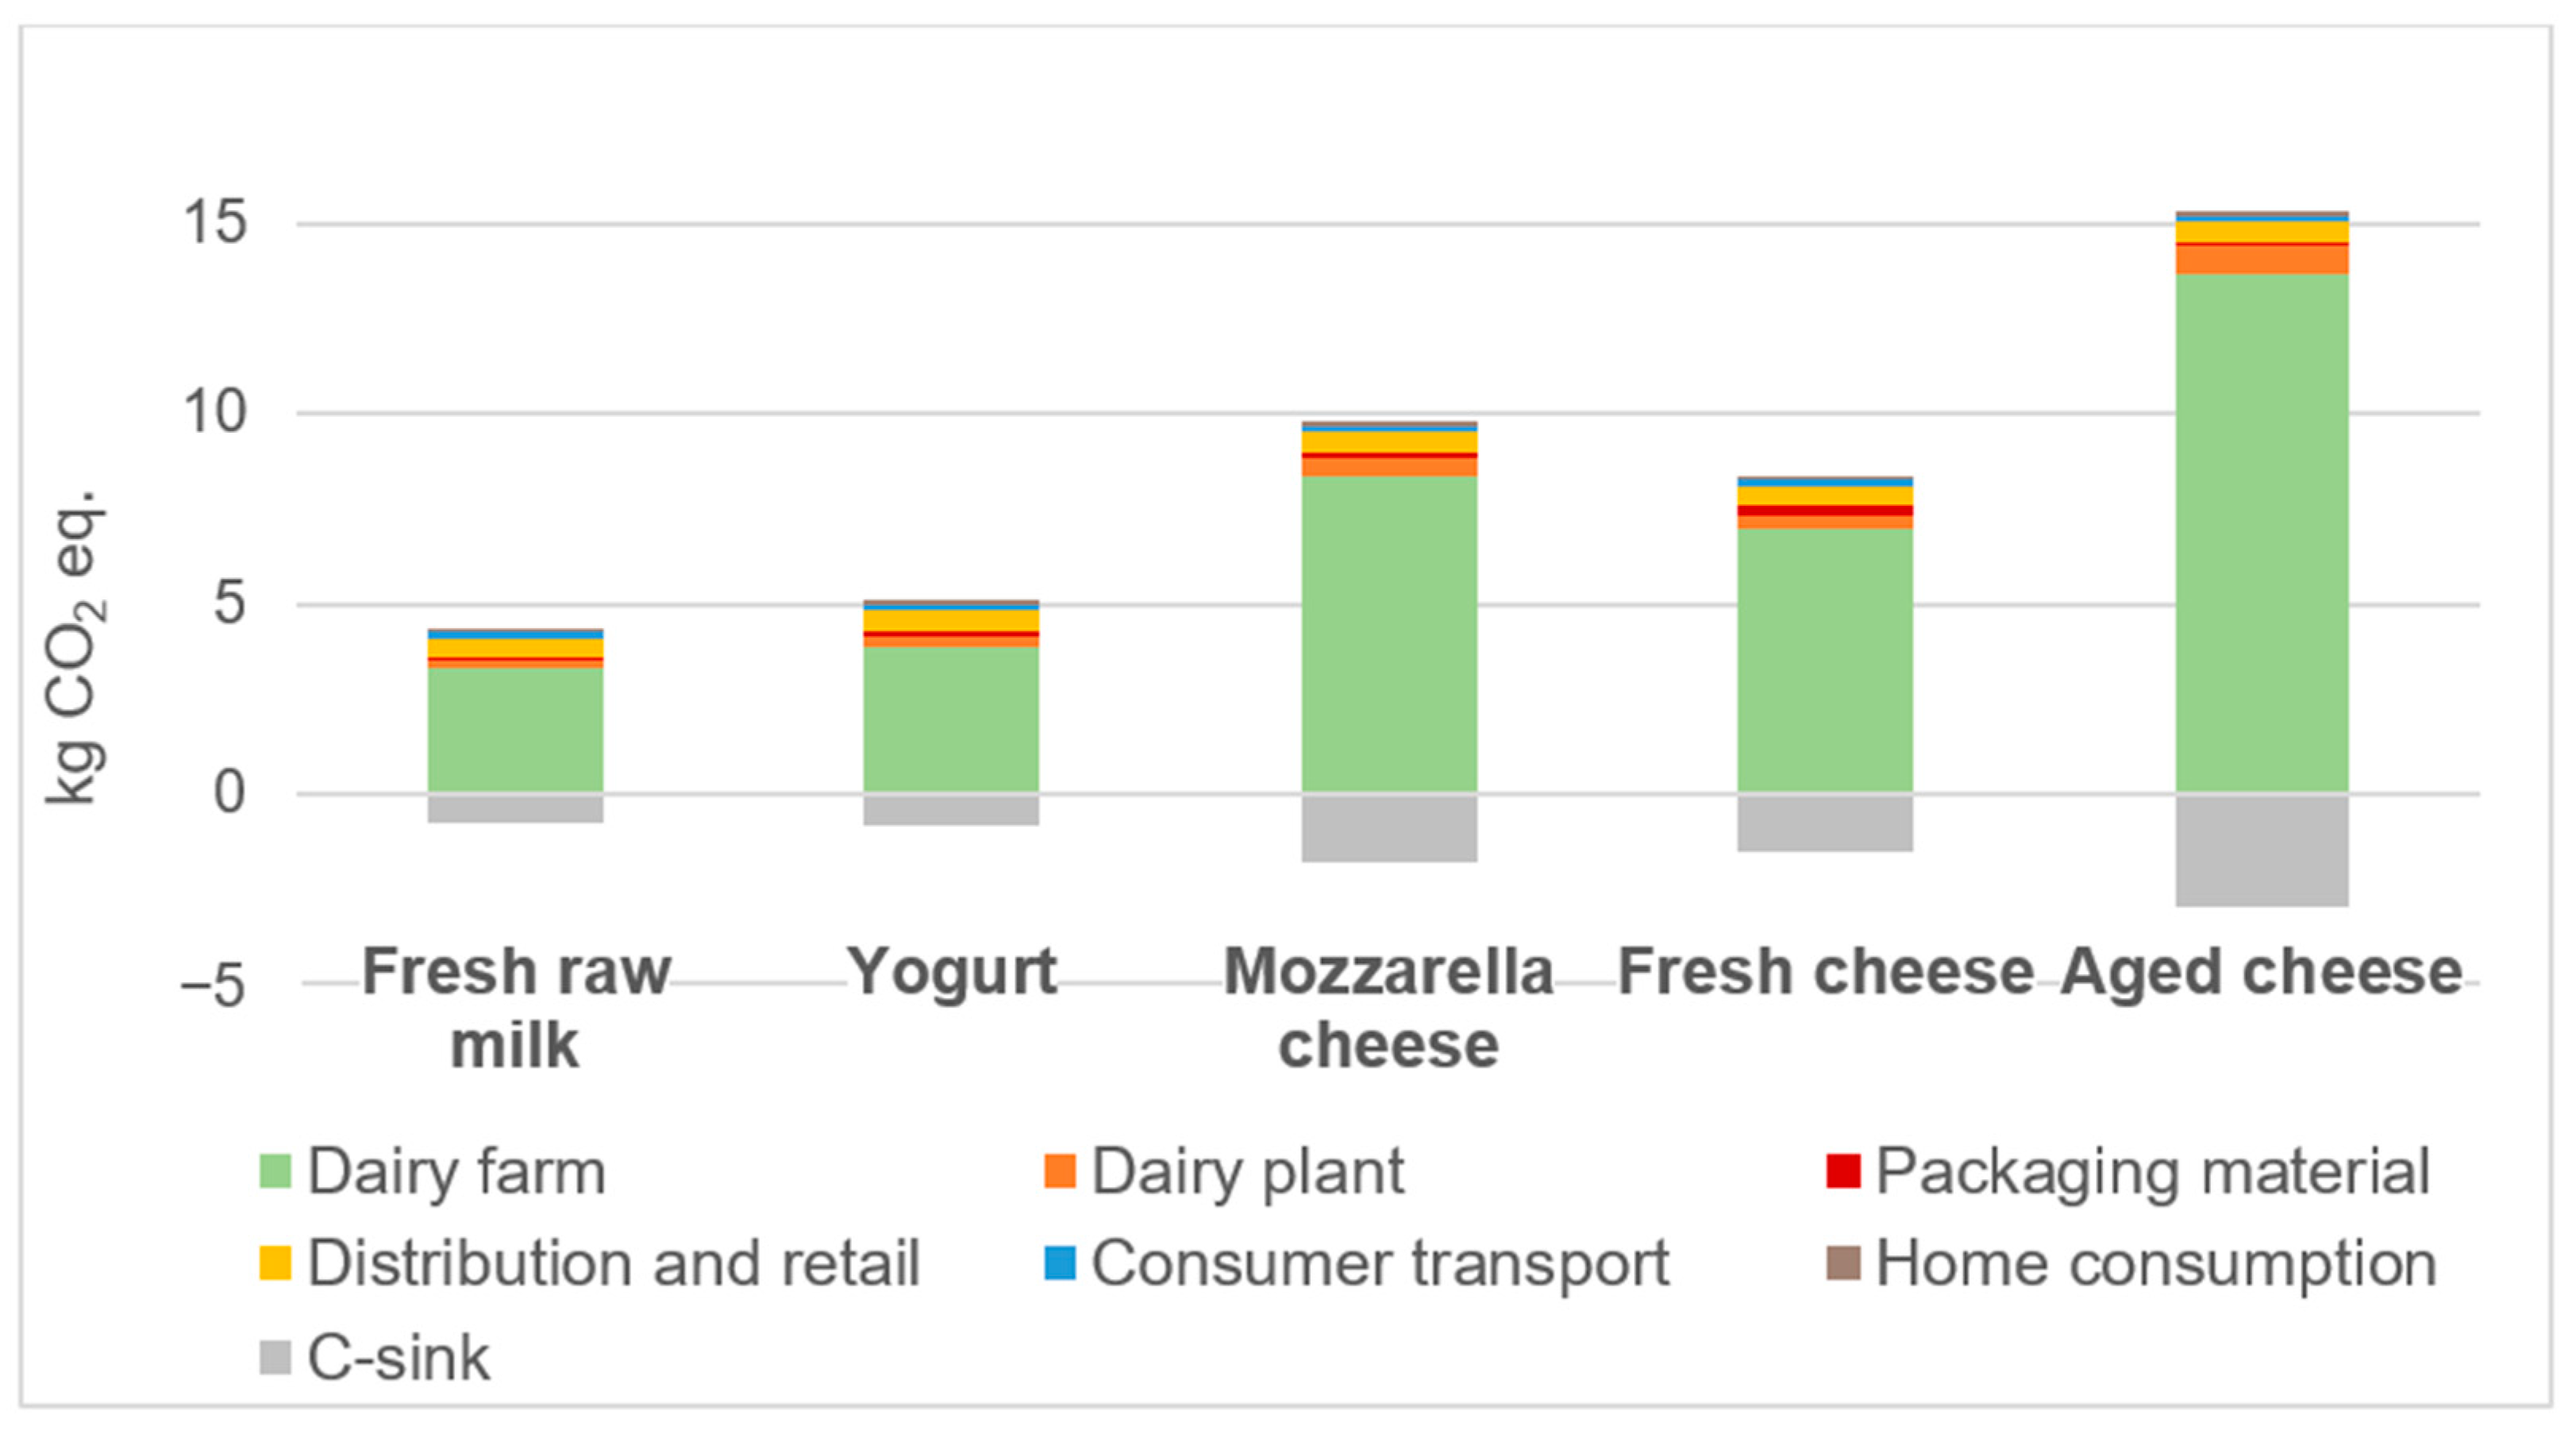
3. Results
Uncertainty Analysis
4. Discussion
5. Conclusions
Supplementary Materials
Author Contributions
Funding
Institutional Review Board Statement
Informed Consent Statement
Data Availability Statement
Acknowledgments
Conflicts of Interest
References
- IPCC. Climate Change 2023: Synthesis Report. Contribution of Working Groups I, II and III to the Sixth Assessment Report of the Intergovernmental Panel on Climate Change; IPCC: Geneva, Switzerland, 2023; pp. 35–115. [CrossRef]
- EEA. Annual European Union Greenhouse Gas Inventory 1990–2021 and Inventory Report 2023. Submission to the UNFCCC Secretariat. 2023. Available online: https://www.eea.europa.eu/publications/annual-european-union-greenhouse-gas-2 (accessed on 12 January 2024).
- OECD/FAO. OECD-FAO Agricultural Outlook 2023–2032. Chapter 7. Dairy and Dairy Products; OECD Publishing: Paris, France, 2023. [Google Scholar] [CrossRef]
- Guzman-Luna, P.; Mauricio-Iglesias, M.; Flysjö, A.; Hospido, A. Analysing the interaction between the dairy sector and climate change from a life cycle perspective: A review. Trends Food Sci Technol. 2022, 126, 168–179. [Google Scholar] [CrossRef]
- Rencricca, G.; Froldi, F.; Moschini, M.; Trevisan, M.; Ghnimi, S.; Lamastra, L. The environmental impact of permanent meadows-based farms: A comparison among different dairy farm management systems of an Italian cheese. Sustain. Prod. Consum. 2023, 37, 53–64. [Google Scholar] [CrossRef]
- ISO 14067; Greenhouse Gases. Carbon Footprint of Products. Requirements and Guidelines for Quantification and Communication (Technical Specifications). International Organization for Standardization: Geneve, Switzerland, 2013.
- ISO 14040; Environmental Management. Life Cycle Assessment. Principles and Framework. International Organization for Standardization: Geneve, Switzerland, 2006.
- Vergé, X.P.C.; Maxime, D.; Dyer, J.A.; Desjardins, R.L.; Arcand, Y.; Vanderzaag, A. Carbon footprint of Canadian dairy products: Calculations and issues. J. Dairy Sci. 2013, 96, 6091–6104. [Google Scholar] [CrossRef]
- Vasilaki, V.; Katsou, E.; Ponsá, S.; Colón, J. Water and carbon footprint of selected dairy products: A case study in Catalonia. J. Clean. Prod. 2016, 139, 504–516. [Google Scholar] [CrossRef]
- Dalla Riva, A.; Burek, J.; Kim, D.; Thoma, G.; Cassandro, M.; De Marchi, M. The environmental analysis of asiago PDO cheese: A case study from farm gate-to-plant gate. Ital. J. Anim. Sci. 2018, 17, 250–262. [Google Scholar] [CrossRef]
- Aprile, M.C.; Fiorillo, D. Other-regarding preferences in pro-environmental behaviours: Empirical analysis and policy implications of organic and local food products purchasing in Italy. J. Environ. Manag. 2023, 343, 118174. [Google Scholar] [CrossRef]
- Guerci, M.; Bava, L.; Zucali, M.; Tamburini, A.; Sandrucci, A. Effect of summer grazing on carbon footprint of milk in Italian Alps: A sensitivity approach. J. Clean. Prod. 2014, 73, 236–244. [Google Scholar] [CrossRef]
- Salvador, S.; Corazzin, M.; Romanzin, A.; Bovolenta, S. Greenhouse gas balance of mountain dairy farms as affected by grassland carbon sequestration. J. Environ. Manag. 2017, 196, 644–650. [Google Scholar] [CrossRef]
- Batalla, I.; Knudsen, M.T.; Mogensen, L.; del Hierro, O.; Pinto, M.; Hermansen, J.E. Carbon footprint of milk from sheep farming systems in Northern Spain including soil carbon sequestration in grasslands. J. Clean. Prod. 2015, 104, 121–129. [Google Scholar] [CrossRef]
- Battini, F.; Agostini, A.; Tabaglio, V.; Amaducci, S. Environmental impacts of different dairy farming systems in the Po Valley. J. Clean. Prod. 2016, 112, 91–102. [Google Scholar] [CrossRef]
- Sabia, E.; Kühl, S.; Flach, L.; Lambertz, C.; Gauly, M. Effect of Feed Concentrate Intake on the Environmental Impact of Dairy Cows in an Alpine Mountain Region Including Soil Carbon Sequestration and Effect on Biodiversity. Sustainability 2020, 12, 2128. [Google Scholar] [CrossRef]
- Byrnes, R.C.; Eastburn, D.J.; Tate, K.W.; Roche, L.M. A global meta-analysis of grazing impacts on soil health indicators. J. Environ. Qual. 2018, 47, 758. [Google Scholar] [CrossRef]
- Grossi, G.; Vitali, A.; Lacetera, N.; Danieli, P.P.; Bernabucci, U.; Nardone, A. Carbon Footprint of Mediterranean Pasture-Based Native Beef: Effects of Agronomic Practices and Pasture Management under Different Climate Change Scenarios. Animals 2020, 10, 415. [Google Scholar] [CrossRef]
- PCR. Product Category Rules; Dairy Products. Product Category Classification: UN CPC 0221, 2211, 2212, 2221, 2223, 2224, 2225; The International EPD System: Stockholm, Sweden, 2021.
- Rossi, C.; Bernabucci, U.; Grossi, G.; Cesarini, F.; Lacetera, N.; Evangelista, C.; Turriziani, G.; Vitali, A. Cradle-to-grave Life Cycle Assessment of Buffalo mozzarella cheese supply chain in central Italy. J. Agric. Food Res. 2023, 14, 100871. [Google Scholar] [CrossRef]
- Wernet, G.; Bauer, C.; Steubing, B.; Reinhard, J.; Moreno-ruiz, E.; Weidema, B. The ecoinvent database version 3 (part I): Overview and methodology. Int. J. Life Cycle Assess. 2016, 21, 1218–1230. [Google Scholar] [CrossRef]
- IPCC. Intergovernmental Panel on Climate Change. Emissions from Livestock and Manure Management. Chapter 10. In Refinement to the 2006 IPCC Guidelines for National Greenhouse Gas Inventories; Agriculture, Forestry and Other Land Use: Geneva, Switzerland, 2019. [Google Scholar]
- Barahmand, Z.; Eikeland, M.S. Life Cycle Assessment under Uncertainty: A Scoping Review. World 2022, 3, 692–717. [Google Scholar] [CrossRef]
- Muller, S.; Lesage, P.; Ciroth, A.; Mutel, C.; Weidema, B.P.; Samson, R. The application of the pedigree approach to the distributions foreseen in ecoinvent v3. Int. J. Life Cycle Assess. 2016, 21, 1327–1337. [Google Scholar] [CrossRef]
- EPA. Guidance on Data Quality Assessment for Life Cycle Inventory Data. 2016; EPA/600/R-16/096. Available online: https://cfpub.epa.gov/si/si_public_record_report.cfm?Lab=NRMRL&dirEntryId=321834 (accessed on 12 January 2024).
- Evans, J. Carbon Emissions from Chilled and Frozen Cold Chains for a Typical UK Sunday Roast Chicken Meal; Refrigeration Developments and Testing Ltd. RD&T: Bristol, UK, 2012. [Google Scholar]
- OECD/FAO. OECD-FAO Agricultural Outlook OECD Agriculture Statistics (Database); OECD Publishing: Paris, France, 2021. [Google Scholar] [CrossRef]
- Fisher, R.A. The logic of inductive inference (with discussion). J. R. Stat. Soc. 1935, 98, 39–82. [Google Scholar] [CrossRef]
- Evans, J.; Fostera, A.; Huetb, J.M.; Reinholdtb, L.; Fikiinc, K.; Ziliod, C.; Houskae, M.; Landfelde, A.; Bondf, C.; Scheursg, M.; et al. Specific energy consumption values for various refrigerated food cold stores. Energy Build. 2014, 74, 141–151. [Google Scholar] [CrossRef]
- Bulletin 479; A Common Carbon Footprint Approach for the Dairy Sector. The IDF Guide to Standard Life Cycle Methodology. IDF, International Dairy Federation: Brussels, Belgium, 2015.
- Bulletin 520; The IDF Global Carbon Footprint Standard for the Dairy Sector. IDF, International Dairy Federation: Brussels, Belgium, 2022.
- Decreto Ministeriale 21/4/1986; Approvazione dei Metodi Ufficiali di Analisi per i Formaggi (Italian Official Methods of Cheeses Analysis). MAF: Rome, Italy, 1986; No. 88. p. 8.
- CRPA. Liquami Zootecnici: Manuale per L’utilizzazione Agronomica. L’Informatore Agrario; CRPA: Reggio Emilia, Italy, 2001; ISBN 887220142X. [Google Scholar]
- ISPRA. Italian Greenhouse Gas Inventory 1990-2018. National Inventory Report 2020; ISPRA Report Number 318/20; ISPRA: Rome, Italy, 2020; ISBN 978-88-448-0993-5.
- Gilhespy, S.L.; Anthony, S.; Cardenas, L.; Chadwick, D.; Li, C.; Misselbrook, T.; Rees, R.M.; Salas, W.; Sanz-cobena, A.; Smith, P.; et al. First 20 years of DNDC (DeNitrification DeComposition): Model evolution. Ecol. Model. 2014, 292, 51–62. [Google Scholar] [CrossRef]
- Petersen, B.M.; Knudsen, M.T.; Hermansen, J.E.; Halberg, N. An approach to include soil carbon changes in life cycle assessments. J. Clean. Prod. 2013, 52, 217–224. [Google Scholar] [CrossRef]
- EPA. Direct Fugitive Emissions from Refrigeration, Air Conditioning, Fire Suppression, and Industrial Gases. Greenhouse Gas Inventory Guidance. 2014. Available online: https://www.epa.gov/sites/default/files/2015-07/documents/fugitiveemissions.pdf (accessed on 12 January 2024).
- Dalla Riva, A.; Burek, J.; Kim, D.; Thoma, G.; Cassandro, M.; De Marchi, M. Environmental life cycle assessment of Italian mozzarella cheese: Hotspots and improvement opportunities. J. Dairy Sci. 2017, 100, 7933–7952. [Google Scholar] [CrossRef]
- Frischknecht, R. LCI modelling approaches applied on recycling of materials in view of environmental sustainability, risk perception and eco-efficiency. Int. J. Life Cycle Assess. 2010, 15, 666–671. [Google Scholar] [CrossRef]
- Sun, S.; Ertz, M. Life cycle assessment and Monte Carlo simulation to evaluate the environmental impact of promoting LNG vehicles. MethodsX 2020, 7, 101046. [Google Scholar] [CrossRef]
- Kristensen, T.; Søegaard, K.; Eriksen, J.; Mogensen, L. Carbon footprint of cheese produced on milk from Holstein and Jersey cows fed hay differing in herb content. J. Clean. Prod. 2015, 101, 229–237. [Google Scholar] [CrossRef]
- Canellada, F.; Laca, A.; Laca, A.; Díaz, M. Environmental impact of cheese production: A case study of a small-scale factory in southern Europe and global overview of carbon footprint. Sci. Total Environ. 2018, 635, 167–177. [Google Scholar] [CrossRef]
- Hayek, J.; El Bachawati, M.; Manneh, R. Life cycle assessment and water footprint scarcity of yogurt. Environ. Dev. Sustain. 2021, 23, 18362–18393. [Google Scholar] [CrossRef]
- Laca, A.; Gómez, N.; Laca, A.; Díaz, M. Overview on GHG emissions of raw milk production and a comparison of milk and cheese carbon footprints of two different systems from northern Spain. Environ. Sci. Pollut. Res. 2020, 27, 1650–1666. [Google Scholar] [CrossRef]
- Biagetti, E.; Gislon, G.; Martella, A.; Zucali, M.; Bava, L.; Franco, S.; Sandrucci, A. Comparison of the use of life cycle assessment and ecological footprint methods for evaluating environmental performances in dairy production. Sci. Total Environ. 2023, 905, 166845. [Google Scholar] [CrossRef]
- Pirlo, G.; Lolli, S. Environmental impact of milk production from samples of organic and conventional farms in Lombardy (Italy). J. Clean. Prod. 2019, 211, 962–971. [Google Scholar] [CrossRef]
- Froldi, F.; Lamastra, L.; Trevisan, M.; Mambretti, D.; Moschini, M. Environmental impacts of cow’s milk in Northern Italy: Effects of farming performance. J. Clean. Prod. 2022, 363, 132600. [Google Scholar] [CrossRef]
- Aguerre, M.J.; Wattiaux, M.A.; Powell, J.M.; Broderick, G.A.; Arndt, C. Effect of forage-to-concentrate ratio in dairy cow diets on emission of methane, carbon dioxide, and ammonia, lactation performance, and manure excretion. J. Dairy Sci. 2011, 94, 3081–3093. [Google Scholar] [CrossRef]
- O’Brien, D.; Capper, J.L.; Garnsworthy, P.C.; Grainger, C.; Shalloo, L. A case study of the carbon footprint of milk from high-performing confinement and grass-based dairy farms. J. Dairy Sci. 2014, 97, 1835–1851. [Google Scholar] [CrossRef]
- Salvador, S.; Corazzin, M.; Piasentier, E.; Bovolenta, S. Environmental assessment of small-scale dairy farms with multifunctionality in mountain areas. J. Clean. Prod. 2016, 124, 94–102. [Google Scholar] [CrossRef]
- Henderson, B.; Lankoski, J.; Flynn, E.; Sykes, A.; Payen, F.T.; MacLeod, M. Soil carbon sequestration by agriculture: Policy options. In OECD Food, Agriculture and Fisheries; OECD: Paris, France, 2022; Volume 174. [Google Scholar] [CrossRef]
- Minasny, B.; Malone, B.P.; McBratney, A.B.; Angers, D.A.; Arrouays, D.; Chambers, A.; Chaplot, V.; Chen, Z.-S.; Cheng, K.; Das, B.S.; et al. Soil carbon 4 per mille. Geoderma 2017, 292, 59–86. [Google Scholar] [CrossRef]
- Nair, R.; Mehta, C.; Sharma, S. Carbon sequestration in soils-A Review. Agric. Rev. 2015, 36, 81–99. [Google Scholar] [CrossRef]
- Du, Y.; Yi, Q.; Li, C.; Liao, L. Life cycle oriented low-carbon operation models of machinery manufacturing industry. J. Clean. Prod. 2015, 91, 145–157. [Google Scholar] [CrossRef]
- Kumma, N.; Sarath, S.; Kruthiventi, S.S.H. Exergy and performance analysis of low GWP and Non-flammable HFO based refrigerant mixtures as alternatives to R134a. Therm. Sci. Eng. Prog. 2023, 39, 101691. [Google Scholar] [CrossRef]
- Feitz, A.J.; Lundie, S.; Dennien, G.; Morain, M.; Jones, M. Generation of an industry-specific physico-chemical allocation matrix. Int. J. Life Cycle Assess. 2007, 12, 109–117. [Google Scholar] [CrossRef]
- Rejeesh, C.R.; Anto, T. Packaging of milk and dairy products: Approaches to sustainable packaging. Mater. Today Proc. 2023, 72, 2946–2951. [Google Scholar] [CrossRef]
- Vitali, A.; Grossi, G.; Martino, G.; Bernabucci, U.; Nardone, A.; Lacetera, N. Carbon footprint of organic beef meat from farm to fork: A case study of short supply chain. J. Sci. Food Agric. 2018, 98, 5518–5524. [Google Scholar] [CrossRef]


| Item | Value |
|---|---|
| Herd | |
| Dairy cow, no | 30 |
| Dry cow, no | 7 |
| Heifers, no | 9 |
| Beef calves, no | 20 |
| Milk, L/day/head | 18 |
| Fat, % | 3.91 |
| Protein, % | 3.42 |
| Feed | |
| Cultivated area, ha | 48 |
| Pasture area, ha | 12 |
| On-farm hay, q/y | 3500 |
| Extra-farm feed, q/y | 25 |
| Energy | |
| Electricity, kWh/y | 12,491 |
| Diesel, kg/y | 7616 |
| Item | Value |
|---|---|
| Production | |
| Processed raw milk, ton/y | 119 |
| Fresh raw milk, tons/y | 11.9 |
| Mozzarella cheese, tons/y | 1.5 |
| Fresh cheese, tons/y | 2.7 |
| Mid-aged cheese, ton/y | 3.3 |
| Yogurt, tons/y | 16.1 |
| Packaging | |
| PET, tons/y | 0.2 |
| PP, tons/y | 1.7 |
| LDPE, tons/y | 0.17 |
| Plastic-paper, tons/y | 0.2 |
| Energy | |
| Electricity, kWh/y | 7608 |
| Diesel, tons/y | 884 |
| Average Transports | |
| Packaging store, km/single trip | 382 ± 250 |
| Item | Mean Values | |
|---|---|---|
| Consumers habits | ||
| Markets | a 1 | b 1 |
| Purchased dairy products, kg | 0.72 ± 0.67 | 0.56 ± 0.14 |
| Total shopping expenditure, € | 60 ± 29 | 33 ± 25 |
| Dairy products on total expense, % | 24 ± 23 | 44 ± 25 |
| Transport type, km | ||
| On foot | 1.4 ± 0.9 | 1.3 ± 0.7 |
| Bicycle | 3.0 | 1.0 |
| Scooter | 4.7 ± 2.9 | - |
| Hybrid car | 6.4 ± 5.3 | 1.0 |
| Petrol car | 5.4 ± 4.6 | 1.7 ± 1.0 |
| Diesel car | 9.0 ± 6.9 | 2.0 ± 1.4 |
| Gas car | 3.0 | 2.3 ± 1.2 |
| Bus/Metro | 8.0 ± 0 | - |
| Daily delivery transports | ||
| Refrigerated trucks, km | 19.4 | |
| Electric bicycles, km | 6 | |
| Product | Dairy Yield (%) | DM (%) | AF (%) |
|---|---|---|---|
| Fresh raw milk | 100 | 12 | 18.5 |
| Yogurt | 90 | 14 | 29.1 |
| Mozzarella cheese | 12.5 | 30 | 5.8 |
| Fresh cheese | 15 | 25 | 8.7 |
| Aged cheese | 11 | 49 | 20.7 |
| Other dairy products a | 15 | 30 | 17.3 |
| CF | Unit | Mean | CV, % | 95% CI | |
|---|---|---|---|---|---|
| Fresh milk | kg CO2 eq. | 4.39 | 4.63 | 4.14 | 4.68 |
| Yogurt | kg CO2 eq. | 5.10 | 5.95 | 4.81 | 5.45 |
| Mozzarella cheese | kg CO2 eq. | 9.82 | 7.11 | 8.96 | 10.85 |
| Fresh cheese | kg CO2 eq. | 8.40 | 7.22 | 7.60 | 9.37 |
| Aged cheese | kg CO2 eq. | 15.34 | 7.29 | 13.97 | 16.95 |
Disclaimer/Publisher’s Note: The statements, opinions and data contained in all publications are solely those of the individual author(s) and contributor(s) and not of MDPI and/or the editor(s). MDPI and/or the editor(s) disclaim responsibility for any injury to people or property resulting from any ideas, methods, instructions or products referred to in the content. |
© 2024 by the authors. Licensee MDPI, Basel, Switzerland. This article is an open access article distributed under the terms and conditions of the Creative Commons Attribution (CC BY) license (https://creativecommons.org/licenses/by/4.0/).
Share and Cite
Rossi, C.; Grossi, G.; Lacetera, N.; Vitali, A. Carbon Footprint and Carbon Sink of a Local Italian Dairy Supply Chain. Dairy 2024, 5, 201-216. https://doi.org/10.3390/dairy5010017
Rossi C, Grossi G, Lacetera N, Vitali A. Carbon Footprint and Carbon Sink of a Local Italian Dairy Supply Chain. Dairy. 2024; 5(1):201-216. https://doi.org/10.3390/dairy5010017
Chicago/Turabian StyleRossi, Chiara, Giampiero Grossi, Nicola Lacetera, and Andrea Vitali. 2024. "Carbon Footprint and Carbon Sink of a Local Italian Dairy Supply Chain" Dairy 5, no. 1: 201-216. https://doi.org/10.3390/dairy5010017