
Molecular Modeling Based on Time-Dependent Density Functional Theory (TD-DFT) Applied to the UV-Vis Spectra of Natural Compounds
 ,
,  , ,
, ,  and
and
Abstract
:
1. Introduction
2. Materials and Methods
2.1. Dataset
2.2. Computational Protocol
2.3. Experimental Protocol
3. Results and Discussion
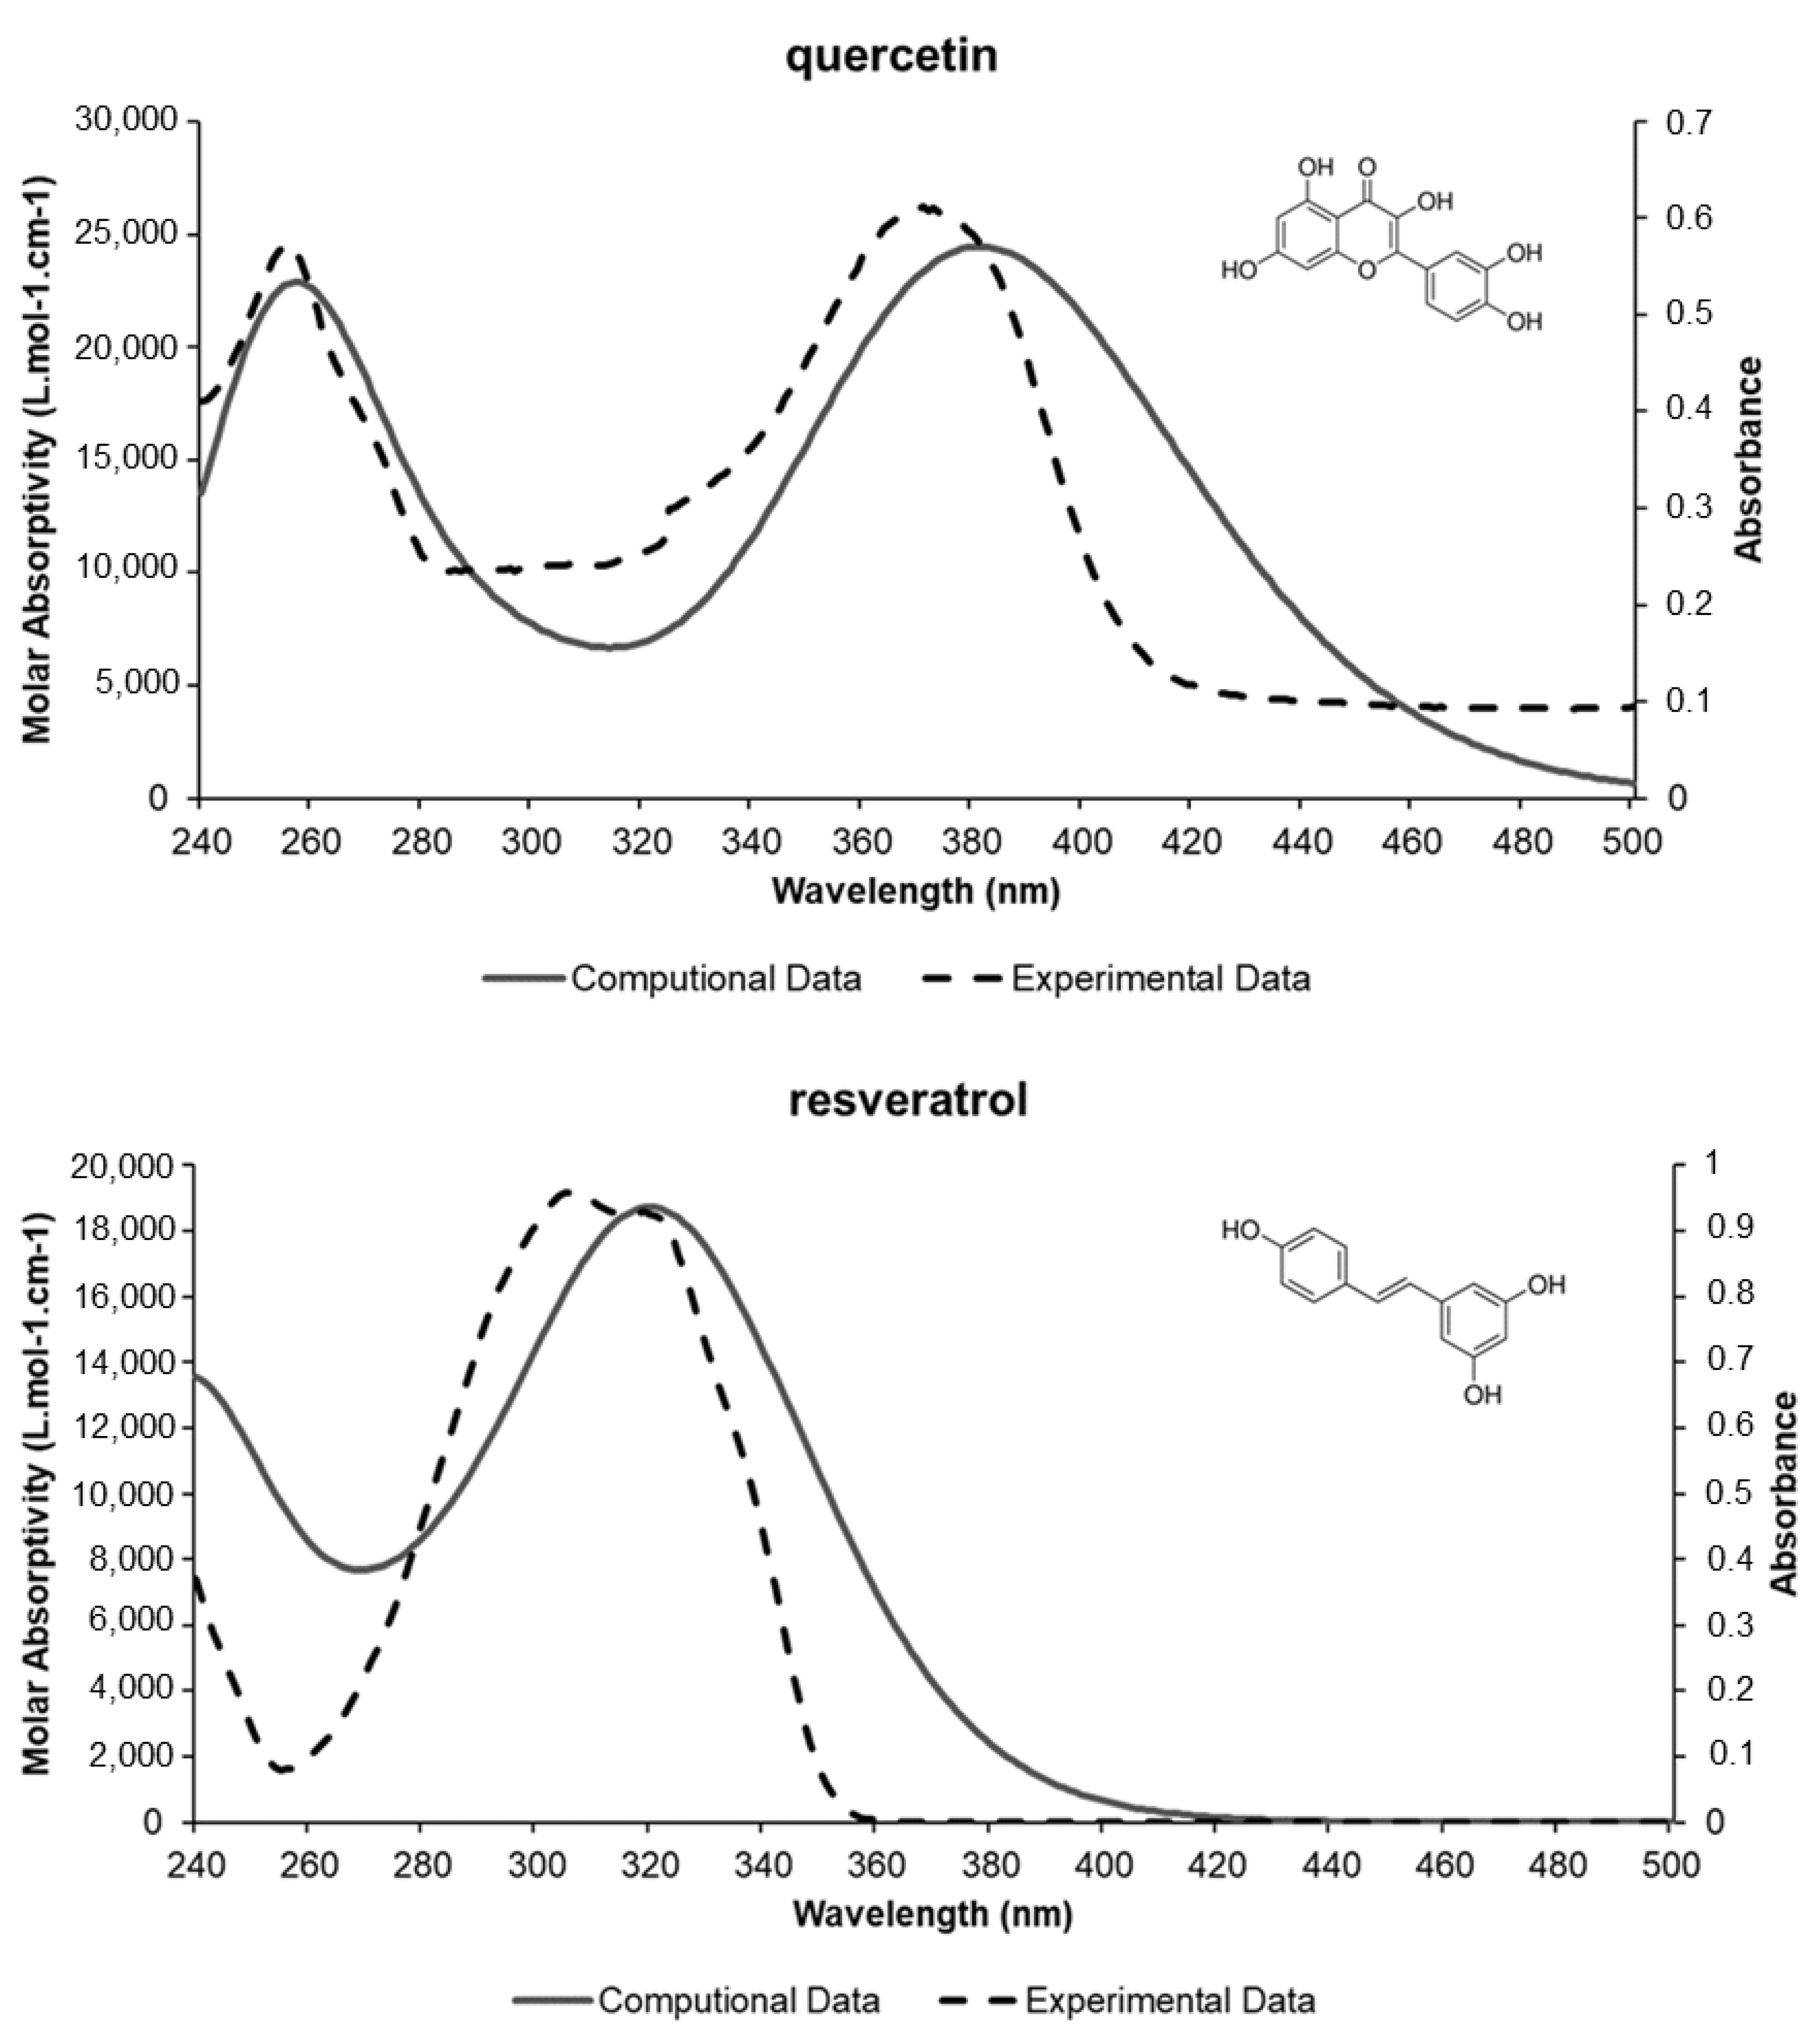
Experimental Validation
4. Conclusions
Author Contributions
Funding
Data Availability Statement
Acknowledgments
Conflicts of Interest
References
- Carr, S.; Smith, C.; Wernberg, J. Epidemiology and Risk Factors of Melanoma. Surg. Clin. N. Am. 2020, 100, 1–12. [Google Scholar] [CrossRef]
- Simões, M.C.F.; Sousa, J.J.S.; Pais, A.A.C.C. Skin cancer and new treatment perspectives: A review. Cancer Lett. 2015, 357, 8–42. [Google Scholar] [CrossRef] [PubMed]
- Leiter, U.; Keim, U.; Garbe, C. Epidemiology of Skin Cancer: Update 2019. Adv. Exp. Med. Biol. 2020, 1268, 123–139. [Google Scholar] [PubMed]
- Watson, M.; Holman, D.M.; Maguire-Eisen, M. Ultraviolet Radiation Exposure and Its Impact on Skin Cancer Risk. Semin. Oncol. Nurs. 2016, 32, 241–254. [Google Scholar] [CrossRef] [PubMed] [Green Version]
- de Araujo, T.S.; de Souza, S.O. Protetores Solares e os efeitos da radiação ultravioleta. Sci. Plena 2008, 4, 1–7. [Google Scholar]
- Guerra, K.C.; Zafar, N.; Crane, J.S. Skin Cancer Prevention. StatPearls 2021, 204, 87–93. [Google Scholar]
- Beani, J.-C. Ultraviolet A-induced DNA damage: Role in skin cancer. Bull. Acad. Natl. Med. 2014, 198, 273–295. [Google Scholar]
- Velasco, M.V.R.; Sarruf, F.D.; Salgado-Santos, I.M.N.; Haroutiounian-Filho, C.A.; Kaneko, T.M.; Baby, A.R. Broad-spectrum bioactive sunscreens. Int. J. Pharm. 2008, 363, 50–57. [Google Scholar] [CrossRef]
- Dutra, E.A.; Gonçalves da Costa e Oliveira, D.A.; Kedor-Hackmann, E.R.M.; Miritello Santoro, M.I.R. Determination of sun protection factor (SPF) of sunscreens by ultraviolet spectrophotometry. Rev. Bras. Ciências Farm. 2004, 40, 381–385. [Google Scholar] [CrossRef] [Green Version]
- Gies, P.; Van Deventer, E.; Green, A.C.; Sinclair, C.; Tinker, R. Review of the Global Solar UV Index 2015 Workshop Report. Health Phys. 2018, 114, 84. [Google Scholar] [CrossRef] [Green Version]
- Flor, J.; Davolos, M.R.; Correa, M.A. Protetores solares. Quim. Nova 2007, 30, 153–158. [Google Scholar] [CrossRef] [Green Version]
- Schneider, S.L.; Lim, H.W. A review of inorganic UV filters zinc oxide and titanium dioxide. Photodermatol. Photoimmunol. Photomed. 2019, 35, 442–446. [Google Scholar] [CrossRef] [Green Version]
- Suozzi, K.; Turban, J.; Girardi, M. Focus: Skin: Cutaneous Photoprotection: A Review of the Current Status and Evolving Strategies. Yale J. Biol. Med. 2020, 93, 55. [Google Scholar]
- Garcia, R.D.; Maltarollo, V.G.; Honório, K.M.; Trossini, G.H.G. Benchmark studies of UV–vis spectra simulation for cinnamates with UV filter profile. J. Mol. Model 2015, 21, 150. [Google Scholar] [CrossRef]
- Corrêa, B.A.M.; Gonçalves, A.S.; de Souza, A.M.T.; Freitas, C.A.; Cabral, L.M.; Albuquerque, M.G.; Castro, H.C.; dos Santos, E.P.; Rodrigues, C.R. Molecular modeling studies of the structural, electronic, and UV absorption properties of benzophenone derivatives. J. Phys. Chem. 2012, 116, 10927–10933. [Google Scholar] [CrossRef]
- de Oliveira, A.M. Introdução à Modelagem Molecular para Química, Engenharia e Biomédicas; Editora Appris: Curitiba, Brazil, 2018; Volume 2, pp. 12–54. [Google Scholar]
- Santos, C.B.; Lobato, C.C.; de Sousa, M.A.; Macêdo, W.J.; Carvalho, J.C. Molecular modeling: Origin, fundamental concepts and applications using structure-activity relationship and quantitative structure-activity relationship. Rev. Theor. Sci. 2014, 2, 91–115. [Google Scholar] [CrossRef]
- Pankin, D.; Smirnov, M.; Povolotckaia, A.; Povolotskiy, A.; Borisov, E.; Moskovskiy, M.; Gulyaev, A.; Gerasimenko, S.; Aksenov, A.; Litvinov, M.; et al. DFT Modelling of Molecular Structure, Vibrational and UV-Vis Absorption Spectra of T-2 Toxin and 3-Deacetylcalonectrin. Materials 2022, 15, 649. [Google Scholar] [CrossRef]
- Govindarajan, M.; Karabacak, M.; Suvitha, A.; Periandy, S. FT-IR, FT-Raman, ab initio, HF and DFT studies, NBO, HOMO–LUMO and electronic structure calculations on 4-chloro-3-nitrotoluene. Spectrochim. Acta Part A Mol. Biomol. Spectrosc. 2012, 89, 137–148. [Google Scholar] [CrossRef]
- Sant’Anna, C.M.R. Molecular modeling methods in the study and design of bioactive compounds: An introduction. Rev. Virtual Química 2009, 1, 5–20. [Google Scholar] [CrossRef]
- Ye, N.; Yang, Z.; Liu, Y. Applications of density functional theory in COVID-19 drug modeling. Drug Discov. Today 2021, 4, 93–97. [Google Scholar] [CrossRef]
- Adamo, C.; Jacquemin, D. The calculations of excited-state properties with time-dependent density functional theory. Chem. Soc. Rev. 2013, 42, 845–856. [Google Scholar] [CrossRef]
- Townsend, P.A.; Grayson, M.N. Density Functional Theory in the Prediction of Mutagenicity: A Perspective. Chem. Res. Toxicol. 2020, 34, 179–188. [Google Scholar] [CrossRef] [PubMed]
- Ji, F.; Guo, Y.; Wang, M.; Wang, C.; Wu, Z.; Wang, S.; Wang, H.; Feng, X.; Zhao, G. New insights into ESIPT mechanism of three sunscreen compounds in solution: A combined experimental and theoretical study. Colloids Surf. B Biointerfaces 2021, 207, 2039. [Google Scholar] [CrossRef] [PubMed]
- Morocho-Jácome, A.L.; Freire, T.B.; Oliveira, A.C.; Almeida, T.S.; Rosado, C.; Velasco, M.V.R.; Baby, A.R. In vivo SPF from multifunctional sunscreen systems developed with natural compounds—A review. J. Cosmet. Dermatol. 2021, 20, 729–737. [Google Scholar] [CrossRef] [PubMed]
- Aburjai, T.; Tayseer, I. Green sunscreens. In Sunscreens: Source, Formulations, Efficacy and Recommendations; Rastogi, R.P., Ed.; Nova: Amman, Jordan, 2019; pp. 245–276. [Google Scholar]
- Yilmaz, Y.; Toledo, R.T. Major Flavonoids in Grape Seeds and Skins: Antioxidant Capacity of Catechin, Epicatechin, and Gallic Acid. J. Agric. Food Chem. 2004, 52, 255–260. [Google Scholar] [CrossRef] [PubMed]
- Nichols, J.A.; Katiyar, S.K. Skin photoprotection by natural polyphenols: Anti-inflammatory, antioxidant and DNA repair mechanisms. Arch. Dermatol. Res. 2010, 302, 71–83. [Google Scholar] [CrossRef] [Green Version]
- Mishra, A.; Chattopadhyay, P. Herbal cosmeceuticals for photoprotection from ultraviolet B radiation: A review. Trop. J. Pharm. Res. 2011, 10, 351–360. [Google Scholar] [CrossRef] [Green Version]
- Catelan, T.B.S.; Gaiola, L.; Duarte, B.F.; Cardoso, C.A.L. Evaluation of the in vitro photoprotective potential of ethanolic extracts of four species of the genus Campomanesia. J. Photochem. Photobiol. B Biol. 2019, 197, 111–500. [Google Scholar] [CrossRef] [PubMed]
- Phadungsaksawasdi, P.; Sirithanabadeekul, P. Ultraviolet filters in sunscreen products labeled for use in children and for sensitive skin. Pediatr. Dermatol. 2020, 37, 632–636. [Google Scholar] [CrossRef]
- Tsui, M.M.; Chen, L.; He, T.; Wang, Q.; Hu, C.; Lam, J.C.; Lam, P.K. Organic ultraviolet (UV) filters in the South China sea coastal region: Environmental occurrence, toxicological effects and risk assessment. Ecotoxicol. Environ. Saf. 2019, 181, 26–33. [Google Scholar] [CrossRef]
- Frisch, M.; Trucks, G.; Schlegel, H.E.; Scuseria, G.W.; Robb, M.A.; Cheeseman, J.R.; Montgomery, J.A., Jr.; Vreven, T.K.; Kudin, K.N.; Burant, J.C.; et al. Gaussian 03, Revision C. 02; Gaussian, Inc.: Wallingford, CT, USA, 2004. [Google Scholar]
- Spartan’14; Wavefunction, Inc.: Irvine, CA, USA, 2013.
- Becke, A.D. Density-functional exchange-energy approximation with correct asymptotic behavior. Phys. Rev. A Gen. Phys. 1988, 38, 3098–3100. [Google Scholar] [CrossRef] [PubMed]
- Miehlich, B.; Savin, A.; Stoll, H.; Preuss, H. Results obtained with the correlation energy density functionals of becke and Lee, Yang and Parr. Chem. Phys. Lett. 1989, 157, 200–206. [Google Scholar]
- Lee, C.; Yang, W.; Parr, R.G. Development of the Colle-Salvetti correlation-energy formula into a functional of the electron density. Phys. Rev. B Condens. Matter. 1988, 37, 785–789. [Google Scholar] [CrossRef] [Green Version]
- Frisch, M.J.; Trucks, G.W.; Schlegel, H.B.; Scuseria, G.E.; Robb, M.A.; Cheeseman, J.R.; Scalmani, G.; Barone, V.; Mennucci, B.; Petersson, G.; et al. Gaussian 09, Revision D. 01; Gaussian, Inc.: Wallingford, CT, USA, 2009. [Google Scholar]
- Trossini, G.H.G.; Maltarollo, V.G.; Garcia, R.D.; Pinto, C.A.S.O.; Velasco, M.V.R.; Honorio, K.; Baby, A. Theoretical study of tautomers and photoisomers of avobenzone by DFT methods. J. Mol. Model. 2015, 8, 104–107. [Google Scholar] [CrossRef]
- Carvalho, I.; Pupo, M.T.; Borges, Á.D.L.; Bernardes, L.S.C. Introdução a modelagem molecular de fármacos no curso experimental de química farmacêutica. Quim. Nova. 2003, 26, 428–438. [Google Scholar] [CrossRef]
- Basavaraj, S.; Hanagodimath, S.M.H. UV-Visible Spectra, HOMO-LUMO Studies on Coumarin Derivative Using Gaussian Software. AIP Conf. Proc. 2020. Available online: https://www.researchgate.net/profile/Shivaleela-Basavaraj/publication/344597213_UV-Visible_Spectra_HOMO-LUMO_Studies_on_Coumarin_Derivative_Using_Gaussian_Software/links/5f833eed458515b7cf79d62f/UV-Visible-Spectra-HOMO-LUMO-Studies-on-Coumarin-Derivative-Using-Gaussian-Software.pdf (accessed on 2 July 2021).
- Minenkov, Y.; Sharapa, D.I.; Cavallo, L. Application of Semiempirical Methods to Transition Metal Complexes: Fast Results but Hard-to-Predict Accuracy. J. Chem. 2018, 14, 3428–3439. [Google Scholar] [CrossRef]
- Sikorska, C.; Puzyn, T. The performance of selected semi-empirical and DFT methods in studying C60 fullerene derivatives. Nanotechnology 2015, 26, 455702. [Google Scholar] [CrossRef]
- Christina Jebapriya, J.; Christian Prasana, J.; Muthu, S.; Fathima Rizwana, B. Spectroscopic (FT-IR and FT-Raman), quantum computational (DFT) and molecular docking studies on 2(E)-(4-N,N-dimethylaminobenzylidene)-5-methylcyclohexanone. Mater. Today Proc. 2022, 50, 2695–2702. [Google Scholar] [CrossRef]
- Rad, A.S.; Ardjmand, M.; Esfahani, M.R.; Khodashenas, B. DFT calculations towards the geometry optimization, electronic structure, infrared spectroscopy and UV–vis analyses of Favipiravir adsorption on the first-row transition metals doped fullerenes; a new strategy for COVID-19 therapy. Spectrochim. Acta Part A Mol. Biomol. Spectrosc. 2021, 247, 119082. [Google Scholar] [CrossRef]
- Cornard, J.P.; Dangleterre, L.; Lapouge, C. Computational and Spectroscopic Characterization of the Molecular and Electronic Structure of the Pb(II)−Quercetin Complex. J. Phys. Chem. 2005, 109, 10044–10051. [Google Scholar] [CrossRef]
- Martin, C.; Bruneel, J.-L.; Castet, F.; Fritsch, A.; Teissedre, P.-L.; Jourdes, M.; Guillaume, F. Spectroscopic and theoretical investigations of phenolic acids in white wines. Food Chem. 2017, 221, 568–575. [Google Scholar] [CrossRef]
- Millot, M.; Di Meo, F.; Tomasi, S.; Boustie, J.; Trouillas, P. Photoprotective capacities of lichen metabolites: A joint theoretical and experimental study. J. Photochem. Photobiol. B Biol. 2012, 111, 17–26. [Google Scholar] [CrossRef]
- Ochterski, J.W. Vibrational Analysis in Gaussian. 2020. Available online: https://gaussian.com/vib/ (accessed on 2 July 2021).
- Antunes-Ricardo, M.; Gutiérrez-Uribe, J.A.; Guajardo-Flores, D. Extraction of isorhamnetin conjugates from Opuntia ficus-indica (L.) Mill using supercritical fluids. J. Supercrit. Fluids 2017, 119, 58–63. [Google Scholar] [CrossRef]
- Dharmender, R.; Madhavi, T.; Reena, A.; Sheetal, A. Simultaneous Quantification of Bergenin, (+)-Catechin, Gallicin and Gallic acid; and Quantification of β-Sitosterol using HPTLC from Bergenia ciliata (Haw.) Sternb. Forma ligulata Yeo (Pasanbheda). Pharm. Anal. Acta 2010, 1, 1000104. [Google Scholar] [CrossRef] [Green Version]
- Song, H.; Chen, C.; Zhao, S.; Ge, F.; Liu, D.; Shi, D.; Zhang, T. Interaction of gallic acid with trypsin analyzed by spectroscopy. J. Food Drug Anal. 2015, 23, 234–242. [Google Scholar] [CrossRef]
- Burmistrova, N.A.; Krivets, O.O.; Monakhova, Y.B. UV Spectroscopic Determination of Aloin in Aloe vera (A. vera) Samples Based on Chemometric Data Processing. J. Anal. Chem. 2020, 75, 1137–1142. [Google Scholar] [CrossRef]
- Logaranjan, K.; Devasena, T.; Pandian, K. Quantitative Detection of Aloin and Related Compounds Present in Herbal Products and Aloe vera Plant Extract Using HPLC Method. Am. J. Anal. Chem. 2013, 4, 600–605. [Google Scholar] [CrossRef] [Green Version]
- Ibrahim, Y.M.; Musa, A.; Yakasai, I.A. Spectrophotometric method for determination of catechins in green tea and herbal formulations. Niger. J. Pharm. Sci. 2017, 16, 25–30. [Google Scholar]
- Golonka, I.; Wilk, S.; Musiał, W. The Influence of UV Radiation on the Degradation of Pharmaceutical Formulations Containing Quercetin. Molecules 2020, 25, 5454. [Google Scholar] [CrossRef]
- Réka-Anita, D.; Chis, V. Conformational Space and Electronic Absorption Properties of the Two Isomers of Resveratrol. Stud. Univ. Babeș-Bolyai Phys. 2018, 62, 52–57. [Google Scholar]
- Sheikhi, M.; Shahab, S.; Khaleghian, M.; Hajikolaee, F.H.; Balakhanava, I.; Alnajjar, R. Adsorption properties of the molecule resveratrol on CNT(8,0-10) nanotube: Geometry optimization, molecular structure, spectroscopic (NMR, UV/Vis, excited state), FMO, MEP and HOMO-LUMO investigations. J. Mol. Struct. 2018, 1160, 479–487. [Google Scholar] [CrossRef]


| Compound | Structure |
|---|---|
| 3-O-methylquercetin |  |
| gallic acid |  |
| aloin |  |
| catechin |  |
| quercetin |  |
| resveratrol |  |
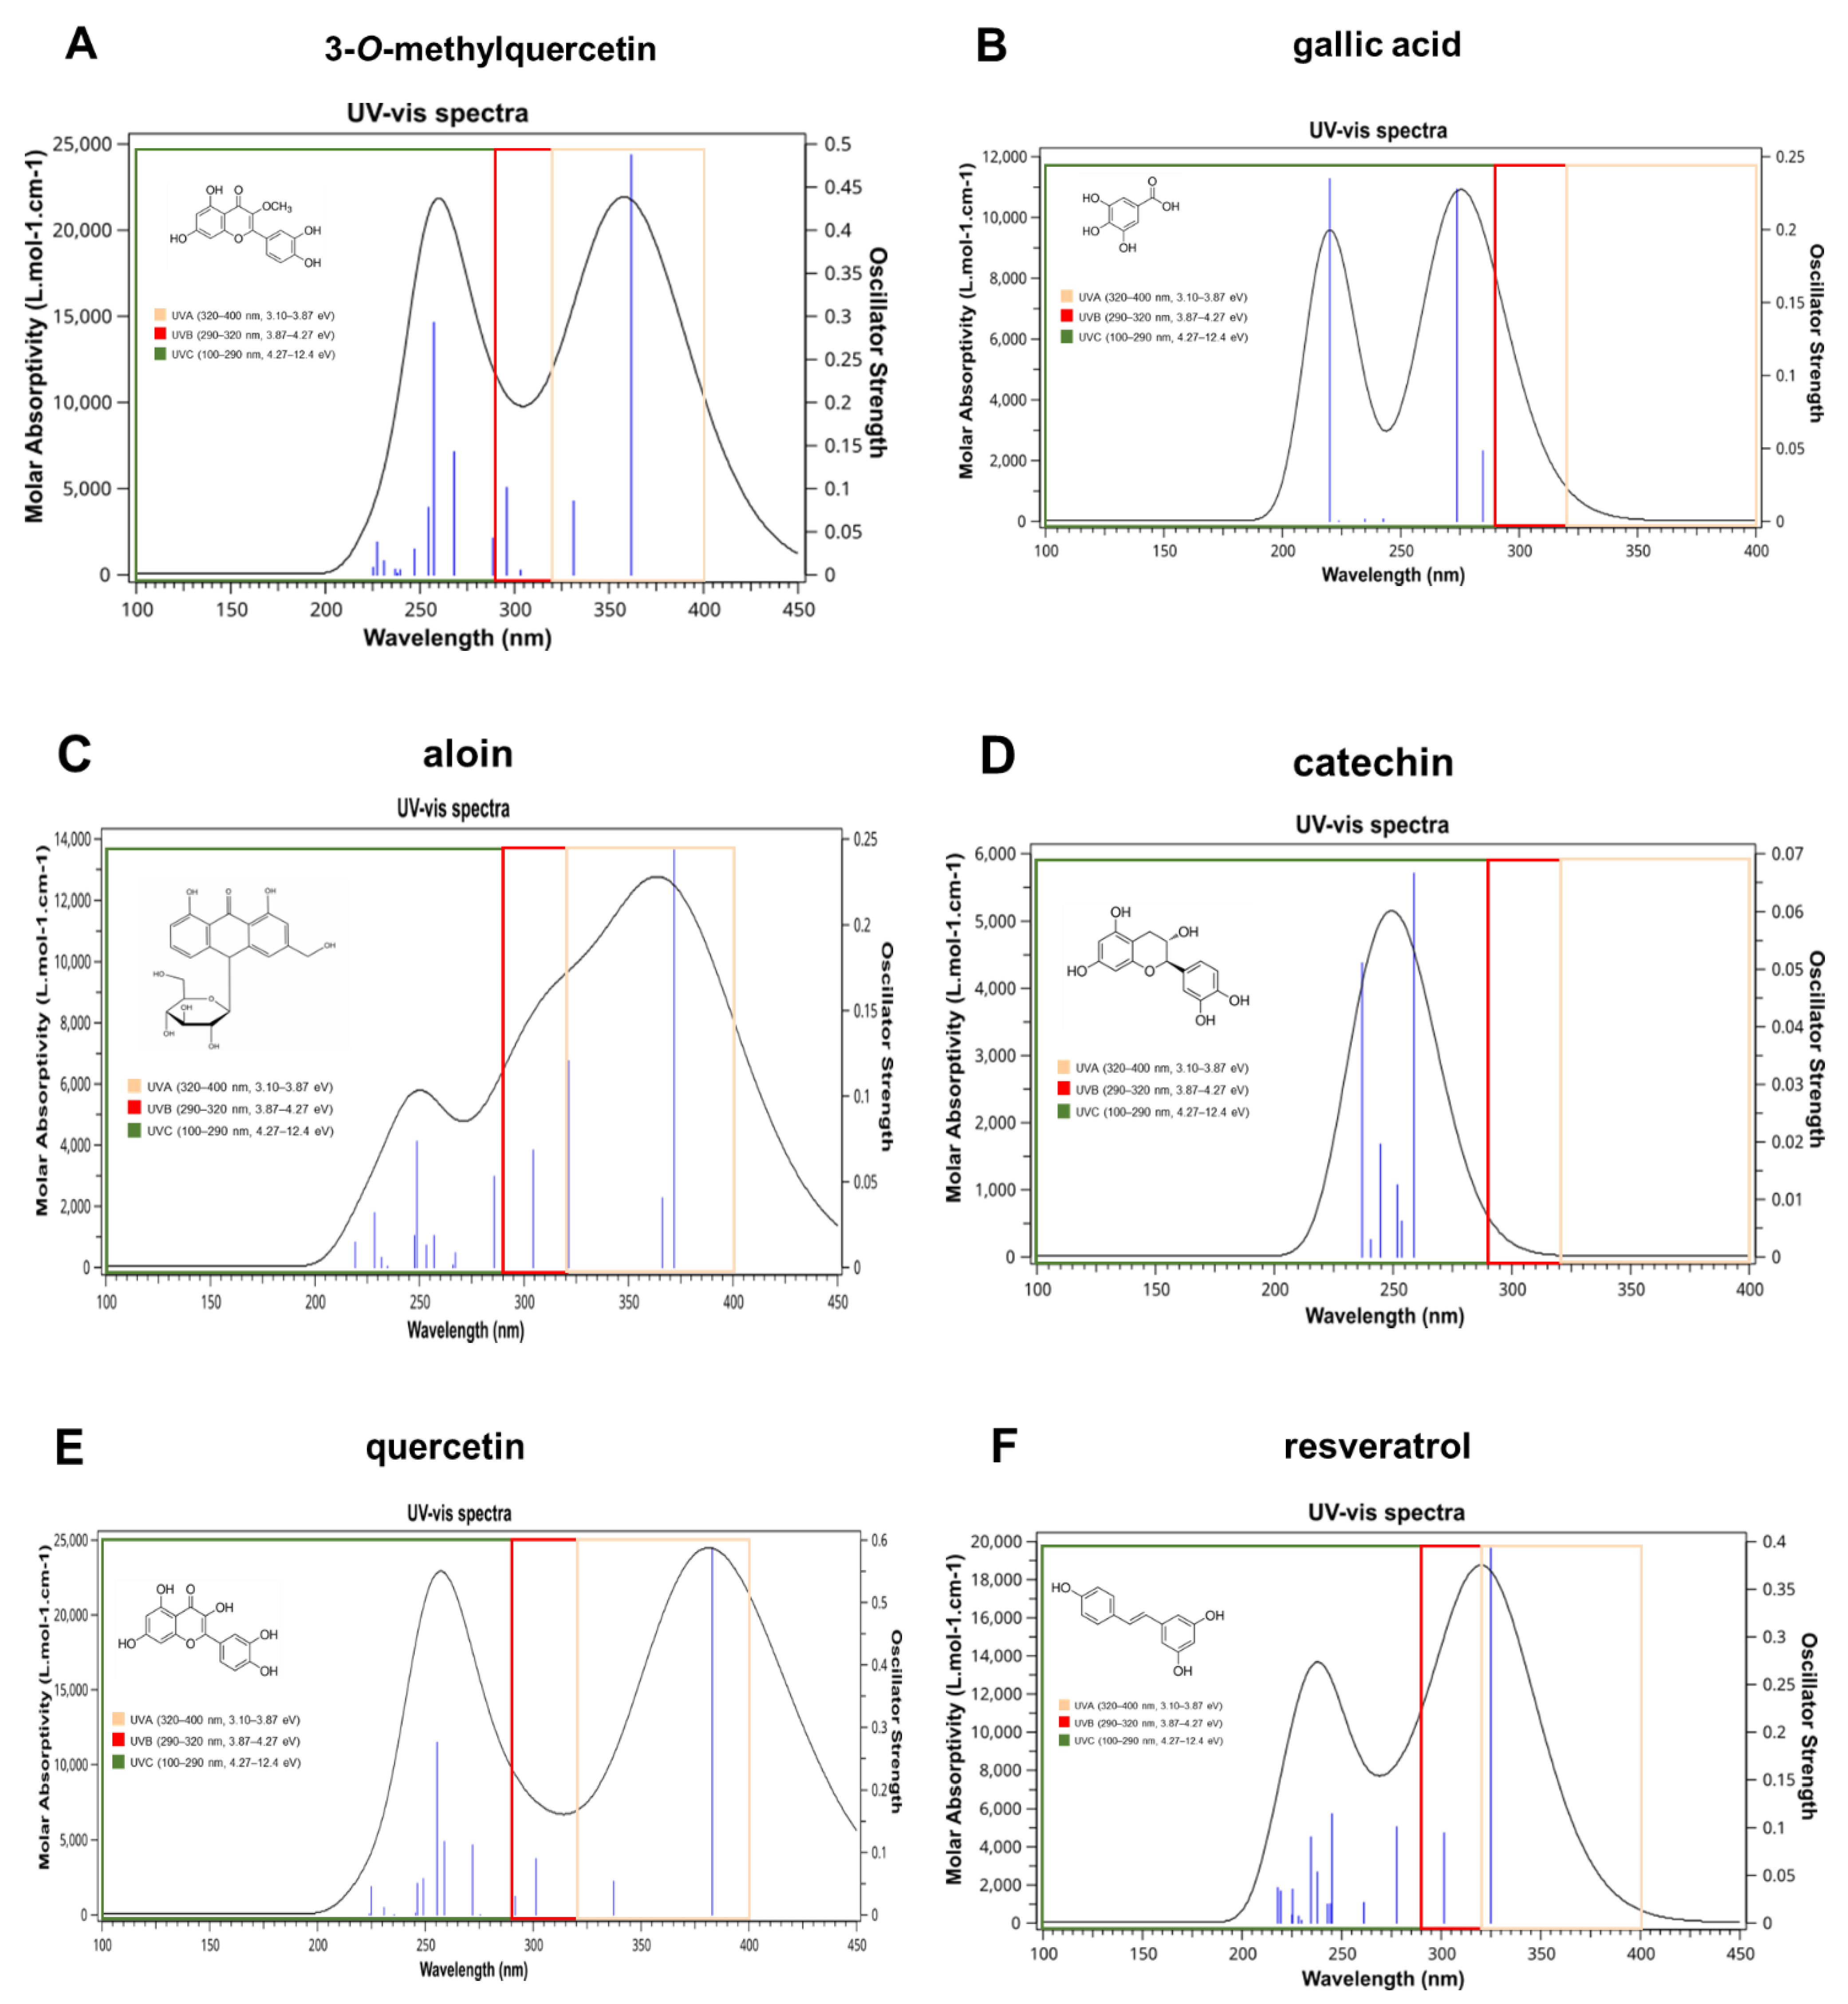
| Compound | λmax (nm) Theoretical | λmax Experimental (Literature) | % Error |
|---|---|---|---|
| 3-O-metilquercetina | 361.77 | 358 nm | 1 |
| gallic acid | 284.74 | 290 nm | 1.8 |
| aloin | 371.79 | 353 nm | 5 |
| catechin | 258.74 | 274 nm | 5.8 |
| quercetin | 383.01 | 375 nm | 2 |
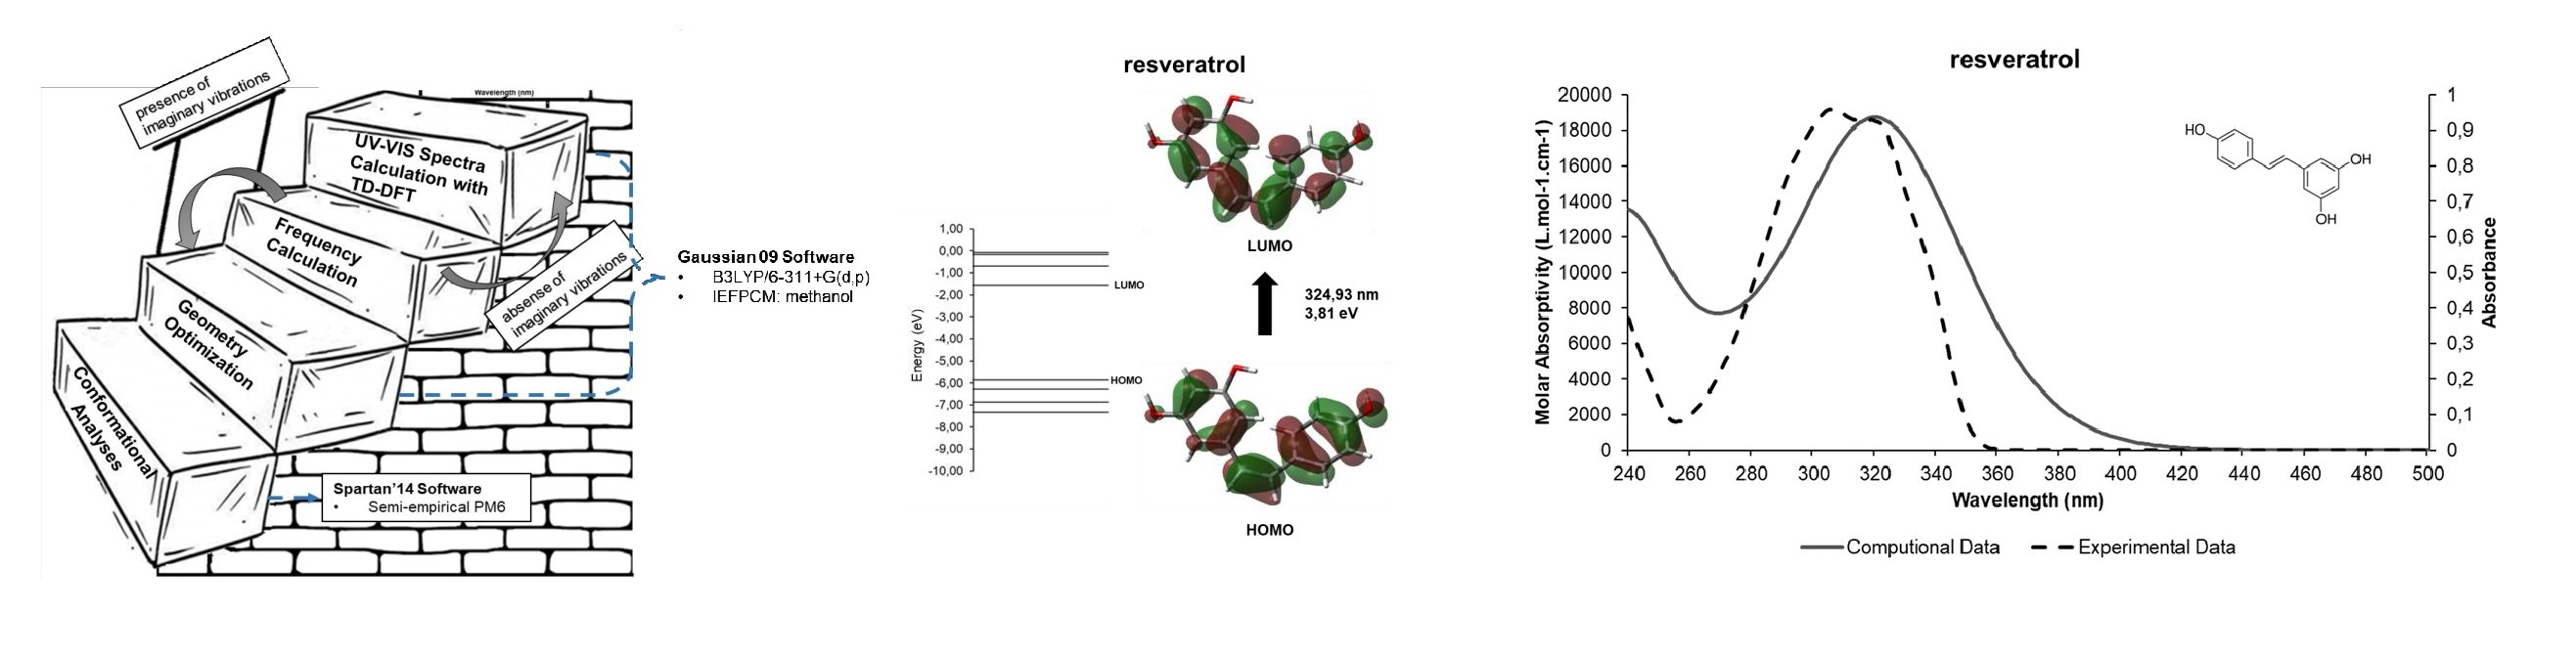
| resveratrol | 324.93 | 307 nm | 5.5 |
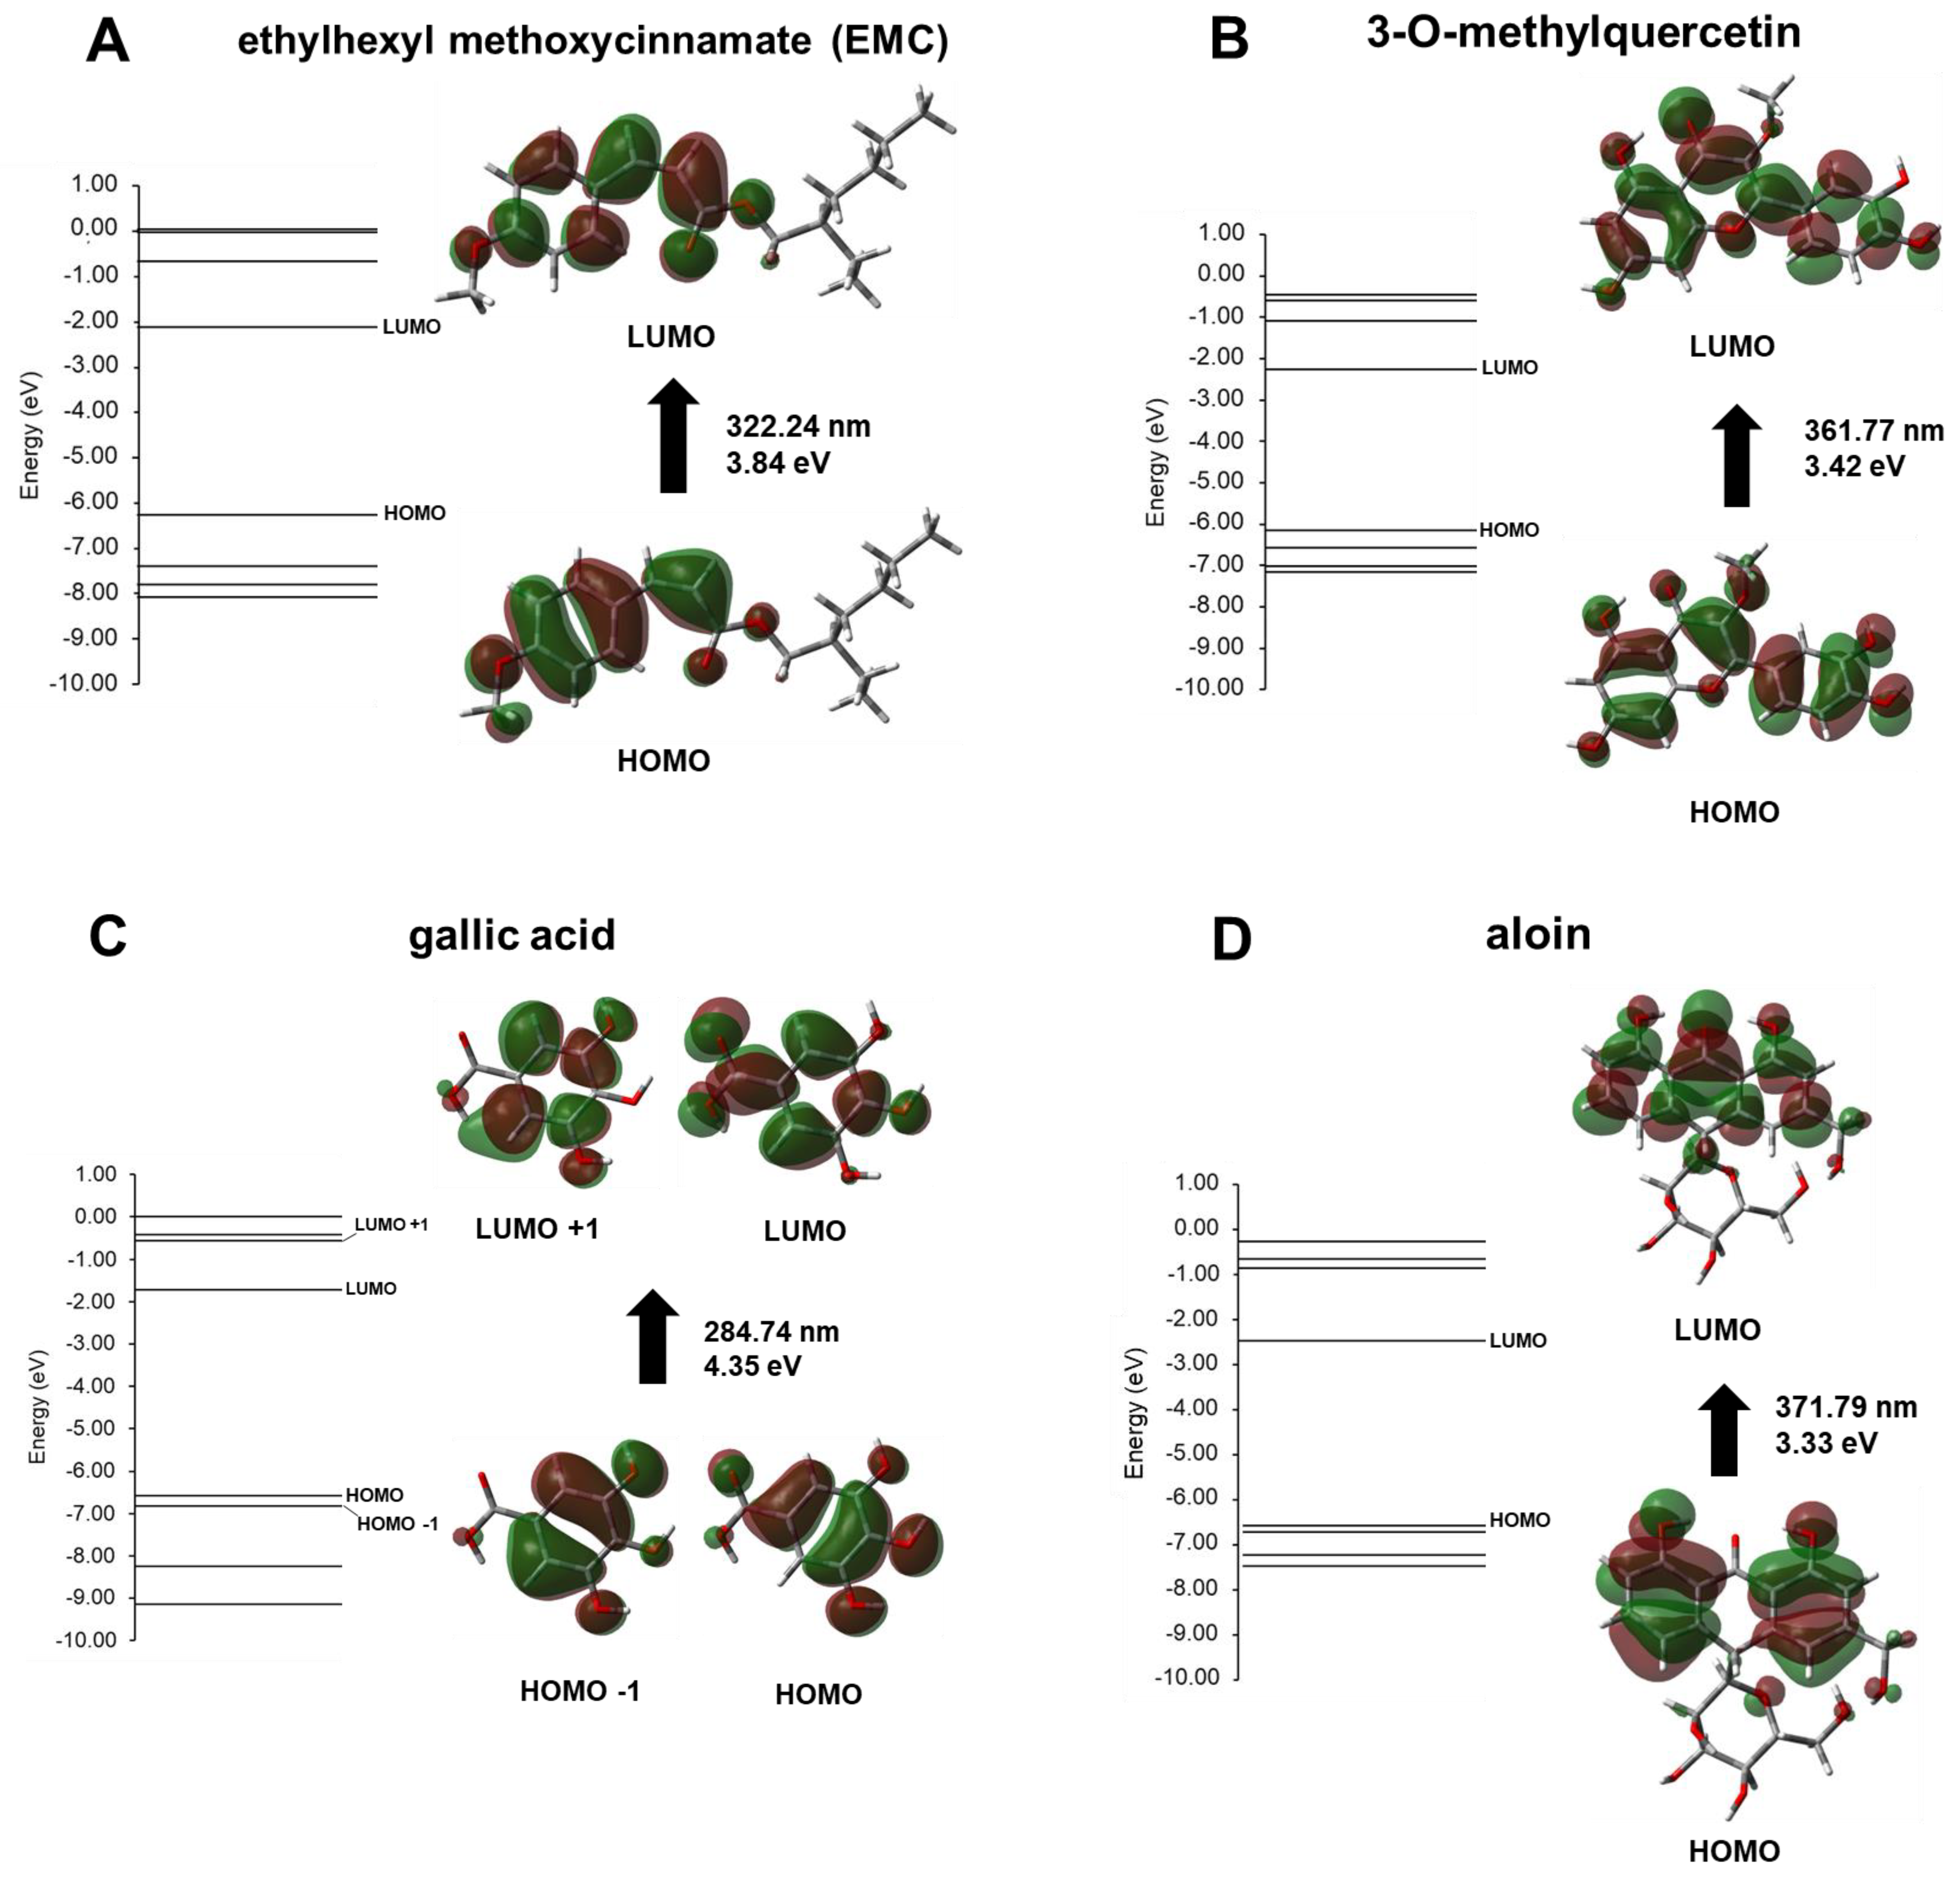
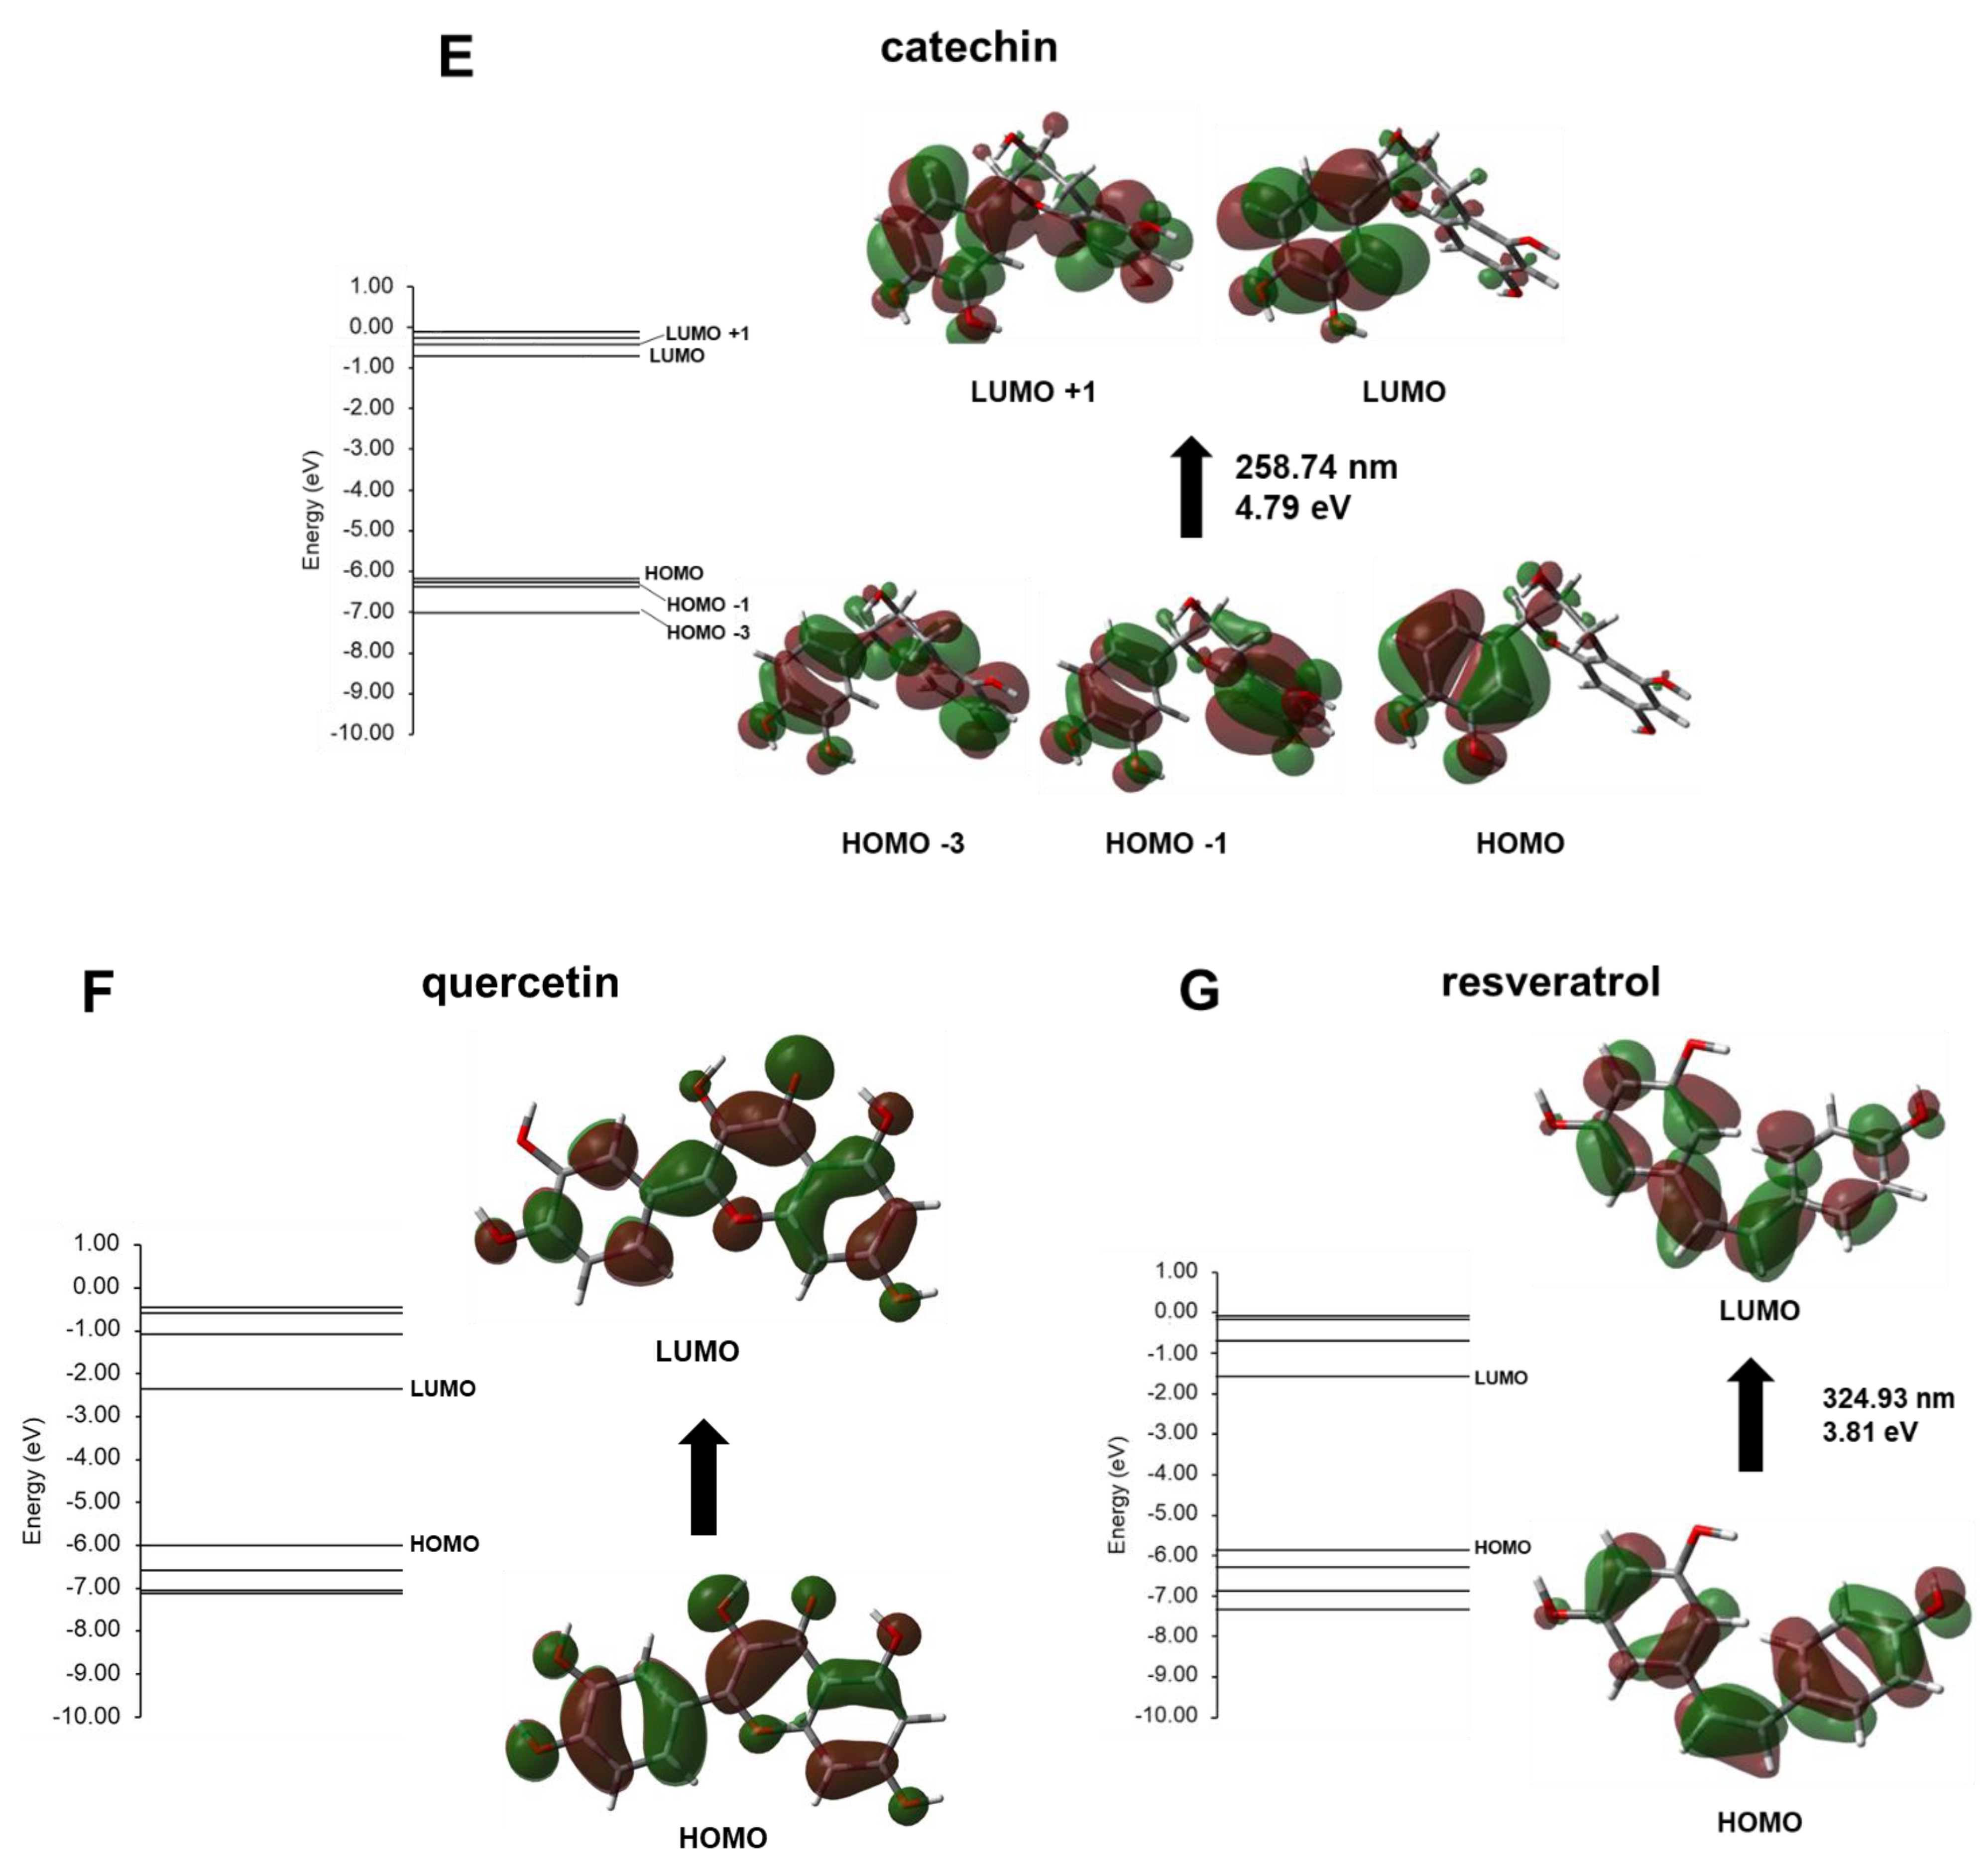
| Compound | λmax (nm) | Energy (eV) | Electronic Transition Contribution (%) |
|---|---|---|---|
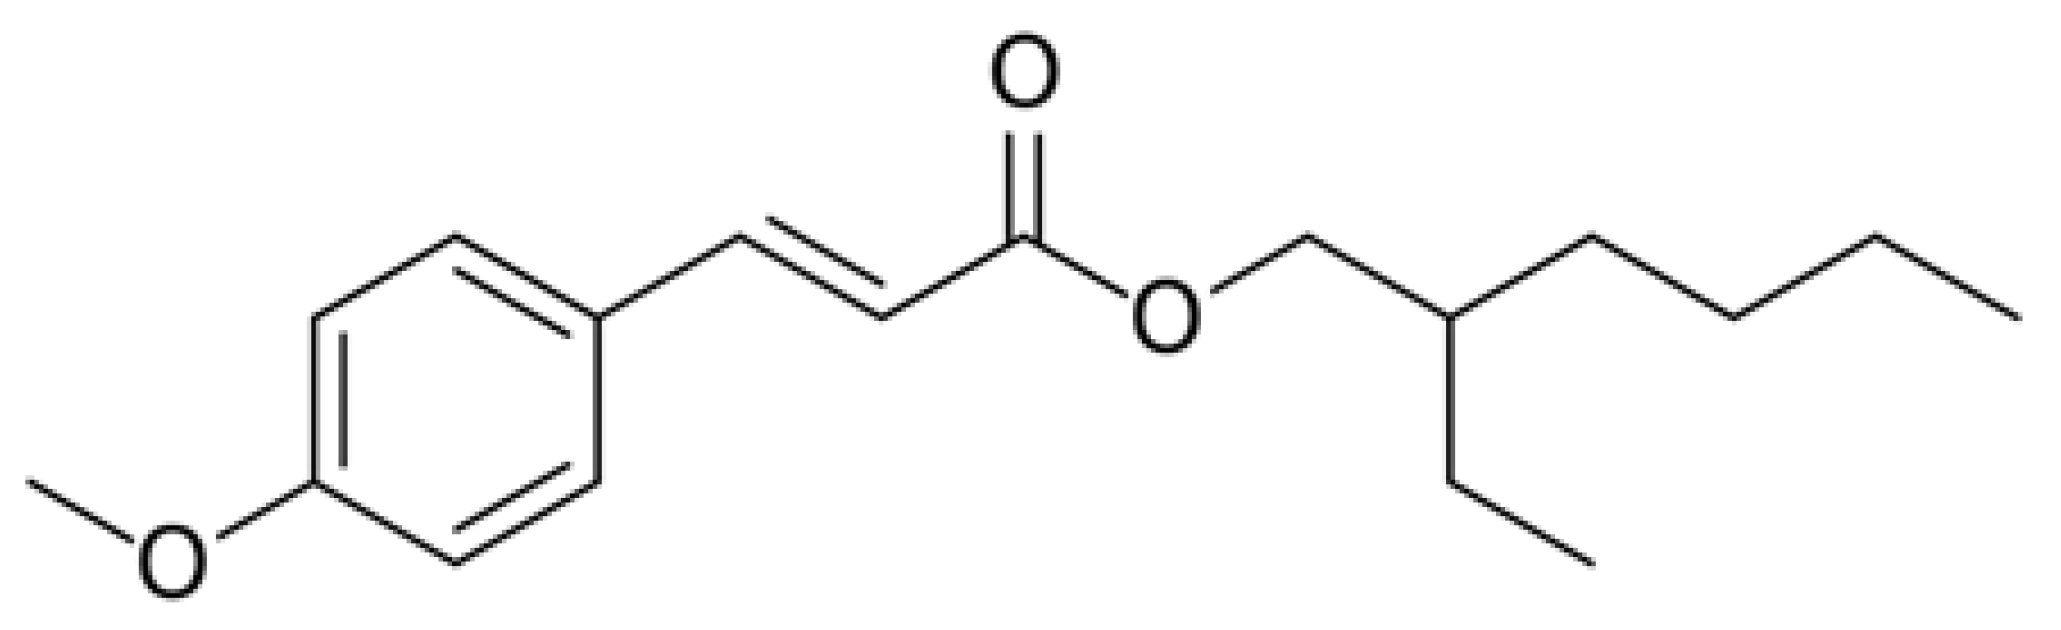
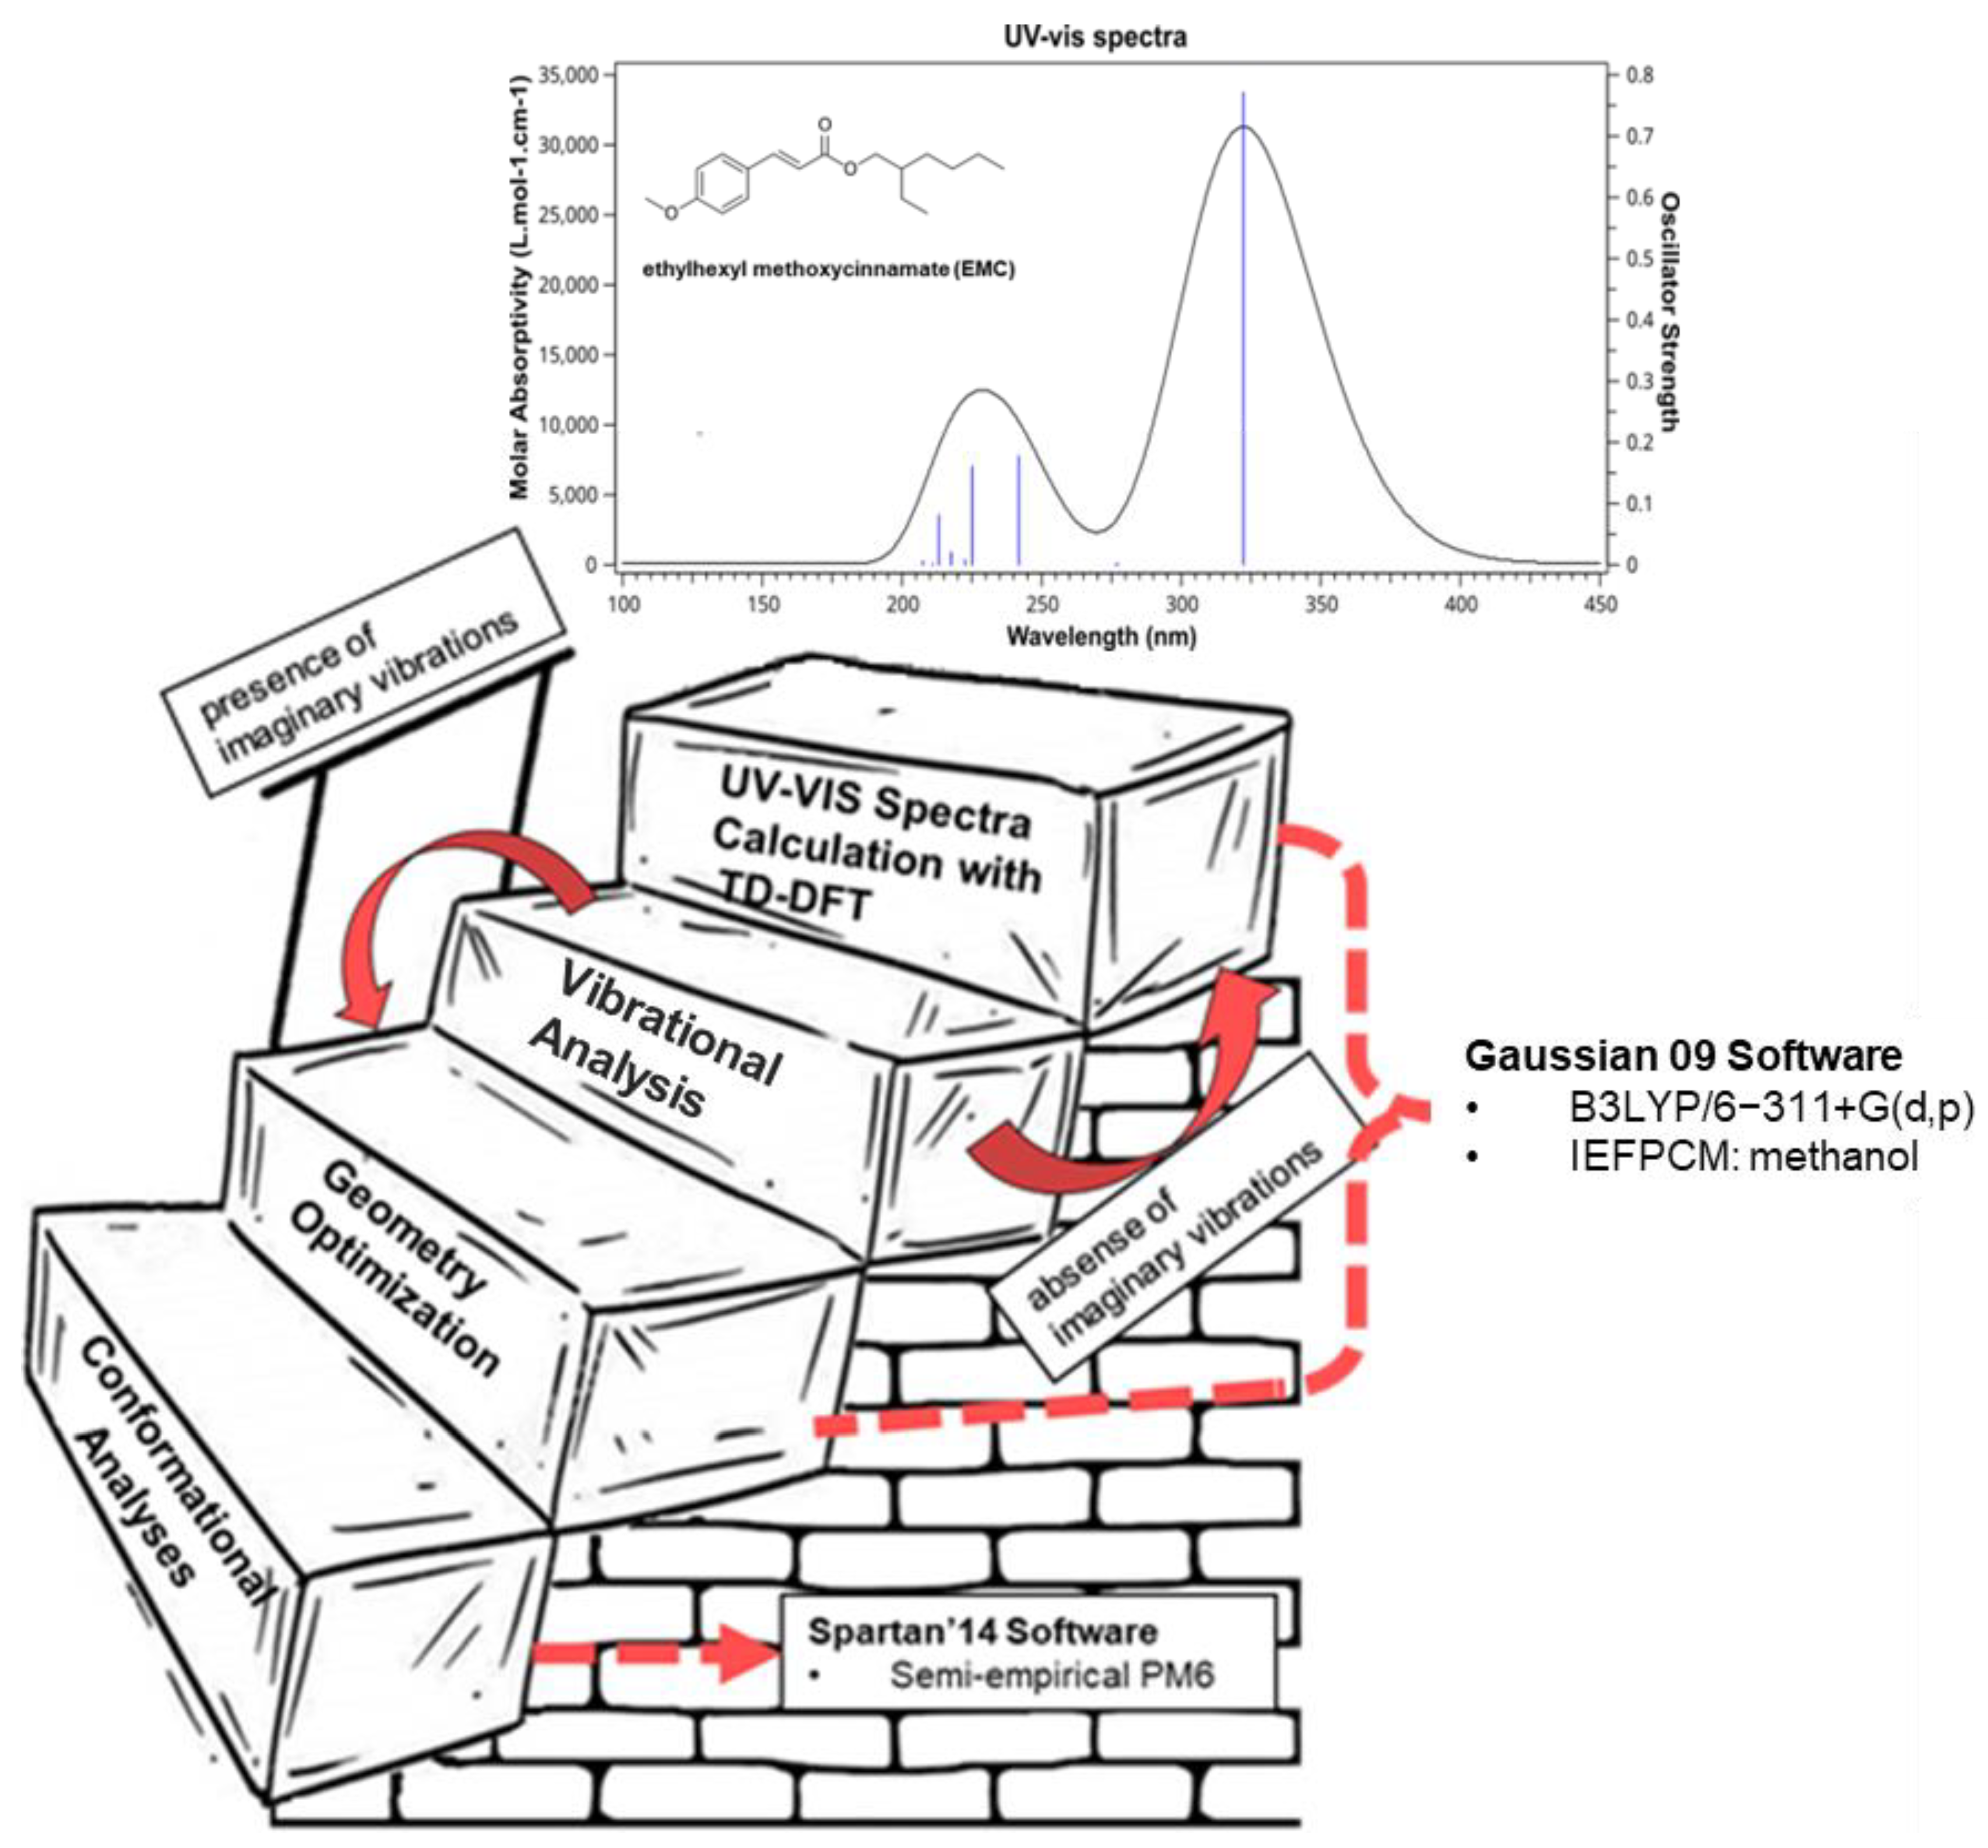
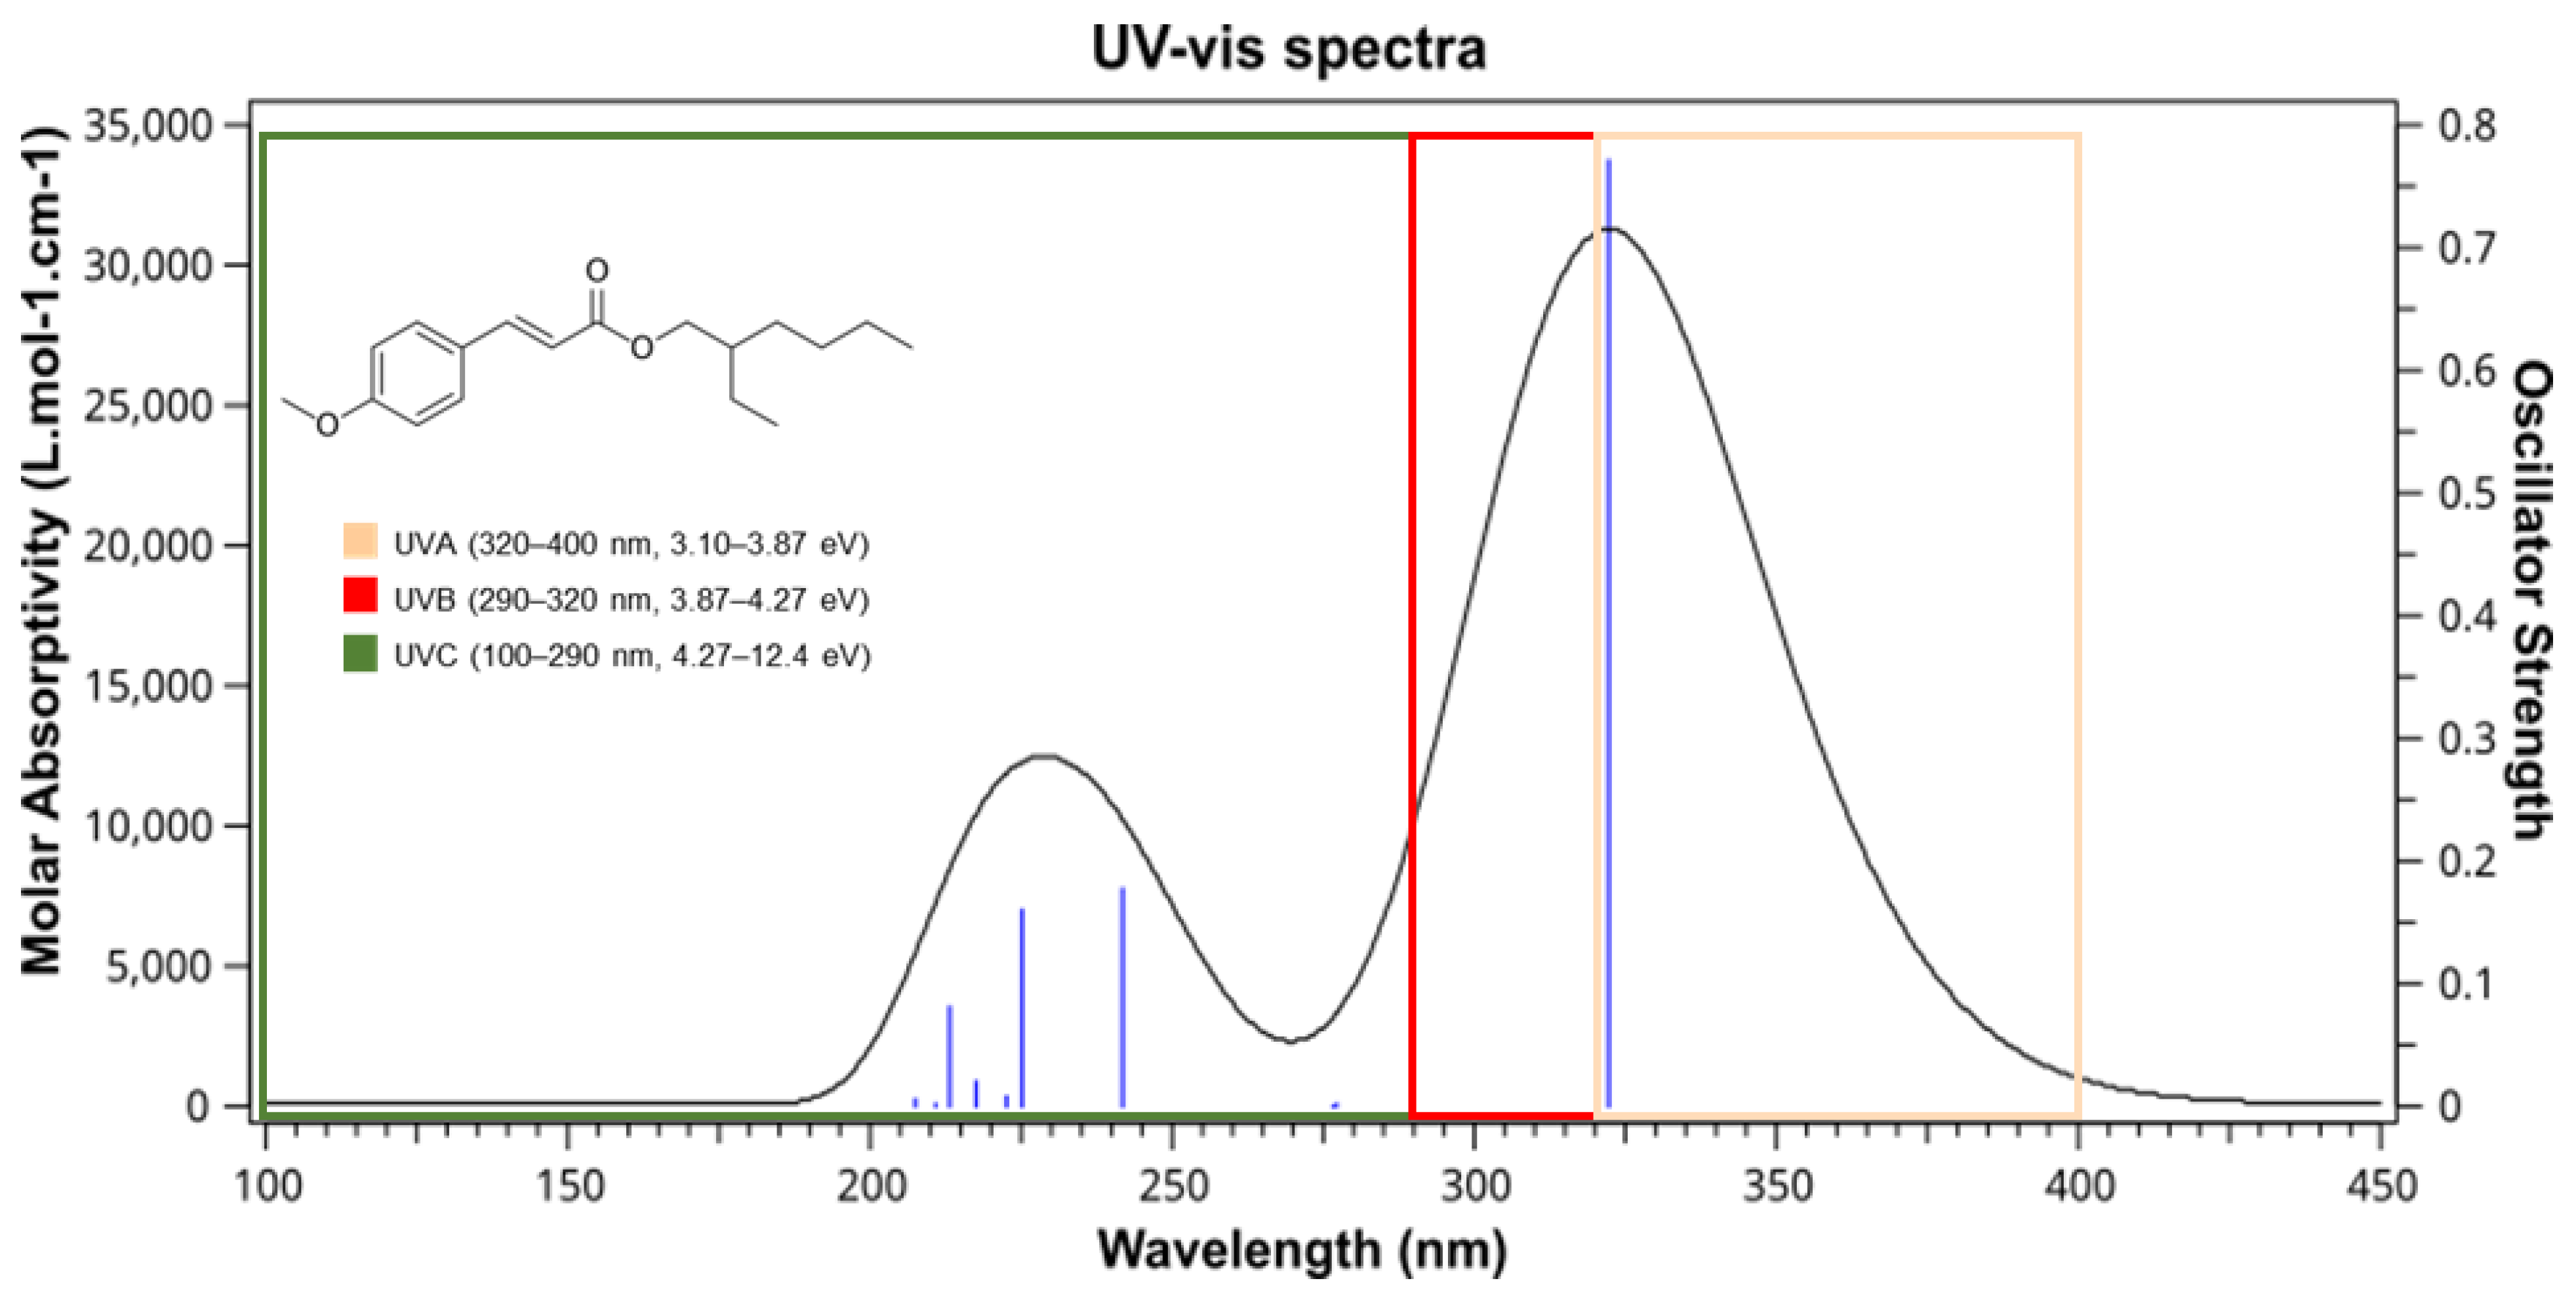
| ethylhexyl methoxycinnamate (EMC) | 322.24 | 3.84 | H → L (+99%) |
| 3-O-methylquercetin | 361.77 | 3.42 | H → L (+93%) |
| gallic acid | 284.74 | 4.35 | H-1→ L (+62%) H → L (+27%) H → L+1 (+9%) |
| aloin | 371.79 | 3.33 | H → L (+98%) |
| catechin | 258.74 | 4.79 | H → L (+74%) H-1 → L (+9%) H-3→ L+1 (+7%) |
| quercetin | 383.01 | 3.24 | H → L (+96%) |
| resveratrol | 324.93 | 3.81 | H → L (+97%) |
Disclaimer/Publisher’s Note: The statements, opinions and data contained in all publications are solely those of the individual author(s) and contributor(s) and not of MDPI and/or the editor(s). MDPI and/or the editor(s) disclaim responsibility for any injury to people or property resulting from any ideas, methods, instructions or products referred to in the content. |
© 2022 by the authors. Licensee MDPI, Basel, Switzerland. This article is an open access article distributed under the terms and conditions of the Creative Commons Attribution (CC BY) license (https://creativecommons.org/licenses/by/4.0/).
Share and Cite
Anhaia-Machado, J.O.; Soares, A.C.G.; de Oliveira Pinto, C.A.S.; Barrera, A.I.Á.; Baby, A.R.; Trossini, G.H.G. Molecular Modeling Based on Time-Dependent Density Functional Theory (TD-DFT) Applied to the UV-Vis Spectra of Natural Compounds. Chemistry 2023, 5, 41-53. https://doi.org/10.3390/chemistry5010004
Anhaia-Machado JO, Soares ACG, de Oliveira Pinto CAS, Barrera AIÁ, Baby AR, Trossini GHG. Molecular Modeling Based on Time-Dependent Density Functional Theory (TD-DFT) Applied to the UV-Vis Spectra of Natural Compounds. Chemistry. 2023; 5(1):41-53. https://doi.org/10.3390/chemistry5010004
Chicago/Turabian StyleAnhaia-Machado, João Otávio, Artur Caminero Gomes Soares, Claudinéia Aparecida Sales de Oliveira Pinto, Andres Ignacio Ávila Barrera, André Rolim Baby, and Gustavo Henrique Goulart Trossini. 2023. "Molecular Modeling Based on Time-Dependent Density Functional Theory (TD-DFT) Applied to the UV-Vis Spectra of Natural Compounds" Chemistry 5, no. 1: 41-53. https://doi.org/10.3390/chemistry5010004