Article

Spectrophotometric Determination of Formation Constants of Iron(III) Complexes with Several Ligands

by
José J. N. Segoviano-Garfias
1,*,
Gabriela A. Zanor
1,
Fidel Ávila-Ramos
1,
Egla Yareth Bivián-Castro
2 and
Carlos A. Rubio-Jiménez
1
1
División de Ciencias de la Vida (DICIVA), Universidad de Guanajuato, Campus Irapuato-Salamanca, Ex Hacienda El Copal, Carretera Irapuato-Silao Km. 9, Irapuato 36500, Mexico
2
Centro Universitario de los Lagos, Universidad de Guadalajara, Enrique Díaz de León 1144, Col. Paseos de la Montaña, Lagos de Moreno 47460, Mexico
*
Author to whom correspondence should be addressed.
Chemistry 2022, 4(3), 701-716; https://doi.org/10.3390/chemistry4030050
Submission received: 24 April 2022 / Revised: 30 June 2022 / Accepted: 3 July 2022 / Published: 15 July 2022
(This article belongs to the Special Issue Earth-Abundant Metal Chemistry and Catalysis)

Abstract

:
Dye-sensitized solar cells transform solar light into electricity. One commonly used dye is a ruthenium complex. However, the use of ruthenium has been shown to have several disadvantages. In this study, via singular spectrum analysis using HypSpec software, we determined the formation constants and calculated individual electronic spectra of species of iron(III) with several ligands (1,2-diaminoethane, 1,3-diaminopropane, 1,4-diaminobutane, 2,2′-bipyridyl, 5,5-dimethyl-2,2′-bipyridyl, 4,4′-di-tert-butyl-2,2′-bipyridyl, 1,10-phenanthroline, and 3,4,7,8-tetramethyl-1,10-phenanthroline) in methanol solution. We present a spectral comparison of the complexes reported here to the ruthenium complex: tris-(2,2′-bipyridyl)ruthenium(II).

Graphical Abstract

1. Introduction

Currently, world energy generation is based in the combustion of fossil fuels. This consumption has promoted severe anthropogenic climate change [1] and led to other serious consequences [2]. The United Nations proposed the 17 Sustainable Development Goals, as “a universal call to action to end poverty, protect the planet and ensure that all people enjoy peace and prosperity”, in which Goal 7: Affordable and Clean Energy, can be considered the main objective through which to accomplish all other sustainable development goals [3]. One strategy to decrease fossil fuel consumption entails the use of solar energy to generate electricity using photovoltaic technologies [4]. Dye-sensitized solar cells are a class of photoelectrochemical device that can convert solar light into electricity [5]. Usually, these are low cost and show moderate efficiency even under diffuse light. It has been hypothesized that such cells could be scaled up and might be compatible with window glass. Dye-sensitized solar cells represent a promising alternative to silicon solar cells, which currently lead the photovoltaic market [6]. An important attribute of dye-sensitized solar cells is the use of transition metal complexes for light harvesting, for example, ruthenium(II) complexes with 2,2′-bipyridyl-4-4′-dicarboxylate [5,7] or tris(2,2′-bipyridyl)ruthenium(II) ion [8,9], which can be adsorbed at the titania surface and work as dyes. They have played a major role in the development of sustainable solar energy applications [10]. Nevertheless, the use of ruthenium complexes as a raw material presents several disadvantages. Firstly, ruthenium salts are potentially toxic [11] and highly expensive [12]. An essential strategy for finding an inexpensive complex is to mimic the spectral characteristics or the electronic structure of ruthenium dyes, such as [Ru(bipy)3]2+, by use of a different metal ion, such as an iron ion. Recently, an iron(III) complex was reported with a quantum efficiency surpassing [Ru(bipy)3]2+ [13]. Fe3+ complexes are a promising alternate option for which the challenge is to obtain an Fe3+ complex with long-lived excited states [10]—certain of these Fe3+ complexes have been studied previously [14].
In nature, iron ions play an irreplaceable role in biology [15], and are analogous in several respects to ruthenium ions, such as in terms of their electronic behavior [16], comparable activity as catalysts in several reactions [17], and the analogous magnetic properties of ruthenium and iron complexes [18]. Investigating the stability of such metal complexes in solution is a necessary prior step to using deposition techniques, such as spin-coating [19,20]. The experimental electronic spectra of transition metal complexes usually contain many overlapping absorption bands, since they are the sum of all chemical species in the solution [21]. In this investigation, using HypSpec software, equilibrium experiments in methanol solution were carried out. The aim was to obtain the formation constants of complexes with Fe3+ and the following ligands: ethylenediamine (en), 1,3-diaminopropane (pn), 1,4-diaminobutane (bn), 2,2′-bipyridyl (bipy), 5,5′-dimethyl-2,2′-bipyridyl (dmbipy), 4,4′-di-tert-butyl-2,2′-bipyridyl (dtbbipy), 1,10-phenanthroline (phen) and 3,4,7,8-tetramethyl-1,10-phenanthroline (tmphen). Equilibrium studies enabled us to obtain the individual electronic spectrum of each complex, their formation constants, and their speciation or formation curves. The wide variety of ligands used, their substitution patterns, and a comparison of the singular spectra of these species, allowed us to explore their spectral properties and electronic structure, and to identify possible criteria for the use of ligands with Fe3+, with the eventual goal of obtaining an iron(III) complex that could be used as a dye.

2. Results and Discussion

In the experiments undertaken, methanol was the chosen solvent, considering its thermodynamic stabilization effect in Fe3+ complexes [22]. The ionic strength was not used, allowing the use of a wide concentration range of ligands and avoiding early precipitation of the complexes. Considering this, the formation constants in this study cannot be taken as stability constants and should be used only to compare systems measured under similar conditions.

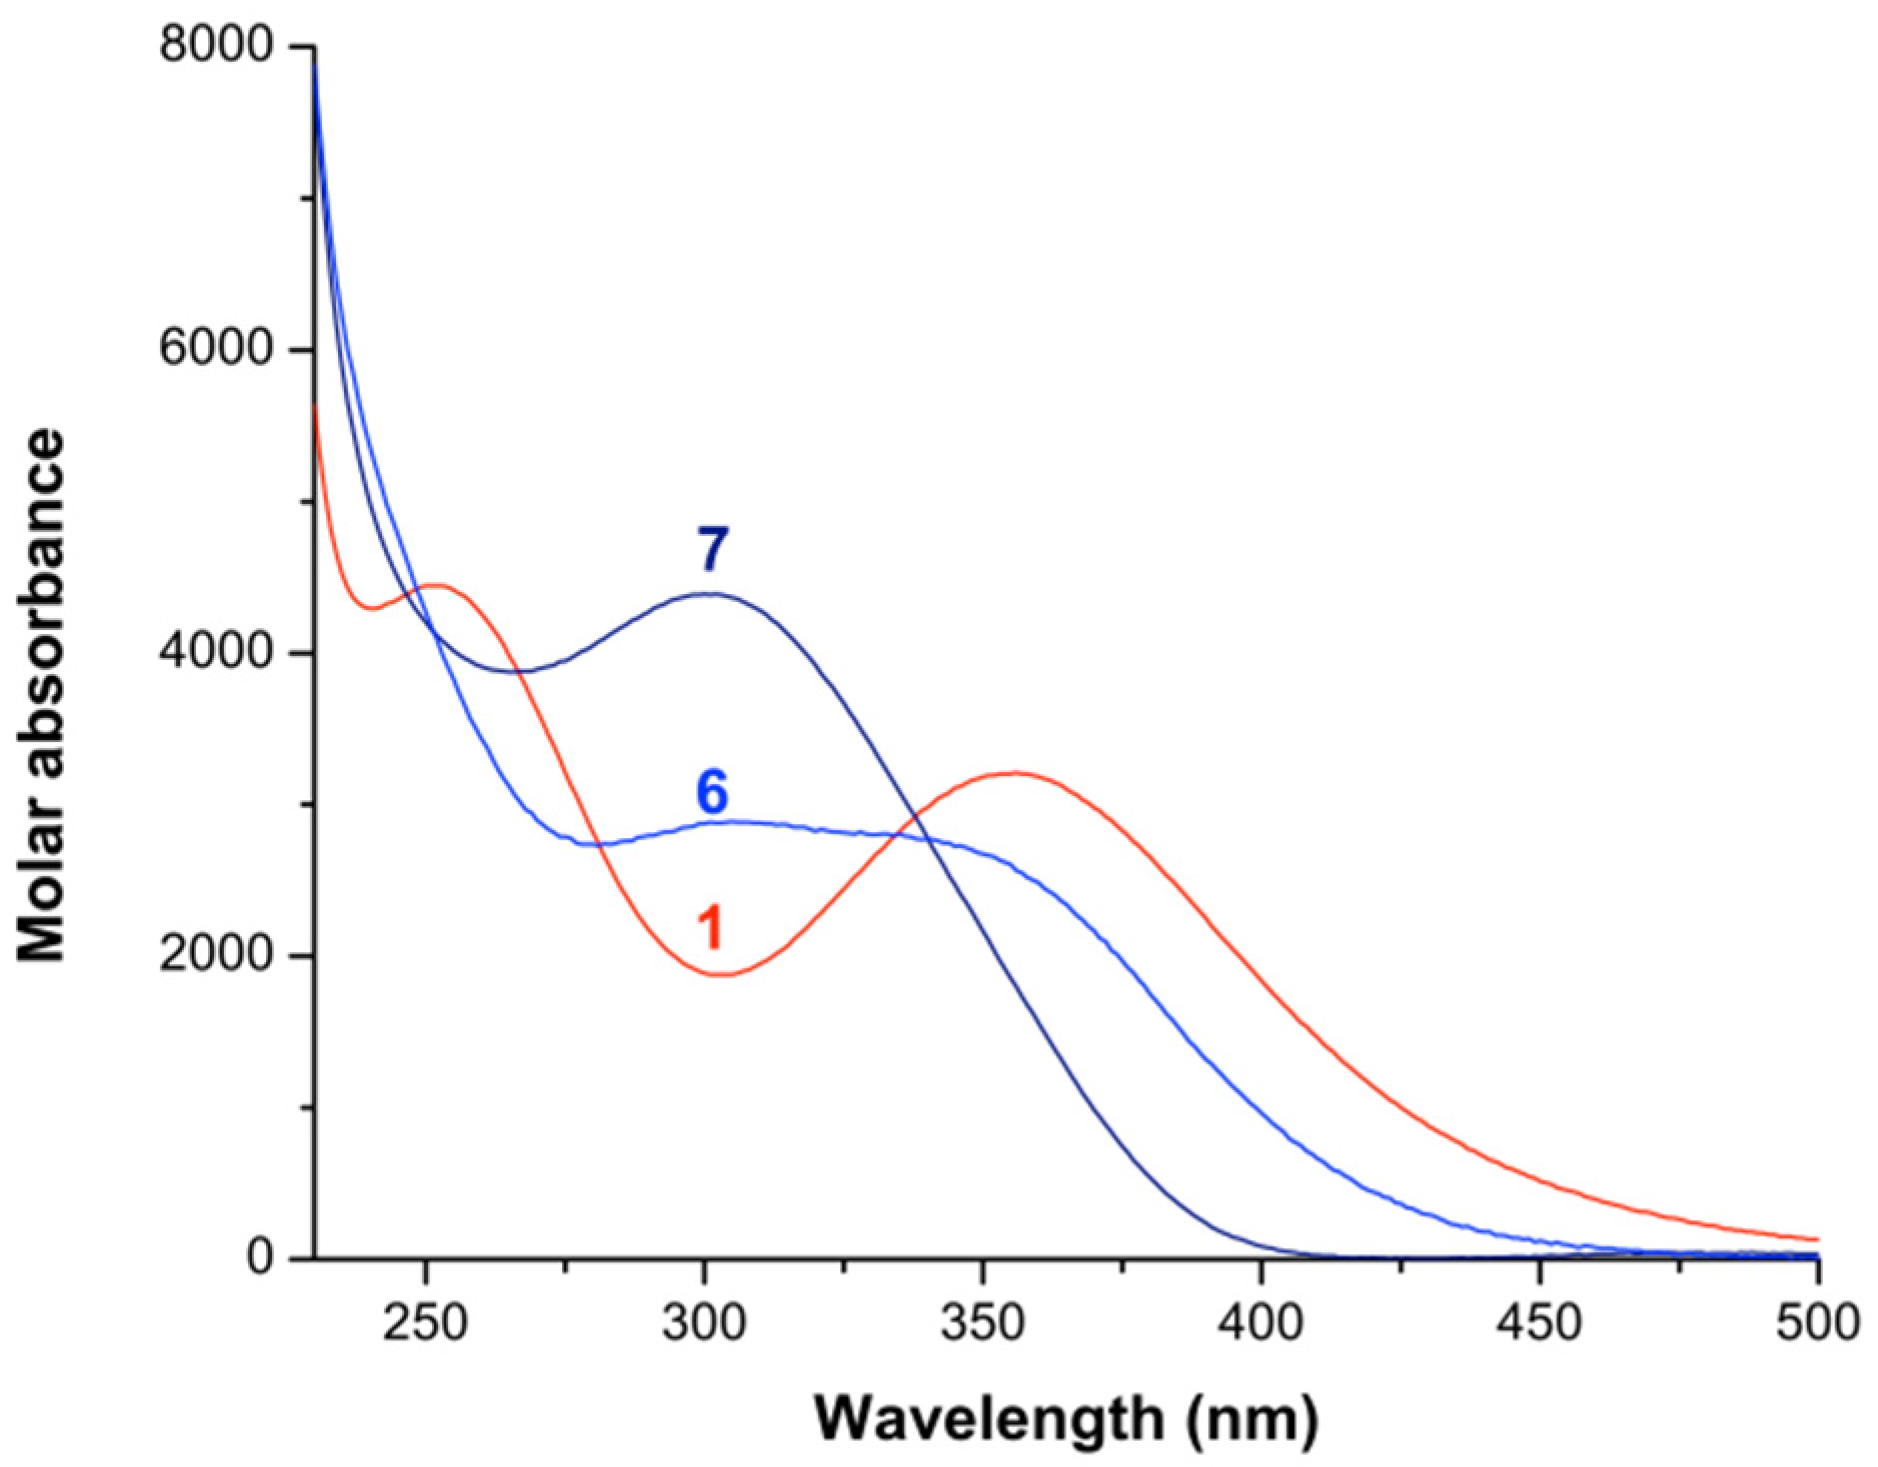
2.1. Formation Constants of Iron(III)-Diamine Ligands Systems

To explore spectral and stability effects, when the carbon chains of each ligand were increased, the Fe3+ ions were combined in methanol with different aliphatic diamines, such as ethylenediamine (en), 1,3-diaminopropane (pn), and 1,4-diaminobutane (bn). We determined the formation constants and speciation and calculated the individual electronic spectra of the Fe3+ ion bonded with these ligands. As far as we are aware, the formation constants for complexes of Fe3+ and en, pn or bn in methanol, have not previously been reported. The collected UV-vis spectra of the Fe3+ complexes with these ligands are shown in the Supplementary Materials in Figures S1–S3, respectively. In the experiments undertaken, the spectral region analyzed was from 220 to 500 nm; as the ligand concentration increased, an isosbestic point appeared at about 335 nm, with a hyperchromic effect at 300 nm and a hypochromic effect at 355 nm. The isosbestic point indicates the existence of an equilibrium between two colored species in solution and the relationship between their concentrations [23]. The obtained values of the formation constants correspond to the equilibrium between Fe3+ and each ligand. The formation constant’s log βjkl values were obtained by processing the experimental spectra using the HypSpec software package [24]. This process involved the correlation of the spectra for two experiments (each at distinct metal concentrations using two different ranges of concentration of each ligand) and the proposal of an equilibrium model; a the formation constant for each species was first suggested. For all systems, only two colored species plus Fe3+ were found, as these ligands usually behave as bidentates [25]. The formation constants were determined using the model below (where L is en, pn or bn):
Fe3+ + L ⇌ [Fe(L)]3+    log β110
Fe3+ + 2L ⇌ [Fe(L)2]3+    log β120
A summary of the experimental parameters and the logarithmic values of the formation constants for these systems are reported in Table S1, using the format recommended by IUPAC [26]. The formation constants obtained for the mono and bis-complex of the Fe(III)-ethylenediamine systems were as follows: [Fe(en)]3+ was 5.3 ± 0.2 and [Fe(en)2]3+ was 10.9 ± 0.1. The formation constants obtained for the mono and bis-complexes of the Fe(III)-1,3-propanediamine systems were as follows: [Fe(pn)]3+ was 6.9 ± 0.2 and [Fe(pn)2]3+ was 12.4 ± 0.1. Finally, the formation constants obtained for the mono and bis-complexes of the Fe(III)-1,4-butanediamine systems were as follows: [Fe(bn)]3+ was 5.2 ± 0.1 and [Fe(bn)2]3+ was 10.2 ± 0.1. The increase in the stability of Fe3+ complexes observed was not consistent with growth in the carbon chain of the ligands (bn > pn > en). On the contrary, the stability of the complexes induced by the ligands for the mono and bis-complexes was: pn > en ≈ bn. Increasing the ligand carbon chain from 1,3-propanediamine to 1,4-butanediamine decreased the formation constants and, possibly, the chelation effect. This behavior has been reported previously in an analogous solution system [27]. Although there have been no reported studies using iron(III), several studies have reported the formation constants for Fe2+ complexes with en, using a glass electrode method at 303 K, in which mono-, bis-, and tris-species were identified [28,29].
The previously reported values of the formation constant for the complexes with Fe2+ and ethylenediamine [28,29] were lower than the values obtained in this study. This could be related to the Lewis acid–base character of Fe3+ (a hard acid) and its affinity for en (a hard base), which is higher than for Fe2+ (a borderline acid) [30]. Additionally, in the present study, a tris species with Fe3+ and en was not found, which is probably related to a decreased ionic radius for Fe3+ and consequent diminished bond angles in the complex. This may have promoted increased intra-ligand repulsion [30]. The calculated electronic spectra of the colored species for the Fe3+ complexes with en, pn, and bn, are shown in Figure 1, Figure 2 and Figure 3, respectively. The [Fe(en)]3+ complex showed an absorption maximum at 358 nm with ε = 2954 L mol−1 cm−1 for [Fe(en)2]3+; an absorption maximum was observed at 299 nm with ε = 4078 L mol−1 cm−1. The [Fe(pn)]3+ complex showed an absorption maximum at 352 nm with ε = 3404 L mol−1 cm−1 for [Fe(pn)2]3+; an absorption maximum was observed at 300 nm with ε = 4355 L mol−1 cm−1. Finally, the [Fe(bn)]3+ complex showed a distorted absorption maximum signal at about 305 nm with ε = 2889 L mol−1 cm−1; for the [Fe(bn)2]3+ complex, an absorption maximum was observed at 302 nm with ε = 4390 L mol−1 cm−1. The order of maximum absorbance obtained in this study for the mono-complexes was pn > en ≈ bn; that for the bis-complexes was bn ≈ pn > en.
The calculated electronic spectra and the formation constants allowed us to hypothesize that, in bn complexes, it is possible that a single donor atom of the ligand could be bonded to the Fe3+ center, and, therefore, that the complex would have a lower molar absorption and stability than a species bonded with both donor atoms. In consequence, mono species with bn might present decreased molar absorption and lower formation constants; this effect might be caused by the high conformational flexibility of bn [31]. The aliphatic diamines en, pn, and bn are commonly σ-donors and usually only promote interactions with σ-electrons between the orbital dz2 of the transition metal and the p-orbital of the ligand [32]. In Fe3+ complexes, high intensity absorption bands at about 300 and 355 nm can be assigned to ligand–metal charge transfer (LMCT) [10,33].

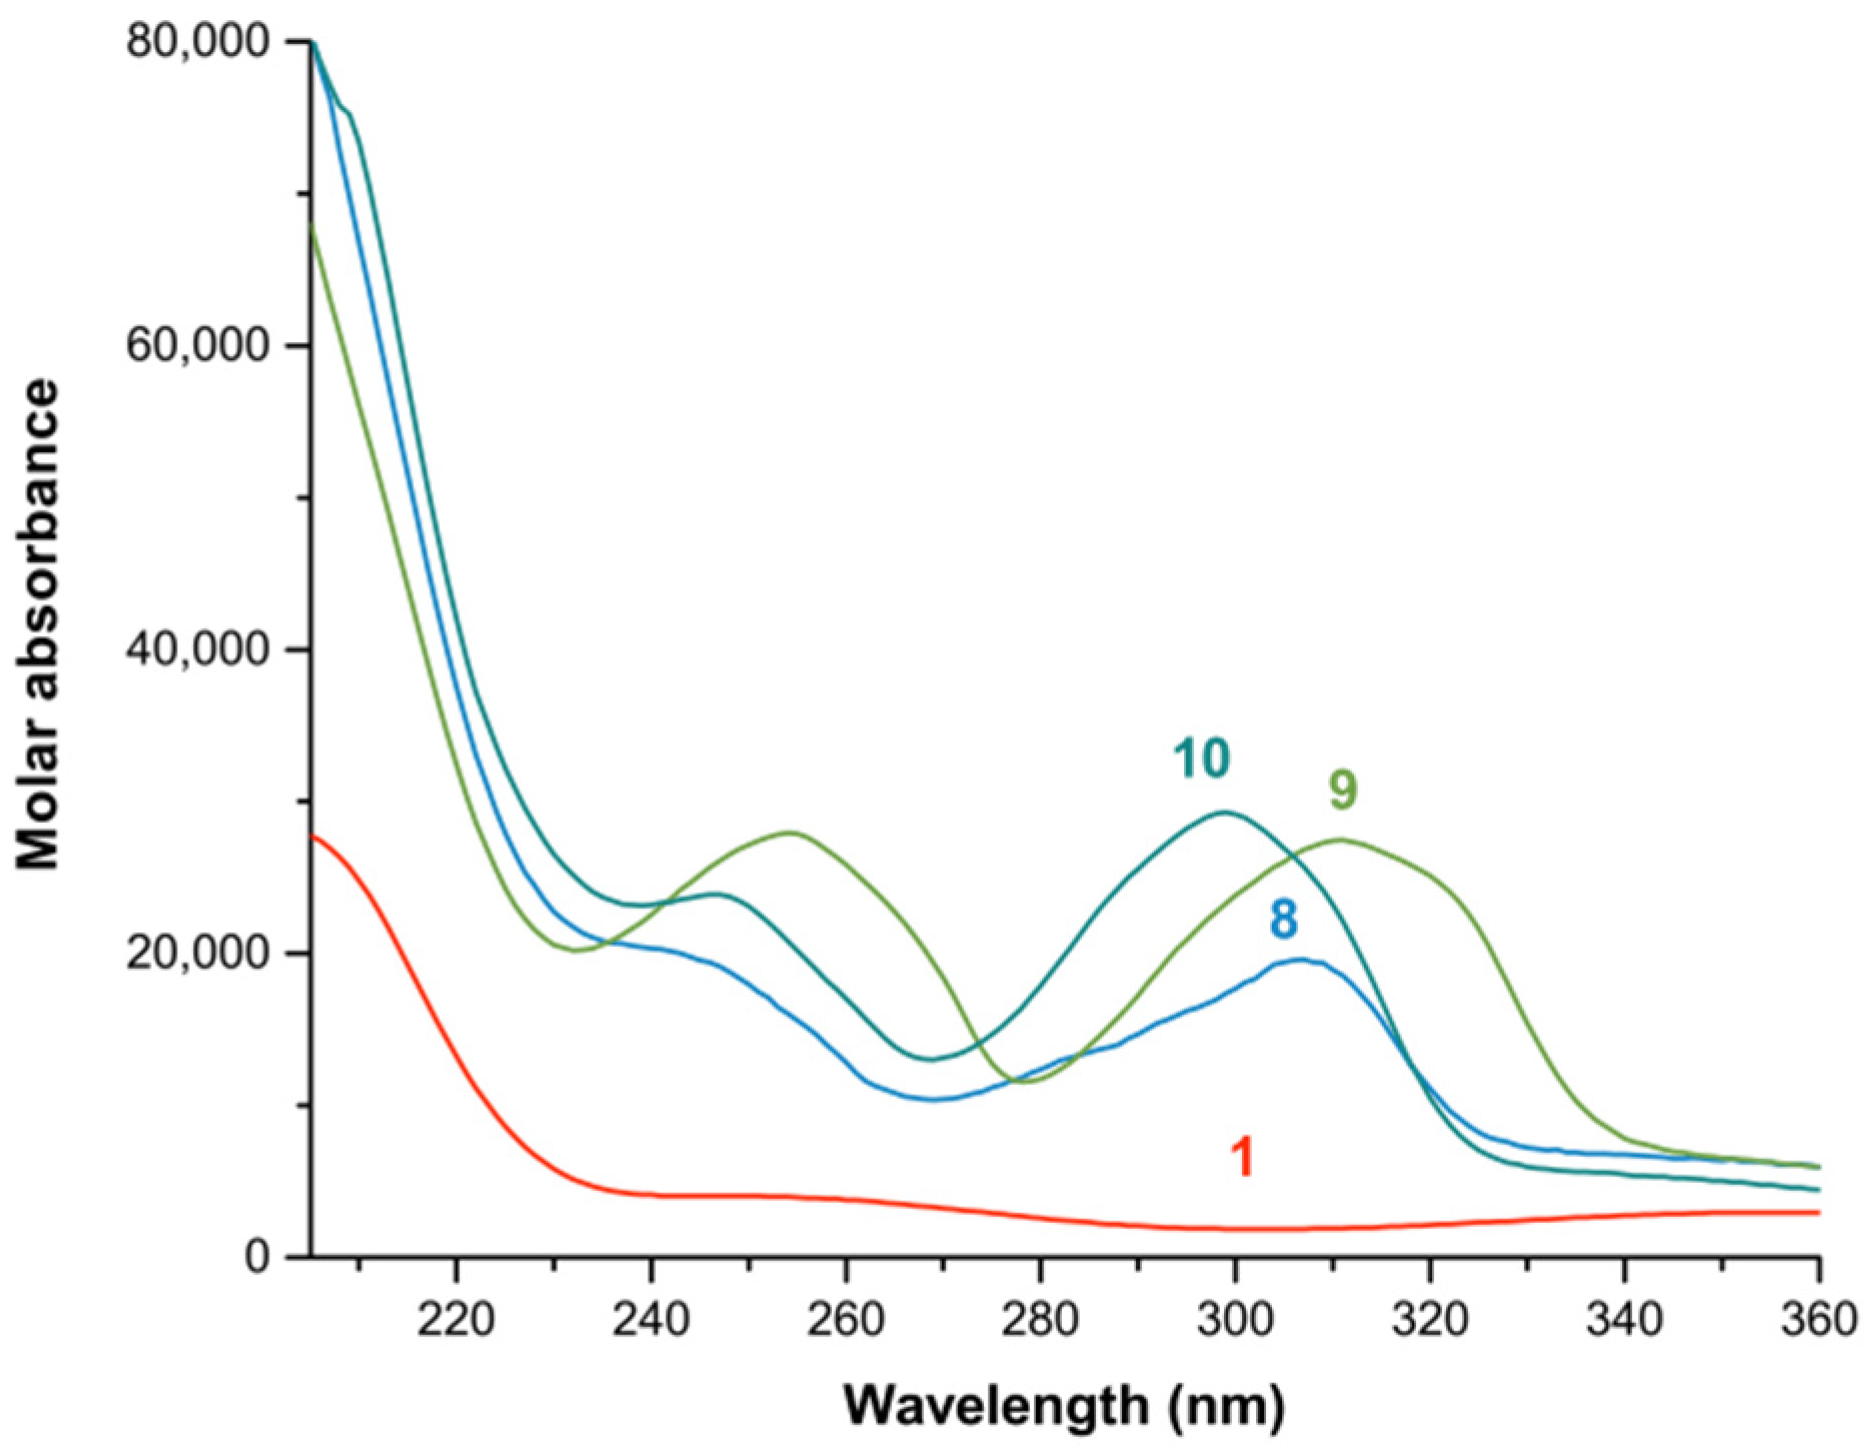
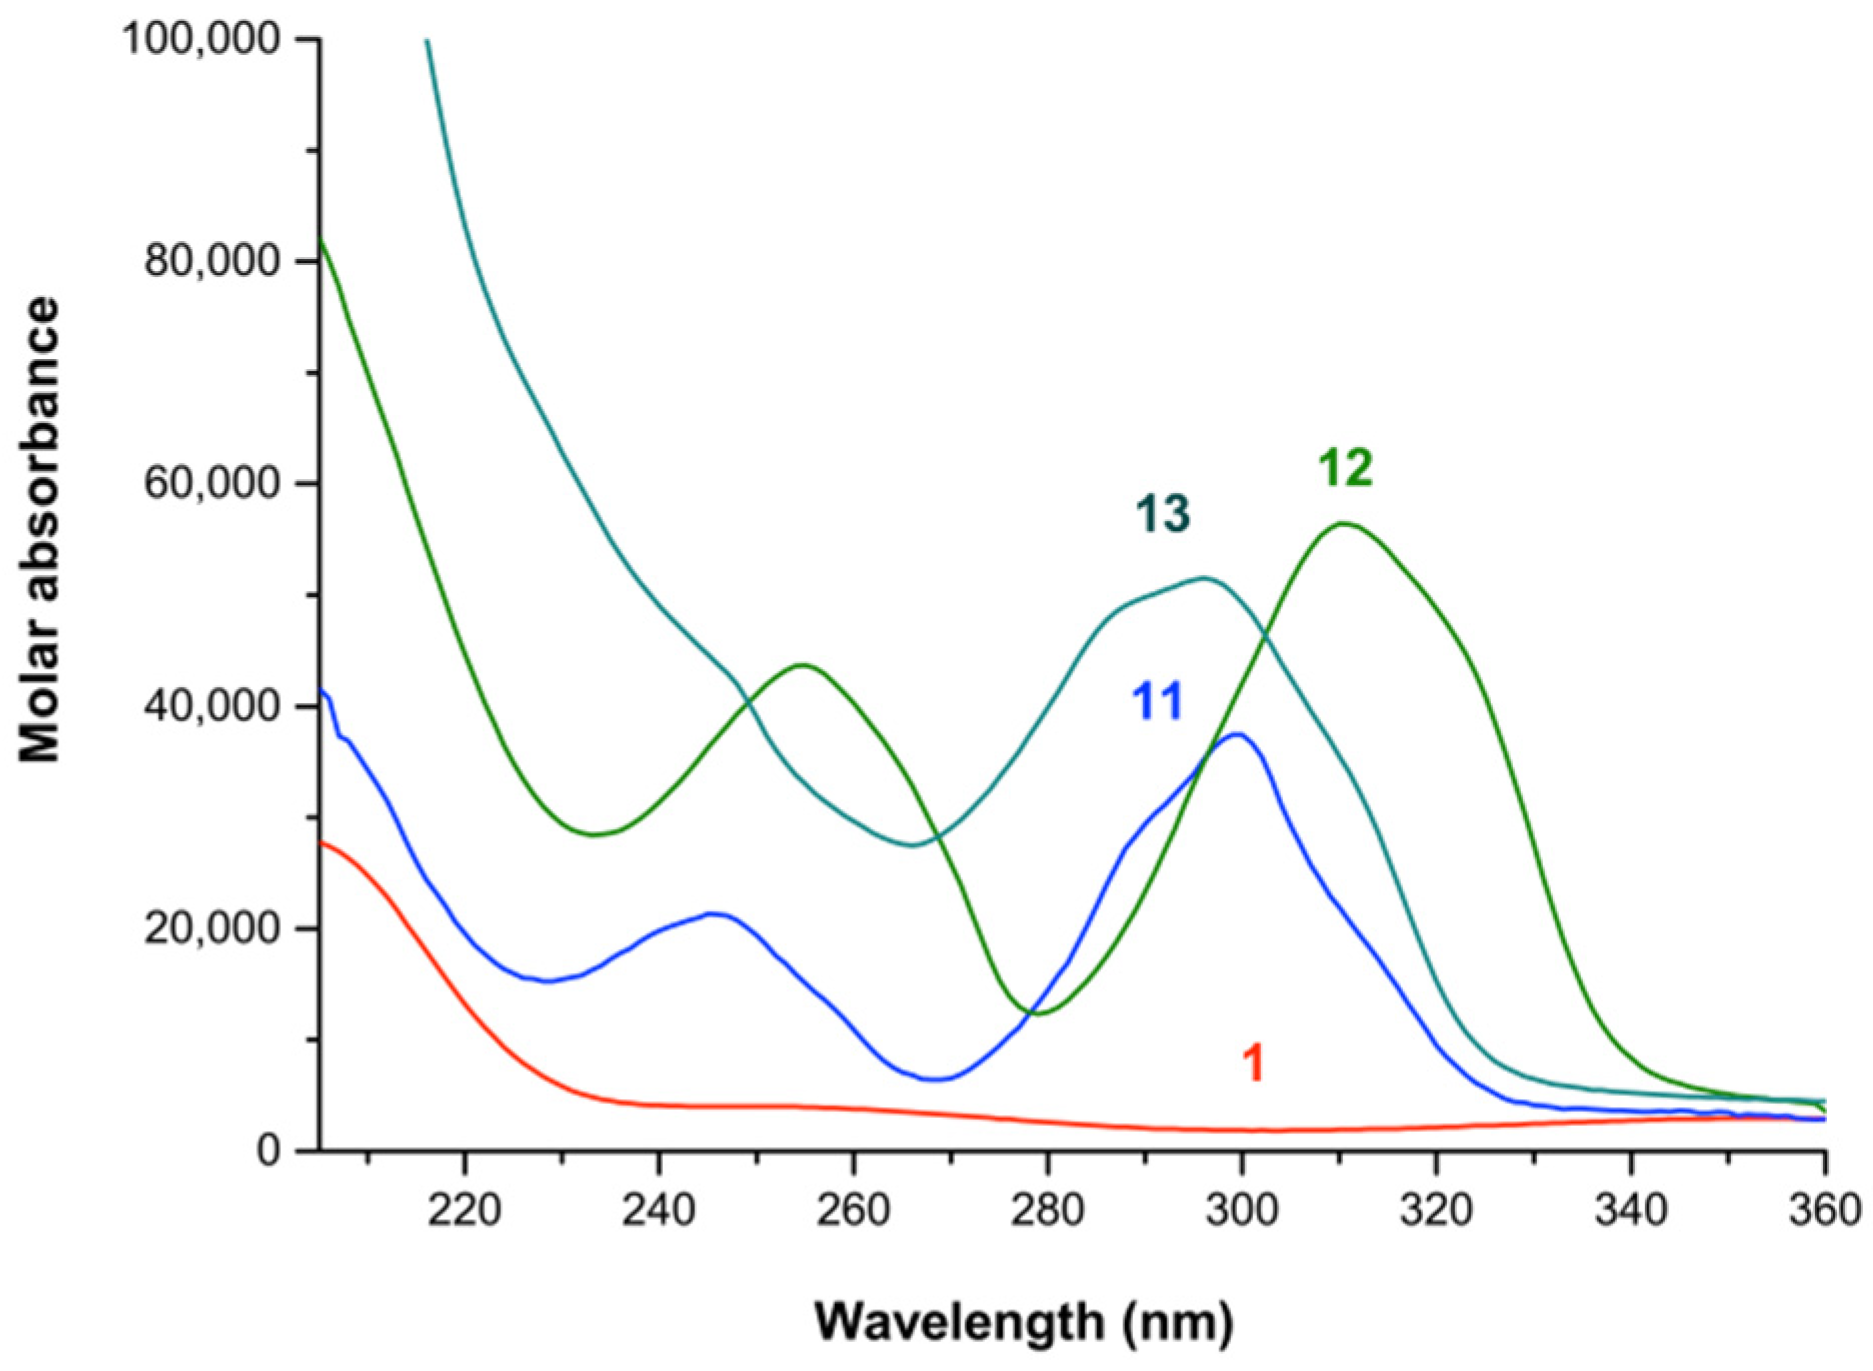
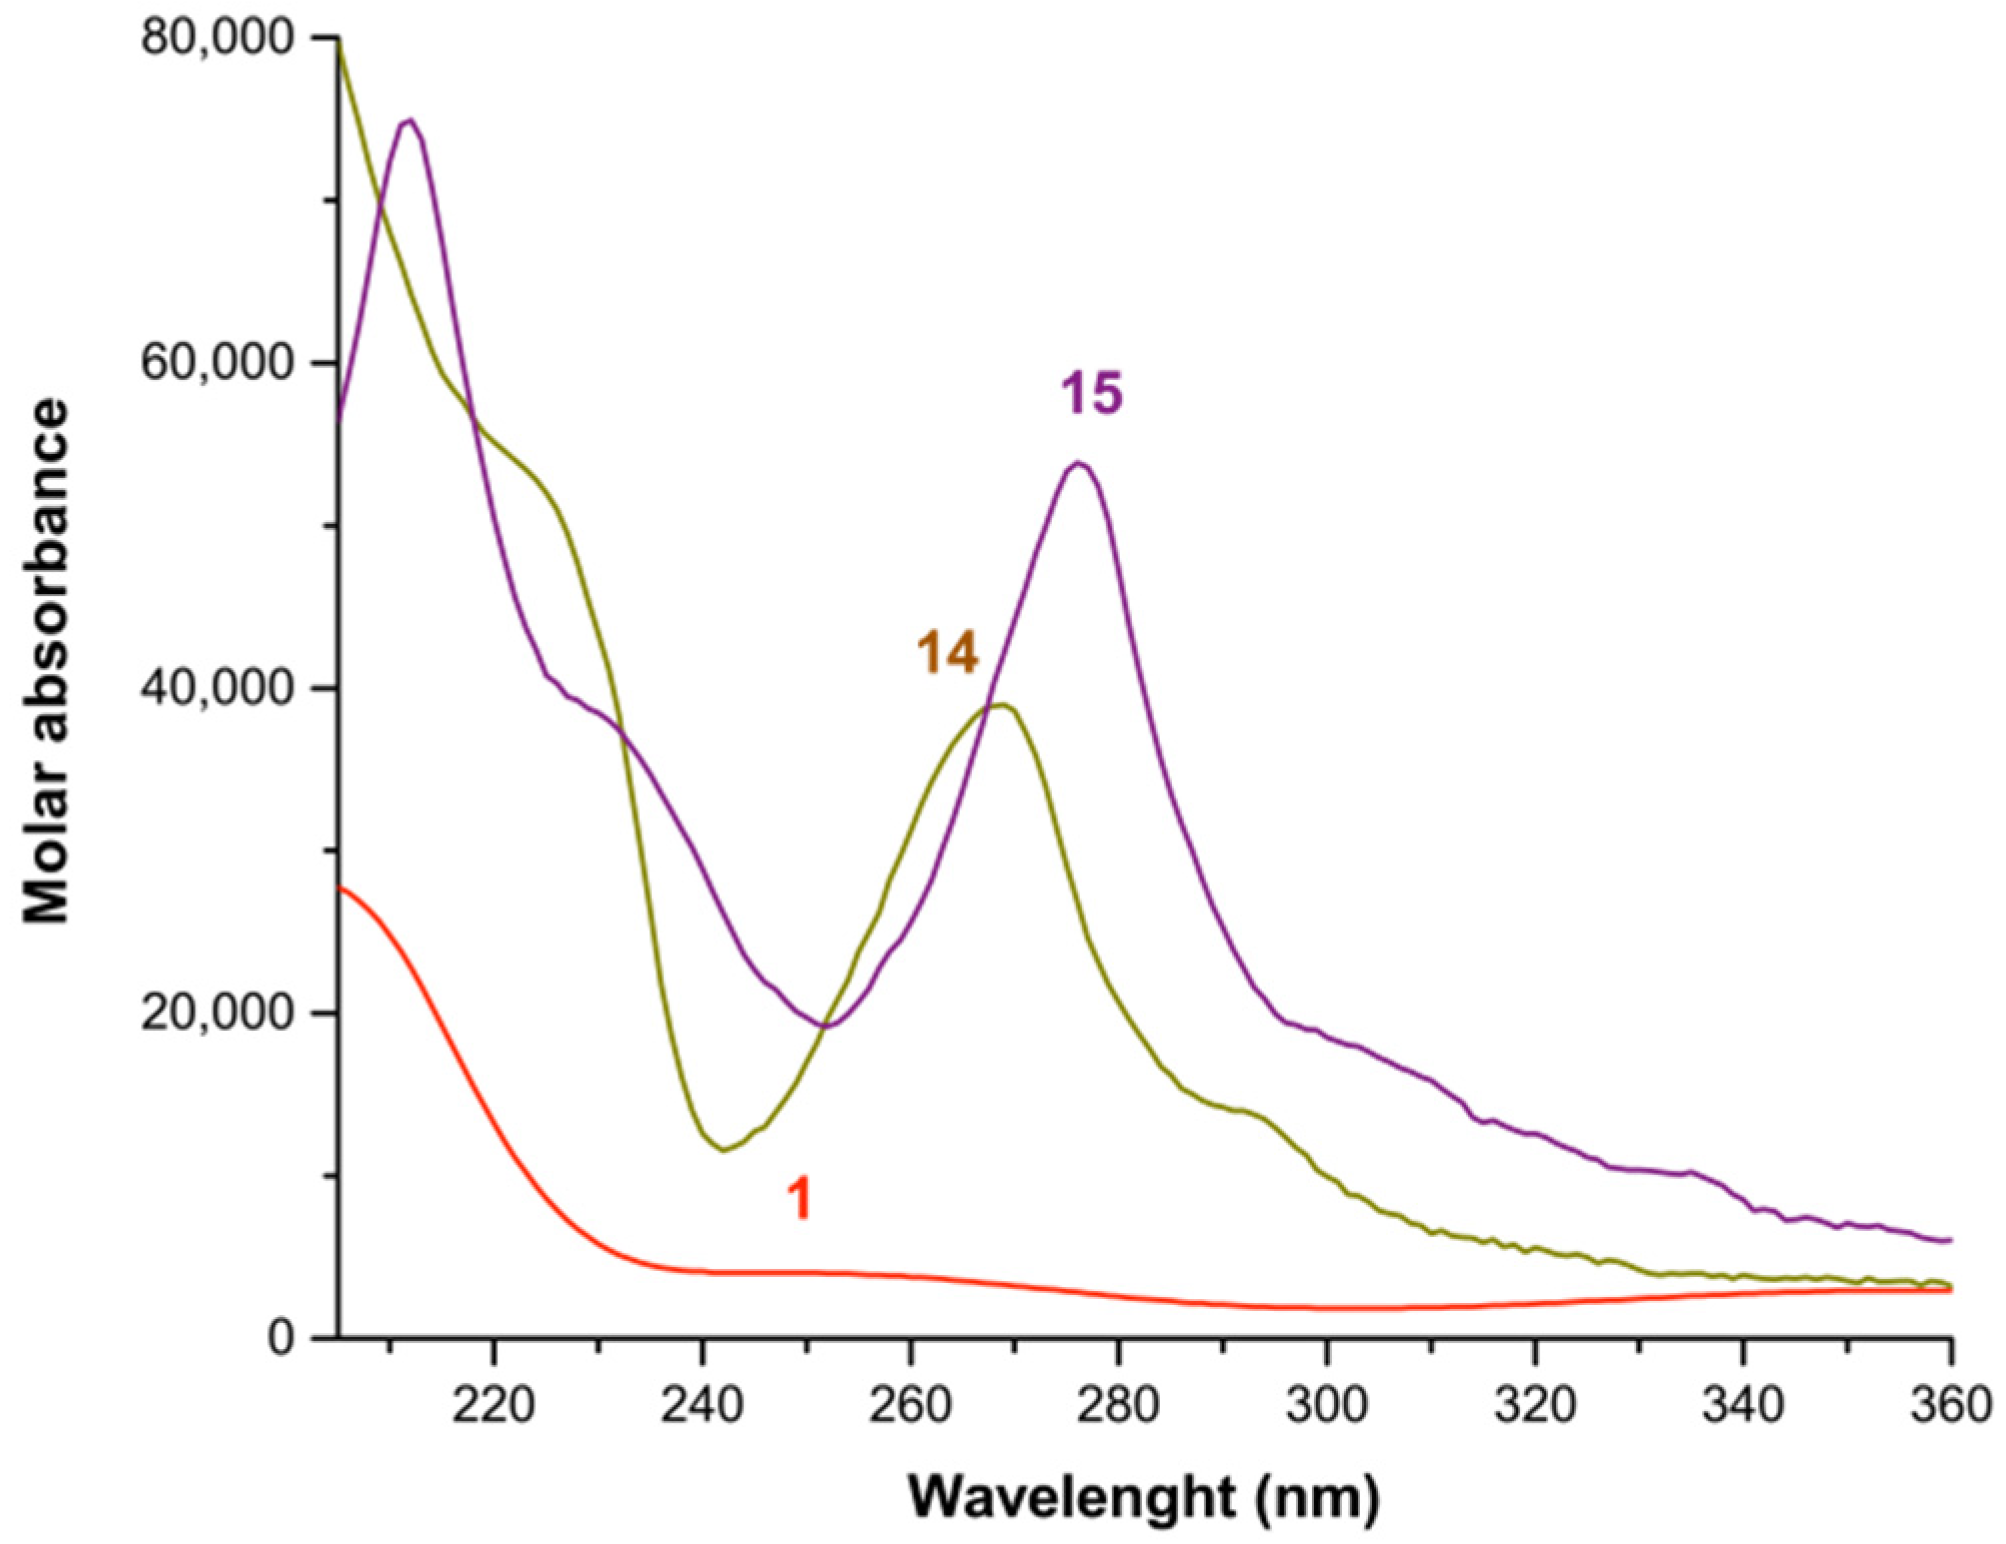
2.2. Formation Constants of Iron(III)-Heterocyclic Ligand Systems

The collected electronic spectra for the solution systems of Fe3+ with 2,2′-bipyridyl, 5,5-dimethyl-2,2′-bipyridyl, 4,4′-di-tert-butyl-2,2′-bipyridyl, 1,10-phenanthroline, and 3,4,7,8-tetramethyl-1,10-phenanthroline in methanol are shown in the Supplementary Material in Figures S4–S8, respectively. In these experiments, the spectral region analyzed was from 205 to 360 nm. For all the solution systems, as the concentration ligand increased, a hyperchromic effect occurred at several wavelengths, characteristic of the ligand used, for each of: 2,2′-bipyridyl(240 and 290 nm), 5,5-dimethyl-2,2′-bipyridyl (250 and 310 nm), 4,4′-di-tert-butyl-2,2′-bipyridyl (250 and 290 nm), 1,10-phenanthroline, 3,4,7,8-tetramethyl-1,10-phenanthroline (225 and 270 nm), and 4,4′-di-tert-butyl-2,2′-bipyridyl (at 210, 235 and 275 nm).
To obtain the βjkl formation constants for the Fe3+ complexes with heterocyclic ligands, the same methodology was applied as for the diamine complexes. In the solution systems examined (where L is 2,2′-bipyridyl or 1,10-phenanthroline), three colored species, plus Fe3+, were found. The formation constants for these systems were obtained using the following model:
Fe3+ + L ⇌ [Fe(L)]3+    log β110
Fe3+ + 2L ⇌ [Fe(L)2]3+    log β120
Fe3+ + 3L ⇌ [Fe(L)3]3+    log β130
However, if the species involved substituted ligands (where L is 5,5-dimethyl-2,2′-bipyridyl, 4,4′-di-tert-butyl-2,2′-bipyridyl, or 3,4,7,8-tetramethyl-1,10-phenanthroline), only two colored species, plus ionic Fe3+, were found. The formation constants were determined using the following model:
Fe3+ + L ⇌ [Fe(L)]3+    log β110
Fe3+ + 2L ⇌ [Fe(L)2]3+    log β120
Summaries of the experimental parameters and the logarithmic values of the formation constants of the Fe3+ complexes with 2,2′-bipyridyl or 1,10-phenanthroline and its substituted ligands are reported in Tables S2 and S3, respectively, using the format recommended by IUPAC [26]. To our knowledge, the formation constants for the Fe3+ systems 2,2′-bipyridyl and 1,10-phenanthroline, 5,5-dimethyl-2,2′-bipyridyl, 4,4′-di-tert-butyl-2,2′-bipyridyl and 3,4,7,8-tetramethyl-1,10-phenanthroline, in methanol, without ionic strength and using a spectrophotometric method, have not been previously reported. However, some equilibrium constants for iron(III) systems with 2,2′-bipyridyl and 1,10-phenanthroline, under different conditions, have been reported (Table S4).
For the iron(III)-2,2′-bipyridyl systems, the formation constants for the mono, bis and tris complexes were: 5.2 ± 0.1, 10.3 ± 0.1 and 15.0 ± 0.1, respectively. For the iron(III)-dmbipy systems, the logarithmic values of the formation constants for the mono and bis species were 5.8 ± 0.1 and 11.0 ± 0.1, respectively. Finally, for the iron(III)-dtbbipy systems, the logarithmic values of the formation constants for the mono and bis species were 6.5 ± 0.1 and 12.2 ± 0.1, respectively. These values suggest that as substitution at the ligands increased, the stability of the species increased. Moreover, tris species were only observed in complex with an unsubstituted ligand. This could be related to steric hindrance. When the ligand used was 1,10-phenantroline, the formation values for mono-, bis- and tris- species changed to 6.1 ± 0.1, 12.2 ± 0.1 and 17.6 ± 0.1, respectively. By analyzing the values of the formation constant values obtained, it was found that the stabilities of the Fe3+ mono, bis and tris species with 1,10-phenantroline were slightly higher than the species with 2,2-bipyridyl. The formation constants for the solution systems with 1,10-phenanthroline were higher—possibly an inductive effect of the aromatic rings—related to an increase in its character as a Lewis base and a chelation effect. However, the formation constants of the mono and bis complexes with Fe3+ and tmphen were 5.4 ± 0.1 and 10.6 ± 0.1, respectively. Furthermore, a tris species was not observed with this ligand, also possibly due to steric hindrance. An inductive effect might be promoted by substituents at the ligand which could also increase the stability of the complexes [30]. Nevertheless, for the tmphen ligand, an additional interaction was possibly promoted; in the solid phase, it has been reported that the tmphen ligand promoted π-π intermolecular stacking [34]. If this behavior were to be replicated in solution, it could explain the decreased stability of the species tmphen below that of the phen species. The syntheses and characterization of Fe3+ complexes with 2,2′-bipyridyl and 1,10-phenanthroline have been reported previously [35]. Additionally, several studies on the stability of complexes with Fe3+ and 2,2′-bipyridyl [36,37] or 1,10-phenanthroline [36,38] have been published using a potentiometric method at 298 K, an ionic strength of 0.1 M (NaNO3) and water as the solvent (Table S4). The reported logarithmic values of the stability constants in these studies were higher than those obtained here. These differences could be explained by variation in the experimental conditions, in which methanol as a solvent could have increased the solvation sphere of the metal ion and decreased the metal–ligand interaction. Furthermore, the use of water as a solvent and the ionic strength could have promoted ionic aggregates, increasing the stabilization of the ionic pairs [39]. However, other studies have reported similar values for the formation constants [38], and the stability constant of the [Fe(bipy)3]3+ complex was found to have a similar value to that obtained in this study [37].
To observe every spectral change related to each substitution and to enable comparison of the spectral differences between the Fe3+ complexes with the substituted and unsubstituted ligands, in the following figures, the calculated electronic spectra of the complexes are separated for mono, bis, and tris species. The calculated spectra for the Fe3+ systems with heterocyclic ligands showed intense absorption peaks in the spectral range between 205 to 360 nm. In Figure 4, the calculated electronic spectra of the mono complexes of Fe3+ with bipy, dmbipy, and dtbbipy are shown. For [Fe(bipy)]3+, two absorption peaks were observed at 239 nm (with ε = 20,308 L mol−1 cm−1) and 307 nm (with ε = 19,597 L mol−1 cm−1). For [Fe(dmbipy)]3+, two absorption peaks were observed at 254 nm (with ε = 27,931 L mol−1 cm−1) and 311 nm (with ε = 27,476 L mol−1 cm−1). Finally, for [Fe(dtbbipy)]3+, two absorption peaks were observed at 246 nm (with ε = 23,871 L mol−1 cm−1) and 299 nm (with ε = 29,282 L mol−1 cm−1). In Figure 5, the calculated electronic spectra of the bis complexes with Fe3+ and bipy, dmbipy, and dtbbipy in methanol are shown. For [Fe(bipy)2]3+, two absorption peaks were identified at 245 nm (with ε = 21,352 L mol−1 cm−1) and 300 nm (with ε = 37,444 L mol−1 cm−1). For [Fe(dmbipy)2]3+, two absorption peaks were observed at 255 nm (with ε = 43,713 L mol−1 cm−1) and 310 nm (with ε = 56,399 L mol−1 cm−1). Finally, for [Fe(dtbbipy)2]3+, an absorption peak was observed at 296 nm (with ε = 51,526 L mol−1 cm−1), and there was a diffuse peak at 248 nm which was not clearly defined. The absorption peaks at 239 nm for [Fe(bipy)]3+, 245 nm for [Fe(bipy)2]3+, 254 nm for [Fe(dmbipy)]3+, 255 nm for [Fe(dmbipy)2]3+, 246 nm for [Fe(dtbbipy)]3+, and the possible peak of 248 nm for [Fe(dtbbipy)2]3+, were assigned to π→π* [40,41], while the absorption peaks at 307 nm for [Fe(bipy)]3+, 300 nm for [Fe(bipy)2]3+, 311 nm for [Fe(dmbipy)]3+, 310 nm for [Fe(dmbipy)2]3+, 299 nm for [Fe(dtbbipy)]3+ and 296 nm for [Fe(dtbbipy)2]3+ were assigned to n→π* [40,41]. An important attribute of the substitution of the 2,2-bipyridyl ligand is the spectral shift that it promotes. The iron complexes suffer a bathochromic shift if the ligand contains methyl groups. If the ligands are di-tert-butyl substituted, a hypochromic shift is promoted; the substitution of the ligand might alter the structural distortion of the complexes [42].
Figure 6 shows the calculated electronic spectra of the mono complexes of Fe3+ and phen or tmphen in methanol. [Fe(phen)]3+ exhibited an absorption peak at 269 nm (with ε = 38,977 L mol−1 cm−1). [Fe(tmphen)]3+ showed two absorption peaks at 212 nm (with ε = 74,921 L mol−1 cm−1) and 276 nm (with ε = 53,832 L mol−1 cm−1). Figure 7 shows the calculated electronic spectra of the bis complexes of Fe3+ with phen or tmphen in methanol. [Fe(phen)2]3+ showed two absorption peaks at 220 nm (with ε = 94,108 L mol−1 cm−1) and 268 nm (with ε = 81,100 L mol−1 cm−1). Finally, [Fe(tmphen)2]3+ also showed two absorption peaks, at 213 nm (with ε = 97,500 L mol−1 cm−1) and 279 nm (with ε = 60,600 L mol−1 cm−1). The absorption peaks at 220 nm for [Fe(phen)2]3+, 212 nm for [Fe(tmphen)]3+, and 213 nm for [Fe(tmphen)2]3+ were assigned to π→π* [40,41], while the absorption peaks at 269 nm for [Fe(phen)]3+, 268 nm for [Fe(phen)2]3+, 276 nm for [Fe(tmphen)]3+ and 279 nm for [Fe(tmphen)2]3+ were assigned to n→π* [40,41]. The purpose of the present investigation was to explore some of the spectral properties of Fe3+ complexes with several ligands and to compare the electronic effects induced at the metal center [43]. The electronic UV-vis spectra of bis complexes, cis-RuL2(SCN)2, where L is 2,2′-bipyridyl-4-4′-dicarboxylate, have been reported [7,44], showing absorption maximums at 534 nm (ε = 14,200 L mol−1 cm−1), 396 nm (ε = 14,000 L mol−1 cm−1), and 313 nm (ε = 31,200 L mol−1 cm−1) [44]. The 313 nm peak of the cis-Ru(2,2′-bipyridyl-4-4′-dicarboxylate)2(SCN)2 showed a resemblance to the peak at 311 nm (with ε = 27,476 L mol−1 cm−1) of [Fe(dmbipy)]3+.
Figure 8 shows the calculated electronic spectra of the tris complexes of Fe3+ with bipy or phen in methanol. [Fe(bipy)3]3+ showed two absorption peaks at 237 nm (with ε = 43,001 L mol−1 cm−1) and 305 nm (with ε = 42,373 L mol−1 cm−1). [Fe(phen)3]3+ showed two absorption peaks at 223 nm (with ε = 162,330 L mol−1 cm−1) and 266 nm (with ε = 116,940 L mol−1 cm−1). The absorption peaks at 237 nm for [Fe(bipy)3]3+ and 223 nm for the [Fe(phen)3]3+ were assigned to π→π* [40,41], while the absorption peaks at 305 nm for [Fe(bipy)3]3+ and 268 nm for [Fe(phen)3]3+ were assigned to n→π* [40,41]. Additionally, Figure 8 presents spectral data [45] on [Ru(bipy)3]2+ [8], which showed two absorption peaks at 242 nm (with ε = 27,244 L mol−1 cm−1) and 285 nm (with ε = 86,088 L mol−1 cm−1). The ruthenium complexes showed absorbance signals between 270–350 nm [46,47,48,49,50]. Figure 8 shows a comparison between the UV-vis spectrum of the complexes [Fe(bipy)3]3+, [Fe(phen)3]3+, and [Ru(bipy)3]2+, which suggests that the UV-vis spectrum of [Ru(bipy)3]2+ could be mimicked using a tris complex of Fe3+ coordinated with an aromatic ligand, possibly with an asymmetric structure.

2.3. Distribution Curves of the Iron(III) System with Diamines, Substituted and Unsubstituted Heterocyclic Ligands

The speciation diagrams of the different Fe3+ species were calculated using the software HySS (Hyperquad Simulation and Speciation) [51], as shown in the Supplementary Materials. Figure S9 presents the formation curves of the iron(III)-ethylenediamine system. A solution with 1 M concentration of Fe3+ and 1M of en yielded about 26% [Fe(en)]3+, 37% [Fe(en)2]3+, and 37% Fe3+. Additionally, 2 M equivalents of en per 1 M of Fe3+ yielded about 90% bis-complex and 10% of [Fe(en)]3+. Figure S10 presents the formation curves of the iron(III)-1,3-propanediamine system in methanol. A solution with a concentration of 1 M of Fe3+ and 1 M of pn yielded about 73% [Fe(pn)]3+ and 15% [Fe(pn)2]3+; the remainder was Fe3+. Furthermore, 2 M equivalents of pn per 1 M of Fe3+ yielded about 90% bis-complex and 10% mono complex. Figure S11 presents formation curves of the iron(III)-1,4-butanediamine system in methanol, in which a solution with a concentration of 1 M of Fe3+ and 1 M of bn yielded about 40% [Fe(bn)]3+, 30% [Fe(bn)2]3+, and 30% Fe3+. A concentration of 2 M of bn per 1 M of Fe3+ yielded about 80% bis-complex and 15% mono complex, while the remainder was Fe3+. Figure S12 presents the formation curves of the Fe(III)-2,2′-bipyridyl system in methanol, in which a solution with a concentration of 1 M of Fe3+ and 1 M of bipy yielded about 32% [Fe(bipy)]3+, about 44% Fe3+, 19% [Fe(bipy)2]3+ and 5% [Fe(bipy)3]3+. However, a concentration of 2 M of bipy per 1 M of Fe3+ generated about 35% [Fe(bipy)2]3+, 26% [Fe(bipy)]3+, 16% of Fe3+, and 23% [Fe(bipy)3]3+. A concentration of 3 M of bipy per 1 M of Fe3+ generated about 48% [Fe(bipy)3]3+, 36% [Fe(bipy)2]3+, 12% [Fe(bipy)]3+ and 4% Fe3+. Figure S13 shows the formation curves of the Fe(III)-5,5′-dimethyl-2,2′-bipyridyl system in methanol, in which a solution with a concentration of 1 M Fe3+ and 1 M of dmbipy yielded about 50% [Fe(dmbipy)]3+, about 31% Fe3+ and 19% [Fe(dmbipy)2]3+. However, a solution with 2 M equivalents of dmbipy per 1 M of Fe3+ generated about 56% [Fe(dmbipy)2]3+, 38% [Fe(dmbipy)]3+, and 6% Fe3+. Figure S14 presents the formation curves of the Fe3+-4,4′-di-tert-butyl-2,2′-bipyridyl complex in methanol. A solution with a concentration of 1 M of Fe3+ and 1 M of dtbbipy yielded about 56% [Fe(dtbbipy)]3+, about 24% of free Fe3+ and 20% of the [Fe(dtbbipy)2]3+. A concentration of 2 M of dtbbipy per 1 M of Fe3+ generated about 76% of the [Fe(dtbbipy)2]3+, 23% of the [Fe(dtbbipy)]3+ and 1% of Fe3+.
Figure S15 presents the formation curves of the Fe(III)-1,10-phenanthroline system in methanol, in which a solution with a concentration of 1 M of Fe3+ and 1 M of phen yielded about 28% [Fe(phen)]3+, about 42% Fe3+, 26% [Fe(phen)2]3+, and 4% [Fe(phen)3]3+. A concentration of 2 M equivalents of phen per 1 M of Fe3+ generated about 49% [Fe(phen)2]3+, 21% [Fe(phen)]3+, and 11% Fe3+; the rest was [Fe(phen)3]3+. Furthermore, 3 M equivalents of phen per 1 M of Fe3+ generated about 45% [Fe(phen)3]3+, 45% [Fe(phen)2]3+, 8% [Fe(phen)]3+, and 2% of Fe3+. Figure S16 presents the formation curves of the Fe(III)-3,4,7,8-tetramethyl-1,10-phenanthroline system in methanol, in which a solution with a concentration of 1 M of Fe3+ and 1 M of tmphen yielded about 34% [Fe(tmphen)]3+, about 53% Fe3+, and about 13% [Fe(tmphen)2]3+. Furthermore, 2 M equivalents of tmphen per 1 M of Fe3+ generated about 35% [Fe(tmphen)2]3+, 39% [Fe(tmphen)]3+ and 26% Fe3+.

2.4. Far Infrared Spectrum of the Complexes of iron(III) with Ethylenediamine, 1,3-Propanediamine, 1,4-Butanediamine, 2,2′-Bipyridyl, 5,5′-Dimethyl-2,2′-bipyridyl, 4,4′-Di-tert-butyl-2,2′-bipyridyl, 1,10-Phenanthroline or 3,4, 7,8-Tetramethyl-1,10-phenanthroline

Figures S17–S19 show the far infrared spectra of the Fe3+ complexes obtained in this study. Figure S17 shows the far infrared spectra of the complexes with Fe3+ with ethylenediamine, 1,3-propanediamine, or 1,4-butanediamine. [Fe(en)]3+ and [Fe(en)2]3 presented a band at about 300 cm−1, which could be assigned to ν(M-N) vibrations in small diamines [52,53]. As the ligand chain was increased, this band gradually began to change to about 436 cm−1 for [Fe(pn)]3+, 424 cm−1 for [Fe(pn)2]3+ and 429 cm−1 for [Fe(bn)]3+. Additionally, this band split to 500 cm−1 and finally disappeared at the complex [Fe(bn)2]3+. This behavior has been observed previously in polymer–metal complexes, in which the bands ν(M-N) were observed at 492–502 cm−1 [54]. If the inorganic polymer has a high molecular weight, the spectral region in which to study the complex should be the mid-IR region, as the polymerization is usually promoted at solid phase [55]. In order to test this hypothesis, further characterization of the possible Fe3+-1,4-butanediamine polymer complexes should be performed. The complexes [Fe(bipy)]3+, [Fe(bipy)2]3+, [Fe(bipy)3]3+, [Fe(dmbipy)]3+, [Fe(dmbipy)2]3+, [Fe(dtbbipy)]3+, [Fe(dtbbipy)2]3+, [Fe(phen)]3+, [Fe(phen)2]3+, [Fe(phen)3]3+, [Fe(tmphen)]3+, and [Fe(tmphen)2]3+ showed bands in the 465–350 cm−1 region, which corresponded to ν(M-N) vibrations in all complexes [56,57,58]. Additionally, all the complexes in this study presented bands at about 250 to 200 cm−1, which were assignable to ν(Fe3+-O) of the nitrate complexes [56,59].

3. Materials and Methods

3.1. Materials, Physical Measurements and Methods

For the spectral determinations, methanol HPLC-grade (Fermont, Mexico) was used as the solvent. The iron(III) nitrate nonahydrate, Fe(NO3)3·9H2O, ethylenediamine, 1,3-diaminopropane, 1,4-diaminobutane, 2,2′-bipyridyl, 5,5-dimethyl-2,2′-bipyridyl, 4,4′-di-tert-butyl-2,2′-bipyridyl, 1,10-phenanthroline, and 3,4,7,8-tetramethyl-1,10-phenanthroline (Sigma-Aldrich, St. Louis, MO, USA) were analytical grade and used without further purification. Ionic strength was not used due to early precipitation of the complexes. The observed absorbance values, in all systems at different wavelengths, were recorded at 298 K in a UV-vis 1800 Shimadzu Spectrophotometer (Shimadzu Corporation, Kyoto, Japan), equipped with a thermostable cell holder and coupled to a Peltier cryobath system, in a quartz cell with 1 cm of path length and 3 mL of volume. To obtain a singular electronic spectrum of each species in solution generated in this study, a modified Job method [60], previously developed by our group, was used [61]. Singular spectrum analysis, carried out in the software HypSpec 2008 (version 1.1.33, Protonic Software, Leeds, UK), allowed us to differentiate the spectral contributions of the generated species in every experiment and to obtain the formation constant for each complex with its individual electronic spectrum [24]. The spectral region analyzed depended on the signals generated by the bound ligand in the complex; for diamines, the range was from 220 to 500 nm, and for heterocyclic substituted ligands, it was from 205 to 360 nm. Finally, the distribution diagrams of the species were calculated using the software Hyperquad Simulation and Speciation (HySS2009) (version 4.0.31, Protonic Software, Leeds, UK) [51]. For the spectral measurements, in a typical experiment, the final concentration of the Fe(III) ion was constant and the concentration of the ligand was varied. This was repeated twice, and each experiment was performed at a different concentration of metal and two different ranges of ligand concentration. The concentrations for each experiment were selected according to the absorbance of the solution in order to stay close to the absorbance of 1.0.

3.2. Equilibrium Studies and Singular Electronic Spectrum Determination for the iron(III)-Diamine Complexes

For the iron(III)-ethylenediamine system, we prepared two different stock solutions of ethylenediamine (1.013 and 1.215 mM) and Fe(NO3)3·9H2O (0.990 and 1.188 mM). For the experiments, the final Fe3+ concentration remained constant at 0.099 and 0.118 mM. For each experiment, the concentrations of ethylenediamine varied from 0.0304 to 0.213 mM and 0.036 to 0.249 mM, respectively. A total of 28 spectra were used for the refinement. The collected spectra of the solutions are shown in Figure S1. For the iron(III)-1,3-diaminopronane system, we used two different stock solutions of 1,3-diaminopropane (0.984 and 1.80 mM) and stock solutions of Fe(NO3)3·9H2O (0.990 and 1.88 mM). In both experiments, the final Fe3+ concentrations remained constant at 0.099 and 0.118 mM, respectively. The 1,3-diaminopropane concentrations varied from 0.0098 to 0.206 mM and 0.0180 to 0.248 mM, respectively. A total of 29 spectra were used for the refinement. The collected spectra of the solutions are shown in Figure S2. For the iron(III)-1,4-diaminobutane system, we used two different stock solutions of 1,4-diaminobutane (1.00 and 1.30 mM), and Fe(NO3)3·9H2O was used to prepare Fe3+ stock solutions (0.990 and 1.290 mM). In each experiment, the final Fe3+ concentrations remained constant at 0.099 and 0.129 mM, in which the concentrations of 1,4-diaminobutane varied from 0.01 to 0.21 mM and 0.039 to 0.27 mM, respectively. A total of 29 spectra were used for the refinement; the collected spectra of the solutions are shown in Figure S3.

3.3. Equilibrium Studies and Singular Electronic Spectrum Determination for iron(III)-Heterocyclic and iron(III)-Heterocyclic-Substituted Complexes

For the iron(III)-2,2′-bipyridyl system, we used two different stock solutions of 2,2′-bipyridyl (156 and 461 µM), and Fe(NO3)3·9H2O was used to prepare Fe3+ stock solutions (99 and 296 µM). In each experiment, the final Fe3+ concentration remained constant at 9.90 and 29.60 µM, in which the concentration of 2,2′-bipyridyl varied from 3.07 to 30.72 µM and 4.6 to 92.00 µM, respectively. A total of 37 spectra were used for the refinement, and the collected spectra of the solutions are shown in Figure S4. For the iron(III)–5,5-dimethyl-2,2′-bipyridyl system, we used two different stock solutions of 5,5-dimethyl-2,2′-bipyridyl (104 and 208 µM), and Fe(NO3)3·9H2O was used to prepare Fe3+ stock solutions (99 and 198 µM). In each experiment, the final Fe3+ concentration remained constant at 9.90 and 19.8 µM, in which the concentrations of 5,5-dimethyl-2,2′-bipyridyl varied from 1.04 to 20.8 µM and 2.08 to 41.6 µM, respectively. A total of 40 spectra were used for the refinement, and the collected spectra of the solutions are shown in Figure S5. For the iron(III)–4,4′-di-tert-butyl-2,2′-bipyridyl system, we used two different stock solutions of 4,4′-di-tert-butyl-2,2′-bipyridyl (104.3 and 208.6 µM), and Fe(NO3)3·9H2O was used to prepare Fe3+ stock solutions (99 and 198 µM). In each experiment, the 4,4′-di-tert-butyl-2,2′-bipyridyl concentrations varied from 2.086 to 20.86 µM and 2.086 to 41.72 µM, respectively. In both experiments, the final Fe3+ concentrations remained constant at 9.9 and 19.8 µM, respectively. A total of 39 spectra were used for the refinement; the collected spectra of the solutions are shown in Figure S6.
For the iron(III)-1,10-phenanthroline system, we used two different stock solutions of 1,10-phenanthroline (73.26 and 95.46 µM), and Fe(NO3)3·9H2O was used to prepare Fe3+ stock solutions (47.40 and 59.28 µM). In each experiment, the concentrations of 1,10-phenanthroline varied from 0.51 to 10.2 µM and from 0.95 to 19.10 µM, respectively. In both experiments, the final Fe3+ concentrations remained constant at 3.26 and 5.92 µM, respectively. A total of 39 spectra were used for the refinement, and the collected spectra of the solutions are shown in Figure S7. For the iron(III)–3,4,7,8-tetramethyl-1,10-phenanthroline system, we used two different stock solutions of 3,4,7,8-tetramethyl-1,10-phenanthroline (30.5 and 60.9 µM), and Fe(NO3)3·9H2O was used to prepare iron stock solutions (29.34 and 58.68 µM). In each experiment, the final Fe3+ concentrations remained constant at 2.934 and 5.868 µM, in which the concentrations of 3,4,7,8-tetramethyl-1,10-phenanthroline varied from 0.305 to 6.092 µM and 0.609 to 12.184 µM, respectively. A total of 40 spectra were used for the refinement; the collected spectra of the solutions are shown in Figure S8.

3.4. Synthesis of the Complexes: Fe(en)i, Fe(pn)i, Fe(bn)i, Fe(bipy)i, Fe(dmbipy)i, Fe(dtbbipy)i, Fe(phen)i, Fe(tmphen)i, and Its Far Infrared Spectrum

To corroborate metal–ligand bond formation in the Fe3+ complexes, these were prepared in methanol HPLC (10 mL) by combining, in solution, an amount of the iron(III) nitrate nonahydrate and the ligand used. The solutions remained at 4 °C until precipitation. Once the complexes were formed, the solutions were filtered to collect the product (Scheme 1). If solid samples were redissolved and their UV-vis spectra were measured, the signals closely coincided with the UV-vis spectrum calculated for the complexes. Figures S20–S37 show the UV-vis spectrum of each complex after precipitation and redissolution in methanol. Since the complexes were not completely soluble in methanol after crystallization, the concentration at which they were prepared is not reported. The infrared spectra for the different manganese complexes were obtained using an HATR system in a Perkin–Elmer Frontier FTIR/FIR spectrometer (PerkinElmer, Inc., Waltham, MA, USA) in the range of 700 to 50 cm−1.
To prepare the [Fe(en)]3+, an equimolar solution of iron(III) nitrate nonahydrate (3 mM) and ethylenediamine (3 mM) was mixed in methanol. The [Fe(en)2]3+ was prepared from a solution with a molar ratio of 1:2 of iron(III) nitrate to ethylenediamine (3 and 6 mM, respectively). The [Fe(pn)]3+ was prepared from an equimolar solution of iron(III) nitrate and 1,3-propanediamine (2.4 and 2.4 mM, respectively). The [Fe(pn)2]3+ was prepared from a solution with a molar ratio of 1:2 of iron(III) nitrate to 1,3-propanediamine (2.4 and 4.8 mM, respectively). The [Fe(bn)]3+ was prepared by mixing an equimolar solution of iron(III) nitrate nonahydrate (3 mM) and 1,4-butanediamine (3 mM) in methanol. The [Fe(bn)2]3+ was prepared from a solution with a molar ratio of 1:2 of iron(III) nitrate nonahydrate to 1,4-butanediamine (3 and 6 mM, respectively).
To prepare the [Fe(bipy)]3+, an equimolar solution of iron(III) nitrate nonahydrate (45.6 mM) and 2,2′-bipyridyl (45.0 mM) was mixed in methanol. The [Fe(bipy)2]3+ was prepared from a solution with a molar ratio of 1:2 of iron(III) nitrate to 2,2′-bipyridyl (45.6 and 90.0 mM, respectively). The [Fe(bipy)3]3+ was prepared from a solution with a molar ratio of about 1:3 of iron(III) nitrate nonahydrate to 2,2′-bipyridyl (45.6 and 135.0 mM, respectively). The [Fe(dmbipy)]3+ was prepared by mixing, in methanol, an equimolar solution of iron(III) nitrate nonahydrate (45.6 mM) and 5,5-dimethyl-2,2′-bipyridyl (44.4 mM). The [Fe(dmbipy)2]3+ was prepared from a solution with a molar ratio of 1:2 of iron(III) nitrate to 5,5-dimethyl-2,2′-bipyridyl (45.6 and 89.0 mM, respectively). To prepare the [Fe(dtbbipy)]3+, an equimolar solution of iron(III) nitrate nonahydrate (45.6 mM) and 4,4′-di-tert-butyl-2,2′-bipyridyl (44.4 mM) was mixed in methanol. The [Fe(dtbbipy)2]3+ was prepared from a solution with a molar ratio of 1:2 of iron(III) nitrate to 4,4′-di-tert-butyl-2,2′-bipyridyl (45.6 and 88.8 mM, respectively).
The [Fe(phen)]3+ was prepared by mixing, in methanol, an equimolar solution of iron(III) nitrate nonahydrate (45.6 mM) and 1,10-phenanthroline (45.0 mM). The [Fe(phen)2]3+ was prepared from a solution with a molar ratio of 1:2 of iron(III) nitrate to 1,10-phenanthroline (45.6 and 89.0 mM, respectively). The [Fe(phen)3]3+ was prepared from a solution with a molar ratio of about 1:3 of iron(III) nitrate nonahydrate to 1,10-phenanthroline (45.6 and 135.0 mM, respectively). Finally, the [Fe(tmphen)]3+ was prepared by mixing an equimolar solution of iron(III) nitrate nonahydrate (45.6 mM) and 3,4,7,8-tetramethyl-1,10-phenanthroline (45.0 mM) in methanol. The [Fe(tmphen)2]3+, was prepared from a solution with a molar ratio of 1:2 of iron(III) nitrate to 3,4,7,8-tetramethyl-1,10-phenanthroline (45.6 and 90.0 mM, respectively).

4. Conclusions

The individual electronic spectra of species are essential tools to aid in the design of complexes from catalysts to dyes. The diamine complexes did not show important spectral activity; they did, however, demonstrate potential use as crosslinking agents to combine complexes and modify their spectral properties. The substituents of the ligands used in this study increased the stability of the iron(III) complexes and their molar absorption, but the formation of the tris species was decreased. The spectral information obtained in this study should be compared with an analysis of computational studies of UV-vis spectral simulation to establish a molecular structure for these complexes.

Supplementary Materials

The following supporting information can be downloaded at: https://www.mdpi.com/article/10.3390/chemistry4030050/s1, Table S1. Summary of experimental parameters for the systems Fe3+ with ethylenediamine (en), 1,3-diaminopropane (pn) and 1,4-diaminopropane (bn) in methanol; Table S2. Summary of experimental parameters for the systems Fe3+ with 2,2′-bipyridyl(bipy), 5,5′-dimethyl-2,2′-bipyridyl (dmbipy) and 4,4′-di-tert-butyl-2,2′-bipyridyl (dtbbipy)in methanol; Table S3. Summary of experimental parameters for the systems Fe3+ with 1,10-phenanthroline (phen) and 3,4,7,8-tetramethyl-1,10-phenanthroline (tmphen) in methanol; Table S4. Equilibrium constants for Fe3+ systems with 2,2′- bipyridine and 1,10-phenanthroline, under different conditions; Figure S1. Absorption spectra of iron(III)-ethylenediamine complexes in methanol solution; Figure S2. Absorption spectra of iron(III)-1,3-diaminopropane complexes in methanol solution; Figure S3. Absorption spectra of iron(III)-1,4-diaminobutane complexes in methanol solution; Figure S4. Absorption spectra of iron(III)–2,2′-bipyridyl complex in methanol solution; Figure S5. Absorption spectra of iron(III)–5,5-dimethyl-2,2′-bipyridyl complex in methanol solution; Figure S6. Absorption spectra of iron(III)–4,4′-di-tert-butyl-2,2′-bipyridyl complex in methanol solution; Figure S7. Absorption spectra of iron(III)–1,10-phenanthroline complex in methanol solution; Figure S8. Absorption spectra of iron(III)–3,4,7,8-tetramethyl-1,10-phenanthroline complex in methanol solution; Figure S9. Formation curves of the iron(III)-ethylenediamine system in methanol; Figure S10. Formation curves of the iron(III)-1,3-propanediamine system in methanol; Figure S11. Formation curves of the iron(III)-1,4-butanediamine system in methanol; Figure S12. Formation curves of the Fe(III)–2,2′-bipyridyl complex in methanol; Figure S13. Formation curves of the Fe(III)–5,5′-dimethyl-2,2′-bipyridyl complex in methanol; Figure S14. Formation curves of the Fe(III)–4,4′-di-tert-butyl-2,2′-bipyridyl complex in methanol; Figure S15. Formation curves of the Fe(III)–1,10-phenanthroline complex in methanol; Figure S16. Formation curves of the Fe(III)– 3,4,7,8-tetramethyl-1,10-phenanthroline complex in methanol; Figure S17. Far infrared spectra of the different Fe(III) complexes with ethylenediamine, 1,3-propanediamine and 1,4-butanediamine; Figure S18. Far infrared spectra of the different Fe(III) complexes with 2,2′-bipyridyl, 5,5-dimethyl-2,2′-bipyridyl, 4,4′-di-tert-butyl-2,2′-bipyridyl; Figure S19. Far infrared spectra of the different Fe(III) complexes with 1,10-phenanthroline or 3,4,7,8-tetramethyl-1,10-phenanthroline; Figure S20. UV-vis spectra of [Fe(en)]3+ complex in methanol solution; Figure S21. UV-vis spectrum of [Fe(en)2]3+ complex in methanol solution; Figure S22. UV-vis spectrum of [Fe(pn)]3+ complex in methanol solution; Figure S23. UV-vis spectrum of [Fe(pn)2]3+ complex in methanol solution; Figure S24. UV-vis spectrum of [Fe(bn)]3+ complex in methanol solution; Figure S25. UV-vis spectrum of [Fe(bn)2]3+ complex in methanol solution; Figure S26. UV-vis spectrum of [Fe(bipy)]3+ complex in methanol solution; Figure S27. UV-vis spectrum of [Fe(bipy)2]3+ complex in methanol solution; Figure S28. UV-vis spectrum of [Fe(bipy)3]3+ complex in methanol solution; Figure S29. UV-vis spectrum of [Fe(dmbipy)]3+ complex in methanol solution; Figure S30. UV-vis spectrum of [Fe(dmbipy)2]3+ complex in methanol solution; Figure S31. UV-vis spectrum of [Fe(dtbbipy)]3+ complex in methanol solution; Figure S32. UV-vis spectrum of [Fe(dtbbipy)2]3+ complex in methanol solution; Figure S33. UV-vis spectrum of [Fe(phen)]3+ complex in methanol solution; Figure S34. UV-vis spectrum of [Fe(phen)2]3+ complex in methanol solution; Figure S35. UV-vis spectrum of [Fe(phen)3]3+ complex in methanol solution; Figure S36. UV-vis spectrum of [Fe(tmphen)]3+ complex in methanol solution; Figure. S37. UV-vis spectrum of [Fe(tmphen)2]3+ complex in methanol solution.

Author Contributions

Conceptualization, J.J.N.S.-G. and G.A.Z.; methodology, F.Á.-R.; formal analysis, G.A.Z.; investigation, E.Y.B.-C.; writing—original draft preparation, J.J.N.S.-G.; writing—review and editing, G.A.Z. and C.A.R.-J.; supervision, E.Y.B.-C. and F.Á.-R. All authors have read and agreed to the published version of the manuscript.

Funding

This research was funded by IDEA-GTO: INNOVACIÓN, DESARROLLO, EMPRENDIMIENTO, ACELERACIÓN, grant number IJ-19-4.

Data Availability Statement

The data presented in this study are available in the Supplementary Material.

Conflicts of Interest

The authors declare no conflict of interest. The funders had no role in the design of the study, interpretation of data, in the writing of the manuscript, or in the decision to publish the results.

References

  1. Höök, M.; Tang, X. Depletion of fossil fuels and anthropogenic climate change—A review. Energy Policy 2013, 52, 797–809. [Google Scholar] [CrossRef] [Green Version]
  2. Yıldız, İ. 1.12 Fossil Fuels. In Comprehensive Energy Systems; Dincer, I., Ed.; Elsevier: Oxford, UK, 2018; pp. 521–567. [Google Scholar]
  3. Santika, W.G.; Anisuzzaman, M.; Bahri, P.A.; Shafiullah, G.M.; Rupf, G.V.; Urmee, T. From goals to joules: A quantitative approach of interlinkages between energy and the Sustainable Development Goals. Energy Res. Soc. Sci. 2019, 50, 201–214. [Google Scholar] [CrossRef]
  4. Asim, N.; Sopian, K.; Ahmadi, S.; Saeedfar, K.; Alghoul, M.A.; Saadatian, O.; Zaidi, S.H. A review on the role of materials science in solar cells. Renew. Sustain. Energy Rev. 2012, 16, 5834–5847. [Google Scholar] [CrossRef]
  5. Grätzel, M. Photoelectrochemical cells. Nature 2001, 414, 338–344. [Google Scholar] [CrossRef] [PubMed]
  6. Lee, J.-K.; Yang, M. Progress in light harvesting and charge injection of dye-sensitized solar cells. Mater. Sci. Eng. B 2011, 176, 1142–1160. [Google Scholar] [CrossRef]
  7. Liska, P.; Vlachopoulos, N.; Nazeeruddin, M.K.; Comte, P.; Graetzel, M. cis-Diaquabis(2,2′-bipyridyl-4,4′-dicarboxylate)ruthenium(II) sensitizes wide band gap oxide semiconductors very efficiently over a broad spectral range in the visible. J. Am. Chem. Soc. 1988, 110, 3686–3687. [Google Scholar] [CrossRef]
  8. Van Houten, J.; Watts, R.J. Temperature dependence of the photophysical and photochemical properties of the tris(2,2′-bipyridyl)ruthenium(II) ion in aqueous solution. J. Am. Chem. Soc. 1976, 98, 4853–4858. [Google Scholar] [CrossRef]
  9. Lee, K.W.; Slinker, J.D.; Gorodetsky, A.A.; Flores-Torres, S.; Abruña, H.D.; Houston, P.L.; Malliaras, G.G. Photophysical properties of tris(bipyridyl)ruthenium(ii) thin films and devices. PCCP 2003, 5, 2706–2709. [Google Scholar] [CrossRef]
  10. Chábera, P.; Lindh, L.; Rosemann, N.W.; Prakash, O.; Uhlig, J.; Yartsev, A.; Wärnmark, K.; Sundström, V.; Persson, P. Photofunctionality of iron(III) N-heterocyclic carbenes and related d5 transition metal complexes. Coord. Chem. Rev. 2021, 426, 213517. [Google Scholar] [CrossRef]
  11. Wang, J.; Zhao, Z.; Zhou, S.; Zhang, X.; Bo, H. The antitumor effect and toxicity of a ruthenium(II) complex in vivo. Inorg. Chem. Commun. 2018, 87, 49–52. [Google Scholar] [CrossRef]
  12. Sigma-Aldrich: Analytical, Biology, Chemistry, Materials Science Products and Services. Available online: www.sigmaaldrich.com/ (accessed on 1 June 2022).
  13. Young, E.R.; Oldacre, A. Iron hits the mark. Science 2019, 363, 225. [Google Scholar] [CrossRef] [PubMed]
  14. Chabera, P.; Liu, Y.; Prakash, O.; Thyrhaug, E.; Nahhas, A.; Honarfar, A.; Essén, S.; Fredin, L.; Harlang, T.; Kjær, K.; et al. A low-spin Fe(III) complex with 100-ps ligand-to-metal charge transfer photoluminescence. Nature 2017, 543, 695–699. [Google Scholar] [CrossRef] [PubMed]
  15. Liu, Z.-J.; Wang, X.-L.; Qin, C.; Zhang, Z.-M.; Li, Y.-G.; Chen, W.-L.; Wang, E.-B. Polyoxometalate-assisted synthesis of transition-metal cubane clusters as artificial mimics of the oxygen-evolving center of photosystem II. Coord. Chem. Rev. 2016, 313, 94–110. [Google Scholar] [CrossRef]
  16. Kober, E.M.; Meyer, T.J. Concerning the absorption spectra of the ions M(bpy)32+ (M = Fe, Ru, Os; bpy = 2,2′-bipyridine). lnorg. Chem. 1982, 21, 3967–3977. [Google Scholar] [CrossRef]
  17. Bullock, R.M. Abundant Metals Give Precious Hydrogenation Performance. Science 2013, 342, 1054–1055. [Google Scholar] [CrossRef]
  18. Figgis, B.N.; Lewis, J.; Mabbs, F.E.; Webb, G.A. Magnetic properties of some iron(III) and ruthenium(III) low-spin complexes. J. Chem. Soc. A Inorg. Phys. Theor. 1966, 422–426. [Google Scholar] [CrossRef]
  19. Ojea, M.J.H.; Reta, D.; Rosado, L.; Zuazo, J.R.; Castro, G.; Tewary, S.; Gopalan, R.; Aromí, G.; Jimenez, E.; Sañudo, E.C. Characterization of a Robust CoII Fluorescent Complex Deposited Intact On HOPG. Chem. A Eur. J. 2014, 20. [Google Scholar] [CrossRef]
  20. Bräuer, B.; Zahn, D.; Ffer, T.; Salvan, G. Deposition of thin films of a transition metal complex by spin coating. Chem. Phys. Lett. 2006, 432, 226–229. [Google Scholar] [CrossRef]
  21. Gorelsky, S.I. 2.38—Semiempirical SCF MO Methods, Electronic Spectra, and Configurational Interaction. In Comprehensive Coordination Chemistry II; McCleverty, J.A., Meyer, T.J., Eds.; Pergamon: Oxford, UK, 2003; pp. 467–489. [Google Scholar]
  22. Stephenson, N.A.; Bell, A.T. Effects of Methanol on the Thermodynamics of Iron(III) [Tetrakis(pentafluorophenyl)]porphyrin Chloride Dissociation and the Creation of Catalytically Active Species for the Epoxidation of Cyclooctene. lnorg. Chem. 2006, 45, 5591–5599. [Google Scholar] [CrossRef]
  23. Harris, D.C.; Bertolucci, M.D. Symmetry and Spectroscopy: An Introduction to Vibrational and Electronic Spectroscopy; Dover Publications: Mignola, NY, USA, 1978. [Google Scholar]
  24. Gans, P.; Sabatini, A.; Vacca, A. HypSpec 2008 Software; Protonic Software: Leeds, UK; Florence, Italy, 2008. [Google Scholar]
  25. Ehnbom, A.; Ghosh, S.; Lewis, K.G.; Gladysz, J. Octahedral Werner complexes with substituted ethylenediamine ligands: A stereochemical primer for a historic series of compounds now emerging as a modern family of catalysts. Chem. Soc. Rev. 2016, 45, 6799–6811. [Google Scholar] [CrossRef] [Green Version]
  26. Tuck, D.G. A proposal for the use of a standard format for the publication of stability constant measurements. Pure Appl. Chem. 1989, 61, 1161. [Google Scholar] [CrossRef]
  27. Segoviano-Garfias, J.J.N.; Mendoza-Díaz, G.; Moreno-Esparza, R. A comparative study of the speciation in methanol solution and activity in the oxidative coupling of 2,6-di-tert-butylphenol presented by the complexes: Copper(II)-N,N′-di-tert-butylethylenediamine-halogen and some copper(II)-diamine-halogen complexes. Inorg. Chim. Acta 2014, 411, 148–157. [Google Scholar] [CrossRef]
  28. Paoletti, P. Formation of metal complexes with ethylenediamine: A critical survey of equilibrium constants, enthalpy and entropy values. Pure Appl. Chem. 1984, 56, 491. [Google Scholar] [CrossRef]
  29. Pecsok, R.; Bjerrum, J. Metal Ammine Formation in Solution XI. Stability of Ethylenediamine Complexes and the Coordination. Acta Chem. Scand 1957, 11. [Google Scholar] [CrossRef]
  30. Miessler, G.L.; Fischer, P.J.; Tarr, D.A. Inorganic Chemistry, 2nd ed.; Pearson Education: Upper Saddle River, NJ, USA, 2013. [Google Scholar]
  31. Segoviano-Garfias, J.J.N.; Mendoza-Díaz, G.; Moreno-Esparza, R. Spectrophotometric determination of the formation constants of the cupric halogen complexes with 1,3-propanediamine and 1,4-butanediamine in methanol solution and their activity on the oxidative coupling of the 2,6-di-tert-butylphenol. Inorg. Chim. Acta 2013, 400, 184–190. [Google Scholar] [CrossRef]
  32. Miessler, G.L.; Tarr, D.A. Inorganic Chemistry; Pearson Education: Upper Saddle River, NJ, USA, 2004. [Google Scholar]
  33. Setyawati, I.A.; Rettig, S.J.; Orvig, C. Cationic iron(III) complex with a hexadentate N2,N’2′,O2-aminopyridylphenolate ligand. Can. J. Chem. 1999, 77, 2033–2038. [Google Scholar] [CrossRef]
  34. Janzen, D.E.; Patel, K.; VanDerveer, D.G.; Grant, G.J. π–π Interactions in diimine Pt(II) complexes with thiacrown ligands: The crystal structure of (1,4,7-trithiacyclononane)(3,4,7,8-tetramethyl-1, 10-phenanthroline)platinum(II) hexafluorophosphate. J. Chem. Crystallogr. 2006, 36, 83–91. [Google Scholar] [CrossRef]
  35. Amani, V.; Safari, N.; Khavasi, H.R.; Mirzaei, P. Iron(III) mixed-ligand complexes: Synthesis, characterization and crystal structure determination of iron(III) hetero-ligand complexes containing 1,10-phenanthroline, 2,2′-bipyridine, chloride and dimethyl sulfoxide, [Fe(phen)Cl3(DMSO)] and [Fe(bipy)Cl3(DMSO)]. Polyhedron 2007, 26, 4908–4914. [Google Scholar]
  36. Mukherjee, G.N.; Das, A. Mixed ligand complex formation of FeIII with boric acid and typical N-donor multidentate ligands. J. Chem. Sci. 2002, 114, 163–174. [Google Scholar] [CrossRef] [Green Version]
  37. Alexander, R.D.; Buisson, D.H.; Dudeney, A.W.L.; Irving, R.J. Spectrophotometric investigations of aqueous solutions at elevated temperatures. Effect of temperature on the stability constants of the tris complexes of 1,10-phenanthroline, 5-nitro-1,10-phenanthroline and 2,2[prime or minute]-bipyridyl with iron (II). J. Chem. Soc. Faraday Trans. 1 Phys. Chem. Condens. Phases 1978, 74, 1081–1088. [Google Scholar] [CrossRef]
  38. Anderegg, G. Pyridinderivate als Komplexbildner III. Komplexbildung des dreiwertigen Eisen-Ions mit 1,10-Phenanthrolin und α,α′-Dipyridyl. Helv. Chim. Acta 1962, 45, 1643–1657. [Google Scholar] [CrossRef]
  39. Mayer, U. Solvent effects on ion-pair equilibria. Coord. Chem. Rev. 1976, 21, 159–179. [Google Scholar] [CrossRef]
  40. Sreekanth, A.; Fun, H.-K.; Kurup, M.R.P. Structural and spectral studies of an iron(III) complex [Fe(Pranthas)2][FeCl4] derived from 2-acetylpyridine-N(4), N(4)-(butane-1, 4-diyl) thiosemicarbazone (HPranthas). J. Mol. Struct. 2005, 737, 61–67. [Google Scholar] [CrossRef]
  41. Sreekanth, A.; Kurup, M.R.P. Synthesis, EPR and Mössbauer spectral studies of new iron(III) complexes with 2-benzoylpyridine-N(4), N(4)-(butane-1,4-diyl) thiosemicarbazone (HBpypTsc): X-ray structure of [Fe(BpypTsc)2]FeCl4·2H2O and the free ligand. Polyhedron 2004, 23, 969–978. [Google Scholar] [CrossRef]
  42. Valicsek, Z.; Horváth, O. Application of the electronic spectra of porphyrins for analytical purposes: The effects of metal ions and structural distortions. Microchem. J. 2013, 107, 47–62. [Google Scholar] [CrossRef] [Green Version]
  43. Zafar, M.N.; Nazar, M.F.; Sumrra, S.H.; Gul-E-Saba; Yasmin, A.; Atif, A.H. Development of some important nitrogen donor ligands for transition metal homogeneous catalysis. Russ. J. Coord. Chem. 2016, 42, 225–251. [Google Scholar] [CrossRef]
  44. Nazeeruddin, M.K.; Kay, A.; Rodicio, I.; Humphry-Baker, R.; Mueller, E.; Liska, P.; Vlachopoulos, N.; Graetzel, M. Conversion of light to electricity by cis-X2bis(2,2′-bipyridyl-4,4′-dicarboxylate)ruthenium(II) charge-transfer sensitizers (X = Cl-, Br-, I-, CN-, and SCN-) on nanocrystalline titanium dioxide electrodes. J. Am. Chem. Soc. 1993, 115, 6382–6390. [Google Scholar] [CrossRef]
  45. The Original Spectral Data of Tris (2,2′-bipyridyl) Ruthenium (II) Complex Was Obtained from the Website. Available online: https://omlc.org/spectra/PhotochemCAD/html/085.htmlandusedwithpermisionofProfessorScottPrahl (accessed on 1 December 2021).
  46. Duan, L.; Bozoglian, F.; Mandal, S.; Stewart, B.; Privalov, T.; Llobet, A.; Sun, L. A molecular ruthenium catalyst with water-oxidation activity comparable to that of photosystem II. Nat. Chem. 2012, 4, 418–423. [Google Scholar] [CrossRef]
  47. Duan, L.; Xu, Y.; Zhang, P.; Wang, M.; Sun, L. Visible Light-Driven Water Oxidation by a Molecular Ruthenium Catalyst in Homogeneous System. Inorg. Chem. 2010, 49, 209–215. [Google Scholar] [CrossRef]
  48. Bozoglian, F.; Romain, S.; Ertem, M.Z.; Todorova, T.K.; Sens, C.; Mola, J.; Rodriguez, M.; Romero, I.; Benet-Buchholz, J.; Fontrodona, X. The Ru−Hbpp water oxidation catalyst. J. Am. Chem. Soc. 2009, 131, 15176–15187. [Google Scholar] [CrossRef]
  49. Pal, S. Syntheses, structures and properties of trans-dichlororuthenium(II) complexes with N4-donor Schiff bases. Polyhedron 2003, 22, 867–873. [Google Scholar] [CrossRef]
  50. Borgström, M.; Shaikh, N.; Johansson, O.; Anderlund, M.F.; Styring, S.; Åkermark, B.; Magnuson, A.; Hammarström, L. Light Induced Manganese Oxidation and Long-Lived Charge Separation in a Mn2II,II–RuII(bpy)3–Acceptor Triad. J. Am. Chem. Soc. 2005, 127, 17504–17515. [Google Scholar] [CrossRef] [PubMed]
  51. Alderighi, L.; Gans, P.; Ienco, A.; Peters, D.; Sabatini, A.; Vacca, A. Hyperquad simulation and speciation (HySS): A utility program for the investigation of equilibria involving soluble and partially soluble species. Coord. Chem. Rev. 1999, 184, 311–318. [Google Scholar] [CrossRef]
  52. Lever, A.B.P.; Mantovani, E. The far infrared and electronic spectra of mono(ethylenediamine) and related complexes of copper(II). An example of the trans effect, and the influence of axial interactions upon the in-plane bond strength. Inorg. Chim. Acta 1971, 5, 429–433. [Google Scholar] [CrossRef]
  53. Lever, A.B.P.; Mantovani, E. Isotopic Studies of the Metal–Ligand Bond. Part III. The Far Infrared Spectra of Some Tetragonal Diamine Complexes of Cobalt(II) and Nickel(II): Studies of the Metal–Nitrogen Bond, as a Function of Metal Ion and of Spin State. Can. J. Chem. 2011, 51, 1567–1581. [Google Scholar] [CrossRef]
  54. Sari, N.; Kahraman, E.; Sari, B.; Özgün, A. Synthesis of Some Polymer-Metal Complexes and Elucidation of their Structures. J. Macromol. Sci. 2006, 43. [Google Scholar] [CrossRef]
  55. Tsuchida, E.; Nishide, H. Polymer-metal complexes and their catalytic activity. In Molecular Properties; Springer: Berlin/Heidelberg, Germany, 1977; pp. 1–87. [Google Scholar]
  56. Singh, D.P.; Grover, V.; Kumar, R.; Jain, K. Template synthesis of macrocyclic complexes and their spectroscopic and antibacterial studies. J. Enzyme Inhib. Med. Chem. 2010, 25, 445–449. [Google Scholar] [CrossRef] [PubMed] [Green Version]
  57. Singh, D.P.; Kumar, R.; Singh, J. Antibacterial activity and spectral studies of trivalent chromium, manganese, iron macrocyclic complexes derived from oxalyldihydrazide and glyoxal. J. Enzyme Inhib. Med. Chem. 2009, 24, 883–889. [Google Scholar] [CrossRef] [Green Version]
  58. Murakami, Y.; Matsuda, Y.; Sakata, K.; Harada, K. Transition-metal Complexes of Pyrrole Pigments. IX. Divalent and Trivalent Iron Chelates of Dipyrromethenes. Bull. Chem. Soc. Jpn. 1974, 47, 458–462. [Google Scholar] [CrossRef] [Green Version]
  59. Singh, D.P.; Kumar, R.; Singh, J. Synthesis and spectroscopic studies of biologically active compounds derived from oxalyldihydrazide and benzil, and their Cr(III), Fe(III) and Mn(III) complexes. Eur. J. Med. Chem. 2009, 44, 1731–1736. [Google Scholar] [CrossRef]
  60. Likussar, W. Computer approach to the continuous variations method for spectrophotometric determination of extraction and formation constants. Anal. Chem. 1973, 45, 1926–1931. [Google Scholar] [CrossRef]
  61. Segoviano-Garfias, J.J.N.; Nájera-Lara, M.; Pérez-Arredondo, M.d.l.L.; López-Ramírez, V.; Rubio-Jimenez, C.A.; Ramírez-Vázquez, J.A.; Moreno-Esparza, R. Spectrophotometric determination of formation constants of copper(II) complexes with 2,2′-bipyridyl, 1,10-phenanthroline and their halides in methanol. J. Mol. Struct. 2017, 1147, 217–225. [Google Scholar] [CrossRef]
Figure 1. Calculated electronic spectra of the iron(III)–1,2-diaminoethane species in methanol. (1) Fe3+; (2) [Fe(en)]3+; (3) [Fe(en)2]3+.
Chemistry 04 00050 g001
Figure 2. Calculated electronic spectra of the iron(III)–1,3-propanediamine species in methanol. (1) Fe3+; (4) [Fe(pn)]3+; (5) [Fe(pn)2]3+.
Chemistry 04 00050 g002
Figure 3. Calculated electronic spectra of the iron(III)–1,4-butanediamine species in methanol. (1) Fe3+; (6) [Fe(bn)]3+; (7) [Fe(bn)2]3+.
Chemistry 04 00050 g003
Figure 4. Calculated electronic spectra of the mono complexes with Fe3+ and bipy, dmbipy, and dtbbipy in methanol: (1) Fe3+; (8) [Fe(bipy)]3+; (9) [Fe(dmbipy)]3+; (10) [Fe(dtbbipy)]3+.
Chemistry 04 00050 g004
Figure 5. Calculated electronic spectra of the bis complexes of Fe3+ and bipy, dmbipy and dtbbipy in methanol. (1) Fe3+; (11) [Fe(bipy)2]3+; (12) [Fe(dmbipy)2]3+; (13) [Fe(dtbbipy)2]3+.
Chemistry 04 00050 g005
Figure 6. Calculated electronic spectra of the mono complexes of Fe3+, phen, and tmphen in methanol: (1) Fe3+; (14) [Fe(phen)]3+; (15) [Fe(tmphen)]3+.
Chemistry 04 00050 g006
Figure 7. Calculated electronic spectra of the bis complexes of Fe3+ with phen and tmphen in methanol: (1) Fe3+; (16) [Fe(phen)2]3+; (17) [Fe(tmphen)2]3+.
Chemistry 04 00050 g007
Figure 8. Calculated electronic spectra of the tris complexes of Fe3+ with bipy and phen in methanol: (18) [Fe(bipy)3]3+; (19) [Fe(phen)3]3+; (20) [Ru(bipy)3]2+ [45].
Chemistry 04 00050 g008
Scheme 1. Procedure for the synthesis of the different iron(III) complexes.
Chemistry 04 00050 sch001
Publisher’s Note: MDPI stays neutral with regard to jurisdictional claims in published maps and institutional affiliations.

