

A Novel Internet of Things-Based System for Ten-Pin Bowling


Computer Science Department, Aristotle University of Thessaloniki, 541 24 Thessaloniki, Greece
*
Author to whom correspondence should be addressed.
IoT 2023, 4(4), 514-533; https://doi.org/10.3390/iot4040022
Submission received: 1 October 2023
/
Revised: 21 October 2023
/
Accepted: 25 October 2023
/
Published: 31 October 2023
(This article belongs to the Topic Machine Learning in Internet of Things)
Abstract
:Bowling is a target sport that is popular among all age groups with professionals and amateur players. Delivering an accurate and consistent bowling throw into the lane requires the incorporation of motion techniques. Consequently, this research presents a novel IoT Cloud-based system for providing real-time monitoring and coaching services to bowling athletes. The system includes two inertial measurement units (IMUs) sensors for capturing motion data, a mobile application, and a Cloud server for processing the data. First, the quality of each phase of a throw is assessed using a Dynamic Time Warping (DTW)-based algorithm. Second, an on-device-level technique is proposed to identify common bowling errors. Finally, an SVM classification model is employed for assessing the skill level of bowler athletes. We recruited nine right-handed bowlers to perform 50 throws wearing the two sensors and using the proposed system. The results of our experiments suggest that the proposed system can effectively and efficiently assess the quality of the throw, detect common bowling errors, and classify the skill level of the bowler.
1. Introduction
The emerging era of the Internet of Things (IoT) has revolutionized the sports industry by providing monitoring tools and mechanisms for sports performance analysis. IoT-enabled solutions, coupled with wearable technologies, machine learning, and big data techniques, allow athletes and coaches to estimate performance capabilities, measure efficiency, and develop effective training strategies. Due to the plethora of opportunities for the IoT in the smart sports industry, sports performance analysis systems have attracted considerable research attention. Sports such as basketball, tennis, swimming, skiing, and rowing are some of the activities researched for performance analysis with IoT technologies [1,2]. One activity that has not received much attention from researchers is ten-pin bowling. Ten-pin bowling is one of the main five bowling sports variations, namely nine-pin, candle-pin, duck-pin, and five-pin bowling. The goal of this activity is to knock down ten pins (which are positioned at the end of an alley) using a bowling ball. It can be played by amateurs or professionals of almost all age groups and both genders. These facts make bowling one of the most popular target sports in the world.
Although the objective of ten-pin bowling seems to be an easy task, bowlers need to incorporate fundamental concepts and techniques into their games to deliver good performance. The five- and four-step approaches are the two main techniques used by bowlers. These two techniques accurately define the motion of a bowler during a ball delivery and facilitate them in performing an accurate and consistent throw. The synchronization between the swing arm and the gait of a bowler is the main contribution of the two approaches to delivering an accurate throw. Fundamental concepts such as flexibility, balance, timing, and stamina are common to all bowlers. It has been demonstrated that professional and semi-professional bowlers have unique anthropocentric and strength characteristics compared to non-bowlers [3]. These characteristics are developed through the practice of efficient movement techniques. To achieve better performance, bowlers and coaches need to monitor these motion techniques during the training process to assess performance and identify and correct errors.
Despite the importance of monitoring and reporting the quality of motion in bowling, there are few tools available for athletes and coaches. The existing systems depend on infrastructure-based technologies such as LiDAR sensors [4] and high-frame-rate cameras [5]. They mostly provide feedback about the trajectory of the ball into the lane, omitting motion technique-related information. In addition, these systems are expensive and unaffordable for individual bowlers. Hence, these systems are not suitable for monitoring and assessing the quality of bowlers’ motion techniques.
In this work, we propose a novel IoT-based system designed to monitor and assess bowlers’ training performance using commercial inertial measurement units (IMUs) and Cloud technology. Two sensors are positioned on the bowler’s wrist and leg and stream data through Bluetooth Low Energy (BLE) to a mobile device. The mobile device utilizes the sensor’s data to provide real-time feedback on the quality of throws and detect errors related to motion techniques. Users can upload and share their performance with other users through a Cloud server. Moreover, we use a machine learning model to distinguish the skill levels of bowlers between experts, intermediates, and novices. The proposed machine learning model is deployed on the Cloud server. Our experiments show that the proposed system can effectively detect errors in bowlers’ motion techniques, reaching a precision of 90% and a recall of 84%. We also proved that our system efficiently assesses the quality of throws and characterizes the skill level of bowlers (87% prediction accuracy). To summarize, the main contributions of this study are as follows:
- A novel IoT and Cloud-based system for assessing and monitoring the motion performance of bowlers. In comparison with existing commercial solutions, the proposed system does not depend on infrastructure-based technologies and, to the best of our knowledge, is the first to use bowler’s motion characteristics to assess motion performance and provide real-time feedback.
- An efficient on-device-level technique for identifying common bowling errors and assessing the motion quality of bowlers.
- An SVM-based model, deployed on a Cloud infrastructure for classifying the skill levels of players.
The paper is organized as follows. Section 1.1 presents an overview of the related literature. Section 1.2 describes motion techniques and common errors for a bowling throw. Section 2 presents the materials and the methods of the proposed system, which includes sensors, data preprocessing, quality assessment, error detection, and skill assessment. Section 3 reports the experimental results. Section 4 and Section 5 discuss the results and provide the conclusion for this study.
1.1. Related Work
Section 1.1.1 shows how other researchers applied wearable computing in other sports and physical activities, such as baseball, skiing, and swimming. Section 1.1.2 shows studies that have examined the use of technologies in ten-pin bowling.
1.1.1. Wearable Computing in Sports
Monitoring and assessing athletes’ performance for arm movement-related activities, such as tennis, cricket, golf, and strength training, has been an area of research in many recent studies [6,7,8,9,10,11]. Several studies have also examined the usage of IMU sensors in sports. For example, the authors in [12] introduced the concept of a wearable assistant for swimmers. Using acceleration sensors, they monitor a wide range of swim parameters, including swimming velocity, time per lane, and the number of strokes. These parameters and swim style-specific factors, such as body balance and body rotation, are used to monitor swim performance and provide feedback to the athlete. In [13], the authors proposed a new framework for skill assessment, activity recognition, and motion detection. Raw motion data (three-axis acceleration) collected with IMUs are used to train an SVM classifier for movement classification and activity recognition. In addition, a second SVM classifier was trained to provide confidence scores for skill assessment. The effectiveness of the aforementioned classifiers was examined in two case studies: (1) automated scoring in gymnastics and (2) surgical skill assessment. The achieved results showed that their proposed framework has high assessment accuracy. In [14], the authors proposed a metric called the LAX-Score to quantify the athletic performance of a lacrosse team. The proposed metric was statistically validated on IMU and biometric data obtained from a lacrosse team over the course of a season. They investigated the correlation between the extracted data features (obtained with the sensors) and the proposed performance metric. Their analysis suggested that some features have a greater impact on the athlete’s performance than others. The system in [15] uses accelerometer and gyroscope data to train a classifier and recognize left and right alpine ski turns. The authors in [16] developed a weight-lifting assistant that uses motion sensors mounted on the athlete’s body and provides qualitative feedback on the user’s performance. The authors in [17] proposed a mistake-driven skill estimation approach in Nordic Walking using IMUs. The presented approach assesses three mistakes related to the athlete’s stride. A Bayesian Ridge Regression model was trained for each mistake type and used to estimate the movement skill of the athlete. The skill estimation approach was evaluated using 10 Nordic Walking beginners, with their results suggesting that all mistakes can be estimated with a normalized RMSE of 24.15%. The authors in [18] have introduced a wearable technology designed for monitoring and assessing athletes’ performance and health during various sports activities. This wearable device, designed to be comfortably worn on the wrist, offers a comprehensive solution for tracking and recording crucial biometric and movement information. Notably, it is equipped to monitor skin temperature and pulse rate, while simultaneously capturing arm movements and detecting specific gestures through an integrated inertial measurement unit (IMU). This multifunctional device finds applications across both professional and amateur sports activities, making it a valuable tool for athletes and health enthusiasts alike. The authors in [19] focus on basketball training using wearables. In their study, they emphasize the importance of fundamental skill development for rookie basketball players and propose a smart activity recognition system that utilizes IoT-based edge-Cloud technology and a swarm intelligence-based feature selection algorithm, named Adaptive Binary Particle Swarm Optimization (ABPSO). This system is designed to automatically collect and process basketball players’ action signals, using a comprehensive feature set of 300 features to capture the characteristics of different activities. ABPSO, with its global search ability, identifies the optimal feature subset combined with classifiers to achieve accurate activity recognition. The results of experiments conducted on nine human subjects demonstrate an impressive average accuracy of 97.26% for five fundamental basketball activities, outperforming several state-of-the-art feature selection algorithms and methods.
1.1.2. Ten-Pin Bowling Research
A few studies have examined the use of technologies in bowling sports. Hung et al. [20] developed an artificial neural network model for predicting the bowlers’ knee forces during a throw. Investigating and monitoring the forces of the lower limbs can help prevent injuries. Joint forces related to the lower limb motion were estimated from Euler angles using inverse dynamics methods. They trained an ANN model to predict knee forces using Euler angles obtained from a high-speed camera. The ground truth data were obtained using two force plates, and the accuracy of the model was determined by the coefficient of determination, which was found to be high for all experiments in the study. However, this system cannot assess the quality of bowlers’ techniques as it only relies on lower limb joint forces.
King et al. [21] presented a miniature wireless inertial measurement unit embedded in a bowling ball that can be used to deduce the dynamics of the ball. Acceleration and angular velocity data were wirelessly transmitted by the IMU during the bowler’s throw. The collected data were used to calculate the spin dynamics of the ball, which are essential for measuring the performance of the release phase. Unlike our study, arm swing motion and gait characteristics were not taken into account in this type of system, which means that it cannot measure the complete motion performance. Moreover, the use of sensors within a bowl raises several practical concerns, such as the conformance of the bowl with standard official match rules.
Tung Mun Hon [22] developed an interactive graphical user interface LabVIEW program, which can be used to visualize data related to the arm swing motion. The data were obtained from an IMU sensor, which was mounted on the bowler’s wrist. Angular velocity and roll Euler angles were used to derive the arm swing speed, time, and wrist pronation parameters. The three parameters were displayed on a LabVIEW program. However, this system leverages only a limited number of motion parameters; hence, it does not provide a comprehensive assessment of bowlers’ techniques. Moreover, using Euler angles to measure the pronation of the arm could cause the gimbal lock problem.
Finally, to the best of our knowledge, the proposed system is the first IoT-based approach in bowling sports that can assess the quality of a throw, identify motion errors, and characterize the skill level of bowlers.
1.2. Investigated Technique
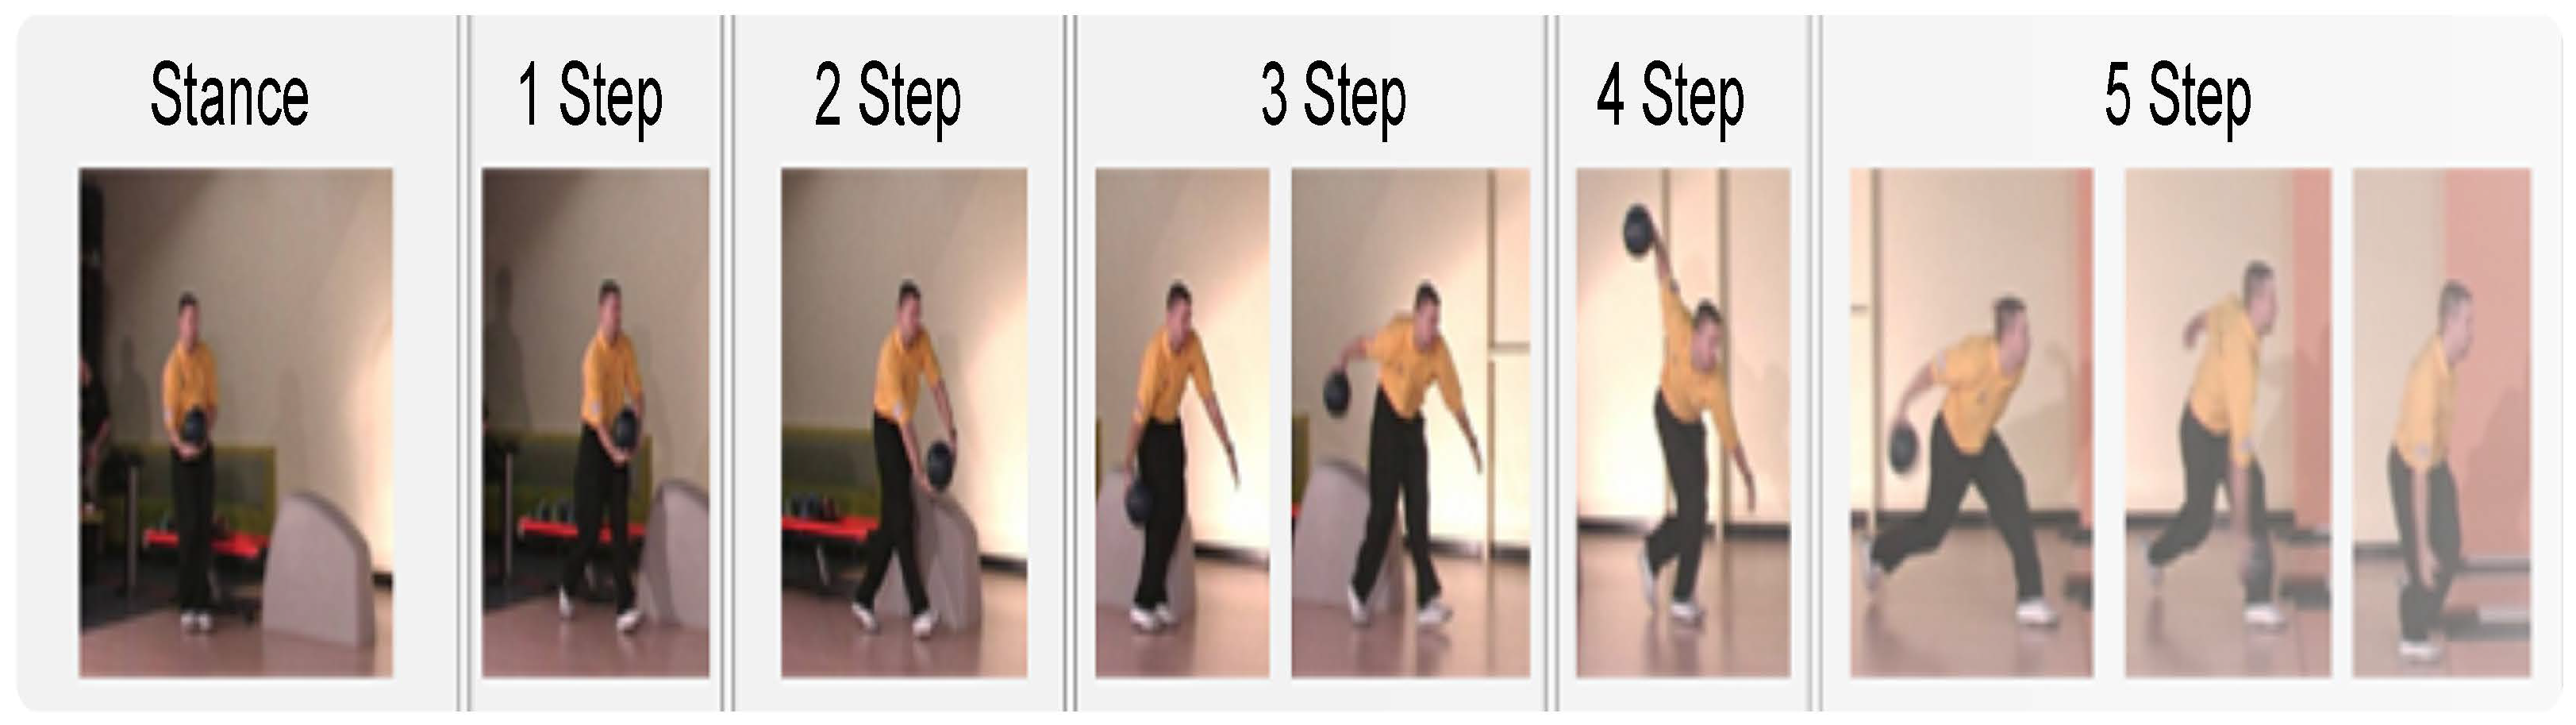
In this study, we focus on one of the most popular bowling movement techniques, namely the five-step approach, which can be performed by bowlers of all skill levels for a smooth delivery. Figure 1 depicts the phases of the five-step approach. Initially, the bowler holds the ball near the horizontal plane and aims it into the alley. It must be noted that the pendulum arm involves anterior and posterior movements in the vertical plane and pronation/supination of the wrist. As the name of the technique suggests, the bowler performs five normal steps with simultaneous motion of the dominant arm (the arm that holds the ball). The synchronized motion sequence of the legs and the pendulum arm play a significant role in a successful ball delivery [23]. Although this motion sequence is unique for each bowler and derived from their style, there are some key elements that are common to all athletes. The swing motion of the arm during the third and fifth steps (gait with the non-bowling leg) is independent of the bowler’s style and is the main element that affects the timing and accuracy of the throw. It is a common practice among coaches to evaluate the quality of a throw by using the position of the arm during these phases. For instance, a wrong arm swing during the third step could indicate a problem with the bowler’s timing. Thus, in our approach, to assess the quality of a throw, we focus on arm swing motion during the synchronized movement of the non-bowling leg.
There are many errors that may occur during a bowling throw [24] (see Section 5). The identification of these errors is an important task for bowlers and coaches to achieve good performance. However, due to various parameters associated with bowlers’ motion technique, it is infeasible to examine every possible error. Thus, we select four errors in our study, which are described below:
- Error 1: The gait speed of the non-bowling foot is too fast or too slow. On the five-step approach, the speed of the non-bowling foot is important for delivering an accurate throw. Bowlers with the wrong gait speed tend to have a lack of fluid motion and erratic ball delivery.
- Error 2: The backswing (the maximum angle of the arm swing) is too high or too low. A high backswing may lead to a ball delivery with too much speed and possibly an inaccurate throw. Conversely, a low backswing may lead to a forced release of the ball due to the low speed of the arm swing.
- Error 3: The overall delivery is too fast or too slow. The arm swing speed and the synchronized motion of the legs are significant factors for an accurate ball delivery. A fast or slow ball delivery may lead to a throw with poor timing or inconsistent release. A common practice to identify this error is to measure the position of the swing arm during the last step in relation to the non-bowling foot when the latter stops moving. If the position of the swing arm is behind the stationary non-bowling foot, the bowler has performed a throw with late timing. Conversely, if the position of the swing arm is in front of the non-bowling foot, then the bowler has performed a throw with early timing. A throw with late or early timing may indicate a delivery that has been performed too fast and too slow, respectively.
- Error 4: The ball path and direction of the throw are inconsistent. This error is often caused by unfavorable positioning of the ball in the stance phase. Performing such throws may also lead to inconsistent timing on the early steps of the bowler. Similar to Error 3, coaches measure the position of the swing arm during the third step in relation to the non-bowling foot in order to classify the throw’s timing. If the swing arm is positioned in front of the non-bowling foot when the third step completes (the non-bowling foot is in contact with the ground), then the first steps of a throw have timing issues.
These four errors are specifically selected and verified by our bowling experts because they are commonly observed and may be the manifestation of an athlete’s wrong approach to throwing. Removing these errors from one’s move assures a much better technique and overall performance.
2. Material and Methods
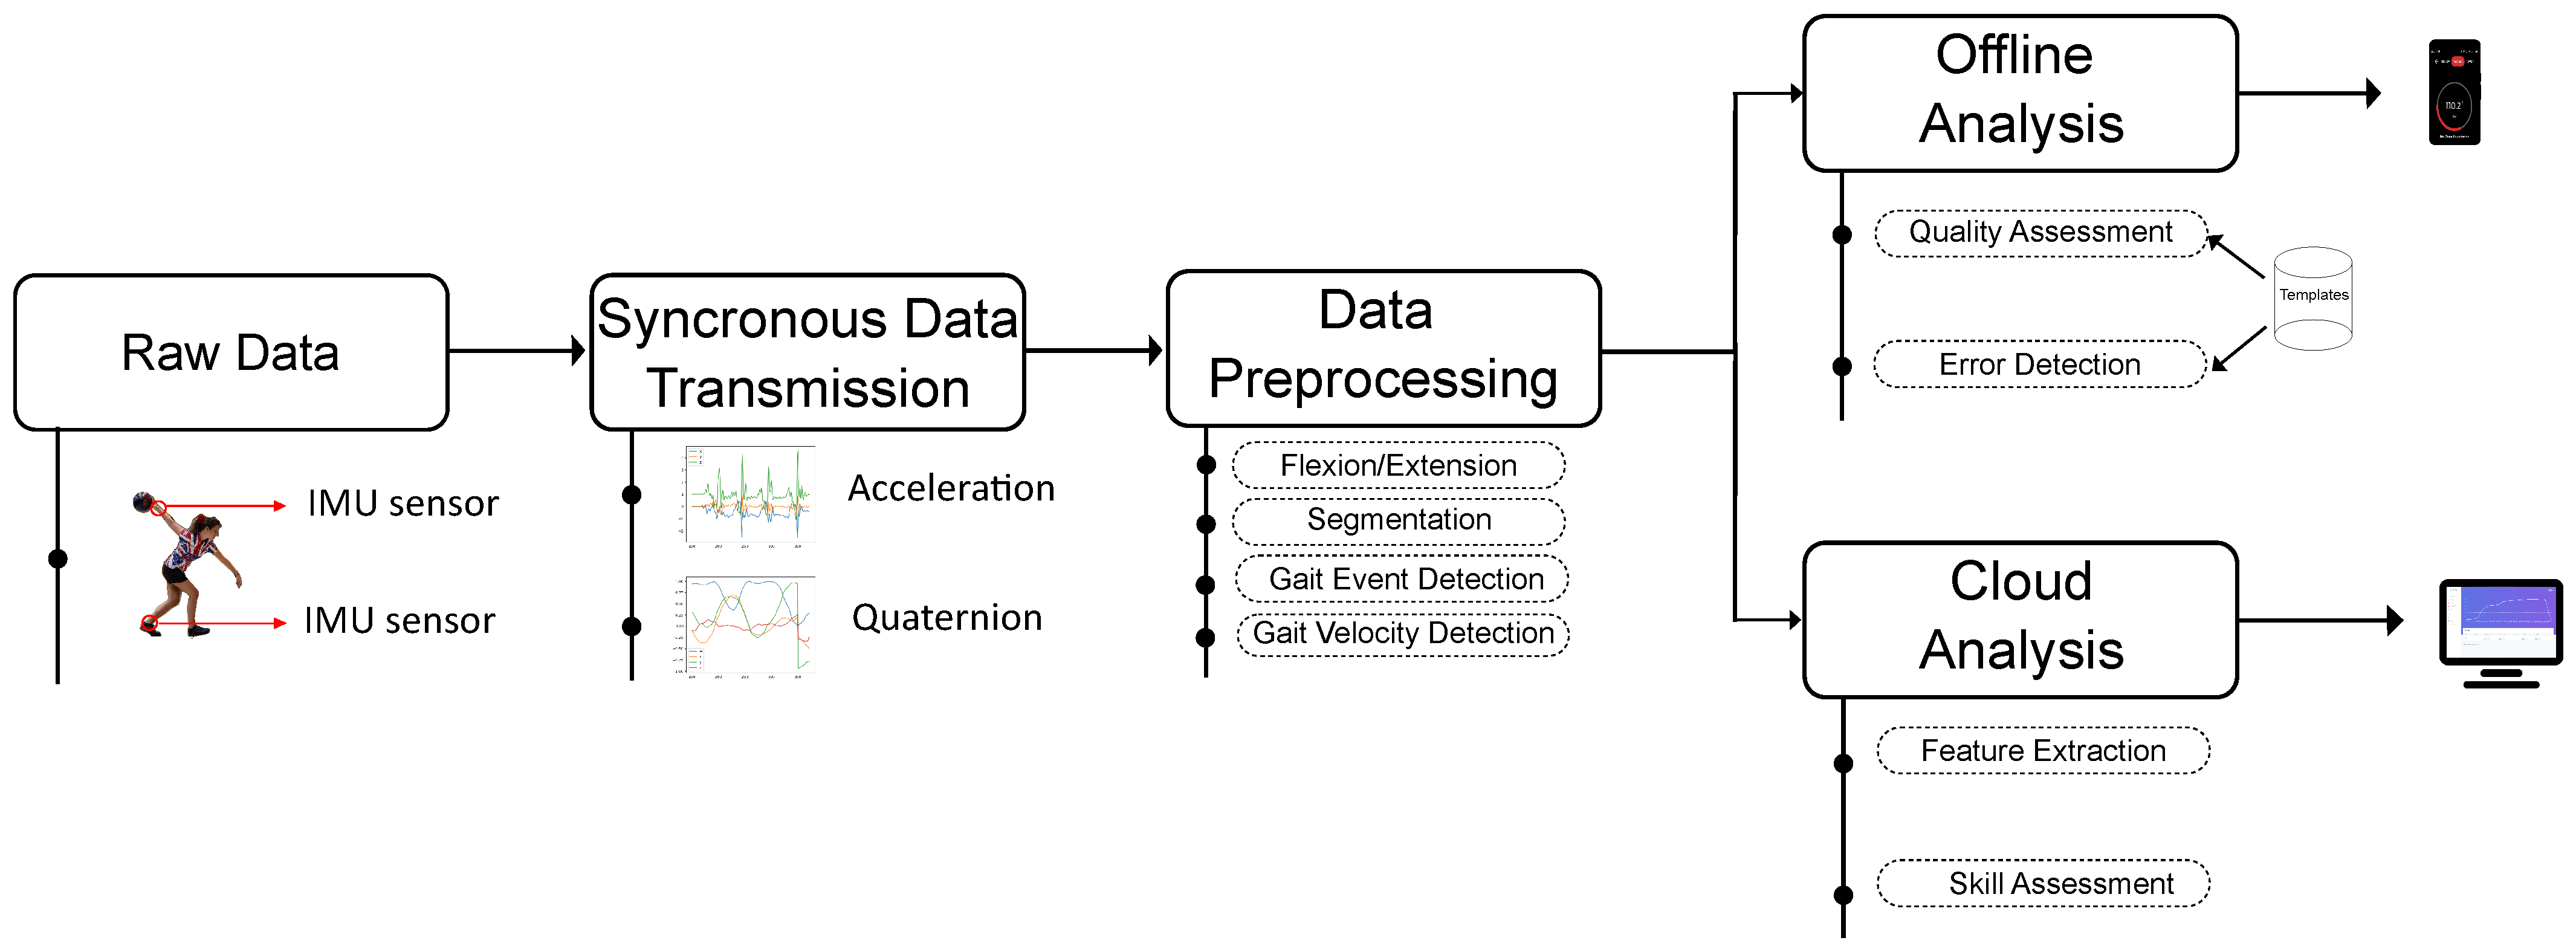
Figure 2 presents an overview of the proposed workflow of our system. The workflow is comprised mainly of three stages, which are (i) data preprocessing, (ii) quality assessment and error detection, and (iii) skill assessment. After the transmission of the synchronized data to the mobile device, data preprocessing is performed to extract the swing angle, segment the data, and detect gait events and velocity. The system assesses the quality of the throw and detects common bowling errors, using the synchronized swing angle and gait data events for the corresponding segment. Similarly, the system assesses the skill level of the bowler using a supervised machine learning workflow. The following subsections provide details about the materials and methods of our research.
2.1. Materials
2.1.1. Sensors
There are many commercially available wearable wireless IMU sensors used for monitoring health problems, assessing performance, detecting daily human motion activities, and conducting research. The primary factors influencing the selection of wearable sensors were increased autonomy and support for synchronized streaming from multiple sensors. For our proposed system, we adopted a widely used Bluetooth Low Energy-based IMU sensor, namely MetaMotion RTM [25]. This sensor features a small chip size and power-efficient streaming functionality.
The MetaMotion RTM sensor can accurately measure three-axis acceleration or quaternion and stream real-time data through Bluetooth 5.0 to a mobile device. It is equipped with a 32-bit ARM Cortex-M4F and nRF52832 BLE SoC, powered by a Lithium-Ion Polymer rechargeable battery. Acceleration data are obtained from the internal BMI160 Accelerometer module with an amplitude of ±2 g and a frequency of 50 Hz. Quaternion data are acquired using the firmware-enabled 9-axis sensor fusion module, which fuses measurements from the accelerometer and gyroscope sensors (IMUPlus mode). The sampling rate of the sensor fusion matches the frequency of the accelerometer sensor, which is 50 Hz. These sensors come factory-calibrated, eliminating the need for further calibration in our experiments. The board dimensions are 27 mm width × 27 mm length × 4 mm height (Figure 3), and it fits into a rectangular plastic case.
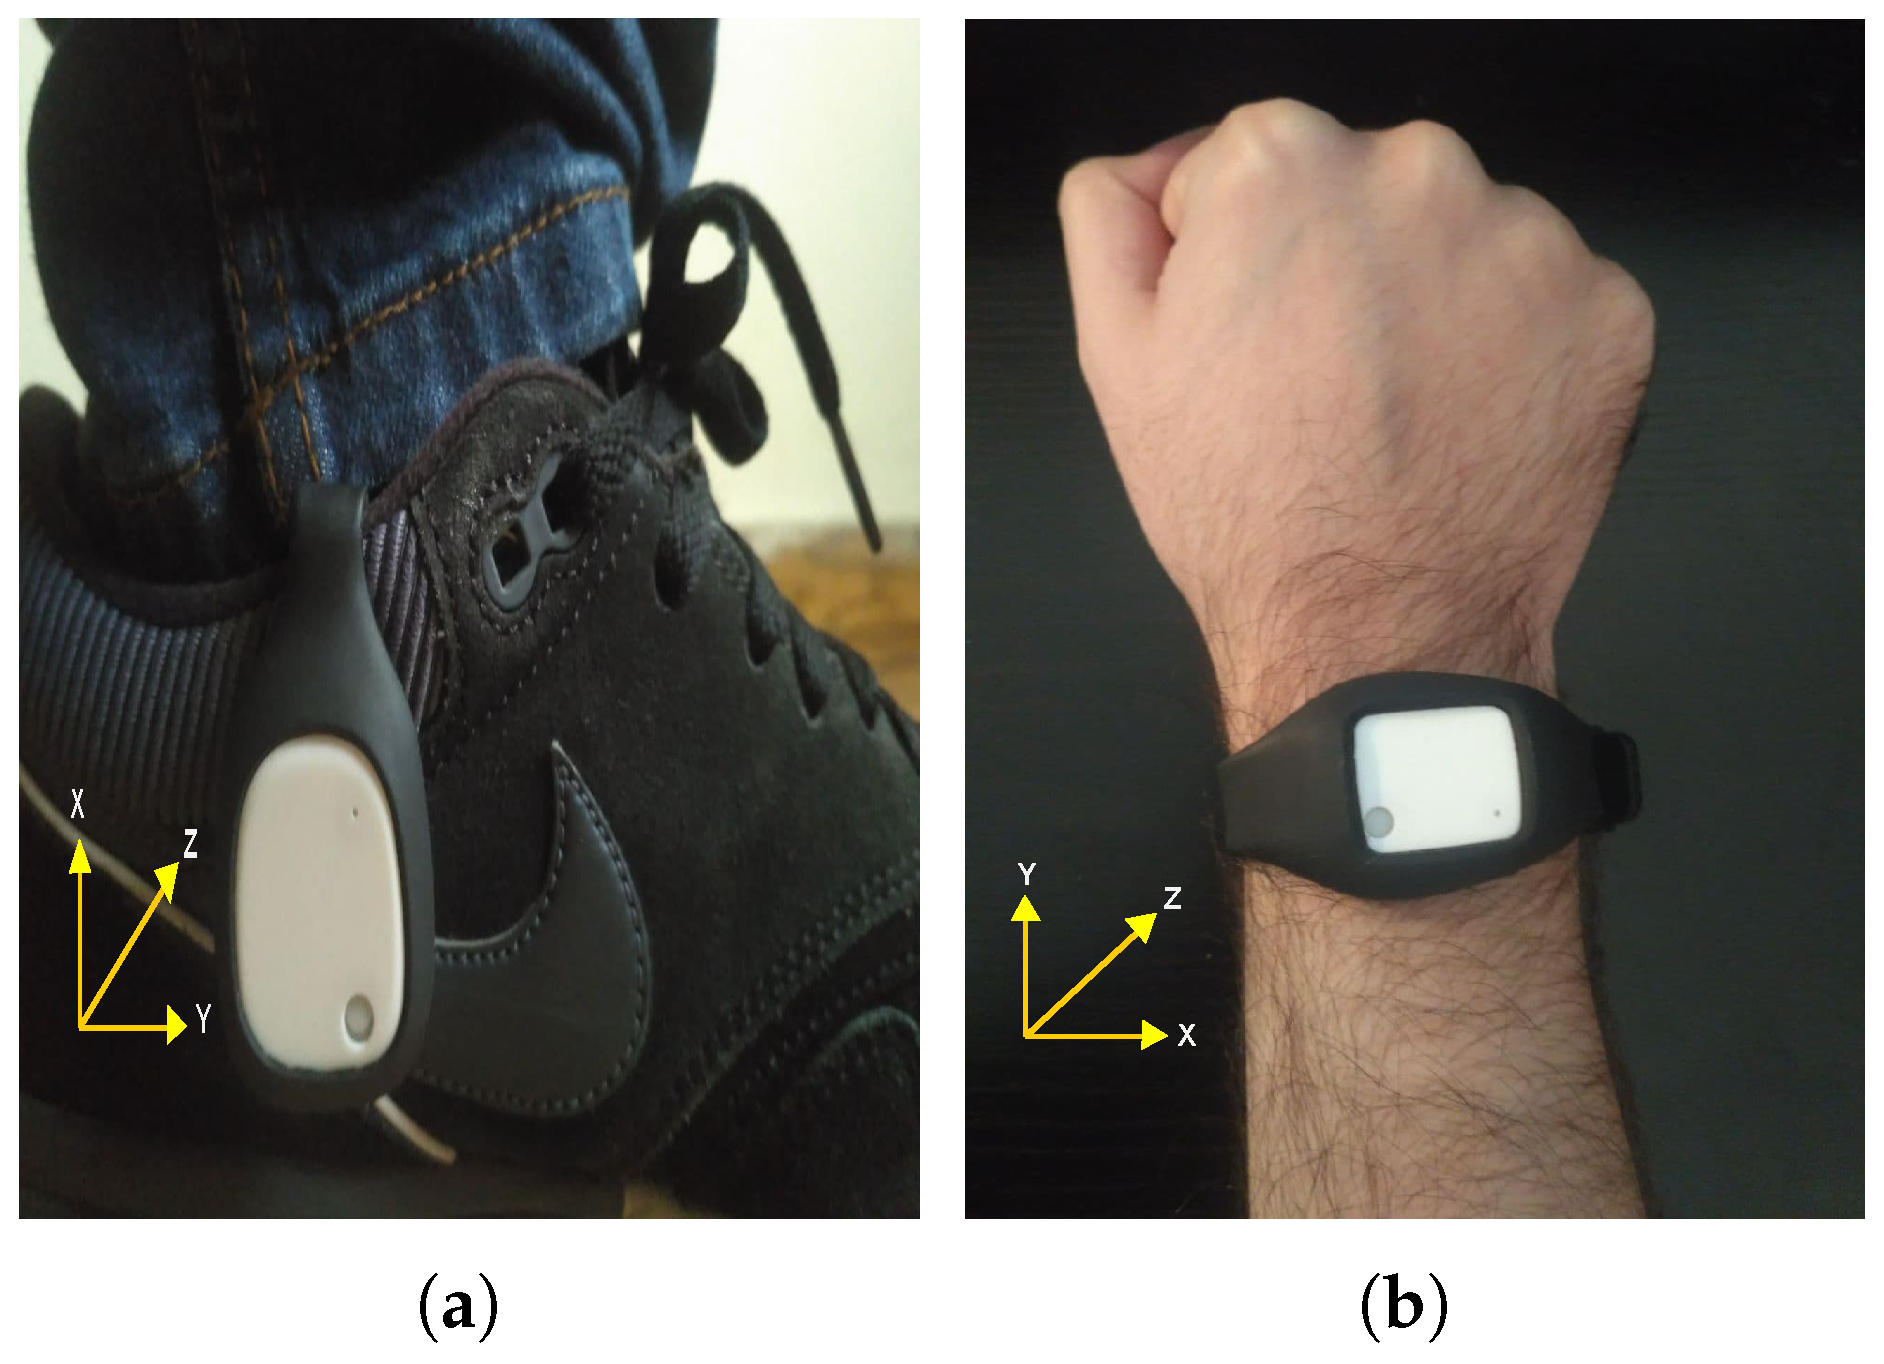
The system consists of two MetaMotion R sensor nodes, placed on the hand and leg of a bowler athlete. The accuracy of the results depends largely on the position and orientation of these two sensors. According to [26], the optimal location for placing an IMU sensor to extract gait features with a 50 Hz sampling rate is the medial aspect of the foot over the bony prominence, followed closely by the second location, the Achilles tendon. Therefore, for the sensor responsible for gait data acquisition, we chose to position it at the medial aspect of the foot. We used a rubber clip-on to adjust and attach the sensor to the bowler’s sliding leg, as shown in Figure 3a. The second sensor is attached to the bowler’s wrist to acquire data related to arm swing movement, and we used an elastic wristband to secure the sensor on the bowler’s wrist (Figure 3b).
Finally, to evaluate our system and the received sensor data, we employed a high-frame-rate camera. We determined that 120 fps was sufficient to capture and freeze the motion of a fast bowler. Consequently, we utilized a high-speed camera to record the bowler’s movements during the data collection procedure.
2.1.2. Cloud
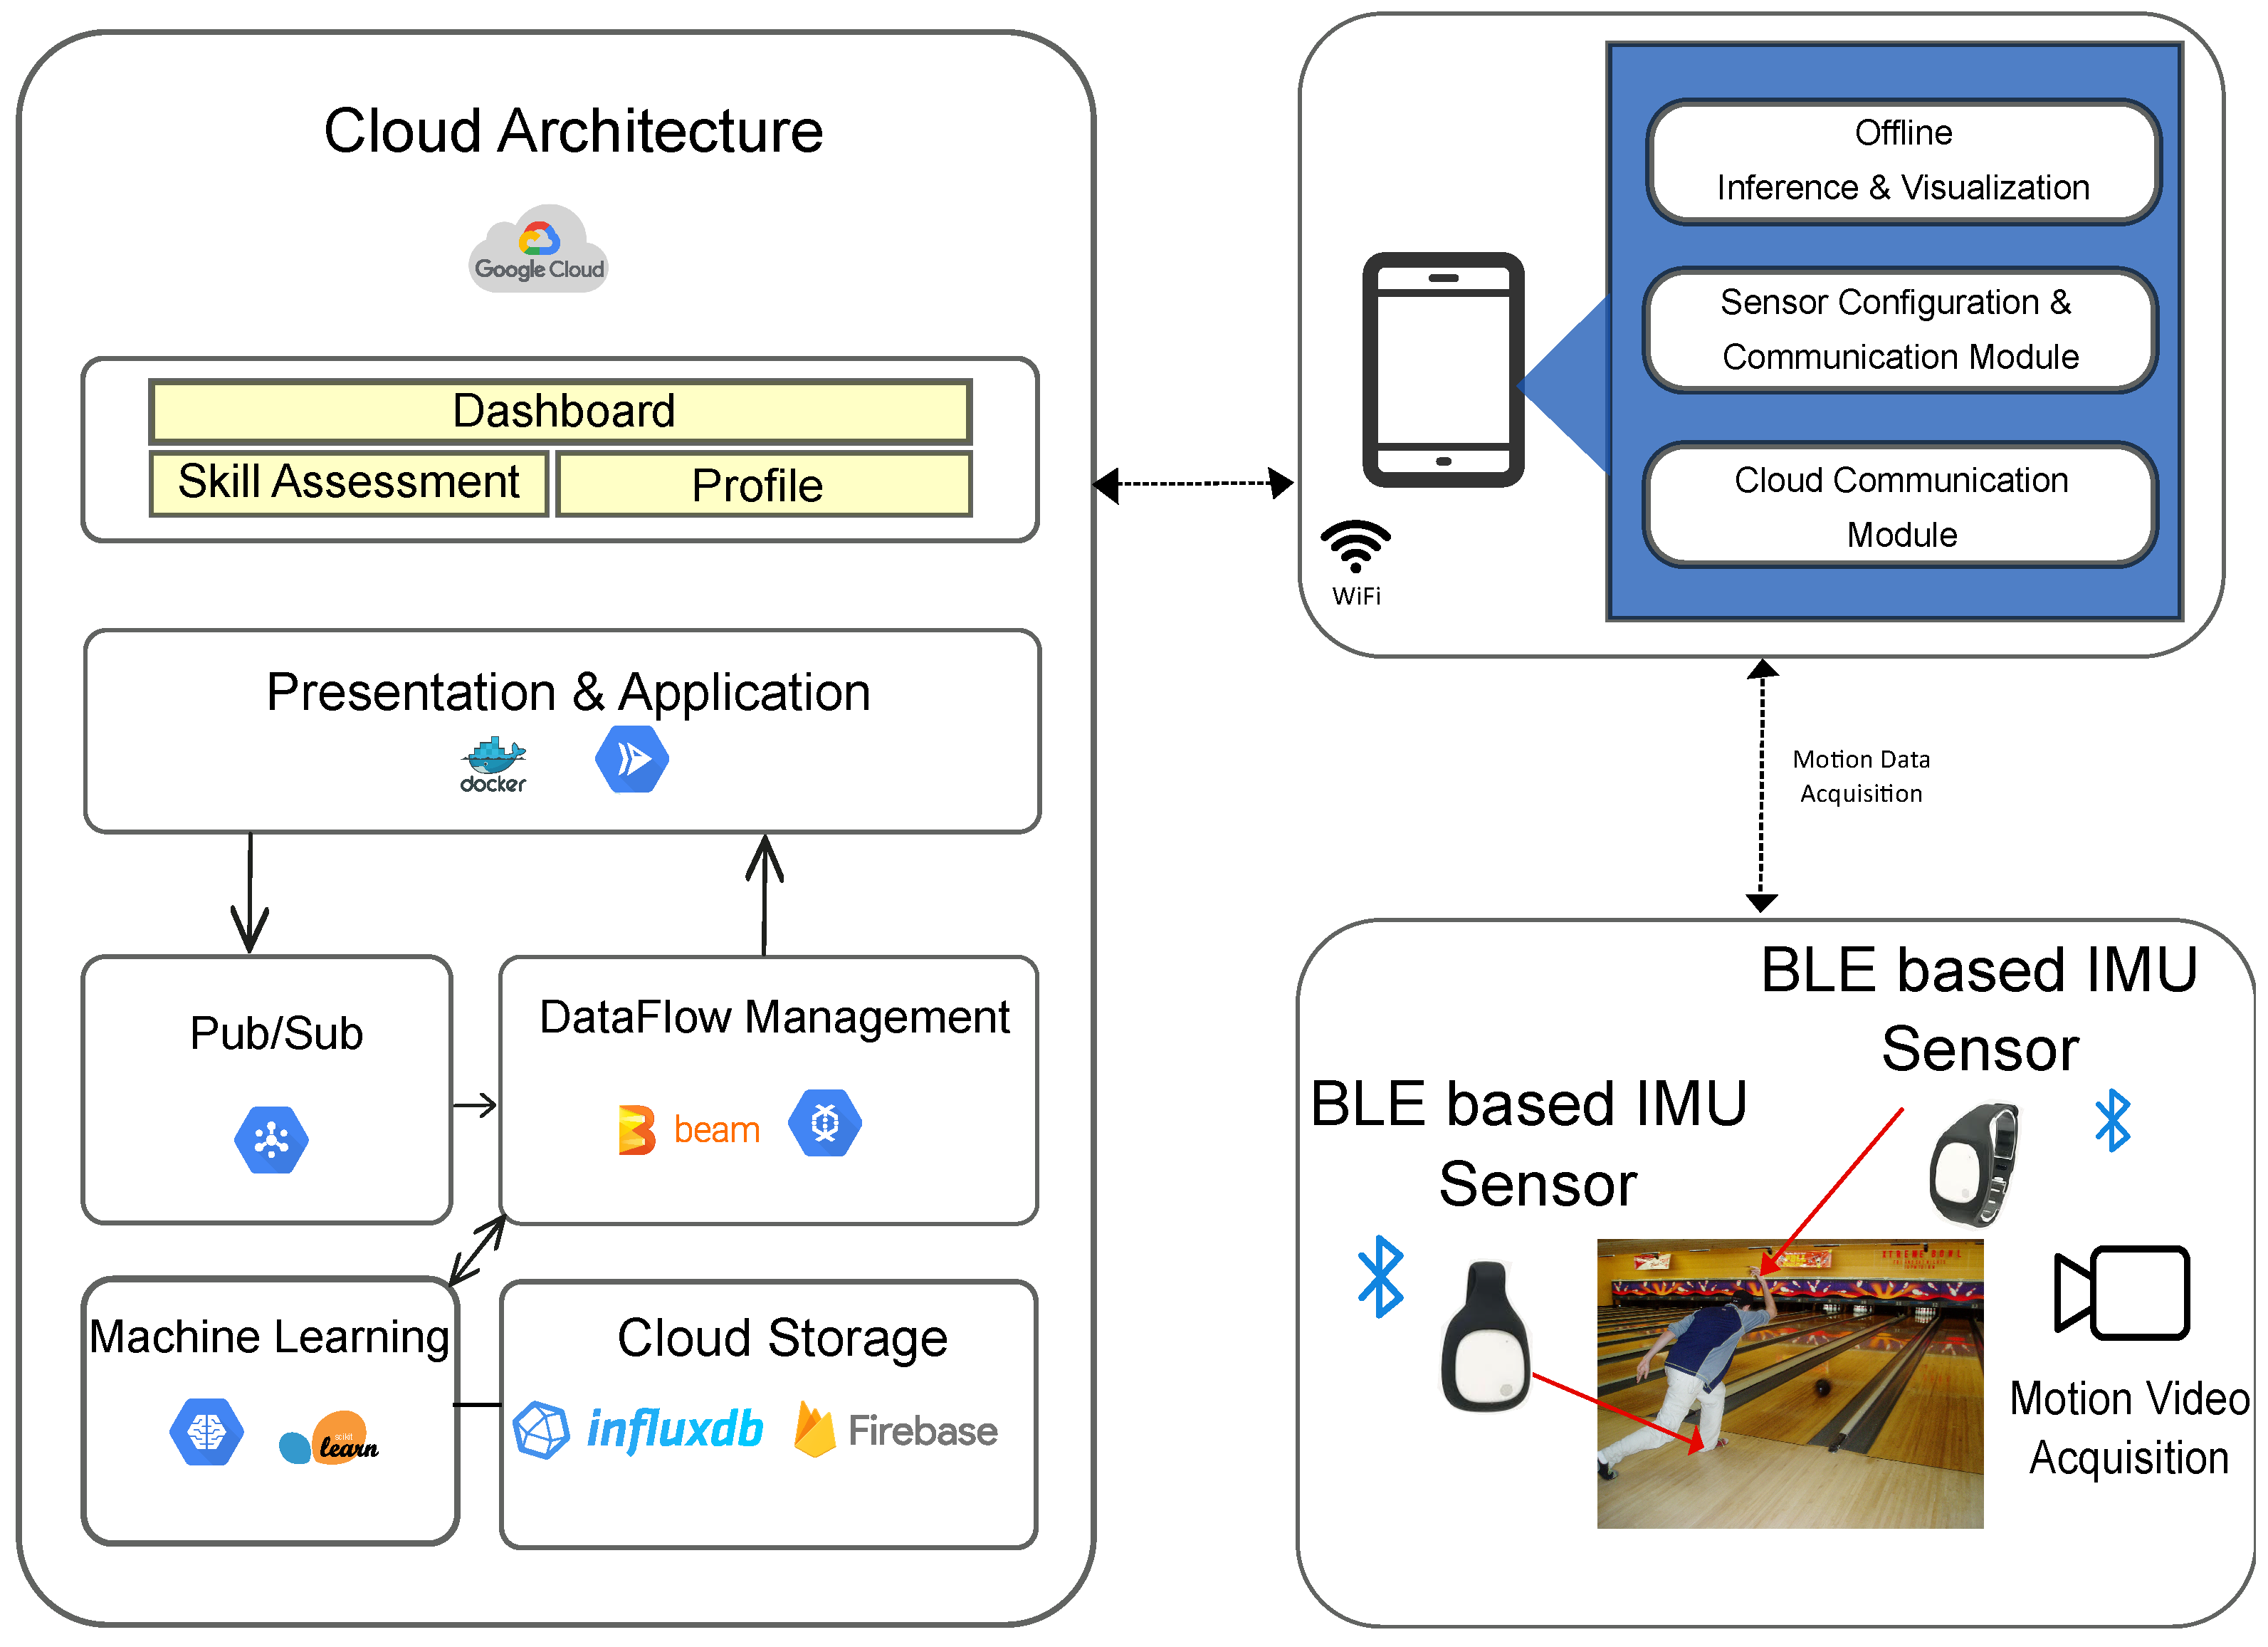
To store, process, and analyze users’ data in an efficient and scalable way, we utilize the Google Cloud Platform. The purpose of our Cloud solution is two-pronged: the skill assessment of the bowlers using a machine learning model and the visual feedback of their performance via a web dashboard. Figure 4 (left) shows the different stages and services that have been used for the proposed Cloud solution.
To manage and execute applications on the Cloud server, we used Cloud Run, a fully managed platform that allows us to run stateless HTTP Docker containers. The process of acquiring and importing data on a server is called ingestion [27]. Pub/Sub is the ingestion service that is used as a message-oriented middleware, offering an asynchronous way to deliver data on the Cloud server. This service integrates Cloud Run with the next component of our Cloud architecture, which is Dataflow. Dataflow service provides operations for executing data processing patterns, such as extract-transform-load (ETL), using the open-source programming model Apache Beam. In our solution, this service is responsible for receiving data from Pub/Sub, extracting features related to the bowler’s data, and integrating a machine-learning component. Scikit-learn is used to train and test our machine learning model locally while the AI Platform is used to deploy and get predictions on the Cloud. Finally, when it comes to Cloud data storage, two databases have been used. To store sensor data, we used InfluxDB, a scalable database optimized for time series data. The user’s profile information and the results of skill and throw quality assessment are stored in Firestore, which is a NoSQL database.
2.2. Methods
2.2.1. Swing Angle and Segmentation
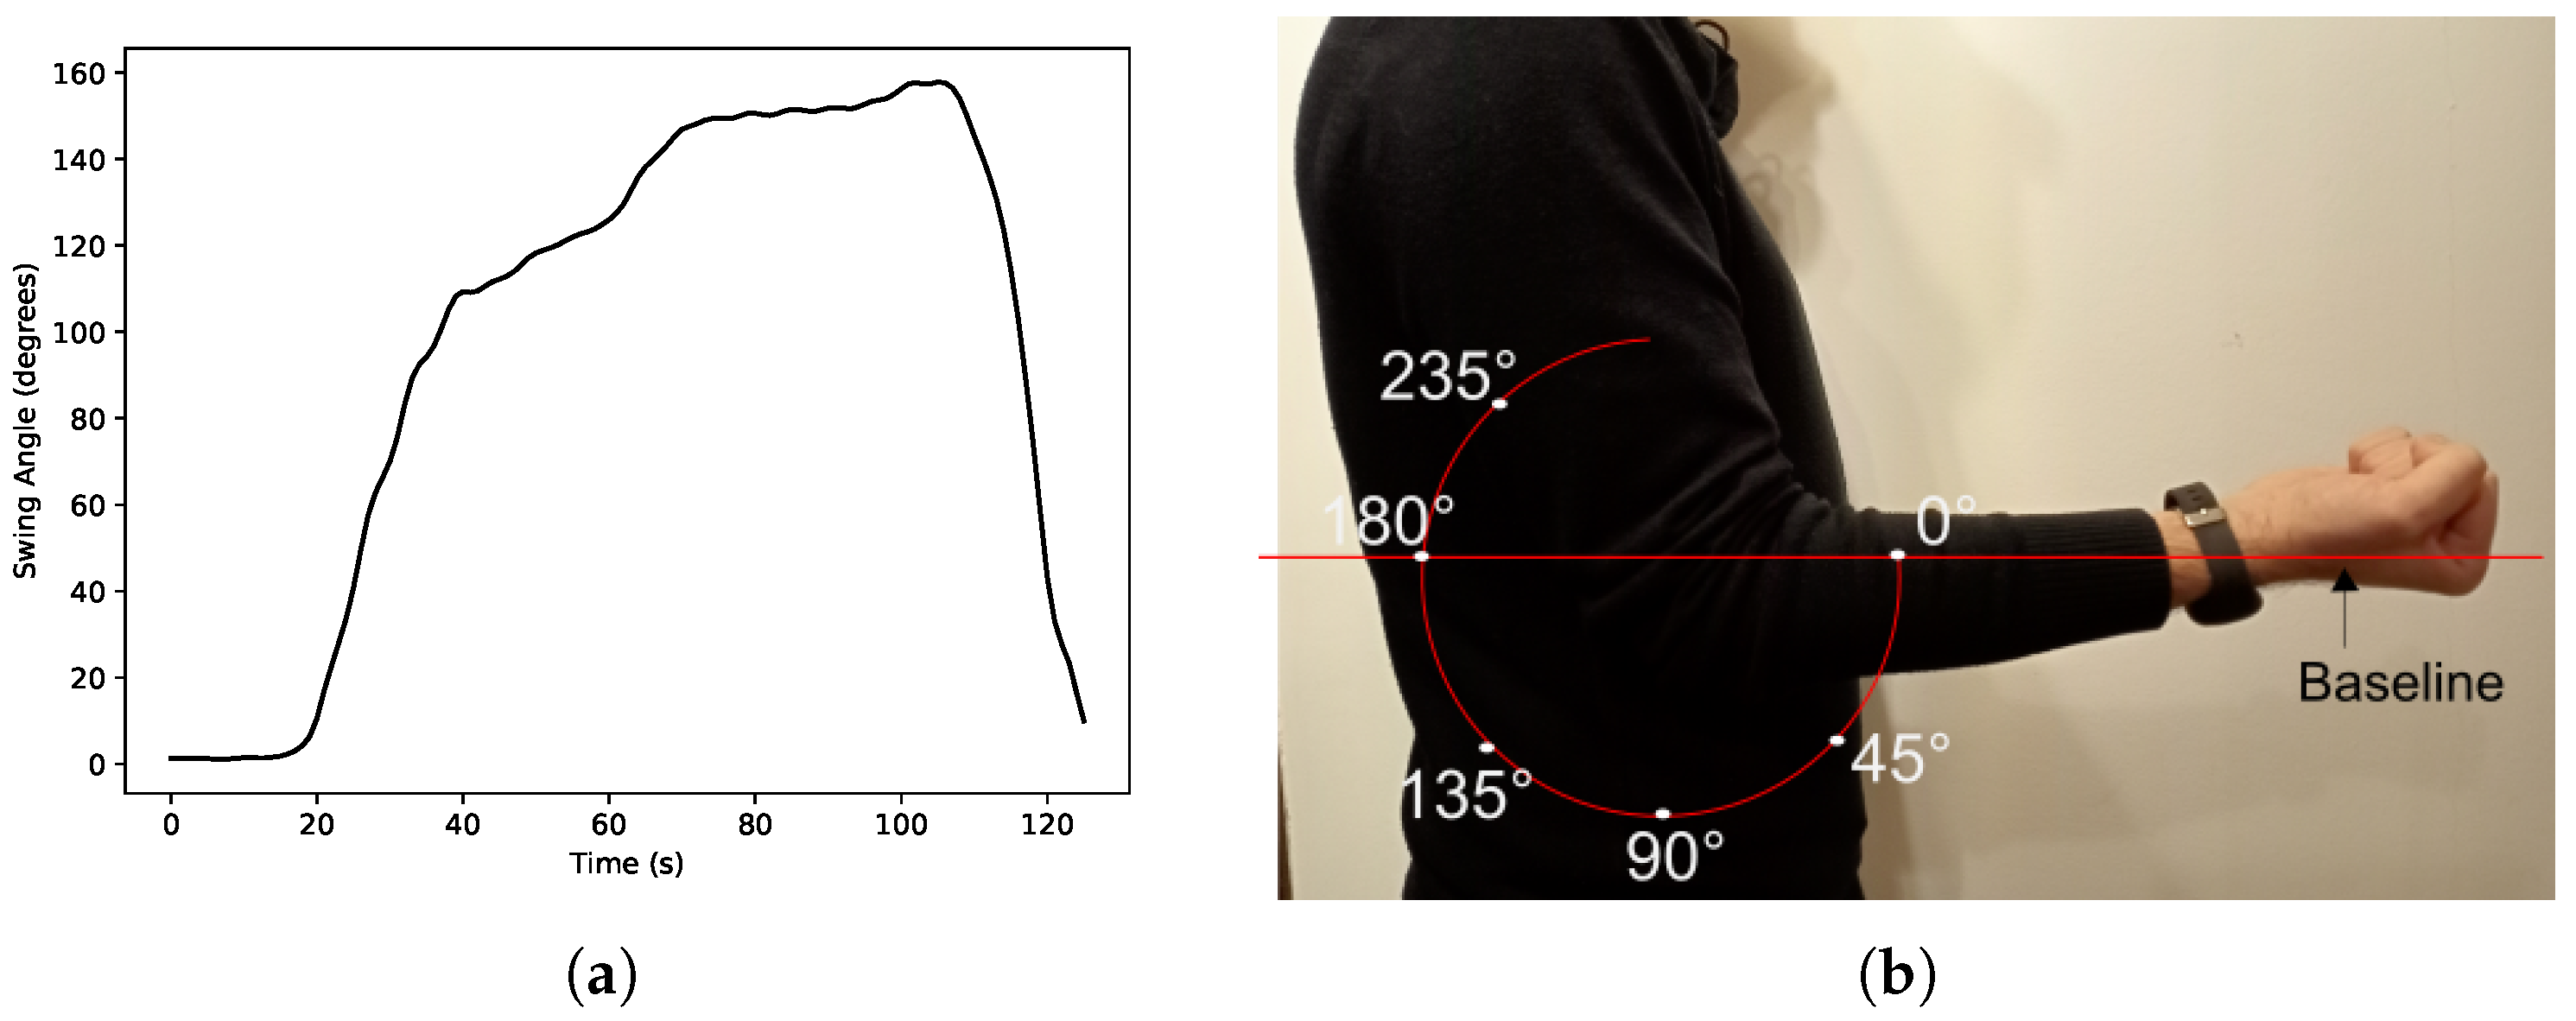
As we show in Section 1.2, a bowler’s arm swing is a composite motion that involves flexion/extension of the elbow and shoulder and pronation/supination of the wrist. We define colorblue the flexion/extension angle between the wrist and the transverse plane as the bowler’s swing angle. In our system, the baseline acquired during the game setup is acting as a reference point for swing angle computation. The bowler’s arm motion during a throw will result in positive swing angles typically in the range from to (see Figure 5b).
To estimate the orientation of the sensor and consequently the swing angle, we used quaternions. Quaternions are a four-dimensional number system that extends complex numbers and can be used to encode rotations in a 3D coordinate system. Unlike Euler angles, quaternions do not suffer from gimbal lock [28]. We obtain four-dimensional quaternion data with respect to time t from colorbluethe IMU wrist sensor. There are three coordinate frames with respect to swing analysis:colorblue the inertial frame i, the sensor frame s, and the baseline frame b. The inertial frame is a stationary frame, having the origin at the center of the Earth and its axis aligned with respect to the stars. The sensor frame is the coordinate frame of the moving IMU sensor on the wrist. This frame determines all of the inertial measurements of the sensor. The baseline frame is a local stationary frame, in which the axes are fixed with respect to the axes of the sensor at the baseline position. In our analysis, we are interested in finding the position and orientation of the sensor frame relative to the baseline frame. The coordinate frames for the swing analysis are shown in Figure 3b. We denote all of the unit quaternions, which are obtained by the sensor, and quantify rotation from frame i to frame s as . The equation to produce unit quaternions from the data acquired by the sensor is:
To compute the swing angle using quaternion operations, we first split the rotations of the arm into swing and twist components. The swing-twist decomposition [29] is used to determine the two components of rotation. By defining the sensor’s y-axis as the twist axis, it results in a twist quaternion consisting of rotations around this axis and a swing quaternion with the remaining rotation around the horizontal axis. The orientation quaternion of frame s with respect to frame b can be expressed by the following equation:
where is the conjugate quaternion and ⊗ is the Hamilton product between the two quaternions [30]. Let be a unit vector expressed with respect to the frame s. We want to rotate the vector with respect to the frame b by applying the orientation quaternion. According to [31], unit quaternions can be applied to rotate a vector by representing it as a pure quaternion. The pure quaternion of the vector is defined as:
Then, we use the orientation quaternion from Equation (2) to rotate quaternion with respect the frame b:
where is another pure quaternion, namely a vector rotated by the quaternion . We define the vector part of as v. By using v and the vector we can find the swing angle as:
where is the swing angle defined in the range , which can be mapped to by adding to the negative values.
Finally, the swing angle estimation is used to detect the start and end points of the bowler’s throw data stream. To identify the segments of the swing angle automatically and in real-time, we used a varying-time window-based technique described in [32]. Figure 5a displays the swing angle of a bowler.
2.2.2. Gait Events and Velocity
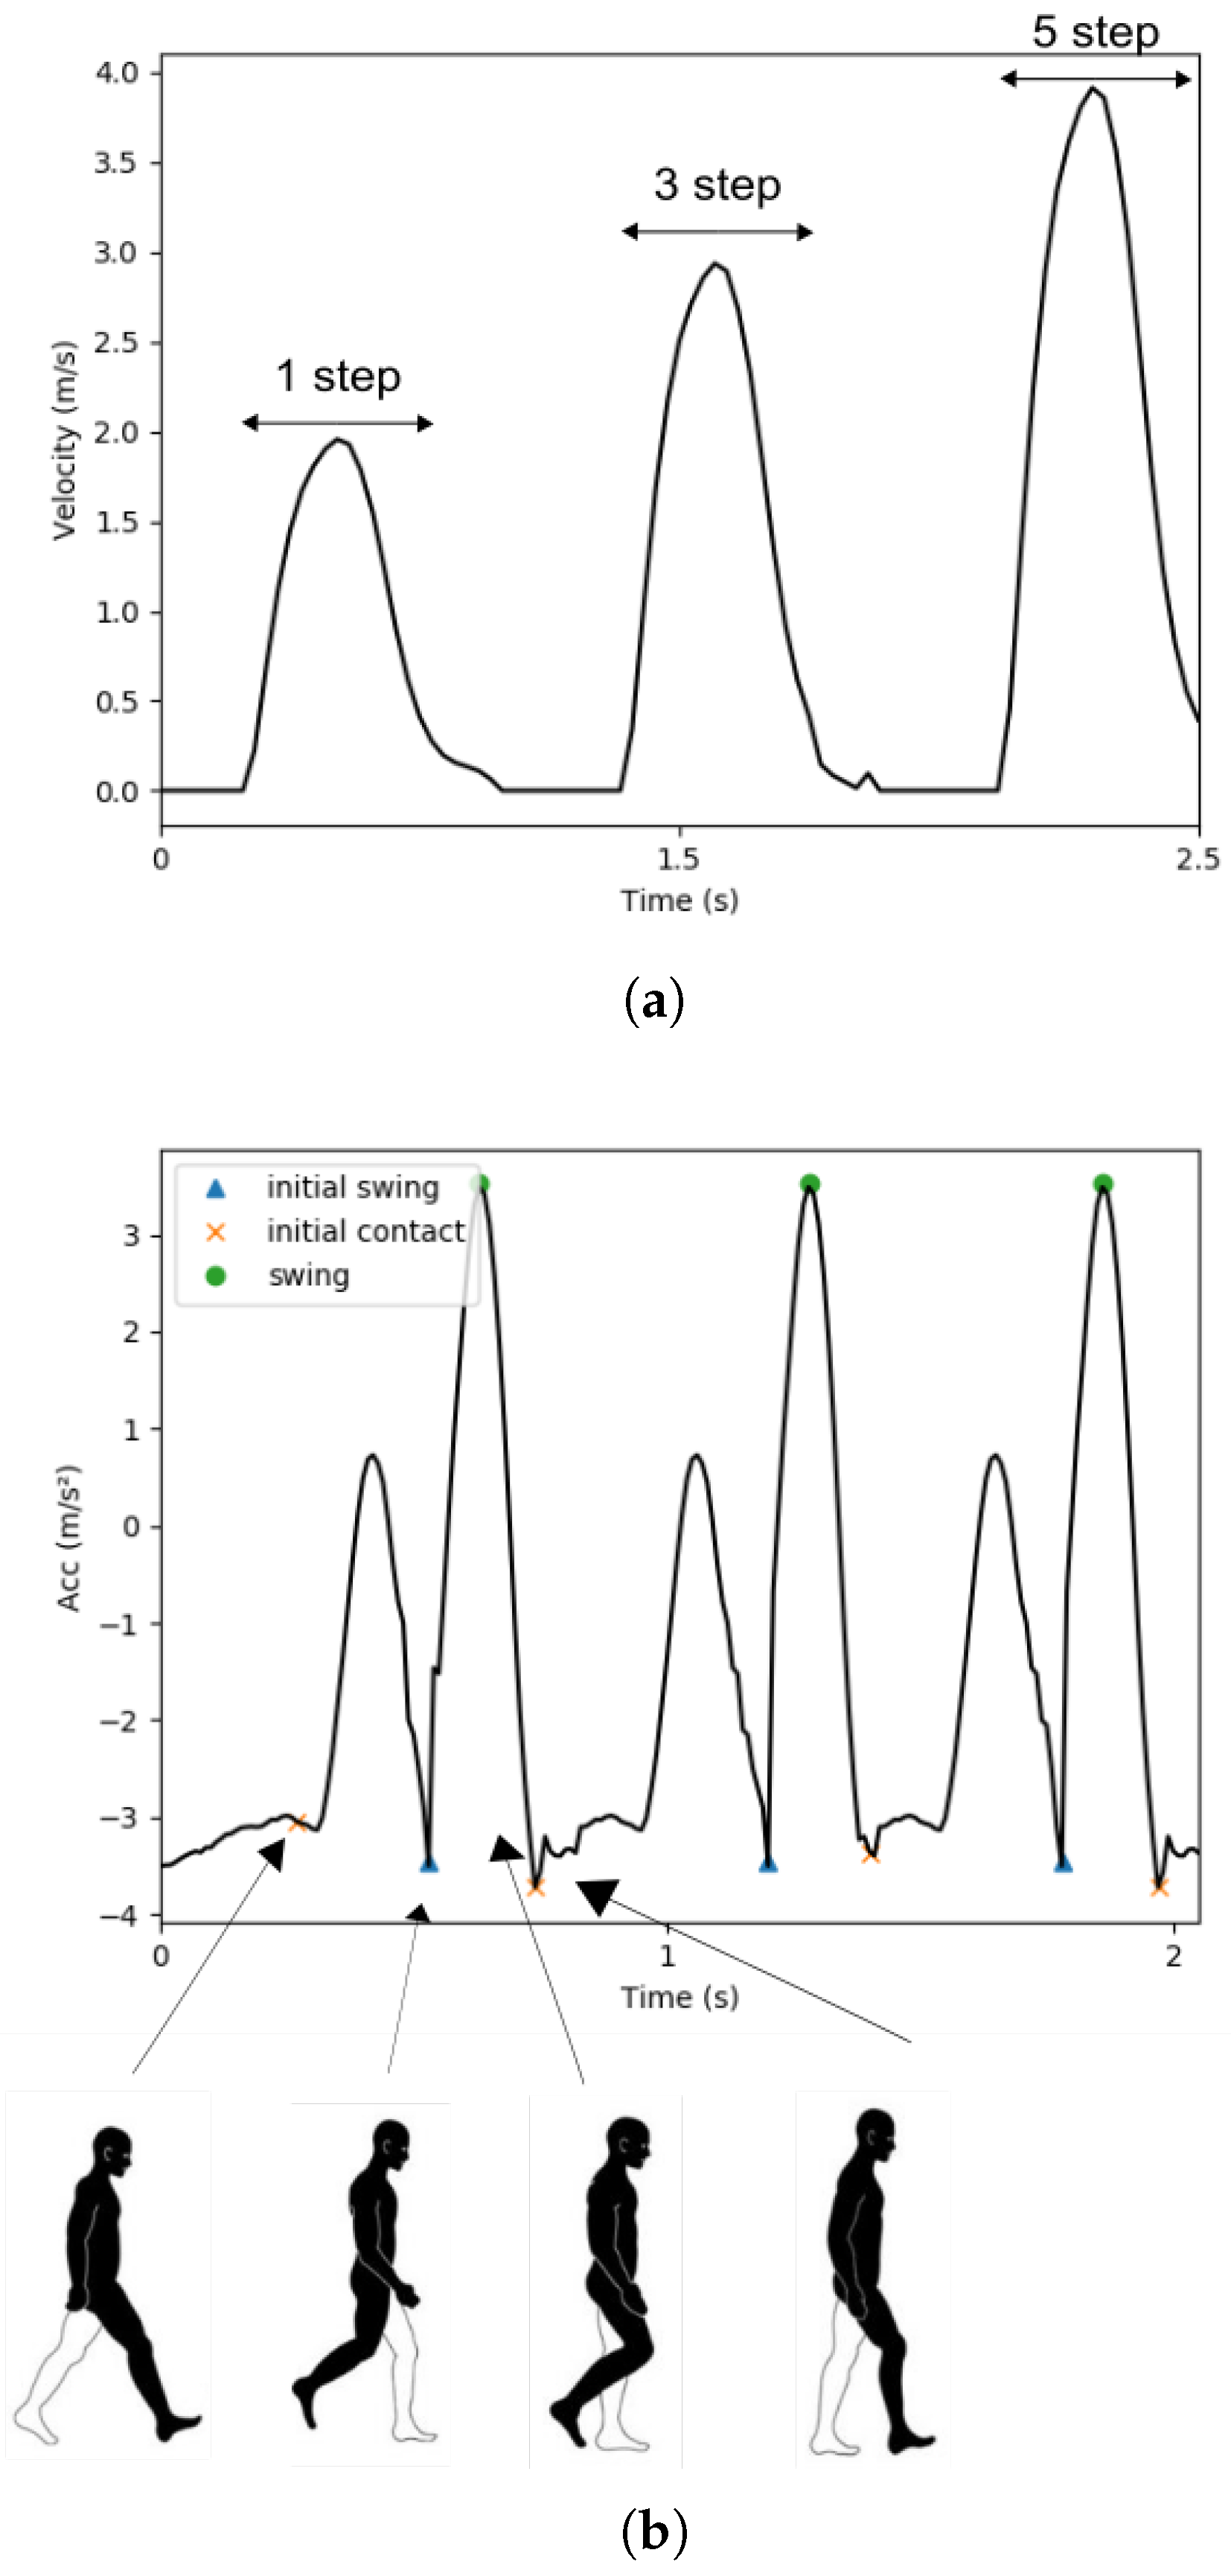
To develop our quality and skill assessment algorithms, we first need to extract the gait characteristics of the bowler. The human gait cycle can be defined as a repetitive pattern involving the forward movement of the lower extremities [33]. A normal forward step consists of two phases: the swing phase and the stance phase. The stance phase is the period between the initial contact of the foot on the ground and the final lift of the toes off the ground. In contrast, the swing phase is the period during which the foot is not in contact with the ground. During this phase, the foot rapidly accelerates forward, followed by a deceleration leading to the initial contact of a stance event. Figure 6b illustrates the phases of a typical human gait cycle.
As discussed in Section 1.2, to deliver the ball into the lane, bowlers need to perform either five or four normal steps. Additionally, the gait characteristics of the non-bowling foot can provide valuable insights into the quality of the throw. To identify the gait phases, we employ a stride detection technique based on the local minimal prominence characteristics of strides associated with the magnitude of accelerometer data [34]. This method can identify the start and end of a gait cycle, the start of a stance event, and a swing event. Figure 6b displays the results of this method applied to the leg with the IMU sensor during a five-step approach. In the initial and final positions of the throw, the non-bowling foot remains stationary on the ground, exhibiting zero acceleration. Three strides are detected for the non-bowling foot, and, for each stride, we identify the initial contact of the stance phase and the pre-swing event of the swing phase. The highest value of acceleration for each stride corresponds to the mid-swing event of the swing phase. Using the gait events detected by this method, we estimate the number of strides, the swing period, the stance period, and the ratio of swing to stance. The swing period is the interval between the initial swing and the initial contact phases, while the stance period is the interval between the initial contact and the pre-swing phase (of the next stride). Typically, the ratios between the stance and swing phases are and , respectively [35].
Another significant factor in the quality of the throw is the velocity of the bowler’s steps. To calculate the velocity for each stride of the non-bowling leg, we employ the trapezoidal integration method on accelerometer data. However, due to noise, direct integration of accelerometer data can introduce a significant amount of drift error [20,36]. To address this issue, we use the velocity estimation method proposed in [34]. The magnitude of the acceleration is passed through a second-order high-pass Butterworth filter with a 1 Hz cutoff frequency and 50 Hz sampling rate, along with a filtfilt filter. The filtfilt filter is used to correct the phase distortion introduced by the second-order high-pass Butterworth filter. Then, for each stride of the filtered total acceleration, we measure the gait velocity using the trapezoidal integration method. The gait velocity obtained using this method is shown in Figure 6a.
2.3. Quality Assessment and Error Detection
After the synchronous data acquisition, we use the extracted information from the swing and gait analyses to detect common bowling errors and assess the quality of a throw. The process of identifying the common errors and the throw quality is executed on the user’s mobile device after each throw. An example of the results obtained by these analyses is shown in Figure 6b.
2.3.1. Quality Assessment of Throws
In Section 1.2, we emphasized that the proper positioning of the arm during the steps of the non-bowling leg plays a significant role in a successful ball delivery. Therefore, in the quality assessment of the throw, we employ an approach based on comparing it to a throw considered to be close to ideal. We use the extracted swing angle and gait events of the non-bowling leg for this purpose. This process aims to measure how well each phase of the throw is executed and provides visual feedback on the athlete’s performance on a mobile device.
Our approach to assessing the quality of each phase of the bowler’s throw involves using template sample data obtained from the coach and measuring the similarity between the bowler’s swing angle and the corresponding templates. These templates consist of motion data of throws performed by a coach, representing the optimal way to deliver the ball into the alley using a particular style (e.g., a five-step approach). Similar to user motion data, swing and gait analyses are used to extract angle and gait events for the templates. The extracted information from the templates of the user’s corresponding style is pre-stored on the mobile device.
Various methods can be used to measure the similarity between two time series [37]. In our quality assessment process, we apply the Dynamic Time Warping (DTW) algorithm, which can measure the similarity between two time series after finding the optimal alignment between them. Unlike other metrics such as Euclidean Distance, DTW can accurately measure the distance between two similar data series, even if they are out of phase in the time domain or have unequal lengths. Consequently, due to the variation in the speed of collected motion data, the properties of the DTW method make it well suited for our system. However, it is worth noting that DTW has a high computational complexity, which can affect the performance of the application. Notably, the time complexity of this algorithm is , where N and M are the lengths of the two data series used as input to measure the distance. To address this issue, we select only a small number of templates to be stored and processed for each athlete. This reduces the total number of comparisons and, as a result, the overall time delay of the process. The impact of the number of templates in our approach will be further examined in Section 4.
DTW measures a distance quantity, where higher values indicate a weaker match between the two motions. To quantify the quality of an athlete’s motion and provide a more intuitive interpretation of the DTW similarity, we use the (QD) [11], which is defined as:
where is the minimum DTW distance of the athlete’s motion data x and the applicable template data, and is the average DTW distance between x and the remaining incompatible templates. The range of the is set to . An athlete’s motion, which is similar to the corresponding optimal motion of his coach, is considered to have a high . In order to measure the quality for each significant phase of the throw, we use the swing angle and gait events extracted from the synchronized sensor data. Using the gait events of the non-bowling leg, we partitioned the swing angle data into segments defined by the start and end of the strides. For each of these segments and the corresponding templates, we calculated the DTW distance. Subsequently, we used the DTW distances to estimate the of each segment. The process of throw quality assessment is summarized in Algorithm 1.
| Algorithm 1 The quality assessment algorithm |
|
2.3.2. Common Error Detection
We developed a method to detect the four common bowling errors described in Section 2 and give visual feedback for error conditions to the athlete. This method compares key statistical parameters between athletes and template data. The parameters are defined by the coach and are pre-stored in the athlete’s mobile device. To detect Error 1 on the bowler throw, we use the velocity data of the non-bowling leg, obtained by the gait analysis. Let be the average velocity for stride k and be the average velocity of template i for stride k. Then, if at least one of the k deviations , where is the mean of averaged templates velocities for stride k, surpasses a predefined range , an Error 1 is detected. Similarly, to identify Error 2 we use the maximum swing angle of the throw and the averaged maximum swing angle of the templates. When the deviation exceeds a certain user-defined range, an Error 2 is detected.
Errors 3 and 4 are highly dependent on the position of the arm during gait events of the non-bowling leg. Thus, the synchronized data of swing angles and gait events are used to identify the arm position. The bowler’s arm angle on the initial contact gait event in the last stride (the fifth step) is used to detect Error 3. If the deviation exceeds the predefined range of , the system alerts the users for Error 3. The is the swing angle during the initial contact event of the non-bowling foot in the last stride and is the corresponding averaged swing angles of the templates. The last error that our system can report is Error 4, which is determined by the position of the arm during the initial contact of the non-bowling leg in the third stride. Thus, for throws with deviations , which are out of the corresponding predefined range, we detect Error 4.
As we showed, our approach can detect each type of error using a range . The upper bounds of the range, namely , are defined by the coaches and are pre-stored on athletes’ mobile devices.
2.4. Skill Assessment
A machine learning approach is employed to assess the skill of a bowler. Our approach includes data preprocessing, feature extraction, and classification. The training, evaluation, and hyper-parameter tuning of the model were performed locally, and the resulting model was deployed on the Cloud. After the end of a game, the bowlers can upload their data to the Cloud to perform the skill assessment analysis and visualize their performance. These data consist of the swing and gait analyses results, which are extracted during the game on the athlete’s mobile device. There are three different skill levels—novice, intermediate, and expert—and each throw of the game is labeled with the corresponding level by the skill assessment analysis.
In the data preprocessing step, we removed the throws that were not related to any particular bowling style (e.g., 5-step approach). Noise removal was applied by the swing and gait analyses; therefore, no additional filters were used in the preprocessing step. For each throw, we extracted 21 statistical features from the swing angle, gait acceleration, and gait velocity (seven features × three axes). These features are then used to train and test our machine learning model. Table 1 describes the features derived from our input data.
In our approach, we used a Support Vector Machine (SVM) [38] model to classify the skill level of athletes. SVM is a supervised machine learning method that can solve binary classification problems. In order to apply this method to our system, we decomposed the multi-class skill assessment task into multiple binary classification sub-problems using the one-versus-one technique [39]. For a problem with C classes, classifiers are constructed where each classifier is trained on data from two classes. In our case, ; therefore, three SVMs are trained. To assign the label of a test case at prediction time, a voting scheme is applied. The SVM aims to find the optimal separating hyperplane that maximizes the margin between the two classes. Let be a training dataset of n points, where is the data features and indicates the class of . To find the maximum margin hyperplane, we solved the optimization problem subject to , where the vector and the displacement b can describe the hyperplane by the linear equation . We convert the problem of finding the optimal hyperplane into the equivalent Lagrangian dual problem, which is defined as:
where represents the Lagrangian multipliers’ vector, C is the penalty constant parameter that is used to find a trade-off between generalization and error, and is the kernel function of the SVM. The quadratic optimization problem in (7) can be solved with the Sequential Minimal Optimization (SMO) method [40]. Using the Lagrangian multipliers obtained by the SMO method, we can find the optimized hyperplane. Finally, the decision function for classification is defined as:
where X is the test dataset of size m containing the bowling throws of the athlete. Then, an unknown bowling throw X is classified as follows:
Details of the training process, the hyper-parameter tuning, and the overall classification performance of our model are discussed in Section 5.
3. Results
In this section, we evaluated the proposed system in the processes of quality assessment, error detection, and skill level assessment.
3.1. Experimental Setup
In order to test our system in a real bowling environment, we conducted a proof-of-concept experiment at Pin City Bowling Center in Thessaloniki, using athletes from the ‘Deka Korynes’ Bowling Club. We recruited nine right-handed bowlers (weight: 55–90 kg, height: 165–188 cm, age: 20–67), including three novice, three intermediate, and three expert athletes. Expert bowlers had more than five years of experience and had participated in at least one official international tournament. Intermediate bowlers had 2–5 years of practice bowling and no participation in official tournaments. Novice bowlers had at most one year of practice bowling and no participation in tournaments. In addition, we recruited two professional coaches to provide templates that were used in quality assessment analysis. All athletes wore and configured the sensors according to our system instructions, and they were supervised by the two coaches. After the setup process and five warmup throws, each athlete performed 50 bowling throws. Bowling efforts that were considered to be illegal or committed a foul were excluded from our dataset. We obtained 450 throws () using our Android application. Finally, for each throw of the processes, we captured a video of the bowler’s motion. The videos were used to validate our system in the evaluation process.
3.2. Quality Assessment Evaluation
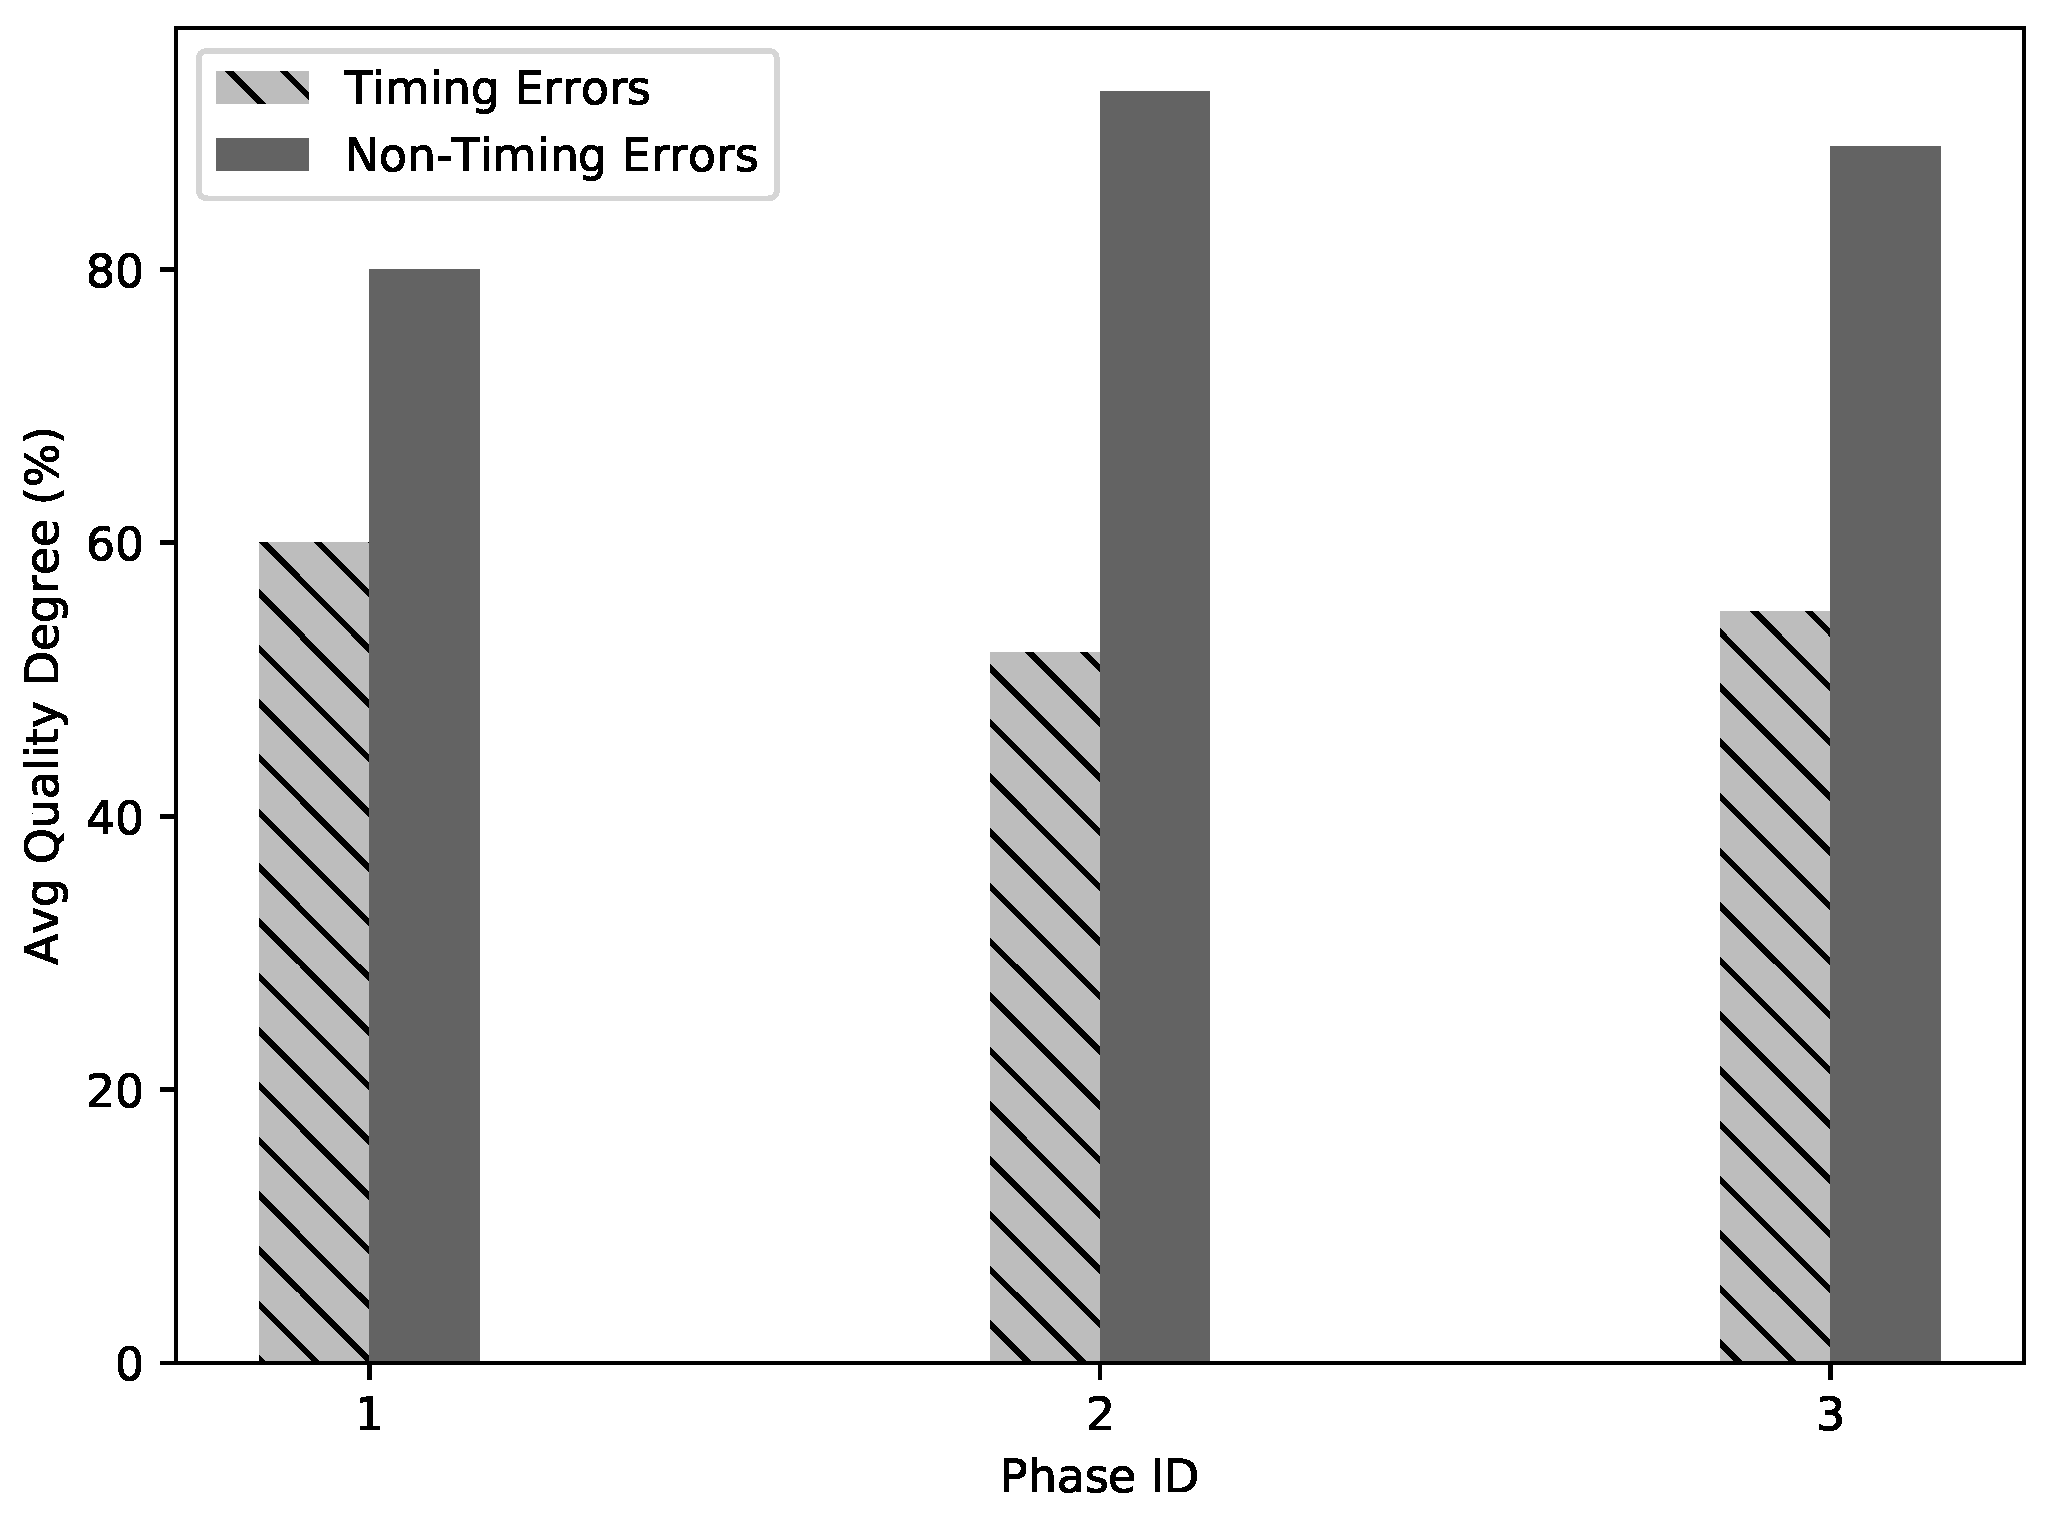
To evaluate the accuracy of the quality assessment process, we asked the bowlers to perform 10 throws in which each one was as similar as possible to the motion of the coach. Then, the same bowlers performed 10 throws with evident timing errors for each significant bowling phase. There are three significant phases of the five-step approach, meaning that 30 throws were captured for each athlete. We applied the quality assessment process and measured the average quality degree of the collected data. The results of this metric are shown in Figure 7, where the average quality degree of each phase for timing error data and error-free data are compared. Statistical comparisons were performed using a paired t-test where p-values of were considered significant. There were significant statistical differences in the average quality degrees of throws with timing errors for phase 1 (M = 60, SD = 1.9), phase 2 (M = 52, SD = 2.1), and phase 3 (M = 55, SD = 2.5) and their corresponding average quality degrees for throws with no timing errors for phase 1 (M = 80, SD = 1.8), phase 2 (M = 93, SD = 1.5), and phase 3 (M = 89, SD = 1.8). Thus, the quality assessment analysis implemented in our system can be used to quantify the quality of the significant phases of a bowling throw.
In addition, we investigated the influence of the number of templates in our quality assessment approach. We used the 90 throws (10 throws per athlete) with no timing errors that were captured for the quality evaluation, and we compared the averaged quality degree for various number of templates. Using One-way ANOVA for each phase, we found that there were no statistically significant differences between the means of quality degrees regarding the number of templates (Table 2). This is presumably associated with the fact that the coaches can execute nearly similar throws, leading to highly correlated templates. Despite the weak influence of the quality degree metric, the number of templates can negatively impact the execution time of our quality assessment process. The minimum average execution time is 210 ms for one template, and the maximum is 1100 ms for six templates. Due to the weak influence of the number of templates in quality degree and the computational power constraints of mobile devices, we employed only one template on our quality assessment process.
3.3. Common Error Detection Evaluation
We evaluated the Common Error Detection process using a subset of the data from the quality assessment evaluation. Coaches reviewed the recorded high frame rate videos of the bowlers’ throws to assign labels indicating the specific type of common error present. To assess the performance of our error detection process, we employed precision and recall metrics. Precision quantifies the ratio of correctly identified errors to the total number of errors detected, and it is defined by the following equation:
The recall metric measures the ratio of the correctly detected errors over the total number of errors in our dataset, and it is described as follows:
where , , and are true positive, false positive, and false negative, respectively. As shown in Table 3, the averaged precision and recall over all types of errors are and , respectively. Overall, the results suggest that the Common Error Detection process can be used to identify the four bowlers’ errors.
3.4. Performance Evaluation
Both the quality assessment process and error detection are conducted on athletes’ mobile devices during the course of the game. Mobile devices are characterized by limited processing power and energy capacity. To ensure the optimal performance of our mobile application, we assessed CPU and energy consumption using a Xiaomi Redmi A2 smartphone (featuring a Snapdragon 660, Octa-Core Cryo 2.2 GHz processor, and a 3010 mAh battery).
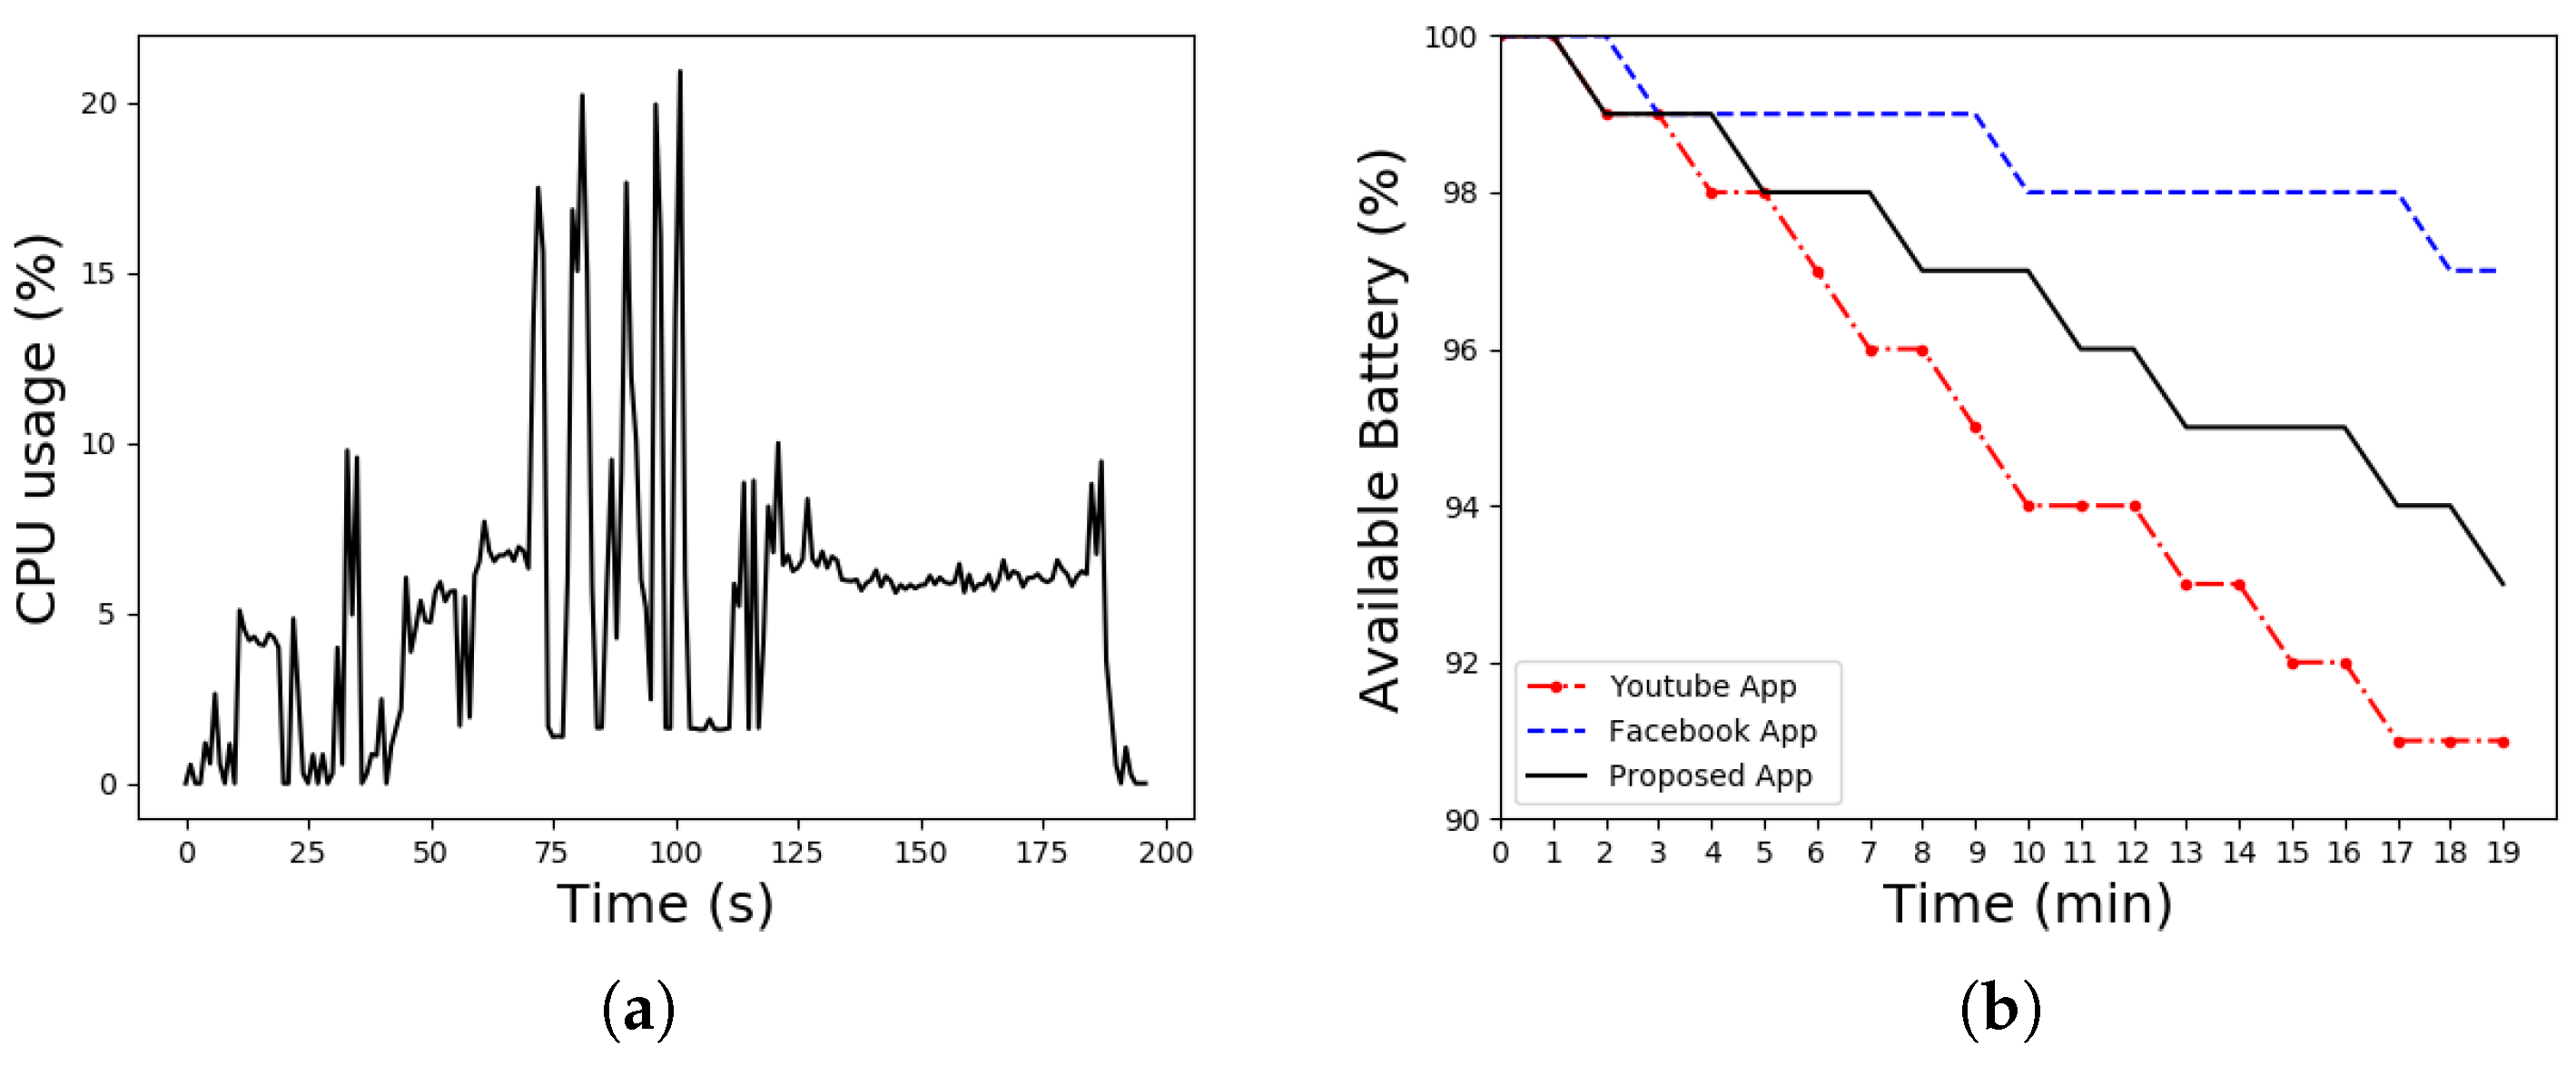
We monitored the CPU usage of our Android application during various phases, including sensor configuration, quality assessment, and error detection for a single bowler’s throw. This process lasted approximately 200 s, during which no other applications or tasks were running in the background on the Android device. The results are presented in Figure 8a. The maximum CPU usage was recorded at 23%, with an average usage of 5.23%. When we compare these results with studies investigating CPU usage in Android applications [41,42], we find that our mobile application maintains acceptable CPU usage levels.
To investigate energy consumption, we monitored the battery level of the mobile device during a session consisting of 15 throws. This session spanned about 20 min, during which an athlete used the mobile application for sensor configuration and received visual feedback for each throw. At the beginning of the experiment, the mobile device was fully charged, and no other background applications were running. We collected battery data using Android Debug Bridge (ADB) and the ‘dumpsys’ tools. Figure 8a illustrates the energy consumption during this session, with the X-axis representing time in minutes and the Y-axis representing the percentage of the mobile device’s available battery. The available battery of the device running our proposed application decreased from 100% to 93% over the 20 min session. To provide context, we compared the energy consumption of our application with two popular mobile applications, Facebook and YouTube, which were tested on the same mobile device under identical conditions. As observed in Figure 8b, the total energy consumption of our application is on par with these two popular applications.
These revisions aim to make the text more concise and reader-friendly. If you have further edits or specific requests, please feel free to let me know.
3.5. Skill Assessment Evaluation
We utilized a dataset comprising 450 records obtained from nine athletes to build our machine learning model for skill assessment. The dataset was divided into a training set, which constituted 80% of the data (360 throws), and a test set, which comprised the remaining 20% (90 throws). To mitigate overfitting, we employed a 10-fold cross-validation approach. The optimal hyperparameters for the SVM classifiers were determined using grid search tuning. Our model demonstrated the best performance with the Radial Basis Function (RBF) kernel. The hyperparameters of the SVM with RBF kernel are C and , which were validated in the ranges of and , respectively. The macro-averaged F1 metric is defined as the score function of our grid search method. The F1-score can be used for multiclass classification problems and is defined as:
where the precision and recall are defined by Equations (10) and (11), respectively. We obtained the best results for the macro-averaged F1 metric when and . The classification results of our trained model are shown in Table 4.
4. Discussion
The proposed system effectively and efficiently assesses the quality of bowlers’ throws. The experimental results suggest that our method accurately quantifies the characteristics of the significant phases of a bowling throw. Furthermore, we have shown that the number of templates has little influence on the quality assessment process.
Our method for detecting common bowling errors accurately identifies four types of motion errors, achieving an average precision of 90% and recall of 84%. This method is based on comparing the statistical parameters between athletes’ motion data and templates. However, it does require a predefined range, set by coaches, to detect motion errors, which limits the Common Error Detection process.
The system provides real-time feedback after each throw, aiding bowlers and coaches in tracking their motion data and performance assessment. Therefore, it is essential for the quality assessment and error detection processes to run efficiently on user mobile devices. The performance evaluation results indicate that the mobile application, which runs both processes, has acceptable CPU usage and energy consumption.
Concerning the skill assessment process, our experiments reveal that the Cloud-based system accurately recognizes the skill level using motion characteristics such as swing angle and gait velocity. The SVM model achieves an average precision of 94% and a recall of 90%, demonstrating its effectiveness in identifying athletes’ skill levels. Additionally, the classification results suggest that novice bowlers exhibit different motion characteristics from experts and intermediates, resulting in better recognition performance for novice bowlers.
However, our system has some limitations. It was tested and evaluated with motion data from right-handed bowlers performing the five-step approach. Therefore, the current version of our system is not suitable for techniques that require more than five steps. Gathering more data from a wider range of skill levels and age groups is necessary to extend the research to other bowling techniques and game styles, such as the four-step approach. Proper initialization of the baseline is crucial for the system to work correctly. Incorrect baseline initialization or inconsistent and unexpected arm motion, such as moving the arm out of the sagittal plane, can lead to misleading conclusions and inaccurate performance evaluations.
Our research endeavors will revolve around expanding the diversity of our dataset. By conducting studies with larger and more diverse samples of bowlers, including individuals of varying skill levels, age groups, and dominant hand preferences, we aim to enhance the robustness of our system. This broader dataset will also enable us to perform more nuanced performance evaluations, providing a deeper understanding of athlete performance.
We recognize the importance of accommodating different motion techniques. While our initial focus was on the five-step method in bowling, we understand that the sports world is replete with various styles and methods. Therefore, our future work will involve the optimization of our algorithms to seamlessly integrate with a wider range of bowling techniques, ensuring that our system remains adaptable and versatile.
Affordability and accessibility are fundamental principles guiding our approach. To this end, we are committed to researching and developing more cost-effective sensors and equipment. Our objective is to make the benefits of wearable technology in sports available to a broader audience of bowling players, thereby removing financial barriers and promoting inclusivity.
Beyond bowling, our vision extends to other target sports and physical activities. We firmly believe that the principles and technology we are developing can be applied to various athletic domains. Therefore, part of our future work will involve collecting data and extending our system to assess and monitor the performance of athletes in other throwing sports, such as shot put. This expansion reflects our commitment to the versatile and wide-reaching potential of our system in the realm of sports science.
5. Conclusions
The motion technique of a bowler plays a crucial role in achieving a successful bowling throw in ten-pin bowling. Coaches rely on various motion characteristics, such as gait and arm synchronization, maximum arm angle, and gait speed, to provide feedback to bowling athletes. In this study, we have introduced an innovative system designed to automate the coaching process for ten-pin bowling. Our approach combines two inertial measurement units, a mobile application, and a Cloud-based server to analyze motion data collected from the bowler’s non-bowling leg and bowling wrist. These data are utilized for the purpose of assessing the quality of a throw, detecting common bowling errors, and determining the skill level of the bowler.
The system allows for real-time streaming of motion data, which is transmitted via Bluetooth Low Energy to a mobile device. The mobile application conducts quality assessment and error detection analyses on these data, delivering the results in real time to the user. Furthermore, users have the option to upload their data to a dedicated Cloud server, where the system leverages a machine learning model to evaluate the skill level of the bowler.
Based on the results of our experiments using motion data from bowlers, our system demonstrates strong performance in assessing the quality of throws, identifying common errors, and accurately classifying the skill level of bowlers.
Author Contributions
Conceptualization, I.Z. and I.S.; methodology, I.Z.; software, I.Z.; validation, I.Z. and I.S.; formal analysis, I.Z.; data curation, I.Z. and I.S.; writing—original draft preparation, I.Z. and I.S.; supervision, I.S. All authors have read and agreed to the published version of the manuscript.
Funding
This research received no external funding.
Data Availability Statement
Data is contained within the article.
Conflicts of Interest
The authors declare no conflict of interest.
References
- John Dian, F.; Vahidnia, R.; Rahmati, A. Wearables and the Internet of Things (IoT), Applications, Opportunities, and Challenges: A Survey. IEEE Access 2020, 8, 69200–69211. [Google Scholar] [CrossRef]
- Rana, M.; Mittal, V. Wearable Sensors for Real-Time Kinematics Analysis in sports: A Review. IEEE Sensors J. 2020, 21, 1187–1207. [Google Scholar] [CrossRef]
- Razman, R.; Cheong, J.P.G.; Abas, W.W.; Osman, N.A. Anthropometric and strength characteristics of tenpin bowlers with different playing abilities. Biol. Sport/Inst. Sport 2011, 29, 33–38. [Google Scholar] [CrossRef]
- Specto Tracking System. Available online: https://www.spectobowling.com/ (accessed on 8 November 2020).
- International Training and Research Center. Available online: https://bowl.com/bowlingitrc (accessed on 8 November 2020).
- Tabrizi, S.S.; Pashazadeh, S.; Javani, V. Comparative Study of Table Tennis Forehand Strokes Classification Using Deep Learning and SVM. IEEE Sensors J. 2020, 20, 13552–13561. [Google Scholar] [CrossRef]
- Kos, M.; Kramberger, I. Tennis stroke consistency analysis using miniature wearable IMU. In Proceedings of the 2018 25th International Conference on Systems, Signals and Image Processing (IWSSIP), Maribor, Slovenia, 20–22 June 2018; pp. 1–4. [Google Scholar]
- Gawsalyan, S.; Janarthanan, T.; Thiruthanikan, N.; Shahintha, R.; Silva, P. Upper limb analysis using wearable sensors for cricket. In Proceedings of the 2017 Second International Conference on Electrical, Computer and Communication Technologies (ICECCT), Coimbatore, India, 22–24 February 2017; pp. 1–6. [Google Scholar]
- Kim, Y.J.; Kim, K.D.; Kim, S.H.; Lee, S.; Lee, H.S. Golf swing analysis system with a dual band and motion analysis algorithm. IEEE Trans. Consum. Electron. 2017, 63, 309–317. [Google Scholar] [CrossRef]
- Jia, H.; Wu, Y.; Liu, J.; Yao, L.; Hu, W. Mobile golf swing tracking using deep learning with data fusion. In Proceedings of the 17th Conference on Embedded Networked Sensor Systems, New York, NY, USA, 10–13 November 2019; pp. 422–423. [Google Scholar]
- Zou, Y.; Wang, D.; Hong, S.; Ruby, R.; Zhang, D.; Wu, K. A Low-Cost Smart Glove System for Real-Time Fitness Coaching. IEEE Internet Things J. 2020, 7, 7377–7391. [Google Scholar] [CrossRef]
- Bächlin, M.; Förster, K.; Tröster, G. SwimMaster: A Wearable Assistant for Swimmer. In Proceedings of the 11th International Conference on Ubiquitous Computing, New York, NY, USA, 30 September–3 October 2009; pp. 215–224. [Google Scholar] [CrossRef]
- Khan, A.; Mellor, S.; King, R.; Janko, B.; Harwin, W.; Sherratt, R.S.; Craddock, I.; Plötz, T. Generalized and efficient skill assessment from IMU data with applications in gymnastics and medical training. ACM Trans. Comput. Healthc. 2020, 2, 1–21. [Google Scholar] [CrossRef]
- Jung, W.; Watson, A.; Kuehn, S.; Korem, E.; Koltermann, K.; Sun, M.; Wang, S.; Liu, Z.; Zhou, G. LAX-Score: Quantifying Team Performance in Lacrosse and Exploring IMU Features towards Performance Enhancement. Proc. ACM Interact. Mob. Wearable Ubiquitous Technol. 2021, 5, 1–28. [Google Scholar] [CrossRef]
- Jones, M.; Walker, C.; Anderson, Z.; Thatcher, L. Automatic Detection of Alpine Ski Turns in Sensor Data. In Proceedings of the 2016 ACM International Joint Conference on Pervasive and Ubiquitous Computing: Adjunct, New York, NY, USA, 12–16 September 2016; pp. 856–860. [Google Scholar] [CrossRef]
- Velloso, E.; Bulling, A.; Gellersen, H. Towards qualitative assessment of weight lifting exercises using body-worn sensors. In Proceedings of the 13th International Conference on Ubiquitous Computing, New York, NY, USA, 17–21 September 2011; pp. 587–588. [Google Scholar]
- Derungs, A.; Soller, S.; Weishäupl, A.; Bleuel, J.; Berschin, G.; Amft, O. Regression-based, mistake-driven movement skill estimation in Nordic Walking using wearable inertial sensors. In Proceedings of the 2018 IEEE International Conference on Pervasive Computing and Communications (PerCom), Athens, Greece, 19–23 March 2018; pp. 1–10. [Google Scholar]
- Kos, M.; Kramberger, I. A Wearable Device and System for Movement and Biometric Data Acquisition for Sports Applications. IEEE Access 2017, 5, 6411–6420. [Google Scholar] [CrossRef]
- Zhou, Y.; Wang, R.; Wang, Y.; Sun, S.; Chen, J.; Zhang, X. A Swarm Intelligence Assisted IoT-Based Activity Recognition System for Basketball Rookies. IEEE Trans. Emerg. Top. Comput. Intell. 2023, 1–13. [Google Scholar] [CrossRef]
- Han, S. Measuring displacement signal with an accelerometer. J. Mech. Sci. Technol. 2010, 24, 1329–1335. [Google Scholar] [CrossRef]
- King, K.; Perkins, N.C.; Churchill, H.; McGinnis, R.; Doss, R.; Hickland, R. Bowling ball dynamics revealed by miniature wireless MEMS inertial measurement unit. Sport. Eng. 2011, 13, 95–104. [Google Scholar] [CrossRef]
- Hon, T.M.; Senanayake, S.A.; Flyger, N. Biomechanical analysis of 10-pin bowling using wireless inertial sensor. In Proceedings of the 2009 IEEE/ASME International Conference on Advanced Intelligent Mechatronics, Singapore, 14–17 July 2009; pp. 1130–1135. [Google Scholar] [CrossRef]
- Wiedman, D. Bowling, 2nd ed.; Human Kinetics, Inc.: Champaign, IL, USA, 2015. [Google Scholar]
- Grinfelds, V.; Hultstrand, B. Right Down Your Alley: The Complete Book of Bowling; Cengage Learning: Boston, MA, USA, 2011. [Google Scholar]
- MetaMotionR: Version 0.5. 2016. Available online: https://mbientlab.com/store/metamotionr/ (accessed on 8 November 2020).
- Anwary, A.R.; Yu, H.; Vassallo, M. Optimal Foot Location for Placing Wearable IMU Sensors and Automatic Feature Extraction for Gait Analysis. IEEE Sensors J. 2018, 18, 2555–2567. [Google Scholar] [CrossRef]
- Sangat, P.; Indrawan-Santiago, M.; Taniar, D. Sensor data management in the cloud: Data storage, data ingestion, and data retrieval. Concurr. Comput. Pract. Exp. 2018, 30, e4354. [Google Scholar] [CrossRef]
- Johnson, M.P. Exploiting Quaternions to Support Expressive Interactive Character Motion. Ph.D. Thesis, Massachusetts Institute of Technology, Cambridge, MA, USA, 2003. [Google Scholar]
- Grassia, F.S. Practical parameterization of rotations using the exponential map. J. Graph. Tools 1998, 3, 29–48. [Google Scholar] [CrossRef]
- Hamilton, W.R. Elements of Quaternions; Longmans, Green, & Company: London, UK, 1866. [Google Scholar]
- Kuipers, J.B. Quaternions and Rotation Sequences: A Primer with Applications to Orbits, Aerospace, and Virtual Reality; Princeton University Press: Princeton, NJ, USA, 1999. [Google Scholar]
- Okeyo, G.; Chen, L.; Wang, H.; Sterritt, R. Dynamic sensor data segmentation for real-time knowledge-driven activity recognition. Pervasive Mob. Comput. 2014, 10, 155–172. [Google Scholar] [CrossRef]
- Wang, J.S.; Lin, C.W.; Yang, Y.T.C.; Ho, Y.J. Walking pattern classification and walking distance estimation algorithms using gait phase information. IEEE Trans. Biomed. Eng. 2012, 59, 2884–2892. [Google Scholar] [CrossRef]
- Anwary, A.R.; Yu, H.; Vassallo, M. An Automatic Gait Feature Extraction Method for Identifying Gait Asymmetry Using Wearable Sensors. Sensors 2018, 18, 676. [Google Scholar] [CrossRef]
- Iosa, M.; Fusco, A.; Marchetti, F.; Morone, G.; Caltagirone, C.; Paolucci, S.; Peppe, A. The golden ratio of gait harmony: Repetitive proportions of repetitive gait phases. BioMed Res. Int. 2013, 2013, 918642. [Google Scholar] [CrossRef]
- Thong, Y.; Woolfson, M.; Crowe, J.; Hayes-Gill, B.; Jones, D. Numerical double integration of acceleration measurements in noise. Measurement 2004, 36, 73–92. [Google Scholar] [CrossRef]
- Keogh, E.; Kasetty, S. On the need for time series data mining benchmarks: A survey and empirical demonstration. Data Min. Knowl. Discov. 2003, 7, 349–371. [Google Scholar] [CrossRef]
- Cortes, C.; Vapnik, V. Support-vector networks. Mach. Learn. 1995, 20, 273–297. [Google Scholar] [CrossRef]
- Weston, J.; Watkins, C. Multi-Class Support Vector Machines; Technical Report, Citeseer; Department of Computer Science, Royal Holloway, University of London: London, UK, 1998. [Google Scholar]
- Platt, J. Sequential Minimal Optimization: A Fast Algorithm for Training Support Vector Machines; Microsoft: Albuquerque, NM, USA, 1998. [Google Scholar]
- Dorfer, T.; Demetz, L.; Huber, S. Impact of mobile cross-platform development on CPU, memory and battery of mobile devices when using common mobile app features. Procedia Comput. Sci. 2020, 175, 189–196. [Google Scholar] [CrossRef]
- Linares-Vásquez, M.; Vendome, C.; Tufano, M.; Poshyvanyk, D. How developers micro-optimize Android apps. J. Syst. Softw. 2017, 130, 1–23. [Google Scholar] [CrossRef]
Figure 1.
The five-step approach performed by an expert bowling player.

Figure 2.
The data processing flow of the proposed system.

Figure 3.
Sensor placement on foot and wrist with the corresponding coordinate system.

Figure 4.
System architecture and sensor placement on human object.

Figure 5.
The swing angle of a bowler: (a,b) the baseline with the corresponding swing angles from that baseline.
Figure 5.
The swing angle of a bowler: (a,b) the baseline with the corresponding swing angles from that baseline.

Figure 6.
The velocity of the non-bowling leg (a) and the filtered signal (b) with the corresponding gait phases during a throw.
Figure 6.
The velocity of the non-bowling leg (a) and the filtered signal (b) with the corresponding gait phases during a throw.

Figure 7.
The comparison of average quality degree between data with timing errors and non-timing errors for the three phases.
Figure 7.
The comparison of average quality degree between data with timing errors and non-timing errors for the three phases.

Figure 8.
CPU (a) and energy performance (b) of the proposed mobile application.


Table 1.
List of the Extracted Features.
| No. | Description | Equation |
|---|---|---|
| 1 | Maximum of swing angle, gait acceleration and gait velocity | |
| 2 | Mean of swing angle, gait acceleration and gait velocity | |
| 3 | Standard deviation of swing angle, gait acceleration and gait velocity | |
| 4 | RMS of swing angle, gait acceleration and gait velocity | |
| 5 | Swing period of stride K for non-bowling leg | |
| 6 | Stance period of stride K for non-bowling leg | |
| 7 | Swing stance ratio of stride K for non-bowling leg |
IC, IS are initial contact and initial swing, respectively.
Table 2.
Quality degree and time execution for different numbers of templates.
| Number of Templates | Avg Quality Degree (%) | Avg Execution Time (ms) | ||
|---|---|---|---|---|
| Phase 1 | Phase 2 | Phase 3 | ||
| 1 | 210 | |||
| 2 | 390 | |||
| 3 | 500 | |||
| 4 | 632 | |||
| 5 | 855 | |||
| 6 | 1100 | |||
Table 3.
Common Error Detection Results.
| Type Error | Precision | Recall |
|---|---|---|
| 1 | 0.88 | 0.75 |
| 2 | 0.89 | 0.77 |
| 3 | 0.94 | 0.90 |
| 4 | 0.90 | 0.95 |
Table 4.
Classification results of the proposed model.
| Skill | Precision | Recall | F1 |
|---|---|---|---|
| Expert | 0.88 | 0.75 | 0.75 |
| Intermediate | 0.89 | 0.77 | 0.75 |
| Novice | 0.94 | 0.90 | 0.75 |
| Weighted Avg | 0.94 | 0.90 | 0.75 |
Disclaimer/Publisher’s Note: The statements, opinions and data contained in all publications are solely those of the individual author(s) and contributor(s) and not of MDPI and/or the editor(s). MDPI and/or the editor(s) disclaim responsibility for any injury to people or property resulting from any ideas, methods, instructions or products referred to in the content. |
© 2023 by the authors. Licensee MDPI, Basel, Switzerland. This article is an open access article distributed under the terms and conditions of the Creative Commons Attribution (CC BY) license (https://creativecommons.org/licenses/by/4.0/).
Share and Cite
MDPI and ACS Style
Zosimadis, I.; Stamelos, I. A Novel Internet of Things-Based System for Ten-Pin Bowling. IoT 2023, 4, 514-533. https://doi.org/10.3390/iot4040022
AMA Style
Zosimadis I, Stamelos I. A Novel Internet of Things-Based System for Ten-Pin Bowling. IoT. 2023; 4(4):514-533. https://doi.org/10.3390/iot4040022
Chicago/Turabian StyleZosimadis, Ilias, and Ioannis Stamelos. 2023. "A Novel Internet of Things-Based System for Ten-Pin Bowling" IoT 4, no. 4: 514-533. https://doi.org/10.3390/iot4040022