Article

Deep Autoencoder-Based Integrated Model for Anomaly Detection and Efficient Feature Extraction in IoT Networks

by
Khaled A. Alaghbari
1,
Heng-Siong Lim
1,*,
Mohamad Hanif Md Saad
2 and
Yik Seng Yong
1
1
Faculty of Engineering and Technology, Multimedia University (MMU), Melaka 75450, Malaysia
2
Department of Mechanical & Manufacturing Engineering, Faculty of Engineering & Built Environment, Universiti Kebangsaan Malaysia (UKM), Bangi 43600, Malaysia
*
Author to whom correspondence should be addressed.
IoT 2023, 4(3), 345-365; https://doi.org/10.3390/iot4030016
Submission received: 10 July 2023 / Revised: 9 August 2023 / Accepted: 15 August 2023 / Published: 25 August 2023

Abstract

:
The intrusion detection system (IDS) is a promising technology for ensuring security against cyber-attacks in internet-of-things networks. In conventional IDS, anomaly detection and feature extraction are performed by two different models. In this paper, we propose a new integrated model based on deep autoencoder (AE) for anomaly detection and feature extraction. Firstly, AE is trained based on normal network traffic and used later to detect anomalies. Then, the trained AE model is employed again to extract useful low-dimensional features for anomalous data without the need for a feature extraction training stage, which is required by other methods such as principal components analysis (PCA) and linear discriminant analysis (LDA). After that, the extracted features are used by a machine learning (ML) or deep learning (DL) classifier to determine the type of attack (multi-classification). The performance of the proposed unified approach was evaluated on real IoT datasets called N-BaIoT and MQTTset, which contain normal and malicious network traffics. The proposed AE was compared with other popular anomaly detection techniques such as one-class support vector machine (OC-SVM) and isolation forest (iForest), in terms of performance metrics (accuracy, precision, recall, and F1-score), and execution time. AE was found to identify attacks better than OC-SVM and iForest with fast detection time. The proposed feature extraction method aims to reduce the computation complexity while maintaining the performance metrics of the multi-classifier models as much as possible compared to their counterparts. We tested the model with different ML/DL classifiers such as decision tree, random forest, deep neural network (DNN), conventional neural network (CNN), and hybrid CNN with long short-term memory (LSTM). The experiment results showed the capability of the proposed model to simultaneously detect anomalous events and reduce the dimensionality of the data.

1. Introduction

The proliferation of the Internet of things (IoT) with the widespread vulnerabilities discovered in IoT devices has attracted the interest of malicious agents to subvert those devices. Today, IoT devices can be used to build large-scale botnets with significant computational power and network bandwidth. Botnet is a type of malware that converts networked consumer devices into bots or zombies in order to launch distributed denial of service (DDoS) attacks [1]. DDoS is a popular threat that is typically launched by botnets and attempts to degrade IoT services by exhausting resources such as CPU, memory, and bandwidth of the devices. This type of attack may also target servers or network equipment [2]. Botnets have command and control servers (C&C), which are used to communicate with running bots and broadcast commands to them. Bots can carry out a variety of tasks, such as scanning other devices for vulnerabilities, infecting weak systems, sending spam emails, or carrying out various attacks. Bashlite (also called Gafgyt) and its successor Mirai are examples of botnets that have recently caused large-scale DDoS attacks by exploiting IoT devices. Due to the open source codes of these botnets, attackers managed to create many novel variations [3,4].
Cyber security is the technology of securing internet devices and networks from threats and breaches by detecting and monitoring risks and fixing vulnerabilities. Networks usually implement an intrusion detection system (IDS) as a defense wall against different types of cyber-attacks. Malicious activities in IoT networks must be detected and stopped immediately; hence, the function of intrusion detection systems (IDS) has become critical in securing IoT networks by detecting anomalies. Anomaly detection is an emerging type of IDS to detect known and unknown attacks without human intervention, unlike traditional signature-based methods [5,6]. Anomaly detection based on machine learning (ML) and deep learning (DL) techniques has been necessary and effective in detecting cyber-attacks in real time [7]. ML and DL methods can be used to determine whether the traffic flow is benign or malicious through binary classification, and also to classify the malicious attacks into groups of different attack types as a multi-classification task [8]. ML classifiers such as decision tree (DT), random forest (RF), and naïve Bayes (NB) can provide acceptable performance when the training and testing data share similar data distribution; however, when tested on new data with a different distribution, they fail to provide good results [9]. Hence, deep neural networks (DNN), conventional neural networks (CNN), and long short-term memory (LSTM) have been recently used in different applications since they have the capability to learn the complex and nonlinear structure of the input data [5,9].
Datasets with many features often contain a lot of redundant or duplicated information. The purpose of the dimensionality reduction technique is to eliminate these interferences and consequently improve the training and detection time. There are two techniques for dimensionality reduction, which are feature selection and feature extraction [10]. In feature selection, the most important features are selected based on the employed algorithm such as mutual information (MI), Chi-square, and analysis of variance (ANOVA). On the other hand, the feature extraction technique produces new low-dimension features from the original features. Principal component analysis (PCA) and linear discriminant analysis (LDA) are well-known linear dimensionality reduction techniques for feature extraction. PCA is an unsupervised method while LDA is a supervised method. Early data dimensionality reduction systems generally use linear approaches since they are simpler to calculate than nonlinear methods. However, many of the problems we encounter include nonlinear and time-varying systems, and there are currently relatively fewer studies on nonlinear feature reduction techniques.
Autoencoder (AE) is a nonlinear unsupervised learning model that is trained to minimize the error between the input and output sets, where it is usually trained using a part of the data such as the normal set only. AE consists of an encoder that transforms the input data into a compressed form known as bottleneck features or latent space, and a decoder to transform back the compressed data into the original data. AE is used to detect anomalies based on reconstruction error (RE) calculated from the difference between the original and reconstructed samples. To distinguish between normal and anomalous data, it usually produces higher RE for anomalous samples than normal samples [6]. In addition to that, it can be used as a feature extraction technique, where the compressed data is used for other purposes such as classification [11]. AE has been shown to have a useful function in addition to its dimensionality reduction ability such as detecting repetitive structure (i.e., redundant information) in the MINST dataset, which is considered to be a good feature for many applications [12].
In this work, we focus on implementing AE for anomaly detection and also exploiting the trained AE model to reduce dataset features to further classify groups of malicious attacks. The process of projecting high-dimensional data into a low-dimensional space will inevitably result in the loss of some original information. Therefore, the main challenge is to obtain useful reduction data from the high-dimensional dataset in order to meet the recognition accuracy and storage requirements while optimally maintaining the essential characteristics of the original data. The proposed integrated AE model aims to provide new lightweight IDS that is computationally efficient and effective for the IoT environment. The main contributions of this article are summarized as follows:
  • We propose a new lightweight IDS system for IoT networks by fully utilizing a deep AE model to do anomaly detection, and feature reduction for multi-classification of the detected cyber-attacks, unlike the existing methods that used AE for either anomaly detection or feature reduction;
  • The proposed system is extensively evaluated with real datasets, namely N-BaIoT and MQTTset, which contain normal and malicious network traffic. Classification performances of five IoT devices are evaluated based on accuracy, precision, recall, F1 score, and execution time;
  • The effectiveness of the proposed IDS system is compared with state-of-the-art methods.
This paper is organized as follows: Section 2 provides the literature works related to AE, feature reduction methods, popular datasets, and ML and DL techniques that are used. Section 3 introduces AE and the proposed integrated system. Section 4 presents our experimental results and discussion, where it starts by introducing the implemented datasets and experiment setup, followed by our findings for anomaly detection, feature extraction analysis, and multi-classification. Finally, Section 5 concludes the paper.

2. Related Works

In [13], Meidan et al. proposed an autoencoder (AE) for anomaly detection based on a real developed dataset called N-BaIoT for detecting botnet attacks on nine IoT devices. The IoT devices were infected by two common types of botnets, namely BASHLITE (Gafgyt) and Mirai attacks. The performance of the AE model was promising compared to other methods such as one-class support vector machine (OC-SVM), isolation forest (iForest), and local outlier factor (LOF) in terms of detection time, true positive rate (TPR), and false positive rate (FPR). The dataset consisted of a big number of samples and 115 features extracted from the network traffic based on different statistical measures such as means, variance, covariance, and correlation coefficient. In [14], a hybrid deep learning model based on convolutional neural network (CNN) and long short-term memory (LSTM) networks was proposed to detect botnet attacks based on the N-BaIoT dataset. The model was used to classify benign and 10 malicious attacks on 9 IoT devices. In [15], a fusion model combining two deep neural networks was proposed to do binary normal/attack classification and then multi-attack classification. The system was tested on ZYELL’s dataset, and compared to a baseline model that employed multi-classification for benign and malicious attacks together as in [14]. Aygun et al. [16] proposed to use AE and denoising AE (DAE) to detect zero-day attacks with high accuracy. A stochastic approach was also developed to determine the threshold value of the AEs and it was tested on the NSL-KDD dataset. The results showed that the AE and DAE performed very close to each other in terms of accuracy, precision, F-score, and recall, where they outperformed other anomaly detection techniques such as Fuzzy classifier, random tree, and naïve Bayes (NB) tree in terms of accuracy. Zavrak et al. [17] employed AE and variational AE (VAE) techniques to detect unknown attacks using the CICIDS2017 network traffic dataset. Receiver operating characteristics (ROC) and area under the curve (AUC) were evaluated and compared with the one-class support vector machine (OC-SVM) method. The experimental results showed that VAE outperformed AE and OC-SVM in most cases. Min et al. [18] proposed a memory-augmented deep AE (MemAE) for a network intrusion system, where the AE was trained to reconstruct the input of anomalous data that was close to normal samples in order to solve the over-generalization problem of AEs. Experiments on the NSL-KDD, UNSW-NB15, and CICIDS 2017 datasets confirmed that the proposed method outperformed other OC-SVM models. However, in all of these studies, even though the dataset had a huge number of features, which will most probably increase the computational time, the feature reduction method was not used.
In [19], feature extraction based on AE was implemented to transform features to lower dimensions to accelerate the training process and improve accuracy. AE with different activation and loss functions were used to study how accuracy can be improved with the support vector machine (SVM) classifier. The authors found that the ReLU activation function and cross-entropy loss function gave the best accuracy compared to other functions using KDD-CUP’99 and NSL-KDD datasets. The authors also compared AE with principal component analysis (PCA) and linear discriminant analysis (LDA) techniques, and found that SVM with AE produced much better accuracy, precision, and F1-score than SVM with PCA and LDA; however, feature extraction by AE took a longer time. Nevertheless, the authors did not compare the SVM classifier with other ML classifiers. In [7], an anomaly-based IDS for IoT networks was proposed based on 1D, 2D, and 3D CNN models to create a multi-class classification system. A feature selection technique called recursive feature elimination (RFE) was used to extract features from different datasets. The proposed model was validated using different datasets such as MQTT-IoT-IDS2020, BoT-IoT, IoT-23, and IoT network intrusion. In [11], feature extraction based on AE for the CICIDS2017 dataset was proposed where the latent features were then extracted to do multi-malicious classification based on the random forest (RF) method. The proposed system was evaluated with different encoder/decoder layer structures in terms of accuracy, precision, recall, F1-score, as well as training and testing time; however, no comparisons to other feature extraction and multi-classifier methods were performed. Similarly, in [20], the latent features of AE were extracted to do binary (legitimate/anomaly) classification based on OC-SVM. In [21], an AE-based anomaly detection method was proposed since AE has the ability to capture the nonlinear correlation between features. Convolutional AE (CAE) was selected for feature extraction and compared with AE and PCA reduction methods. CAE was preferred since it has a smaller number of parameters and requires less training time compared to AE. The system was then evaluated using the NSL-KDD dataset and the results showed that CAE outperformed AE and PCA in terms of detection accuracy and false positive rate (FPR). In [22], a hyper approach based on LSTM autoencoder and OC-SVM that can detect anomalies in intrusion detection systems for SDN (InSDN) dataset was proposed. The low-dimensional features of the AE were trained with OC-SVM for anomaly classification. The experiment result showed that the proposed model provided a higher detection rate and reduced the processing time significantly. In [23], Rao et al. proposed a two-staged hybrid IDS based on sparse AE (SAE) and a deep neural network (DNN). In the first stage, SAE was used to extract the feature to effectively represent the dataset. Then, DNN was employed for multi-class classification. The experimental results showed that the proposed model outperformed the conventional models in terms of overall detection rate and false positive rate when tested on KDDCup99, NSL-KDD, and UNSW-NB15 datasets. Conventional IDS requires a long time to detect attacks and is unable to detect zero-day attacks; therefore, IDS based on the PCA-DNN model was proposed in [24] to detect abnormal network behavior such as DDoS, DoS, brute force, heartbleed, botnet, and insider infiltration attacks using CSE-CICIDS2018 dataset. The model was used for binary and multi-class classifications. Experiment results showed that the accuracy achieved without PCA was 98%, but it took a long time to process, whereas the same performance can be achieved with PCA when the number of components was 12.
It is important to note that these studies used AE either for anomaly detection only, as in [13,16,17,18], or used it for feature extraction only, as in [19,20,21,22,23]; hence, they did not fully make use of the advantages of AE. However, in our proposed unified model, we exploit AE for both anomaly detection and feature extraction to provide a cost-effective system that does not require an external feature reduction method. The aim of the analysis in this paper is to show that the proposed model provides robust and fast anomaly detection and investigates the feature extraction ability of AE in comparison with state-of-the-art dimensionality reduction techniques such as PCA and LDA.

3. Methodology

This section provides an overview of the autoencoder (AE) and presents our proposed model.

3.1. Autoencoder (AE)

Autoencoder (AE) is a type of neural network model that is used to learn a compact representation of the input data, which can be used for the reconstruction of the original input [25]. As illustrated in Figure 1, AE consists of an encoder network, a bottleneck layer called a hidden latent vector, and a decoder network. A stacked AE is a deep learning AE in which the encoder and the decoder have multiple hidden layers.
AE with a single hidden layer in the encoder and decoder can be represented by the following equations [18]:
z = σ W e n c o d e r x + b e n c o d e r
x ^ = σ W d e c o d e r z + b d e c o d e r
where x represents the input vector (normal/benign data), z represents the bottleneck low-dimensional feature space, σ is an activation function, and W and b are the weight and bias parameters.
Equation (1) is used by the encoder network to map the input features into low-dimensional features, while the decoder network uses Equation (2) to recover the original data x from the projected low-dimensional features z .
The main objective of training the AE model is to minimize the reconstruction error (RE) function representing the difference between the input and output of the AE model, which is given as [20]:
L x , x ^ = x x ^ 2 2
where · 2 represents the Euclidean norm. Once the AE model is obtained from the training dataset, the AE model can be used for the validation dataset to determine a threshold value. Then, the mean square error (MSE) between the true validation data x v a l and predicted validation data x ^ v a l is calculated as:
M S E v a l = 1 / N N x v a l x ^ v a l 2
where N is the number of validation samples. The threshold value that discriminates between the normal and attack data is calculated from the sample mean and standard deviation as [13]:
T h r e s h o l d = m e a n M S E v a l + s t d ( M S E v a l )
The RE function is used by the AE model in network anomaly detection tasks to determine whether a network traffic sample is anomalous or not. Since the AE model has been trained on normal network traffic only, it should produce low RE when it receives normal data and high RE when it encounters anomalous data.

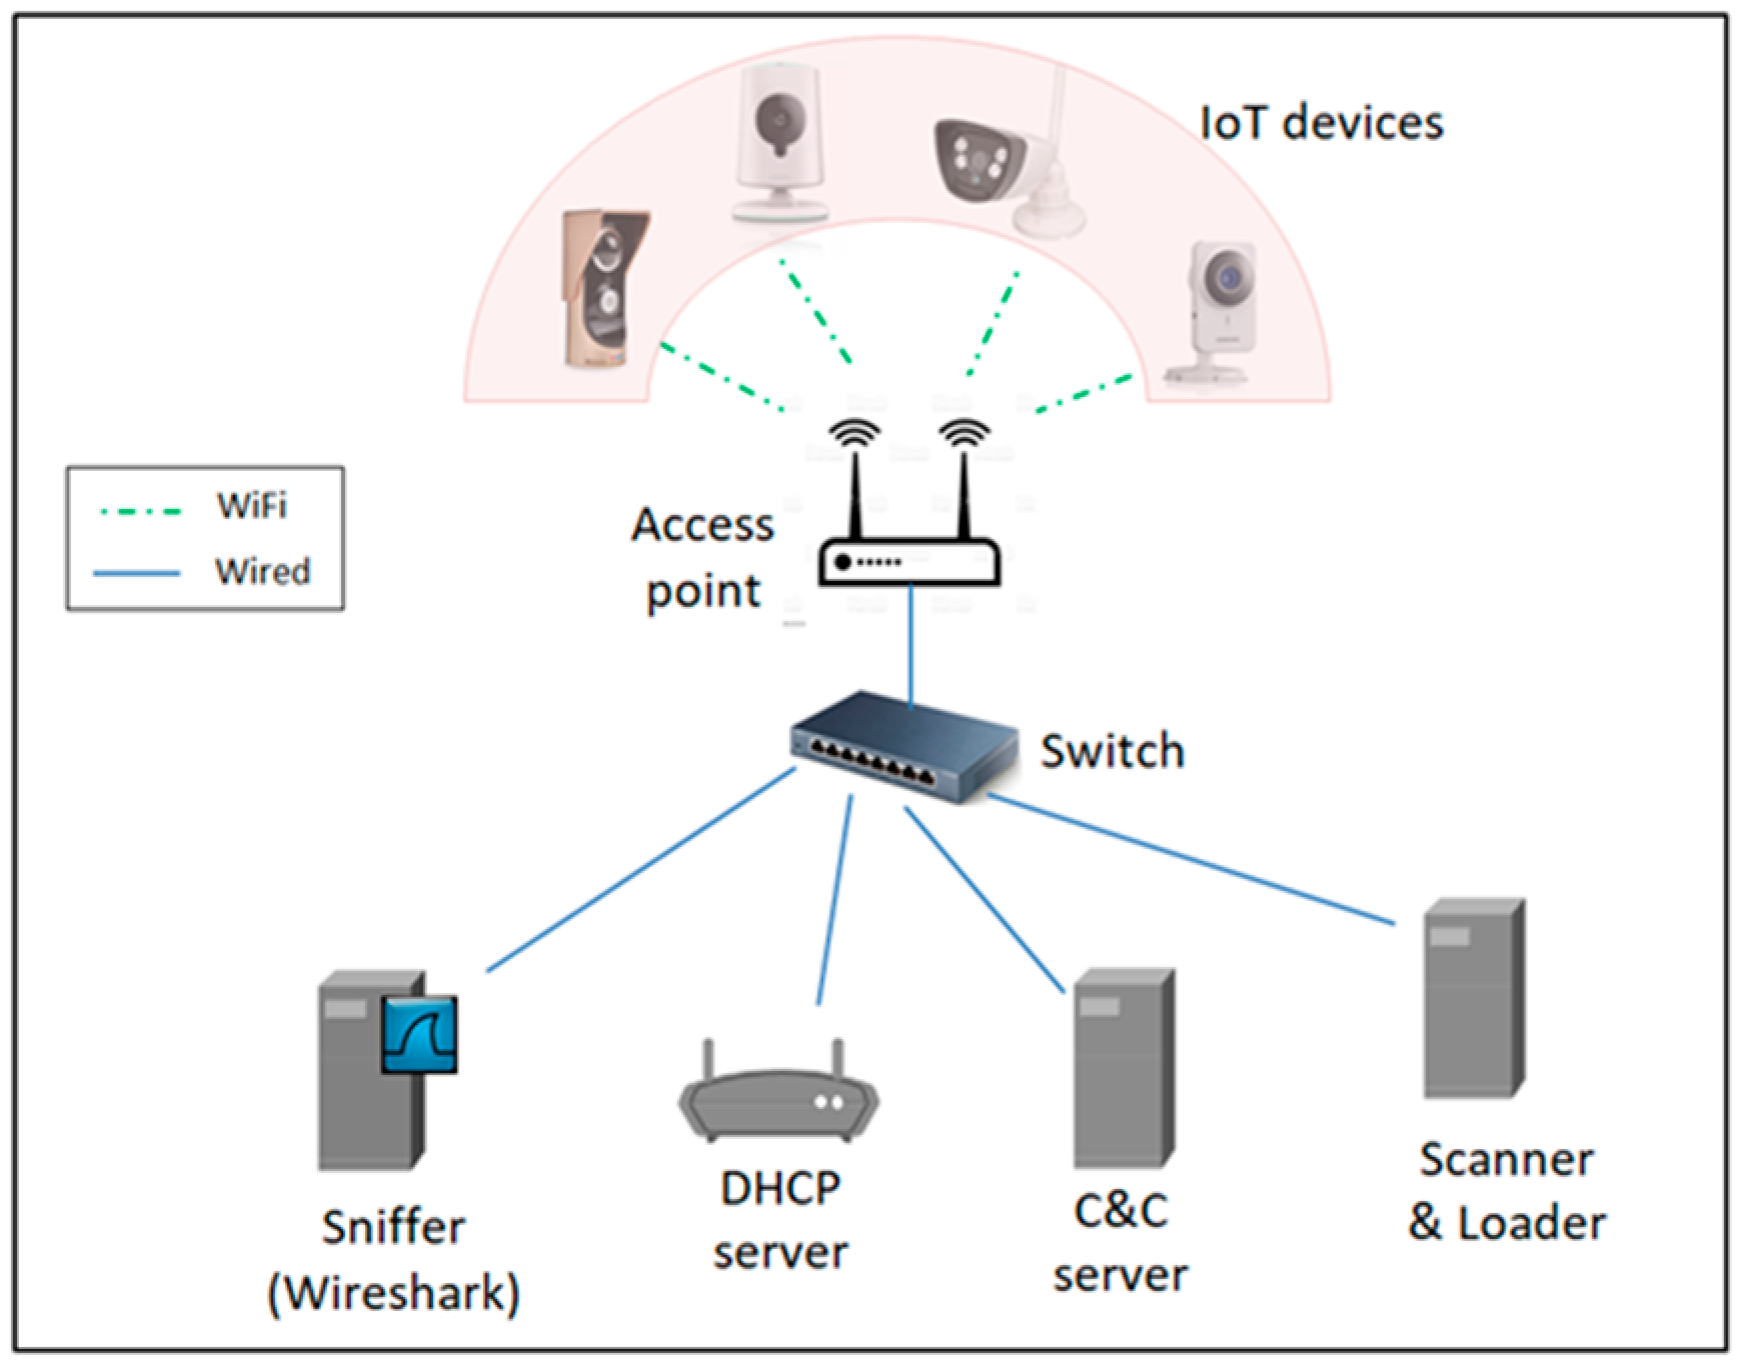
3.2. Proposed System

Figure 2 shows the structure of the proposed integrated autoencoder (AE) for anomaly detection and feature extraction for multi-classification. The system consists of three stages, namely training, testing, and detection. The upper part can be used to detect an anomaly, which can be considered as a binary classification, whereas the lower part can be used to further classify the type of cyber-attack if an anomaly is detected.
The dataset contains normal data and cyber-attack samples, where the AE uses r 1 % of the normal data for training purposes; then, the trained AE model is saved in the storage for later testing and reduction of the attack features. The remaining r 2 % of the normal data will be combined with the cyber-attack data and fed to the saved AE model to detect anomalies. If no anomaly is detected, the system is terminated. If an anomaly is detected, the encoder part of the trained/saved AE model is extracted and used to reduce the features of the cyber-attack data. After that, the extracted feature with lower dimensions is divided accordingly, with r 1 % for training a multi-classifier (MC) such as DT, RF, NB, or DNN, while the remaining r 2 % is used to test the performance of the trained MC model and finally output the type of attack.
It is important to note that the proposed system is cost-effective (lightweight) since the trained AE model is used to detect anomalies and is also used to extract features instead of employing new dimensionality reduction techniques such as PCA or LDA. In addition, transforming the samples to a new subspace requires only passing each sample through the trained encoder which contains the weights. On the other hand, PCA, for instance, involves using the whole training dataset to compute the mean, covariance matrix, and principal components, then transforming each sample into a new low-dimensional subspace.

4. Results and Discussion

4.1. Datasets

We used the N-BaIoT dataset, which contains real data collected from IoT devices connected to the network and infected by botnets such as Gafgyt (BASHLITE) and Mirai, as shown in Figure 3. The experiment setup included scanner and loader components, which were used for scanning and finding vulnerable IoT devices and loading malware into such devices. Once the IoT device became infected, it immediately began scanning the network for new victims while awaiting commands from the C&C server. DHCP server was used to assign dynamic IP addresses to the IoT devices on the network, and Wireshark was used as a tool for packet sniffing. When a packet arrived, a behavioral snapshot of the hosts and protocols that communicated with this packet was recorded using port mirroring on the network switch.
The N-BaIoT dataset contains both normal traffic and malicious traffic (five Gafgyt attacks and five Mirai attacks) for nine IoT devices. It consists of 115 features collected from network traffic based on different statistical measures such as means, variance, number, radius, magnitude, covariance, and correlation coefficient which are aggregated by source IP, source MAC-IP, and channel. In our analysis, we used N-BaIoT datasets for 4 IoT devices as described in Table 1, where the first three devices contained big data compared to the last one, which only had a Gafgyt attack. The Gafgyt botnet consists of five attacks, namely Scan, Junk, UDP flooding, TCP flooding, and COMBO (sending spam data and opening a connection to a specified IP address and port). The Mirai botnet also comprises five attacks, namely Scan, Ack flooding, Syn flooding, UDP flooding, and UDPplain. In the Scan attack, the botnet scans all IP addresses on the network for unsecured devices in order to determine their login information. By continuously delivering acknowledgment (Ack) packets and initial connection request (SYN) packets, the Ack flooding and Syn flooding attacks try to make the target inaccessible to legitimate traffic [1]. UDPplain and UDP flooding both send an enormous number of UDP packets to the destination, where the former sets a UDP port as the destination and the latter sends the packets to random ports [1,2].
The dataset for the fifth IoT device (IoT5) was taken from the MQTTset dataset, which was introduced by Vaccari et al. [26] and then improved in [27] by introducing a large number of features (i.e., 76). It is composed of 10 sensors of different natures (i.e., motion, temperature, humidity sensors, etc.) which are located in two separate rooms. The N-BaIoT dataset focuses on Wi-Fi communication, while the MQTTset dataset includes communications based on the message queue telemetry transport (MQTT) protocol. MQTTset contains both normal network traffic and 5 malicious attacks with 76 features as described in Table 1.

4.2. Experiment Setup

AE was built using Keras and TensorFlow libraries that are available freely on Python, while the ML techniques and classification performance metrics were extracted from the Sklearn library. The encoder of the proposed AE consists of 3 hidden layers with 64, 32, and 16 neurons; between each hidden layer, BatchNormalization and LeakyRelu layers were used [13]. The decoder is the symmetrical form of the encoder with 16, 32, and 64 neurons in the three hidden layers. The input and output layers have 115 neurons, whereas the bottleneck layer has 2, 3, or 8 neurons. Adam/SGD optimizer and MSE as the loss function were used to compile the model, where 20 epochs with a batch size of 60 were used to train the model.
The number of normal and attack data of the IoT1 dataset is illustrated in Figure 4a, where Figure 4b displays the distribution of the cyber-attack data. The data in Figure 4a was used for anomaly detection and the cyber-attack data in Figure 4b was used for multi-classification. Figure 4a shows the number of attacks or anomalous data is greater than normal or benign data. Figure 4b also shows an imbalance distribution of attack data especially with G.Junk, G.Scan, and M.UDP, where G stands for Gafgyt/BASHLITE attack and M stands for Mirai attacks.

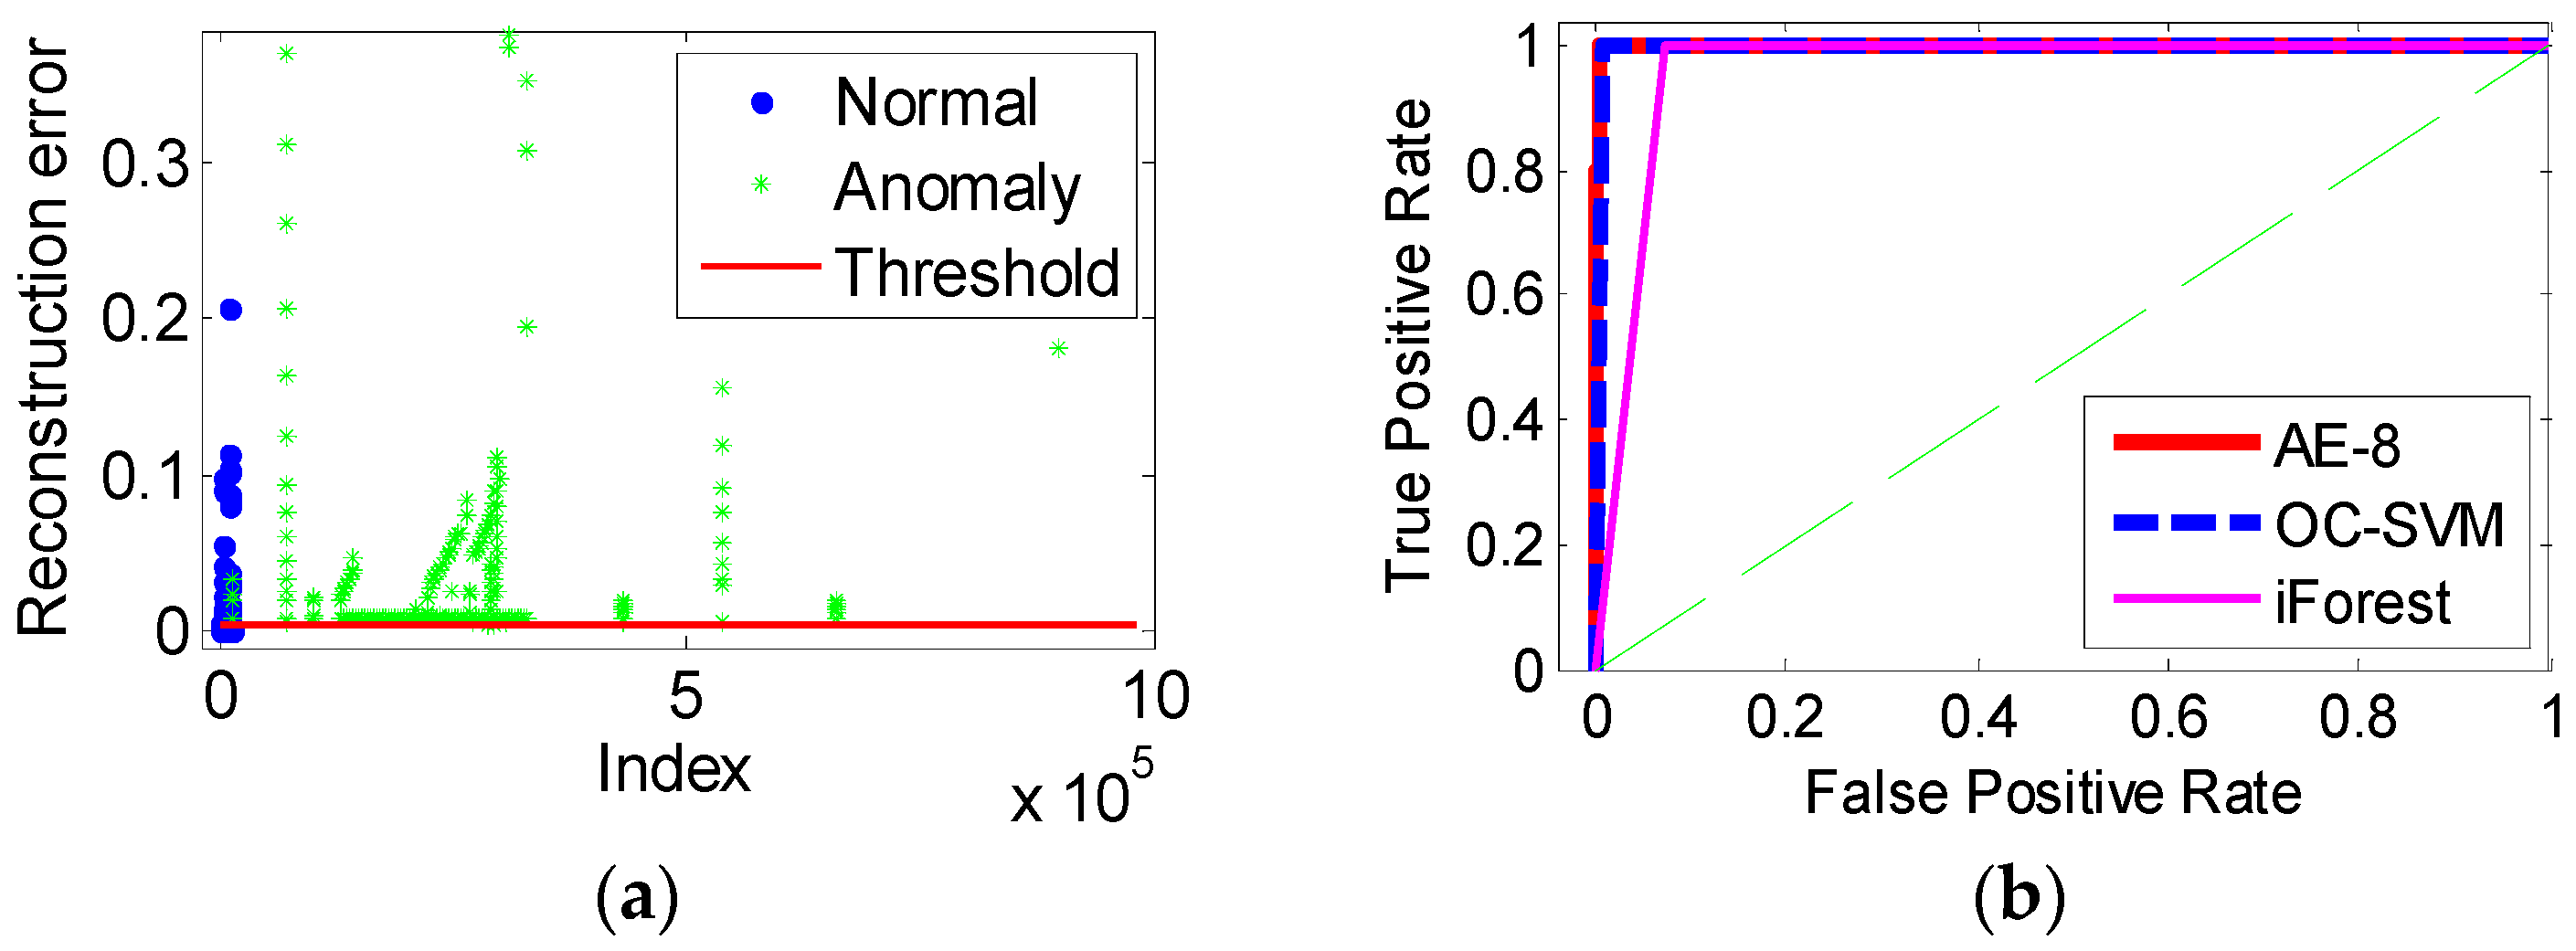
4.3. Anomaly Detection

Table 2 shows the performance of different anomaly detection techniques such as OC-SVM, iForest, and AE to classify data on the four IoT devices. OC-SVM showed comparable performance with AE in terms of accuracy, precision, recall, and F1-score, while iForest showed a slight degradation in performance. AE with eight extracted features (AE-8) had better performance than AE-2 and AE-3. In terms of training time, AE consumed a much longer time than OC-SVM and iForest; however, the detection time by AE was much better than the other two classifiers. For example, the anomaly detection time for IoT1 and IoT2 testing datasets based on OC-SVM and iForest took more than 1 and 2 min, respectively, while AE’s detection time was less than 0.5 min. For IoT5, we can see that the models had totally separated all anomaly samples, which were 100,044 samples; however, they had difficulties in distinguishing normal data, especially iForest. OC-SVM obtained comparable results with AE but it consumed high training and testing time. AE based on two, three, and eight extracted features outperformed OC-SVM and iForest in terms of performance metrics and detection time.
Figure 5a shows the reconstruction error (RE) (for only RE with smaller values) where the threshold value 0.0038 was calculated based on Equation (5). The samples of the normal network traffic had low RE, with the highest being ~0.2, while the anomalous samples had greater RE than the selected threshold value and were extended to more than 50 k. The threshold value was able to correctly separate the anomaly data; however, 61 samples of the normal data above the threshold line were wrongly classified as an anomaly, while 12,326 samples that were below the threshold line were correctly classified as normal traffic. In the case of normal traffic, the trained AE was able to reconstruct the input samples from the output layer with low RE; however, in the case of anomalies, the trained AE model failed to reconstruct the samples since it had not seen these samples before, consequently giving them a high RE. Figure 5b shows the ROC for the three anomaly detection techniques, where we can see that AE-8 and OC-SVM performed better than iForest since the ROC was very close to one, which indicates that the models can successfully separate the positive and negative rates.
In Figure 6, we plotted the boxplot for the RE of each attack to obtain a deep insight into the statistics of these attacks. The boxplot shows the median (line in the middle of the box), minimum and maximum (line coming out of the box, extended from minimum (lower) to maximum (upper)), and outliers (circles) values. The lowest RE (less than 0.22) was attained by the normal network traffic, which indicates that AE had been well trained, followed by G.UDP and G.TCP attacks, where both attacks had similar data distribution and were depicted as outliers by the boxplot, as shown in the magnified subset of Figure 6. It is expected that ML classifiers will confuse these two attacks since it is difficult to discriminate between them. The other attacks had no outliers, which are represented by the clean whisker boxes.

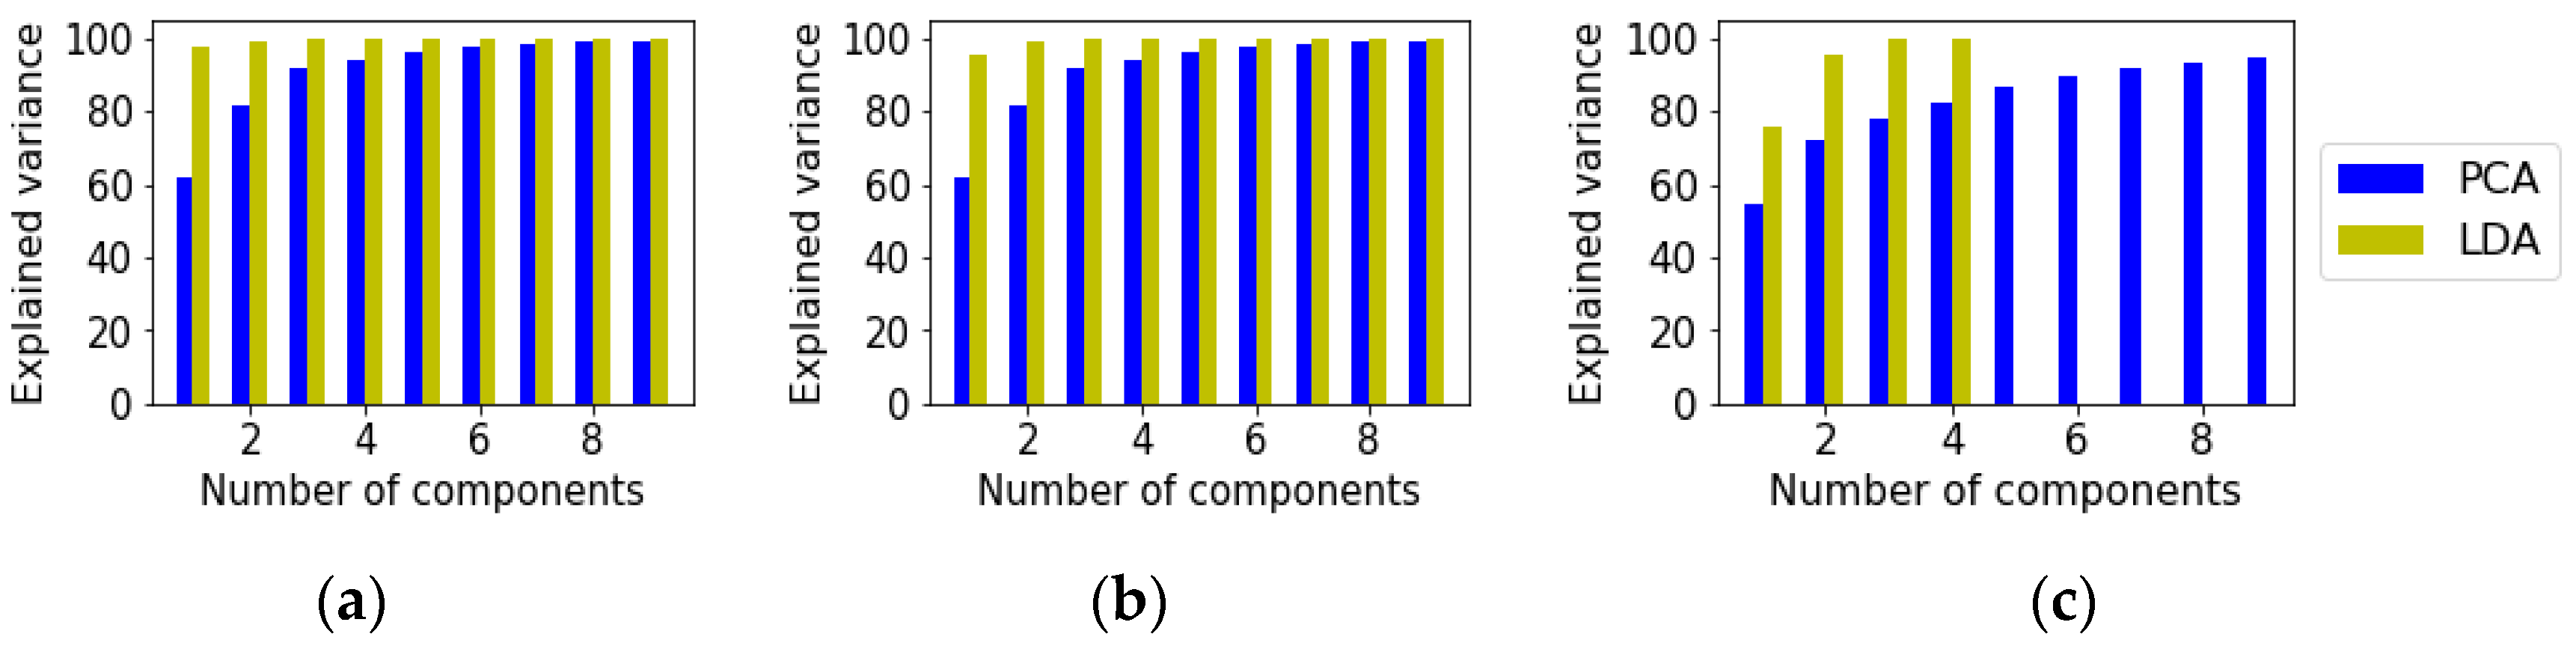
4.4. Feature Extraction

Table 3 shows the time taken by the PCA and LDA techniques to reduce the dimensionality of the training and testing datasets. Generally, PCA took a shorter time than LDA to reduce the data to a low dimension for both training and testing datasets. It is important to note that the proposed AE does not require a training stage for the dataset to reduce the features; indeed, each sample will pass through the trained/saved encoder, which contains the previously obtained weights from training the normal traffic data during the anomaly detection stage. However, PCA, for instance, requires the whole training dataset to compute the mean, covariance, and eigenvalues to obtain the principal components needed to get the low-dimension features. For this reason, our proposed unified AE model represents a lightweight solution compared to the existing solution that employs PCA or LDA.
We applied PCA to the training data to select the best number of components. We can see that the first 2, 6, and 10 components for the IoT1 device captured 81.6%, 97.34%, and 99.5% of the variability in the original data, as shown in Figure 7a. For LDA, the first component captured about 97% variability while the second component captured 99% variability, where the number of components for LDA depends on the number of classes-1. The results for the PCA and LDA components for IoT2 that are shown in Figure 7b were almost similar to that obtained for IoT1. For IoT5, LDA scored 75.5%, 95.5%, and 100% with 1, 2, and 4 components, respectively, while PCA scored 54%, 72%, 93%, and 95% with 1, 2, 8, and 10 components, respectively.

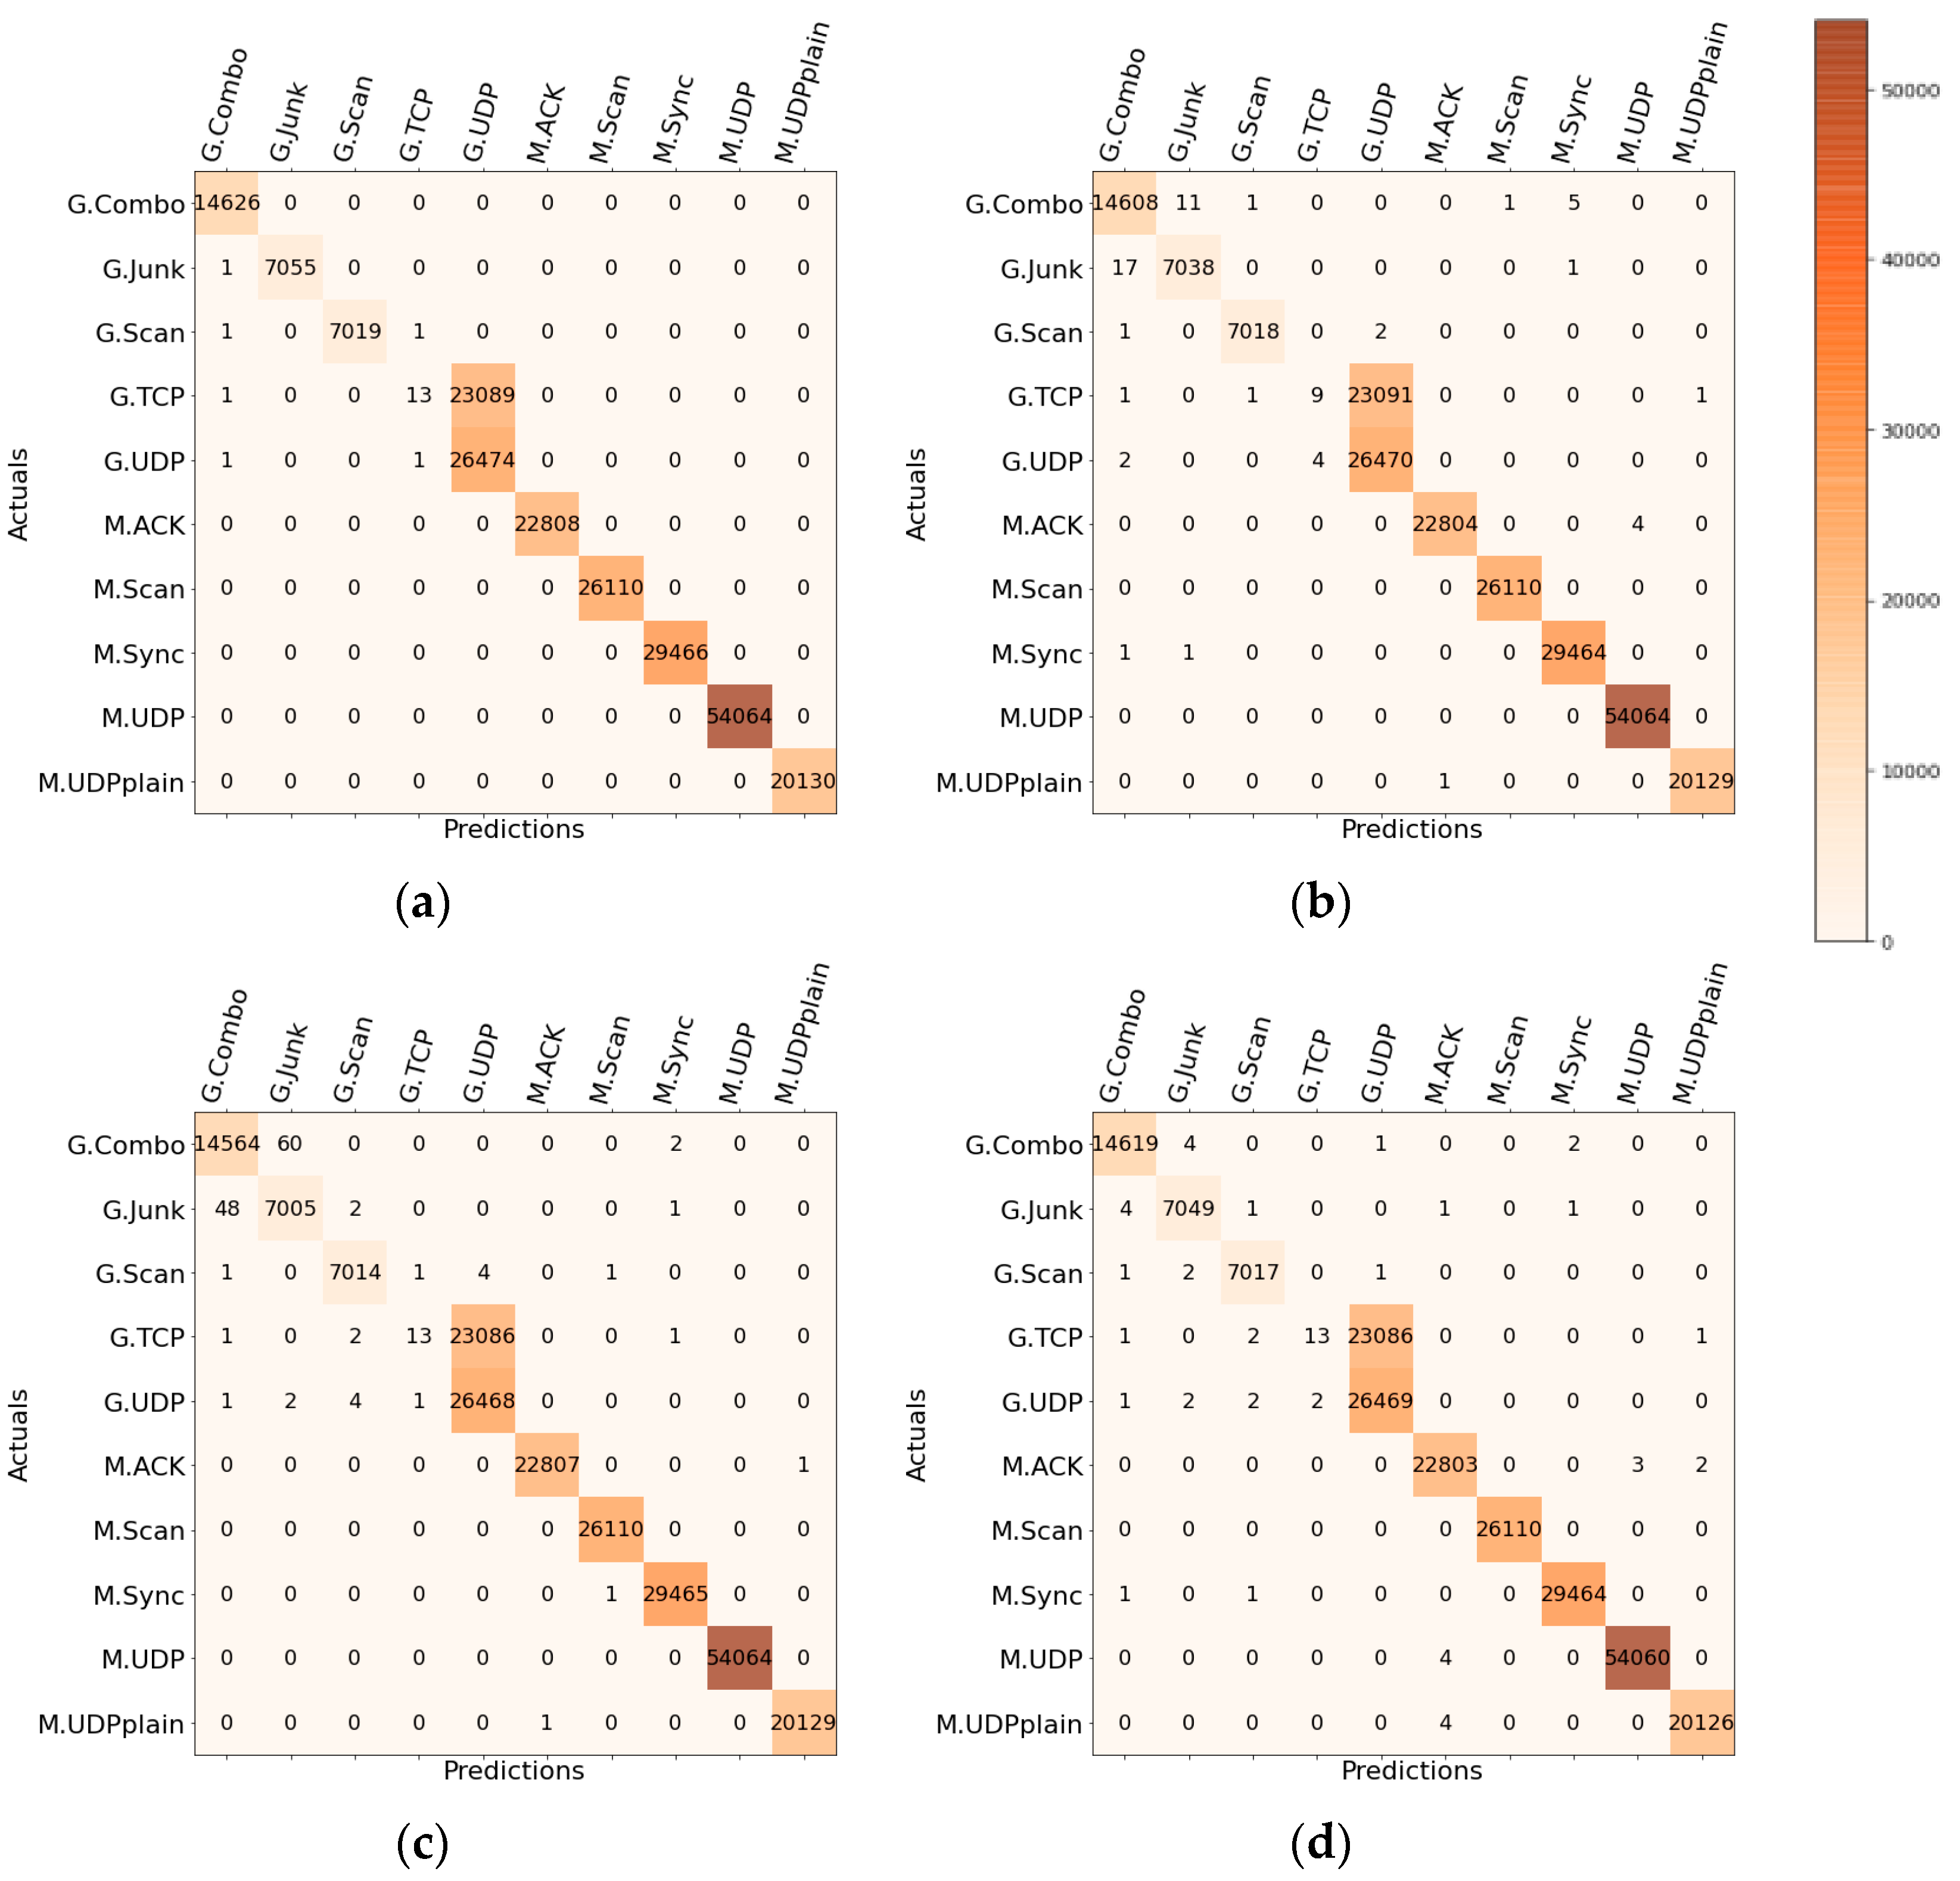
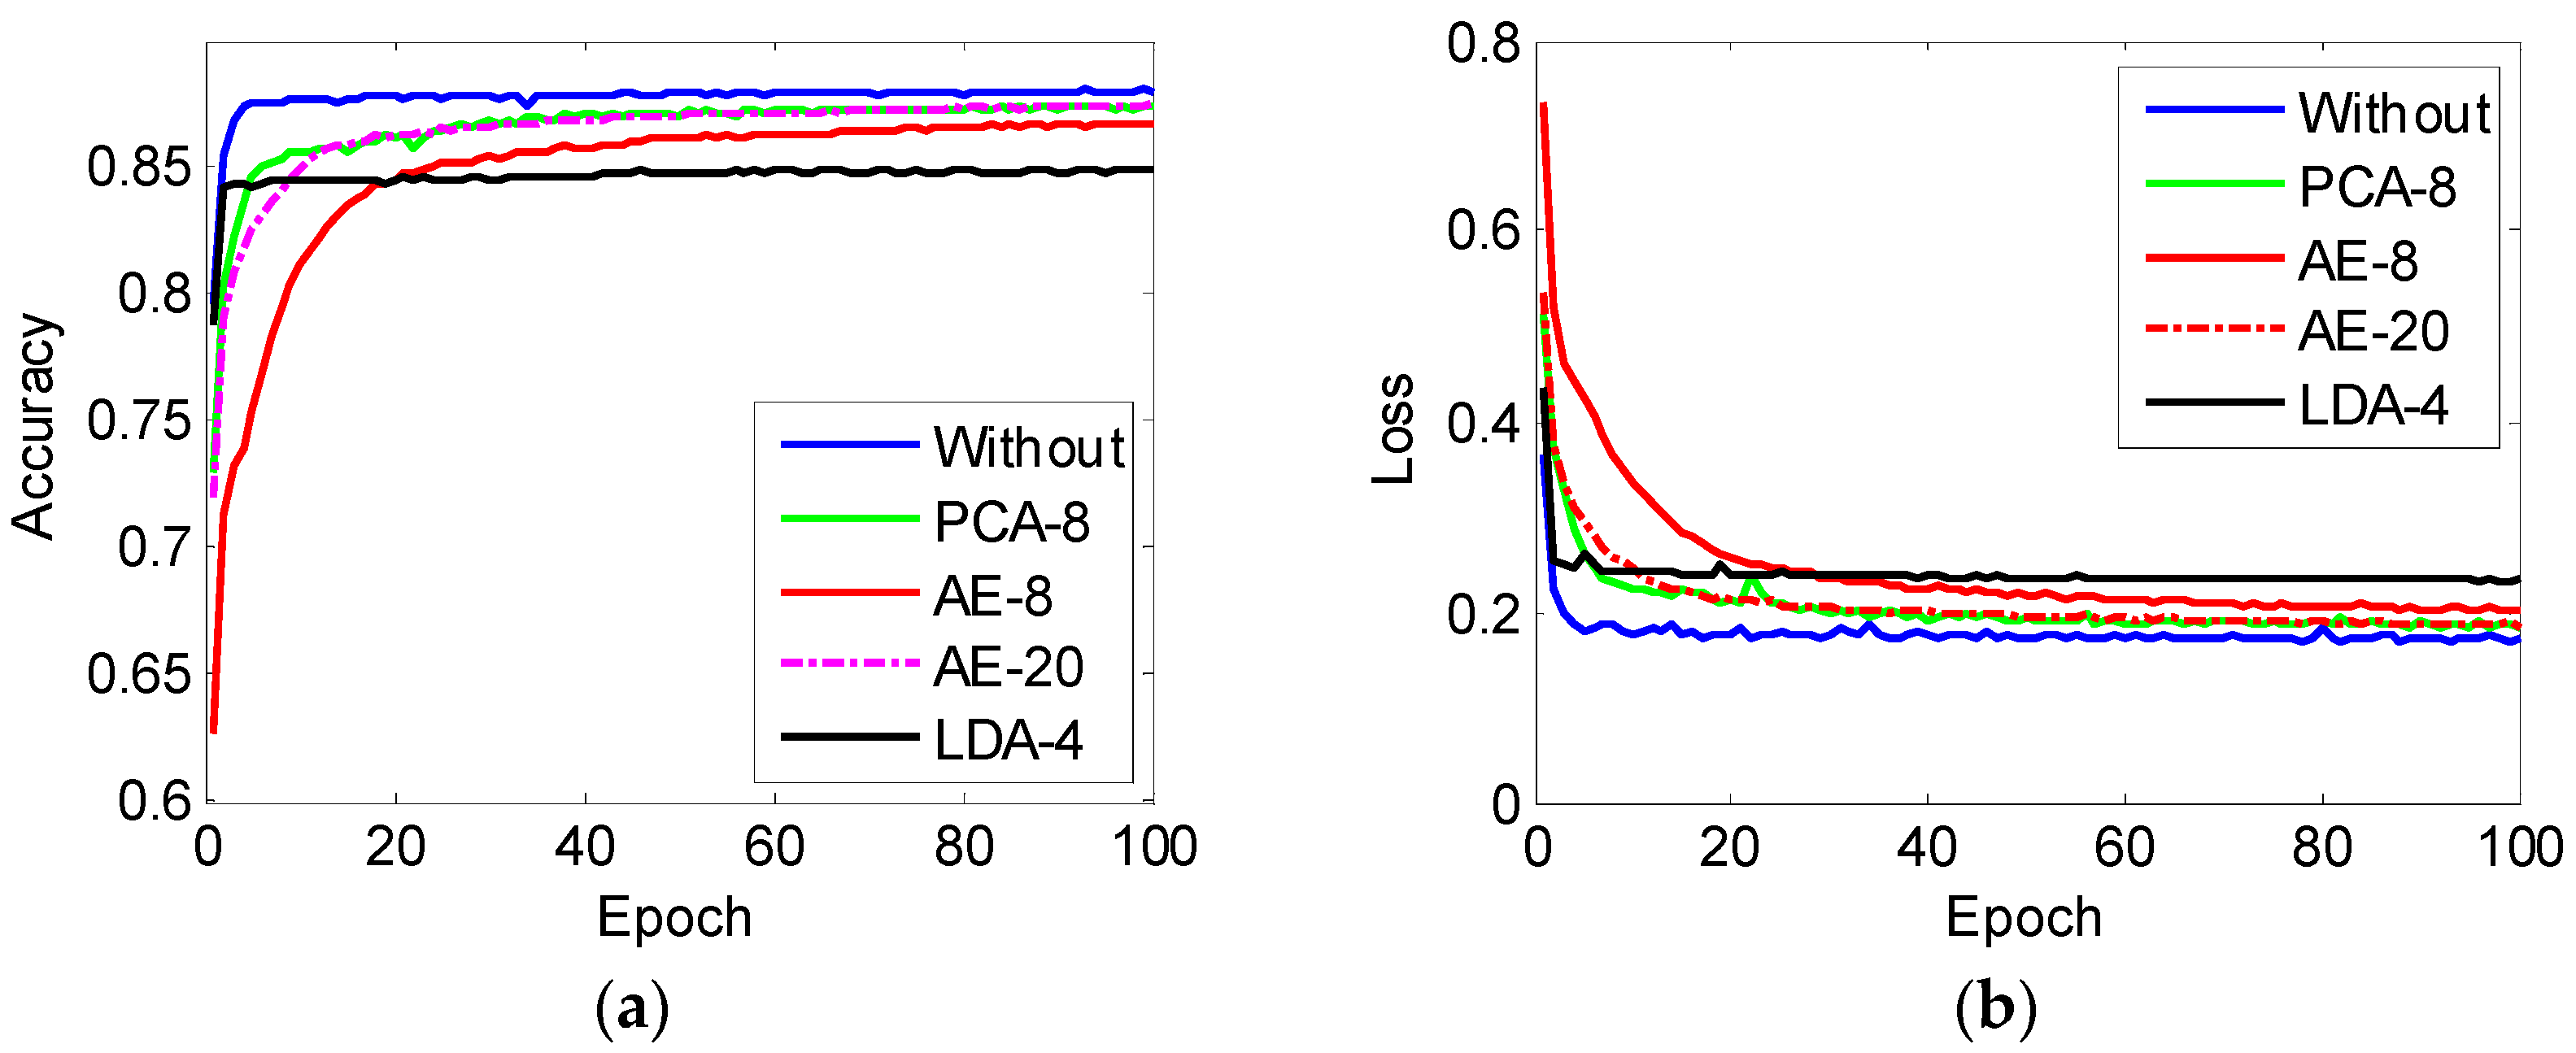
4.5. Multi-Classification

In this section, we analyzed the proposed system using different ML and DL classifiers such as DT, XTree, RF, and DNN for five IoT datasets. We compared the performance of AE with other feature reduction techniques such as PCA and LDA. The dataset was divided into 75% for training and 25% for testing; for deep learning models, the training set was further split into 75% for training and 25% for validation. The results obtained by the CNN-LSTM model proposed in [14], where the dataset was divided into 70% for training and 30% for testing, are presented in Table 4, Table 5, Table 6 and Table 7 to confirm that their results are close to what we obtained. We implemented the hybrid CNN-LSTM model and our results are presented in Table 8 and Table 9. In addition, two architectures of DNNs were implemented, where DNN1 has two hidden layers (64, 32) and DNN2 has three hidden layers (64, 64, 64).
Table 4 and Table 5 present the analysis of different ML and DL multi-classifiers without and with feature extraction based on PCA, LDA, and AE. The comparison was conducted in terms of performance metrics such as accuracy, precision, recall, F1-score, and computational time for training and testing datasets. The table first shows the results obtained from the classifiers when no feature extraction techniques (i.e., without case) were applied for the dataset of IoT1. DT, XTree, RF, and DNN2 showed comparable results, where the best results in terms of performance metrics were achieved by RF, while the worst performance was attained by the NB classifier. XTree provided a good trade-off between accuracy and computational time, while RF showed good robustness with increased computational time compared to DT and XTree.
Deep learning models utilized the highest time in training and detection compared to previous classifiers. We then applied PCA with 2, 8, and 10 components; we found that the best performance that can be achieved was close to the results of the “without” case, either by using 8 or 10 components. For the LDA method, the best performance can be achieved by using four components. We also tested the proposed AE at different numbers of extracted features such as two, three, and eight to show the capability of the extracted features to be applied for the classification task. We found that the performance improved as the number of extracted features increased, where eight extracted features yielded results close to that achieved by PCA-8 and LDA-4. In terms of computation time, we can observe a clear reduction in the training and detection time for DT, XTree, NB, and certain cases for DNN1 and DNN2. The proposed AE showed better computational time consumption compared to PCA using DNN1 and DNN2. RF showed not much reduction in time; indeed, the training time and testing time increased with a certain number of components compared to the case of no reduction.
The correlation or the degree of the relationship between the features of the cyber-attack samples can be analyzed to determine whether the feature reduction method is needed. The correlation matrix of all 115 features and extracted features for the proposed AE are illustrated in Figure 8. A perfect positive correlation is represented by 1 (white color), −1 (black color) indicates a perfect negative correlation, no correlation is represented by 0, while a weak correlation is represented by values that ranged near 0 (red color). In Figure 8a, it is shown that there was a strong correlation between certain features, especially the first 30 features. When two features are highly correlated, it is possible to drop one of them to reduce the dimensionality of the dataset [15]; the alternative is to apply a feature reduction method such as the proposed AE. Figure 8b shows the correlation matrix after applying AE-2, which showed no correlation between the two extracted features; meanwhile, AE-3 showed one extracted feature had a high correlation (0.86) with the first feature, as can be seen in Figure 8c. For AE-8 in Figure 8d, there was only one extracted feature having a high correlation (0.81) and one feature having a medium correlation (0.53) with the first feature.
In Table 6, we compared the performance of classifiers such as DT, XTree, RF, and DNN2. The best result was achieved by AE-8. We can observe that the performance metrics such as accuracy, recall, and F1-score had been maintained before and after applying AE-8, with only a 2% drop in the precision of XTree and DNN2. PCA-8 and LDA-4 also performed well with regard to the degradation in performance metrics of DNN2 classifiers. In terms of execution time, RF showed a small decrease in the training time without any improvement in the detection time. On the other hand, DT, XTree, and DNN2 showed a good reduction in execution time for training and testing sets.
The confusion matrices for the RF classification of cyber-attacks using IoT2 with different feature reduction methods are given in Figure 9. We can observe that the classifier had problems in classifying G.TCP and G.UDP attacks. This is due to the similarity of the feature data, which is also evident from the reconstruction error obtained earlier in Figure 6 for IoT1 (the RE for IoT2 was also similar to the RE of IoT1). The confusion matrix without employing any reduction techniques showed the best performance (Figure 9a), where most of the off-diagonal elements are zero, followed by the proposed AE-8 (Figure 9d) and PCA-8 (Figure 9b). LDA-4 (Figure 9c) showed the worst performance, especially for classifying G.Combo and G.Junk attacks, where AE-8 managed to classify them with lower false values.
Table 7 shows the performance of the evaluated techniques using IoT3. We also compared our obtained results with the hybrid CNN-LSTM classifier proposed in [14] when no reduction techniques were applied. Generally, the three feature reduction techniques showed competitive performance in terms of accuracy and F1-score, especially with RF classifiers, where all the classifiers achieved the same accuracy and F1-score. With DT and XTree classifiers, a slight degradation of 1% in accuracy was observed for AE-8, and a 1% reduction in F1-score was observed for PCA-8 and AE-8. The training time and testing time for DT and XTree after feature reduction showed a decrease in computational time to about half the time required when no reduction method was applied; however, the RF classifier showed a slight improvement in certain cases only. DNN2 showed good performance in accuracy with a 2% degradation with LDA-4, and only 1% degradation with PCA-8 and AE-20. However, there were significant improvements in training time and detection time for all feature extraction techniques.
Figure 10 shows the accuracy and loss curves of DNN2 before and after applying feature extraction methods based on PCA, LDA, and AE. It can be seen that the accuracy and loss of DNN reached a stable performance without feature reduction after a few epochs (i.e., less than 20); however, after applying feature reduction, the convergence of PCA-8, AE-8, and AE-20 to a stable performance required an increased number of epochs. PCA-8 and AE-20 showed almost similar convergence, but AE-8 showed a slightly lower convergence rate, accuracy, and loss performance. LDA-4 showed robust convergence stability with few numbers of epochs, but with degraded performance in terms of accuracy and loss compared to PCA and AE.
In Table 8, we compared the performance of attacks classification for the IoT4 dataset with and without feature extraction methods based on DT, XTtree, FR, DNN2, and CNN classifiers, as well as our implementation of the hybrid CNN-LSTM model proposed in [14]. The architecture of CNN is similar to the CNN-LSTM model in [14] but without the two LSTM layers. The performance metrics such as accuracy, recall, and F1-score of DT, XTree, and RF before feature extraction were maintained after feature extraction based on PCA-8, LDA-4, AE-8, and AE-20. The execution time for DT and XTree was reduced to more than half the time required in the case without feature extraction, while RF showed a slight drop in the execution time. DNN2 and CNN showed good performance with PCA-8 and AE-20, where the accuracy, recall, and F1-score were preserved. AE-8 showed only a 1% drop in accuracy, whereas LDA-4’s accuracy dropped by 3%. PCA-8 with hybrid CNN-LSTM showed better performance, whereas AE-20 had only a 1% drop in accuracy; however, LDA-4 had shown sensitivity to the performance metrics with all the deep learning models. In terms of execution time, we can observe a significant reduction in training and testing time for the CNN and hybrid CNN-LSTM models after applying the feature extraction methods. Without feature extraction, both models consumed a huge amount of time for training and testing; therefore, it is highly recommended to apply feature extraction methods for both models.
Figure 11 shows the accuracy and loss curves for deep neural network classifiers such as DNN2, CNN, and CNN-LSTM after using AE-20. It is shown that DNN2 without feature reduction converged to maximum accuracy and minimum loss very fast, i.e., approximately with only 20 epochs; meanwhile, with feature reduction methods, it required extra epochs to converge. CNN showed the best convergence speed compared to DNN2 and CNN-LSTM.
In Table 9, we present the results of testing the proposed integrated AE model on the MQTTset dataset, which contains five types of attacks. The number of features in this dataset is 76, which is different from the previously discussed IoT devices. The AE structure used in the analysis was the same as the one used before, with only a change in the optimization model where we used the SGD optimizer because we found that it performed better than the Adam optimizer when we used the unified AE model for feature reduction. The settings for ML and DL techniques that were used with previous IoT devices were also used here. The dataset was divided into 75% (75,033) for training and 25% (25,011) for testing. For the DL models, the training data was further divided into 75% (56,274) for training and 25% (18,759) for validation.
In terms of performance metrics, we can observe that RF, DT, and XTree performed the best, followed by DNN2, CNN, CNN-LSTM, and KNN. The worst performance was attained by linear SVM. After feature reduction, most techniques provided good performance with only a 1% drop in accuracy and a 2–3% drop in F1-score. Comparing PCA-8 with the proposed AE-8, both techniques provided almost the same result, whereas the proposed AE-8 performed slightly better with RF, DNN2, and CNN classifiers. In terms of computational time, all DL models (DNN2, CNN, and CNN-LSTM) showed a significant reduction in training and testing time. The proposed AE-20 showed a signification reduction in training and testing time for DNN2 compared to PCA-8 and LDA-4. Feature extraction for SVM resulted in a slight saving in training and testing time for PCA-8 and AE-8; on the other hand, a good time saving was achieved for LDA-4. For KNN, the testing time was greatly decreased for all techniques with a slight increase in training time.

5. Conclusions

In this paper, we proposed a novel unified model based on deep AE for anomaly detection and feature extraction for multi-classification of cyber-attacks. We analyzed the performance of AE for anomaly detection based on N-BaIoT and MQTTset datasets, and we found that it had robust performance and fast detection time compared to its counterparts, OC-SVM and iForest. We then analyzed the performance of different classifiers such as DT, XTree, RF, DNN, CNN, and CNN-LSTM with and without feature extraction methods. We compared the performance of the proposed AE with two popular feature extraction techniques, namely PCA and LDA. We found that the feature extraction methods can reduce the computation time of the training and testing stages for most of the classifiers with a slight degradation in performance metrics, where there was an approximately 0–2% drop in accuracy and F1-score. The DT and XTree algorithms demonstrated a good trade-off between performance and computational complexity compared to the other classifiers. The RF classifier showed good performance stability after feature reduction but without any significant improvement in the execution time. DNN model showed sensitivity to the extracted features and required more epochs to converge to the optimum value, while CNN provided better results with improved convergence rates using the same number of epochs. All neural network-based models delivered a significant saving in execution time after feature extraction. To conclude, the proposed integrated AE model has the capability to detect anomalies more efficiently and extract useful features as well as to compete with well-known feature extraction techniques such as PCA and LDA. Future works can be focused on implementing other forms of AEs to our proposed unified model such as convolutional AE (CAE), variational AE (VAE), sparse AE (SAE), denoising AE (DAE), or other new emerging AE to maintain the performance metrics of the multi-classifiers before and after feature reduction as much as possible.

Author Contributions

K.A.A.: conceptualization, methodology, investigation, and drafting the manuscript. H.-S.L.: supervision, revising technical design, and editing the manuscript. M.H.M.S.: co-supervision, writing—review and editing. Y.S.Y.: review and editing. All authors have read and agreed to the published version of the manuscript.

Funding

This research was supported by Multimedia University (MMU), Malaysia, under the funding number MMUI/220153.

Data Availability Statement

Datasets can be found online and code is available upon reasonable request.

Conflicts of Interest

The authors declare that they have no competing interest.

References

  1. Cruz, A.R.S.A.; Gomes, R.L.; Fernandez, M.P. An Intelligent Mechanism to Detect Cyberattacks of Mirai Botnet in IoT Networks. In Proceedings of the 2021 17th International Conference on Distributed Computing in Sensor Systems (DCOSS), Pafos, Cyprus, 14–16 July 2021; pp. 236–243. [Google Scholar] [CrossRef]
  2. Marzano, A.; Alexander, D.; Fonseca, O.; Fazzion, E.; Hoepers, C.; Jessen, K.S.; Chaves, M.H.; Cunha, I.; Guedes, D.; Meira, W. The evolution of Bashlite and Mirai IoT botnets. In Proceedings of the 2018 IEEE Symposium on Computers and Communications (ISCC), Natal, Brazil, 25–28 June 2018; pp. 00813–00818. [Google Scholar]
  3. Mira Botnet Source Code. Available online: https://github.com/jgamblin/Mirai-Source-Code (accessed on 1 October 2022).
  4. Alaghbari, K.A.; Saad, M.H.; Hussain, A.; Alam, M.R. Complex event processing for physical and cyber security in datacenters—Recent progress, challenges and recommendations. J. Cloud Comp. 2022, 11, 65. [Google Scholar] [CrossRef]
  5. Halbouni, A.; Gunawan, T.S.; Habaebi, M.H.; Halbouni, M.; Kartiwi, M.; Ahmad, R. CNN-LSTM: Hybrid Deep Neural Network for Network Intrusion Detection System. IEEE Access 2022, 10, 99837–99849. [Google Scholar] [CrossRef]
  6. Alaghbari, K.A.; Saad, M.H.M.; Hussain, A.; Alam, M.R. Activities Recognition, Anomaly Detection and Next Activity Prediction Based on Neural Networks in Smart Homes. IEEE Access 2022, 10, 28219–28232. [Google Scholar] [CrossRef]
  7. Ullah, I.; Mahmoud, Q.H. Design and Development of a Deep Learning-Based Model for Anomaly Detection in IoT Networks. IEEE Access 2021, 9, 103906–103926. [Google Scholar] [CrossRef]
  8. Bacha, S.; Aljuhani, A.; Abdellafou, K.B.; Taouali, O.; Liouane, N.; Alazab, M. Anomaly-based intrusion detection system in IoT using kernel extreme learning machine. J. Ambient. Intell. Humaniz. Comput. 2022. [Google Scholar] [CrossRef]
  9. Hairab, B.I.; Elsayed, M.S.; Jurcut, A.D.; Azer, M.A. Anomaly Detection Based on CNN and Regularization Techniques against Zero-Day Attacks in IoT Networks. IEEE Access 2022, 10, 98427–98440. [Google Scholar] [CrossRef]
  10. Jia, W.; Sun, M.; Lian, J.; Hou, S. Feature dimensionality reduction: A review. Complex Intell. Syst. 2022, 8, 2663–2693. [Google Scholar] [CrossRef]
  11. Yeom, S.; Choi, C.; Kim, K. AutoEncoder Based Feature Extraction for Multi-Malicious Traffic Classification. In Proceedings of the 9th International Conference on Smart Media and Applications (SMA 2020), Jeju, Republic of Korea, 17–19 September 2020; Association for Computing Machinery: New York, NY, USA, 2020; pp. 285–287. [Google Scholar] [CrossRef]
  12. Wang, Y.; Yao, H.; Zhao, S. Auto-Encoder Based Dimensionality Reduction. Neurocomputing 2016, 184, 232–242. [Google Scholar] [CrossRef]
  13. Meidan, Y.; Bohadana, M.; Mathov, Y.; Mirsky, Y.; Shabtai, A.; Breitenbacher, D.; Elovici, Y. N-BaIoT network-based detection of IoT botnet attacks using deep autoencoders. IEEE Pervasive Comput. 2018, 17, 12–22. [Google Scholar] [CrossRef]
  14. Alkahtani, H.; Aldhyani, T.H. Botnet Attack Detection by Using CNN-LSTM Model for Internet of Things Applications. Secur. Commun. Netw. 2021, 2021, 3806459. [Google Scholar] [CrossRef]
  15. Al Dahoul, N.; Abdul Karim, H.; Ba Wazir, A.S. Model fusion of deep neural networks for anomaly detection. J. Big Data 2021, 8, 106. [Google Scholar] [CrossRef]
  16. Aygun, R.C.; Yavuz, A.G. Network Anomaly Detection with Stochastically Improved Autoencoder Based Models. In Proceedings of the 2017 IEEE 4th International Conference on Cyber Security and Cloud Computing (CSCloud), New York, NY, USA, 26–28 June 2017; pp. 193–198. [Google Scholar] [CrossRef]
  17. Zavrak, S.; İskefiyeli, M. Anomaly-Based Intrusion Detection from Network Flow Features Using Variational Autoencoder. IEEE Access 2020, 8, 108346–108358. [Google Scholar] [CrossRef]
  18. Min, B.; Yoo, J.; Kim, S.; Shin, D.; Shin, D. Network Anomaly Detection Using Memory-Augmented Deep Autoencoder. IEEE Access 2021, 9, 104695–104706. [Google Scholar] [CrossRef]
  19. Kunang, Y.N.; Nurmaini, S.; Stiawan, D.; Zarkasi, A. Automatic Features Extraction Using Autoencoder in Intrusion Detection System. In Proceedings of the 2018 International Conference on Electrical Engineering and Computer Science (ICECOS), Pangkal, Indonesia, 2–4 October 2018; pp. 219–224. [Google Scholar] [CrossRef]
  20. Mhamdi, L.; McLernon, D.; El-moussa, F.; Zaidi, S.A.R.; Ghogho, M.; Tang, T. A Deep Learning Approach Combining Autoencoder with One-class SVM for DDoS Attack Detection in SDNs. In Proceedings of the 2020 IEEE Eighth International Conference on Communications and Networking (ComNet), Hammamet, Tunisia, 27–30 October 2020; pp. 1–6. [Google Scholar] [CrossRef]
  21. Chen, Z.; Yeo, C.K.; Lee, B.S.; Lau, C.T. Autoencoder-based network anomaly detection. In Proceedings of the 2018 Wireless Telecommunications Symposium (WTS), Phoenix, AZ, USA, 17–20 April 2018; pp. 1–5. [Google Scholar] [CrossRef]
  22. Elsayed, M.S.; Le-Khac, N.-A.; Dev, S.; Jurcut, A.D. Network Anomaly Detection Using LSTM Based Autoencoder. In Proceedings of the 16th ACM Symposium on QoS and Security for Wireless and Mobile Networks (Q2SWinet ′20), Alicante, Spain, 16–20 November 2020; Association for Computing Machinery: New York, NY, USA, 2020; pp. 37–45. [Google Scholar] [CrossRef]
  23. Rao, K.N.; Rao, K.V.; Reddy, P.V.G.D.P. A hybrid intrusion detection system based on sparse autoencoder and deep neural network. Comput. Commun. 2021, 180, 77–88. [Google Scholar] [CrossRef]
  24. Al-Fawa’reh, M.; Al-Fayoumi, M.; Nashwan, S.; Fraihat, S. Cyber threat intelligence using PCA-DNN model to detect abnormal network behavior. Egypt. Inform. J. 2021, 23, 173–185. [Google Scholar] [CrossRef]
  25. Xu, W.; Jang-Jaccard, J.; Singh, A.; Wei, Y.; Sabrina, F. Improving Performance of Autoencoder-Based Network Anomaly Detection on NSL-KDD Dataset. IEEE Access 2021, 9, 140136–140146. [Google Scholar] [CrossRef]
  26. Vaccari, I.; Chiola, G.; Aiello, M.; Mongelli, M.; Cambiaso, E. MQTTset, a New Dataset for Machine Learning Techniques on MQTT. Sensors 2020, 20, 6578. [Google Scholar] [CrossRef] [PubMed]
  27. Ullah, I.; Mahmoud, Q.H. An Anomaly Detection Model for IoT Networks based on Flow and Flag Features using a Feed-Forward Neural Network. In Proceedings of the 2022 IEEE 19th Annual Consumer Communications & Networking Conference (CCNC), Las Vegas, NV, USA, 8–11 January 2022; pp. 363–368. [Google Scholar] [CrossRef]
Figure 1. General structure of autoencoder (AE).
Iot 04 00016 g001
Figure 2. Structure of the proposed integrated system based on deep autoencoder (AE) for anomaly detection and feature extraction for multi-classification of cyber-attacks.
Iot 04 00016 g002
Figure 3. Experiment setup of N-BaIoT dataset considered in [13] for detecting IoT botnet attacks such as Gafgyt (BASHLITE).
Iot 04 00016 g003
Figure 4. (a) Normal and attack dataset, (b) attack dataset IoT1.
Iot 04 00016 g004
Figure 5. (a) Reconstruction error of AE-8; (b) ROC of anomaly detection techniques based on IoT1 dataset.
Iot 04 00016 g005
Figure 6. Reconstruction error (RE) based on AE-8 for IoT1; (a) all cyber-attacks, (b) magnified subsets.
Iot 04 00016 g006
Figure 7. Explained variance based on PCA and LDA for (a) IoT1, (b) IoT2, and (c) IoT5.
Iot 04 00016 g007
Figure 8. Correlation matrix of the cyber-attack training data for IoT1 device with (a) all features, (b) AE-2, (c) AE-3, and (d) AE-8.
Iot 04 00016 g008
Figure 9. Confusion matrices for classifying attacks on IoT2 based on RF classifier (a) without reduction, (b) with PCA-8, (c) with LDA-4, and (d) with AE-8.
Iot 04 00016 g009
Figure 10. (a) Accuracy and (b) loss curves for DNN2 with different feature extraction methods using attack dataset of IoT3.
Iot 04 00016 g010
Figure 11. (a) Accuracy and (b) loss curves for different deep learning models using AE-20 based on IoT4 dataset.
Iot 04 00016 g011
Table 1. IoT devices and corresponding datasets used in our analysis.
IoTDevice NameData Size (Samples)TotalCyber-AttackNo. Classes
NormalAttack
IoT1Danmini_Doorbell49,548968,7501,018,298Mirai (M.):
(1) Scan
(2) Ack flooding
(3) Syn flooding
(4) UDP flooding
(5) UDPplain
Gafgyt (G.):
(1) Scan
(2) Junk
(3) UDP flooding
(4) TCP flooding
(5) COMBO
10
IoT2Philips_B120N10_Baby_Monitor175,240923,4371,098,67710
IoT3SimpleHome_XCS7_1003_WHT_
Security_Camera
14,646836,180850,82610
IoT4Samsung_SNH_1011_N_Webcam52,150323,072375,222-5
IoT510 sensors: 2 Motion sensors, Door lock, Fan sensor, Fan speed controller, Smoke, CO-Gas, Temperature, Humidity, Light intensity.440,699100,044540,743(1) MQTT Publish Flood
(2) Brute Force Authentication
(3) Flooding DoS
(4) Malformed
(5) SlowITe
5
Table 2. Performance metrics of anomaly detection models.
Dev.ClassifierConfusion Matrix ElementsMetricsData SizeTime (Second)
TPFNFPTNAcc.Pre.RecF1.scTraining/Valid.)Testing Training Testing
IoT1OC-SVM12,2801070968,7501.001.001.001.00(37,161, 115)(981137,
115)
2.8183.49
iForest11,6497380968,7501.001.000.970.983.2281.91
AE-212,3107718968,7321.001.001.001.00(27,870, 115)
(9291, 115)
35.2229.3
AE-312,304830968,7501.001.001.001.0030.0226.54
AE-812,326610968,7501.001.001.001.0073.128.3
IoT2OC-SVM43,524286171923,2661.001.001.001.00(131,430, 115)(967247, 115)28.79234.94
iForest42,2861524198,841724,5960.790.590.870.599.18147.34
AE-242,7141096130923,3071.001.000.990.99(98,572, 115)
(32,858, 115)
138.2625.85
AE-342,5251285136923,3011.001.000.990.99115.6129.41
AE-842,6061204149923,2881.001.000.990.99122.4226.53
IoT3OC-SVM486121119831,1791.000.991.000.99(14,646, 115)(836180, 115)0.4229.32
iForest46931891831,2971.001.000.980.991.2275.57
AE-247581240831,2981.001.000.990.99(10,984, 115)
(3662, 115)
13.7426.91
AE-34786960831,2981.001.000.991.0014.127.6
AE-847938913831,2851.001.000.990.9917.7329.1
IoT4OC-SVM12,863175142322,9301.000.990.990.99(39,112, 115)(336110, 115)2.828
iForest12,13190730323,0421.001.000.970.983.1432.3
AE-212,0629761323,0711.001.000.960.98(29,334, 115)
(9778, 115)
37.310.74
AE-312,43060833323,0391.001.000.980.9932.18.8
AE-812,4405986323,0661.001.000.980.9933.5410.1
IoT5OC-SVM109,12910460100,0441.000.991.001.00(330,524, 76)(210219, 76)395.39122
iForest96,11914,0560100,0440.930.940.940.9314.8113.42
AE-2109,1939820100,0441.001.001.001.00(247,893, 76)
(82,631, 76)
2876.3
AE-3109,1849910100,0441.001.001.001.003286.5
AE-8109,1899860100,0441.001.001.001.003427
Table 3. Time (in seconds) taken by feature reduction techniques on training and testing a dataset.
Dev.DatasetPCA (Compo)LDA CompData Size
281024
IoT1Training ( T 1 )4.217.748.1118.3121(726,563, 115)
Testing   ( S 1 )0.270.290.180.440.55(242,188, 115)
IoT2 Training   ( T 2 )59.117.127.317.61(692,577, 115)
Testing   ( S 2 )0.370.830.161.110.8(230,860, 115)
IoT3 Training   ( T 3 )4.435.686.4720.0515.94(623,473, 115)
Testing   ( S 3 )0.1680.1670.170.290.3(207,825, 115)
IoT4 Training   ( T 4 )1.59225.24.86(242,304, 115)
Testing   ( S 4 )0.060.060.070.170.09(80,768, 115)
IoT5 Training   ( T 5 )0.30.30.370.720.88(75,033, 76)
Testing   ( S 5 )0.010.010.010.0120.016(25,011, 76)
Table 4. Comparison of different multi-classifiers of cyber-attacks for IoT1 using different feature extraction techniques.
ClassifierFeature Reduction Technique MetricsTime (Second)
Acc.Prec.Rec.F1-sc.TrainingTesting
DTWithout0.910.920.900.8728.320.18
PCA-20.840.850.830.804.680.11
PCA-80.900.920.900.8711.550.07
PCA-100.900.930.900.87130.036
LDA-20.880.860.840.811.890.038
LDA-40.900.920.900.872.80.04
Proposed (AE-2)0.730.770.750.723.420.092
Proposed (AE-3)0.880.900.880.854.380.03
Proposed (AE-8)0.900.920.900.8710.220.05
XTreeWithout0.910.930.900.870.840.11
PCA-20.840.830.830.800.410.075
PCA-80.900.930.900.870.480.047
PCA-100.900.920.900.870.620.046
LDA-20.880.860.840.810.450.046
LDA-40.900.930.900.870.530.038
Proposed (AE-2)0.730.770.740.710.480.11
Proposed (AE-3)0.860.870.870.840.360.071
Proposed (AE-8)0.900.920.900.870.40.046
RFWithout0.910.930.900.87184.333.23
PCA-20.850.870.840.821496.4
PCA-80.900.920.900.87229.695.74
PCA-100.900.930.900.87270.063.93
LDA-20.880.890.850.8292.563.52
LDA-40.900.930.900.87110.083.3
Proposed (AE-2)0.750.800.760.73145.447.67
Proposed (AE-3)0.880.910.890.85110.915.45
Proposed (AE-8)0.900.930.900.871783.8
NBWithout0.860.820.800.751.912.94
PCA-20.590.350.450.380.160.13
PCA-80.720.690.680.670.240.31
PCA-100.720.690.690.670.250.34
LDA-20.870.750.800.750.160.13
LDA-40.870.780.800.750.180.19
Proposed (AE-2)0.610.580.520.470.140.14
Proposed (AE-3)0.530.450.510.450.140.16
Proposed (AE-8)0.690.630.690.630.180.31
Table 5. Comparison of DNN1 and DNN2 classifiers of cyber-attack for IoT1 using different feature reduction techniques.
ClassifierFeature Reduction TechniqueMetricsTime (Second)Data Size
(Training,
Testing)
Acc.Prec.Rec.F1-sc.Train.Test.
CNN-LSTM [14]Without0.910.930.910.88--(70%,
30%)
DNN1
[X,64,32,10]
Epochs = 100,
batch = 64
Without0.900.940.890.8613562.8(75%,
25%)
PCA-20.830.800.800.779931.97
PCA-80.900.920.890.8610831.35
PCA-100.890.930.890.8612214.8
LDA-20.880.860.820.7910542.15
LDA-40.880.890.820.7814292
Proposed (AE-2)0.740.700.730.719211.9
Proposed (AE-3)0.860.900.850.828961.26
Proposed (AE-8)0.900.910.890.869231.5
DNN2 [X,64,64,64,10]
Epochs = 100
batch = 128
Without0.900.930.900.8711564.8
PCA-20.840.820.800.7810614.2
PCA-80.900.910.900.868693.8
PCA-100.900.920.890.8710064.54
LDA-20.880.870.810.789983.65
LDA-40.880.890.830.8010363.8
Proposed (AE-2)0.740.790.720.707903
Proposed (AE-3)0.860.860.860.828402.54
Proposed (AE-8)0.900.900.890.857743.22
Table 6. Performance metrics of multi-classification of cyber-attacks for IoT2 using different feature extraction methods.
ClassifierFeature Reduction Technique MetricsTime (Second)
Acc.Prec.Rec.F1.Train.Test.
CNN-LSTM [14]Without0.910.930.920.89--
DTWithout0.900.950.900.8719.20.1
PCA-80.900.910.900.878.40.03
LDA-40.900.940.900.873.210.05
Proposed (AE-8)0.900.920.900.878.80.03
XTreeWithout0.900.940.900.870.750.11
PCA-80.900.910.900.870.460.04
LDA-40.900.930.900.870.380.036
Proposed (AE-8)0.900.920.900.870.370.04
RFWithout0.900.940.900.87198.42.96
PCA-80.900.920.900.87175.13.41
LDA-40.900.940.900.87107.43.03
Proposed (AE-8)0.900.940.900.87182.83.84
DNN2Without0.900.940.900.879372.59
PCA-80.900.920.890.867711.95
LDA-40.890.920.860.835591.48
Proposed (AE-8)0.900.920.900.875511.35
Table 7. Performance metrics of multi-classification of cyber-attacks for IoT3 using different feature extraction methods.
ClassifierFeature Reduction TechniqueMetricsTime (Second)
Acc.Prec.Rec.F1.TrainingTesting
CNN-LSTM [14]Without0.890.930.900.86--
DTWithout0.880.950.900.8744.20.2
PCA-80.880.920.900.86140.07
LDA-40.880.920.900.875.60.04
Proposed (AE-8)0.870.910.890.8613.40.07
Proposed (AE-20)0.880.910.900.8620.70.031
XtreeWithout0.880.940.900.871.10.18
PCA-80.880.910.900.860.460.05
LDA-40.880.930.900.870.350.036
Proposed (AE-8)0.870.920.890.860.410.045
Proposed (AE-20)0.880.920.900.870.610.031
RFWithout0.880.940.900.872263.1
PCA-80.880.920.900.871843.7
LDA-40.880.940.900.871774.6
Proposed (AE-8)0.880.920.900.871563.78
Proposed (AE-20)0.880.920.900.872533.2
DNN2
(Epoch = 100)
Without0.880.940.900.8612025.4
PCA-80.870.910.870.857642.87
LDA-40.850.890.800.758022.32
Proposed (AE-8)0.870.910.890.866981.93
Proposed (AE-20)0.870.910.890.866021.52
Table 8. Performance metrics and execution time based on IoT4 dataset.
ClassifierFeature Reduction Technique MetricsTime (Second)
Acc.Prec.Rec.F1.TrainingTesting
DTWithout0.700.880.800.745.40.045
PCA-80.700.820.800.741.280.008
LDA-40.700.870.800.740.50.007
Proposed (AE-8)0.700.840.800.741.30.008
Proposed (AE-20)0.700.840.800.742.50.008
XTreeWithout0.700.850.800.740.250.044
PCA-80.700.870.800.740.100.01
LDA-40.700.870.800.740.0920.01
Proposed (AE-8)0.700.870.800.740.0920.01
Proposed (AE-20)0.700.860.800.740.140.01
RFWithout0.700.900.800.7435.110.83
PCA-80.700.880.800.7424.20.8
LDA-40.700.900.800.7421.70.76
Proposed (AE-8)0.700.880.800.7423.530.72
Proposed (AE-20)0.700.880.800.74360.68
DNN2
Epoch = 100
Without0.700.900.800.742871.15
PCA-80.700.820.800.742020.71
LDA-40.670.850.750.692340.52
Proposed (AE-8)0.690.880.800.742070.7
Proposed (AE-20)0.700.870.800.741820.78
CNN
(epoch = 50, batch size = 512)
Without0.700.890.800.74224714
PCA-80.700.850.800.744363.5
LDA-40.670.840.740.693545.1
Proposed (AE-8)0.690.850.790.734323.2
Proposed (AE-20)0.700.890.800.748774.5
CNN-LSTM
(epoch = 50, batch size = 512)
Without0.700.880.800.7413870185
PCA-80.700.860.800.74152311.53
LDA-40.660.840.740.689265.62
Proposed (AE-8)0.690.860.800.73145110.86
Proposed (AE-20)0.690.900.800.74390516.25
Table 9. Performance metrics and execution time based on IoT5 dataset.
ClassifierFeature Reduction Technique MetricsTime (Second)
Acc.Prec.Rec.F1.TrainingTesting
DTWithout1.000.990.990.990.550.008
PCA-80.990.960.960.960.320.002
LDA-40.990.960.970.970.280.004
Proposed (AE-8)0.990.960.960.960.480.002
XTreeWithout1.000.980.980.980.0410.008
PCA-80.990.960.960.960.020.003
LDA-40.990.960.970.960.0180.003
Proposed (AE-8)0.990.960.960.960.0190.002
RFWithout1.000.990.990.995.40.2
PCA-80.990.970.970.979.570.27
LDA-40.990.970.970.9717.240.4
Proposed (AE-8)0.990.970.970.979.20.18
DNN2Without0.990.980.970.971680.76
PCA-80.980.940.920.931580.7
LDA-40.990.950.930.941710.7
Proposed (AE-8)0.990.940.930.94740.2
CNNWithout0.990.970.980.9714548
PCA-80.980.940.920.932012.36
LDA-40.990.940.950.951381.8
Proposed (AE-8)0.980.930.940.941430.9
CNN-LSTMWithout0.990.960.960.96677432.63
PCA-80.980.940.930.936025.90
LDA-40.990.950.940.943474.2
Proposed (AE-8)0.980.930.930.934462.7
SVMWithout0.980.940.910.9212.817
PCA-80.980.900.880.897.4516.4
LDA-40.980.930.900.913.311.3
Proposed (AE-8)0.970.930.880.8910.816.2
KNNWithout0.990.960.960.960.0246
PCA-80.990.960.960.960.240.85
LDA-40.990.970.970.970.130.90
Proposed (AE-8)0.990.970.960.960.180.74
Disclaimer/Publisher’s Note: The statements, opinions and data contained in all publications are solely those of the individual author(s) and contributor(s) and not of MDPI and/or the editor(s). MDPI and/or the editor(s) disclaim responsibility for any injury to people or property resulting from any ideas, methods, instructions or products referred to in the content.

