1. Introduction
In the last decades, many research works have focused on the impacts that climate change may have on geomorphological processes’ behavior, especially on landslides [
1,
2,
3,
4,
5,
6]. Landslides are one of the most dangerous geomorphological processes affecting sloped environments, causing damage to anthropic goods and casualties. Piemonte is an Italian northwestern Alpine region formed by 43% of the mountainous territory (the Alps and Apennines) and 31% of the hilly territory (
Figure 1), where shallow landslides are responsible for about 50% of casualties caused by landslides in the last 100 years. Shallow landslides are the more frequent landslide type and are characterized by a higher number of reported damages and victims from 1960 to 2019 (about 130 dead, 100 wounded, and 10 missing).
The occurrence of shallow landslides is directly linked to rainfall events, with a neglectable contribution by antecedent precipitations [
7,
8]; they are small phenomena (common volume < 500 m
3) involving shallow portions of detrital–colluvial cover (1–2 m depth of the sliding surface) and are characterized by high velocity of propagation (5 m/s). Shallow landslides are very dangerous because, despite the small size, they trigger numerous during a single rainfall event, hitting a large area of territory, and their detachment niches can give coalescence as well as the material mobilized during propagation. Shallow landslides can affect every soil cover with a slope between 15° and 45°, and they do not show precursory signs before triggering.
This research work aims to investigate any relationship between shallow landslide events and climate change, allowing the identification of any future scenarios that may concern such phenomena in Piemonte.
In the scientific literature, there are several articles that investigated the relationship between landslide occurrence and climate change, both at continental/national and regional scales [
9,
10,
11,
12,
13,
14,
15,
16,
17,
18,
19,
20,
21,
22,
23,
24,
25,
26,
27,
28,
29,
30,
31,
32,
33,
34] and at sub-regional and local scales [
35,
36,
37,
38,
39,
40,
41,
42,
43,
44,
45,
46], which highlight how the effects of climate change on landslide evolution are different depending on the geographical area under investigation. A preliminary study has already been carried out in Piemonte [
47], which shows a possible trend identifying a change in the behavior of landslide events from 1960 to 2013, reinforced by the increase in frequency in the occurrence of such events, but with a decrease in the number of shallow landslides during individual events. In addition, there has been a change in the seasonality of occurrence of widespread landslide events, with a shift from fall to spring as the season with greater shallow landslide occurrence.
In this follow-up research work, a large number of new historical shallow landslide events has been added from a deeper search of regional and national archives (technical reports, newspaper articles, and scientific papers), covering and extending the time interval of previous investigations (from 1960–2013 to 1960–2019). The number of shallow landslide events increased, especially from 1960 to 2000. In light of those new data, more accurate results have been obtained with respect to the previous ones presented in [
47].
1.1. Geographical and Geological Settings of Piemonte
Piemonte is an Alpine region situated in the northwestern sector of Italy, and it is described by very complex orography and geology formed by wide alluvial plains confined by the Alps, Apennines, and hilly environment, characterized by a total elevation difference of 4584 m (from 50 m asl as the lower plain elevation to 4634 m asl of the higher peak of the Alps, passing through the maximum elevation of the hills of 720 m asl).
Even the geological–geomorphological structure of Piemonte is characterized by a remarkable complexity and variety due to the presence of large marine and continental sedimentary basins (hills and plains), metamorphic and igneous complexes (Alps), and sedimentary formations characterized by a low degree of metamorphism (Apennines). Surficial deposits are widespread, with mainly landslide deposits, glacial, and periglacial deposits in the Alps, whereas alluvial and eolian deposits (loess) prevail in the hills [
48].
1.2. Climate and Climate Change in Piemonte
Climate plays a fundamental role in influencing the environment, ecosystems, and socioeconomic activities. In the context of the Piemonte region, understanding the quantitative aspects of its climate is also crucial for sustainable land management, agricultural planning, and mitigation of potential climate change impacts on such a complex territory. Piemonte’s climate is influenced by both Continental and Mediterranean regimes, resulting in a unique combination of climatic conditions that contribute to the rich biodiversity and productive agricultural practices observed in the area. By examining quantitative data spanning over seven decades, we can provide an in-depth understanding of Piemonte’s climate dynamics and explore potential trends or variations that may have occurred over time.
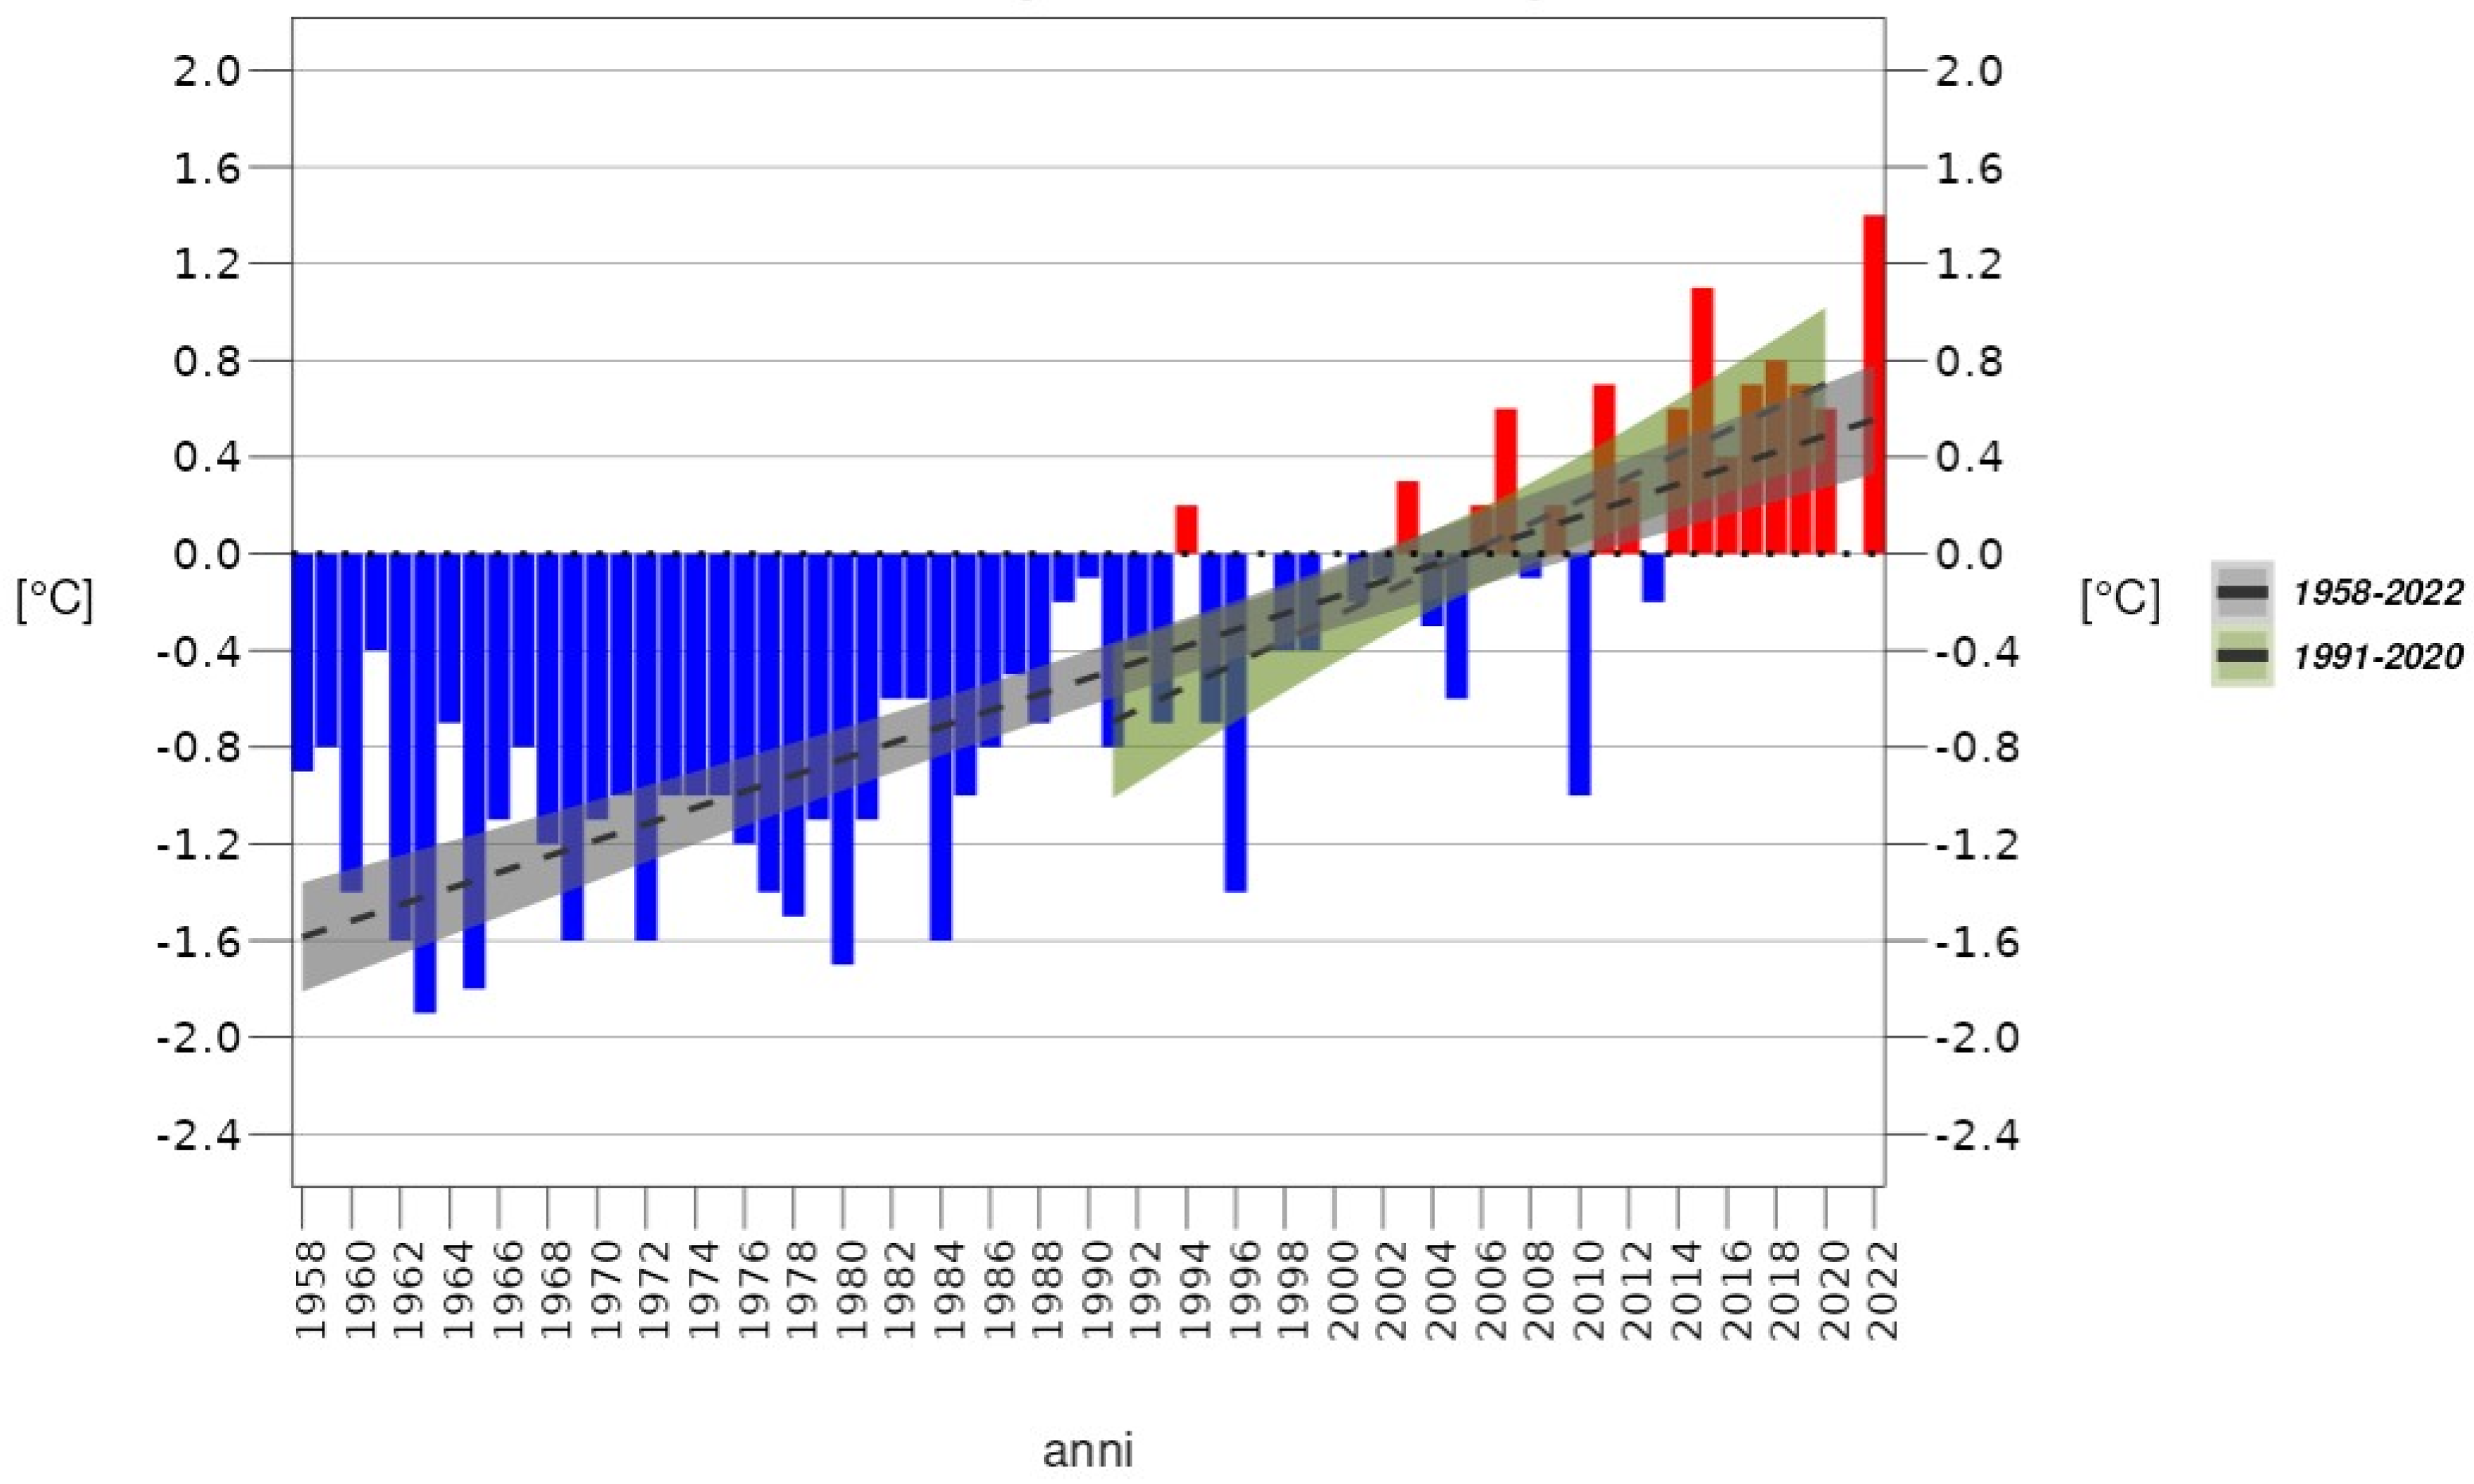
Like many Alpine areas [
48], Piemonte’s temperature increased in the last decades: the maximum temperatures show a statistically significant increase of 2.4 °C, accelerated in the last 35 years at the ratio of 0.6 °C every 10 years, while minimum temperatures increased by about 1.6 °C since the late 1950s (
Figure 2) [
49].
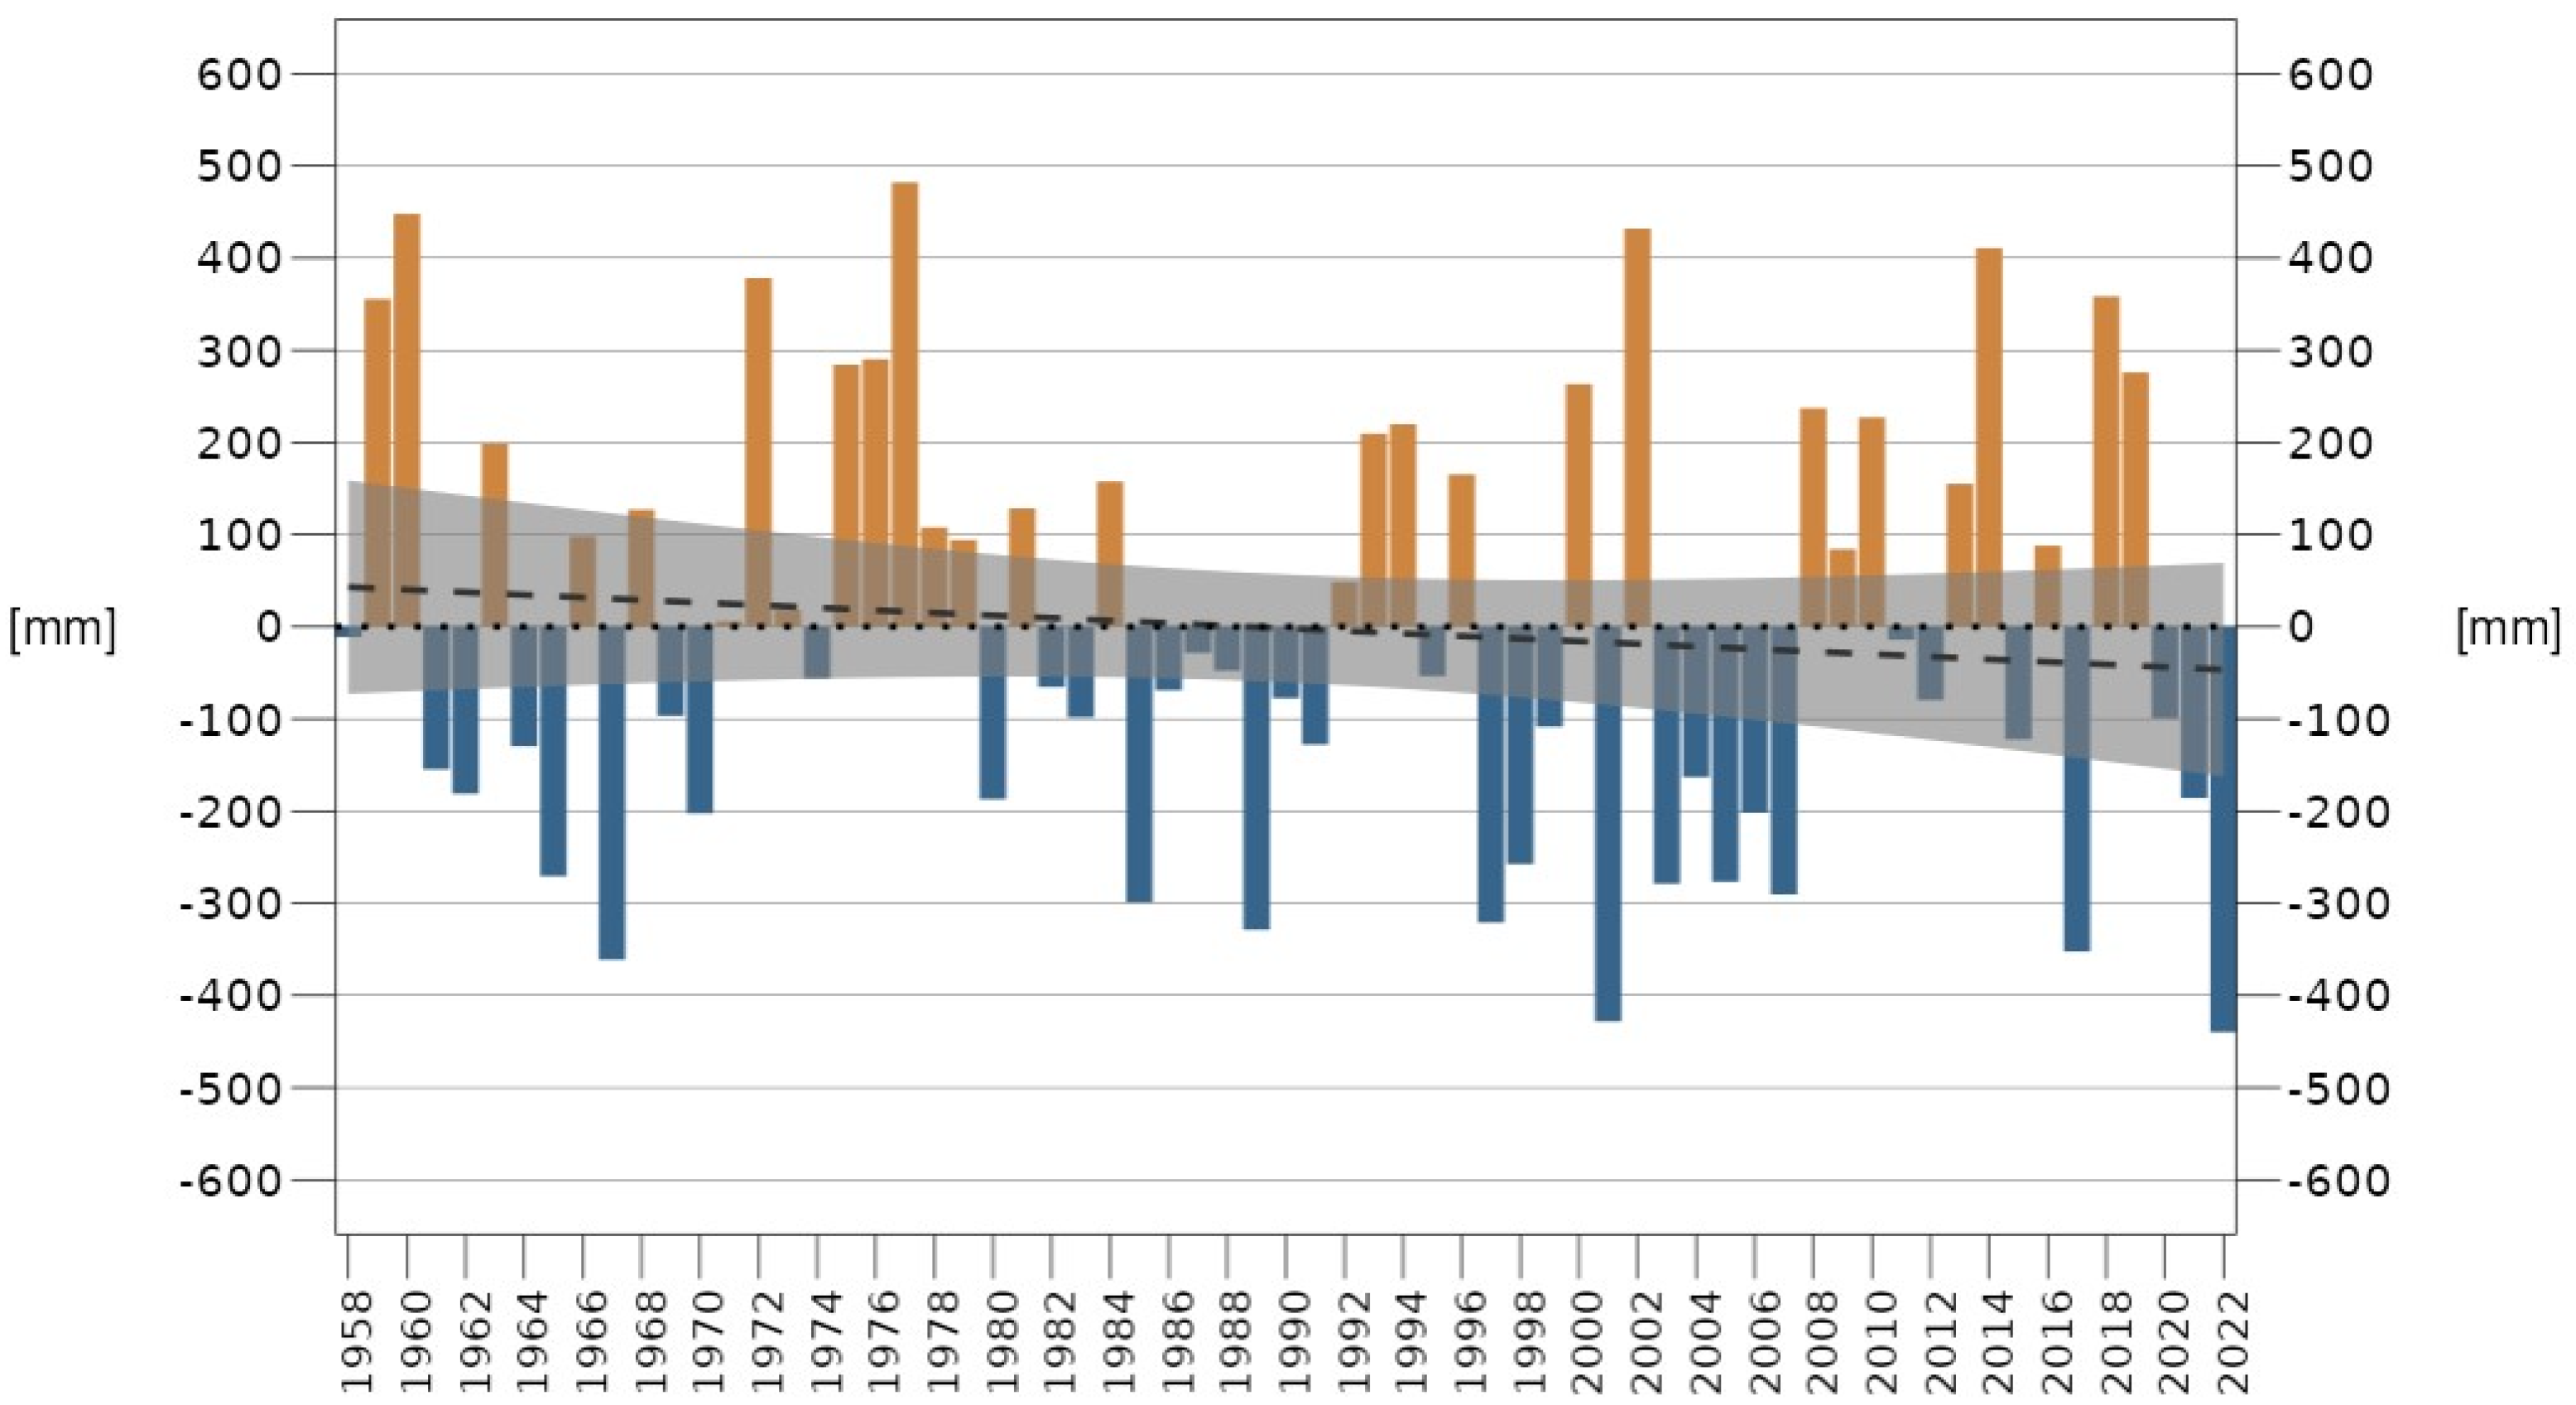
Overall, yearly mean precipitation shows no significant trend at the regional scale, and the pattern of heavy rainfall is very uncertain, even if it appears to be increasing (
Figure 3) [
50]. We look in more depth at the behavior of both rainfall seasonal trends and rainy day trends in paragraph 3.2 of this work, but the only significant trend we were able to detect is a slight decrease in winter precipitation and summer rainy days over the hills.
On the other hand, the maximum length of dry periods appears to be increasing. Moreover, if we take a look at the annual rainfall distribution over the Piemonte region in the last 65 years, an increase in some areas in the northern part of the region, such as Verbano province and Lake Maggiore area (North Piemonte), can be highlighted; correspondingly, a slight overall decrease in rainfall over the rest of the region, most noticeable over the Biella area (Northwestern Piemonte) and the southern belt between Cuneo and Alessandria provinces, has been detected (Piemonte Regional Strategy on Climate Change, 2020—
https://www.regione.piemonte.it/web/temi/ambiente-territorio/cambiamento-climatico/cambiamento-climatico-piemonte (accessed on 15 September 2023)).
2. Materials and Methods
2.1. Shallow Landslide Dataset
The shallow landslide events (SLEs) database contains data from 1926 to 2019, including more than 33,000 shallow landslides. To consider the events with more certain data comparable with the historical rainfall data series of Piemonte, just the shallow landslide events from 1960 to 2019 have been considered. From preliminary studies [
47,
51], a first selection of shallow landslide events was carried out, analyzing 34 events from 1960 to 2013. In the new study, a more in-depth historical research of shallow landslide events presented here, using a greater number of information sources and new data (unpublished technical reports and historical archives of local newspaper press reviews—
http://www.archiviolastampa.it, accessed on 15 September 2023), has led to the integration and enrichment of the previous dataset, totaling 120 shallow landslide events from 1960 to 2019 (
Figure 4,
Figure 5 and
Figure 6).
In
Figure 4,
Figure 5 and
Figure 6, shallow landslide events from 1960 to 2019 are presented, taking into account the environment of occurrence (Alps, TPB—as the abbreviation of Tertiary Piemonte Basin—and Turin Hill/Apennines together because of the low number of recorded shallow landslide events), the average number of shallow landslides occurred (circles’ size), and the season of landslide events (circles’ color).
The mean number of shallow landslides that occurred during a rainfall event is used to homogenize the shallow landslide events and classify them into standardized severity occurrence classes. The mean number of shallow landslides is the average of the severity occurrence classes range: Extremely Low (10–50); Very Low (>50–100); Low (>100–200); Moderate (>200–500); High (>500–2000); Very High (>2000–5000); Exceptionally High (>5000–10,000 and upper).
To allow the identification of significative trends in data distribution, shallow landslide events have been aggregated in 5-year intervals (
Table 1).
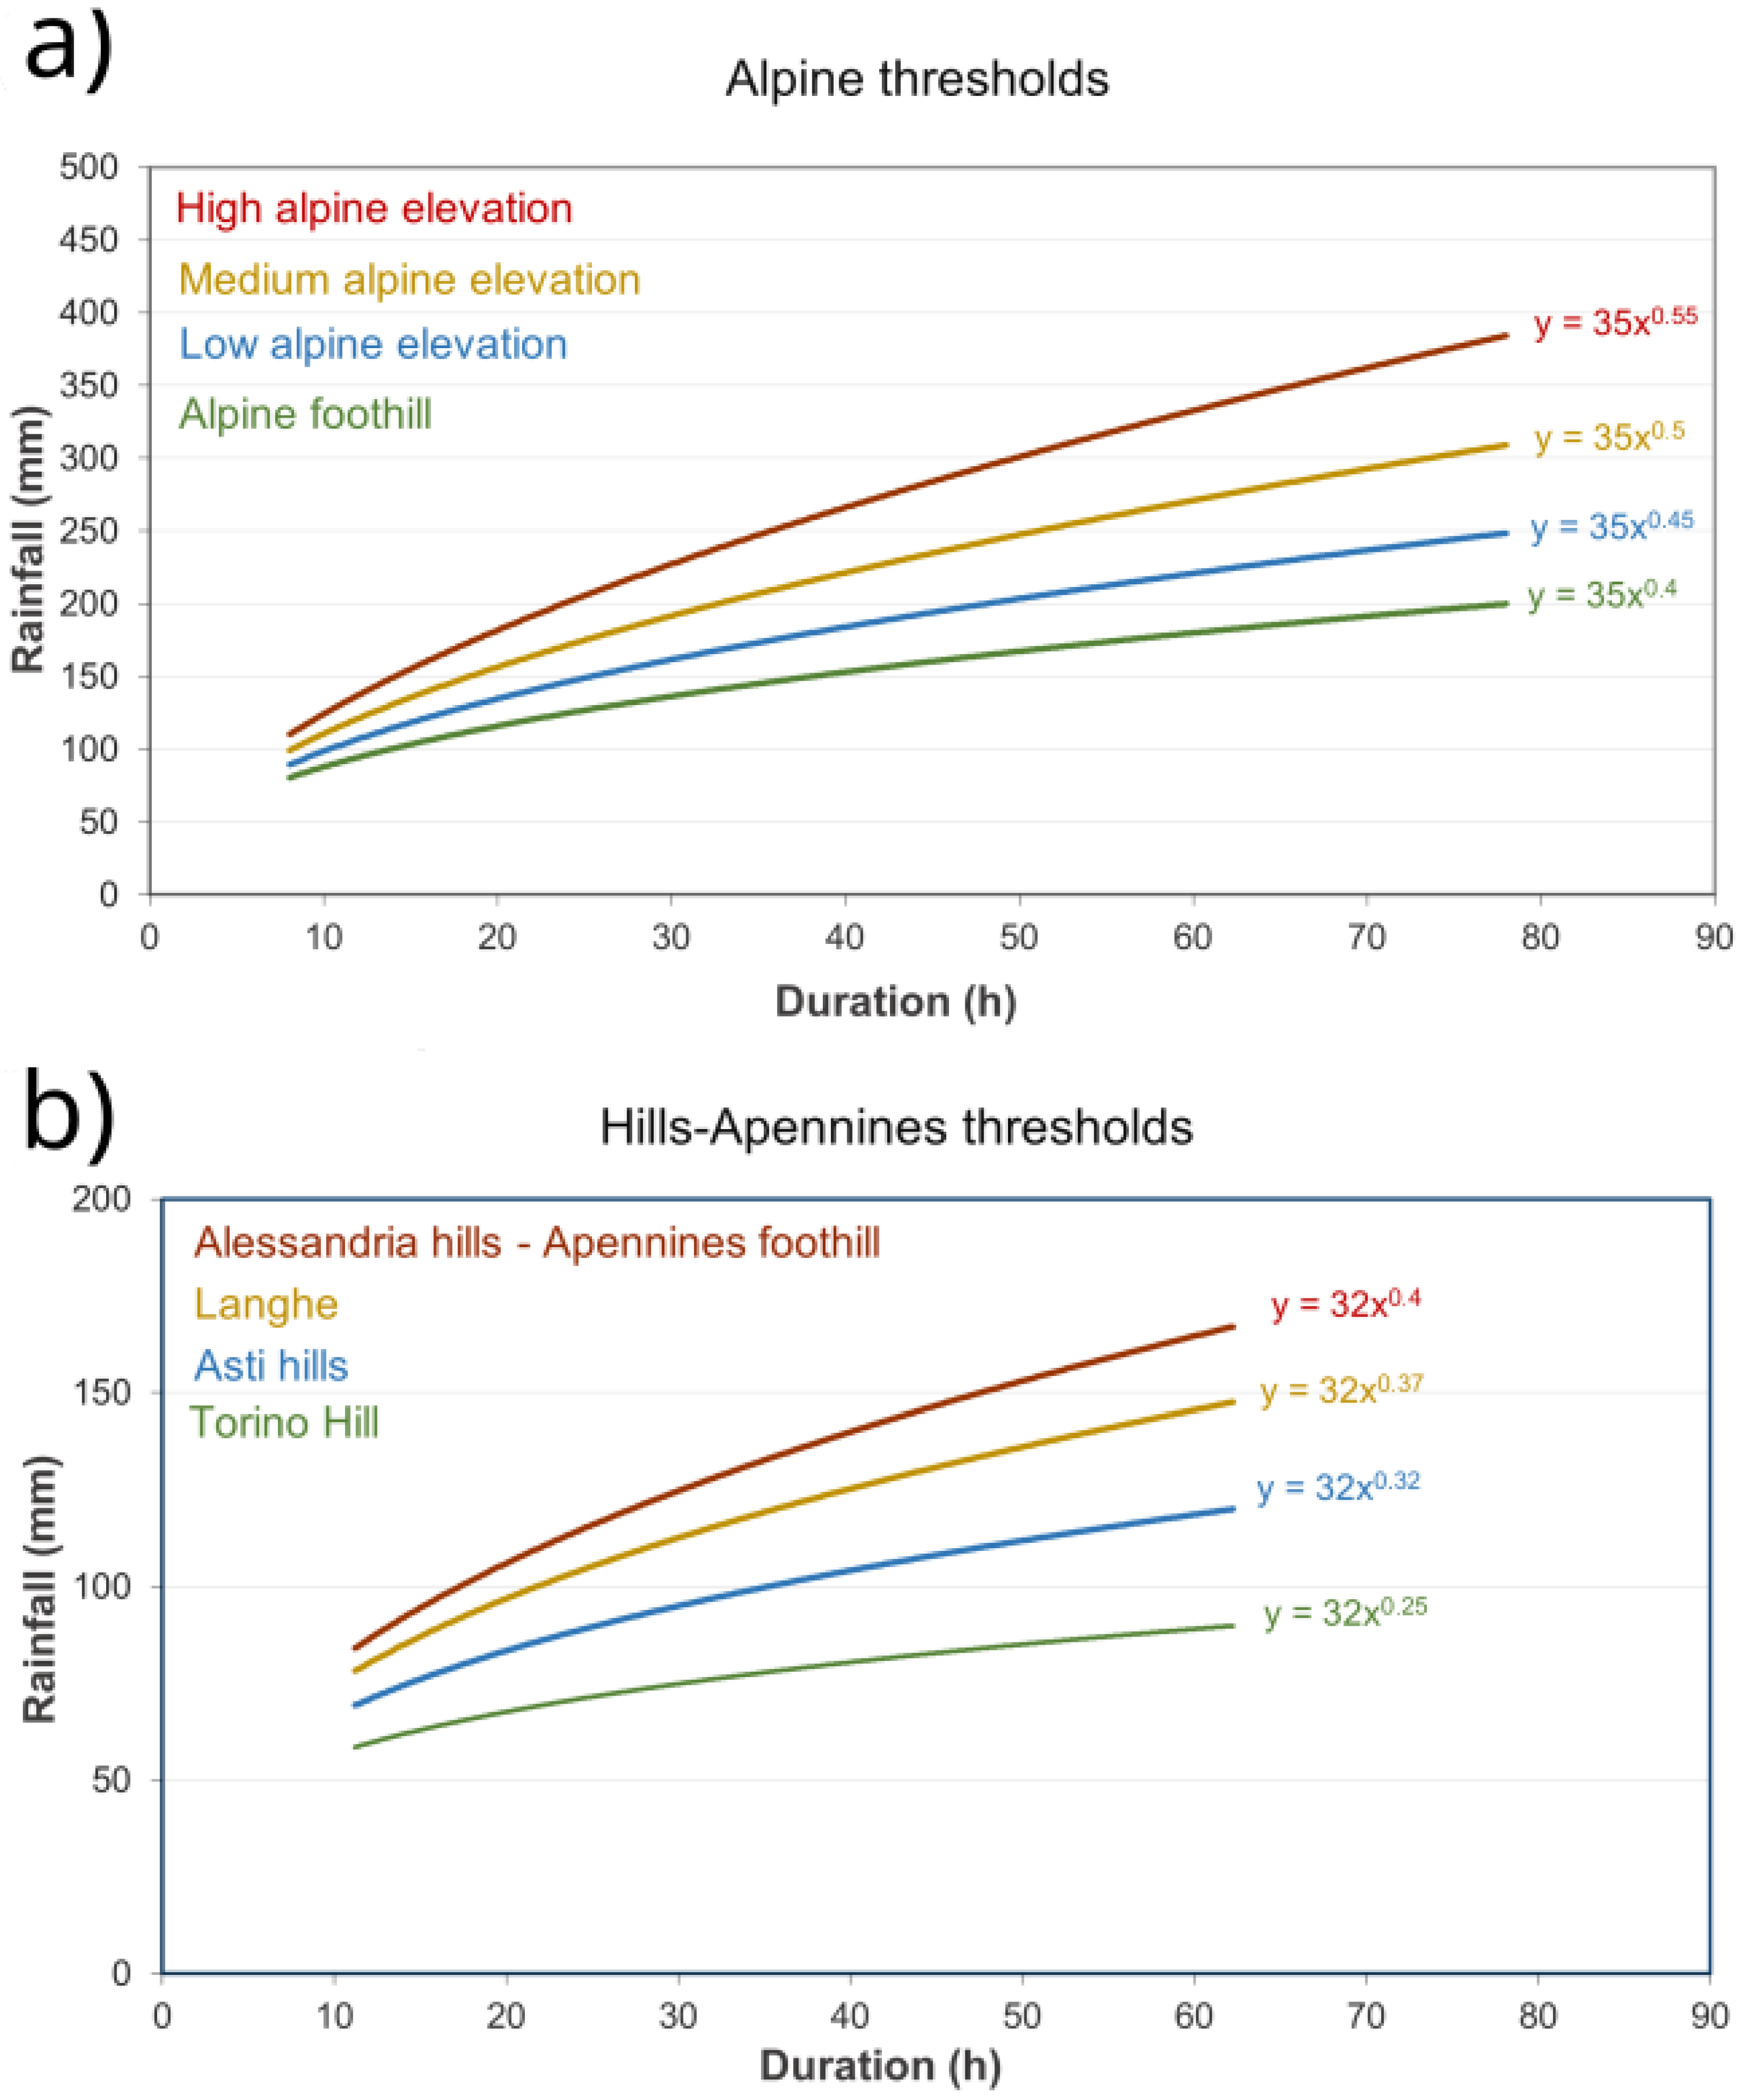
Thanks to new data, a more detailed analysis has been carried out to understand, with less uncertainty, the influence of climate change on shallow landslide events frequency and features. Moreover, new data have been used in back-analysis to evaluate the performance of the Regional Shallow Landslide Early Warning System (R-SLEWS), called SLOPS (Shallow Landslides Occurrence Prediction System), developed by Arpa Piemonte and became operational in 2019 [
8] using the Optimal Interpolation (OI) technique to analyze rainfall events inducing shallow landslide events and comparing rainfall values with the landslide triggering thresholds (
Figure 7).
2.2. Daily Gridded Climatic Data: Optimal Interpolation Technique
In the first decade of 2000, Arpa Piemonte developed a dataset of gridded temperature and precipitation records, with a spatial resolution of 0.125°, by means of an OI technique [
52] that produces a spatial interpolation of the data provided by an ensemble of weather stations in the Piemonte and Valle d’Aosta regions [
49] for the period 1958–2021. The original data came from a dense network of meteorological stations covering the Piemonte region from 1958 until today (automatic stations with 1′ of acquisition time from 1990). The weather station network is composed of rain gauges with a nonhomogeneous distribution both in time and space. The network started with about 100 stations in the early 1960s up to about 250 rain gauges today.
Arpa Piemonte used an OI technique to interpolate the daily precipitation data and to try to guarantee the best data homogenization over time. The OI technique consists of the assimilation of arbitrarily displaced ground weather station data on a selected regular three-dimensional grid map based on a background field (BF). For air temperature data, the BF was derived by ECMWF–ERA Interim reanalysis data instead of precipitation data, where an artificial constant field was used.
The temporal inhomogeneity of the climatic signal, caused by the growth in the number of weather stations over time, was mitigated by requiring that the gain matrix K (i.e., the inverse of the error covariance matrices for the observations and the background field) in the OI algorithm is as constant as possible year by year. The gain matrix was calibrated as a function of the stations’ number to amplify or reduce the stations’ contributions to obtain a better field estimate when air thermometers are missing and, at the same time, to avoid adding a false signal when the weather station density is high. Finally, the gridded dataset has a domain of 0.125 degrees on a regular grid covering the area 6.5 W–44 N/9.5 W–46.5 N. It consists of 24 × 20 grid points with the data starting from 1 December 1957 until 31 December 2021.
In this work, the daily precipitation field derived from this daily analysis (NWIOI—Northwestern Italy Optimal Interpolation) was used to validate the landslide triggering thresholds of the Regional Shallow Landslide Early Warning System (for 24 and 48 h of rainfall duration) by cross-referencing it with the events observed through the analysis of the historical archive, as described in
Section 2.1 of this paper. The validation procedure is described in depth in
Section 3.3 of this paper.
3. Results
3.1. Analysis Results of Shallow Landslide Events Behavior and Characteristics from 1960 to 2019 Focused on Different Environments
The shallow landslide events shown in
Table 1 have been analyzed to verify if variations in seasonality occurrence distribution are identifiable during the investigated period. To allow identification of significative trends in data distribution, shallow landslide events have been aggregated in 5-year intervals (
Table 2 and
Table 3) and grouped by main different environments, the Alps and Hills–Apennines, by merging landslide events of TBP hills, Turin Hill, and Apennines because of the affinities in the geological and geomorphological characteristics of the three environments and because of the few events recorded in Turin Hill and Apennines. Moreover, to better characterize the shallow landslide events for the different environments, widespread shallow landslides that occurred during the same rainfall event but involving different environments at the same time have been divided into sub-events within the overall event and counted individually. For this reason, the count of sub-events differs from the number of overall events (179 sub-events from 120 overall events).
Table 2 shows the number of shallow landslide sub-events that occurred in every season during the analysis period (where WI is winter, SP is spring, SU is summer, and FA is fall) in the Alpine environment, expressed in 5-year intervals and as the total number of events occurred in the different seasons for the whole period.
Table 3 shows the number of shallow landslide sub-events that occurred in every season during the analysis period (where WI is winter, SP is spring, SU is summer, and FA is fall) in the hilly and Apennine environments, expressed as 5-year intervals and as the total number of events occurred in the different seasons for the whole period.
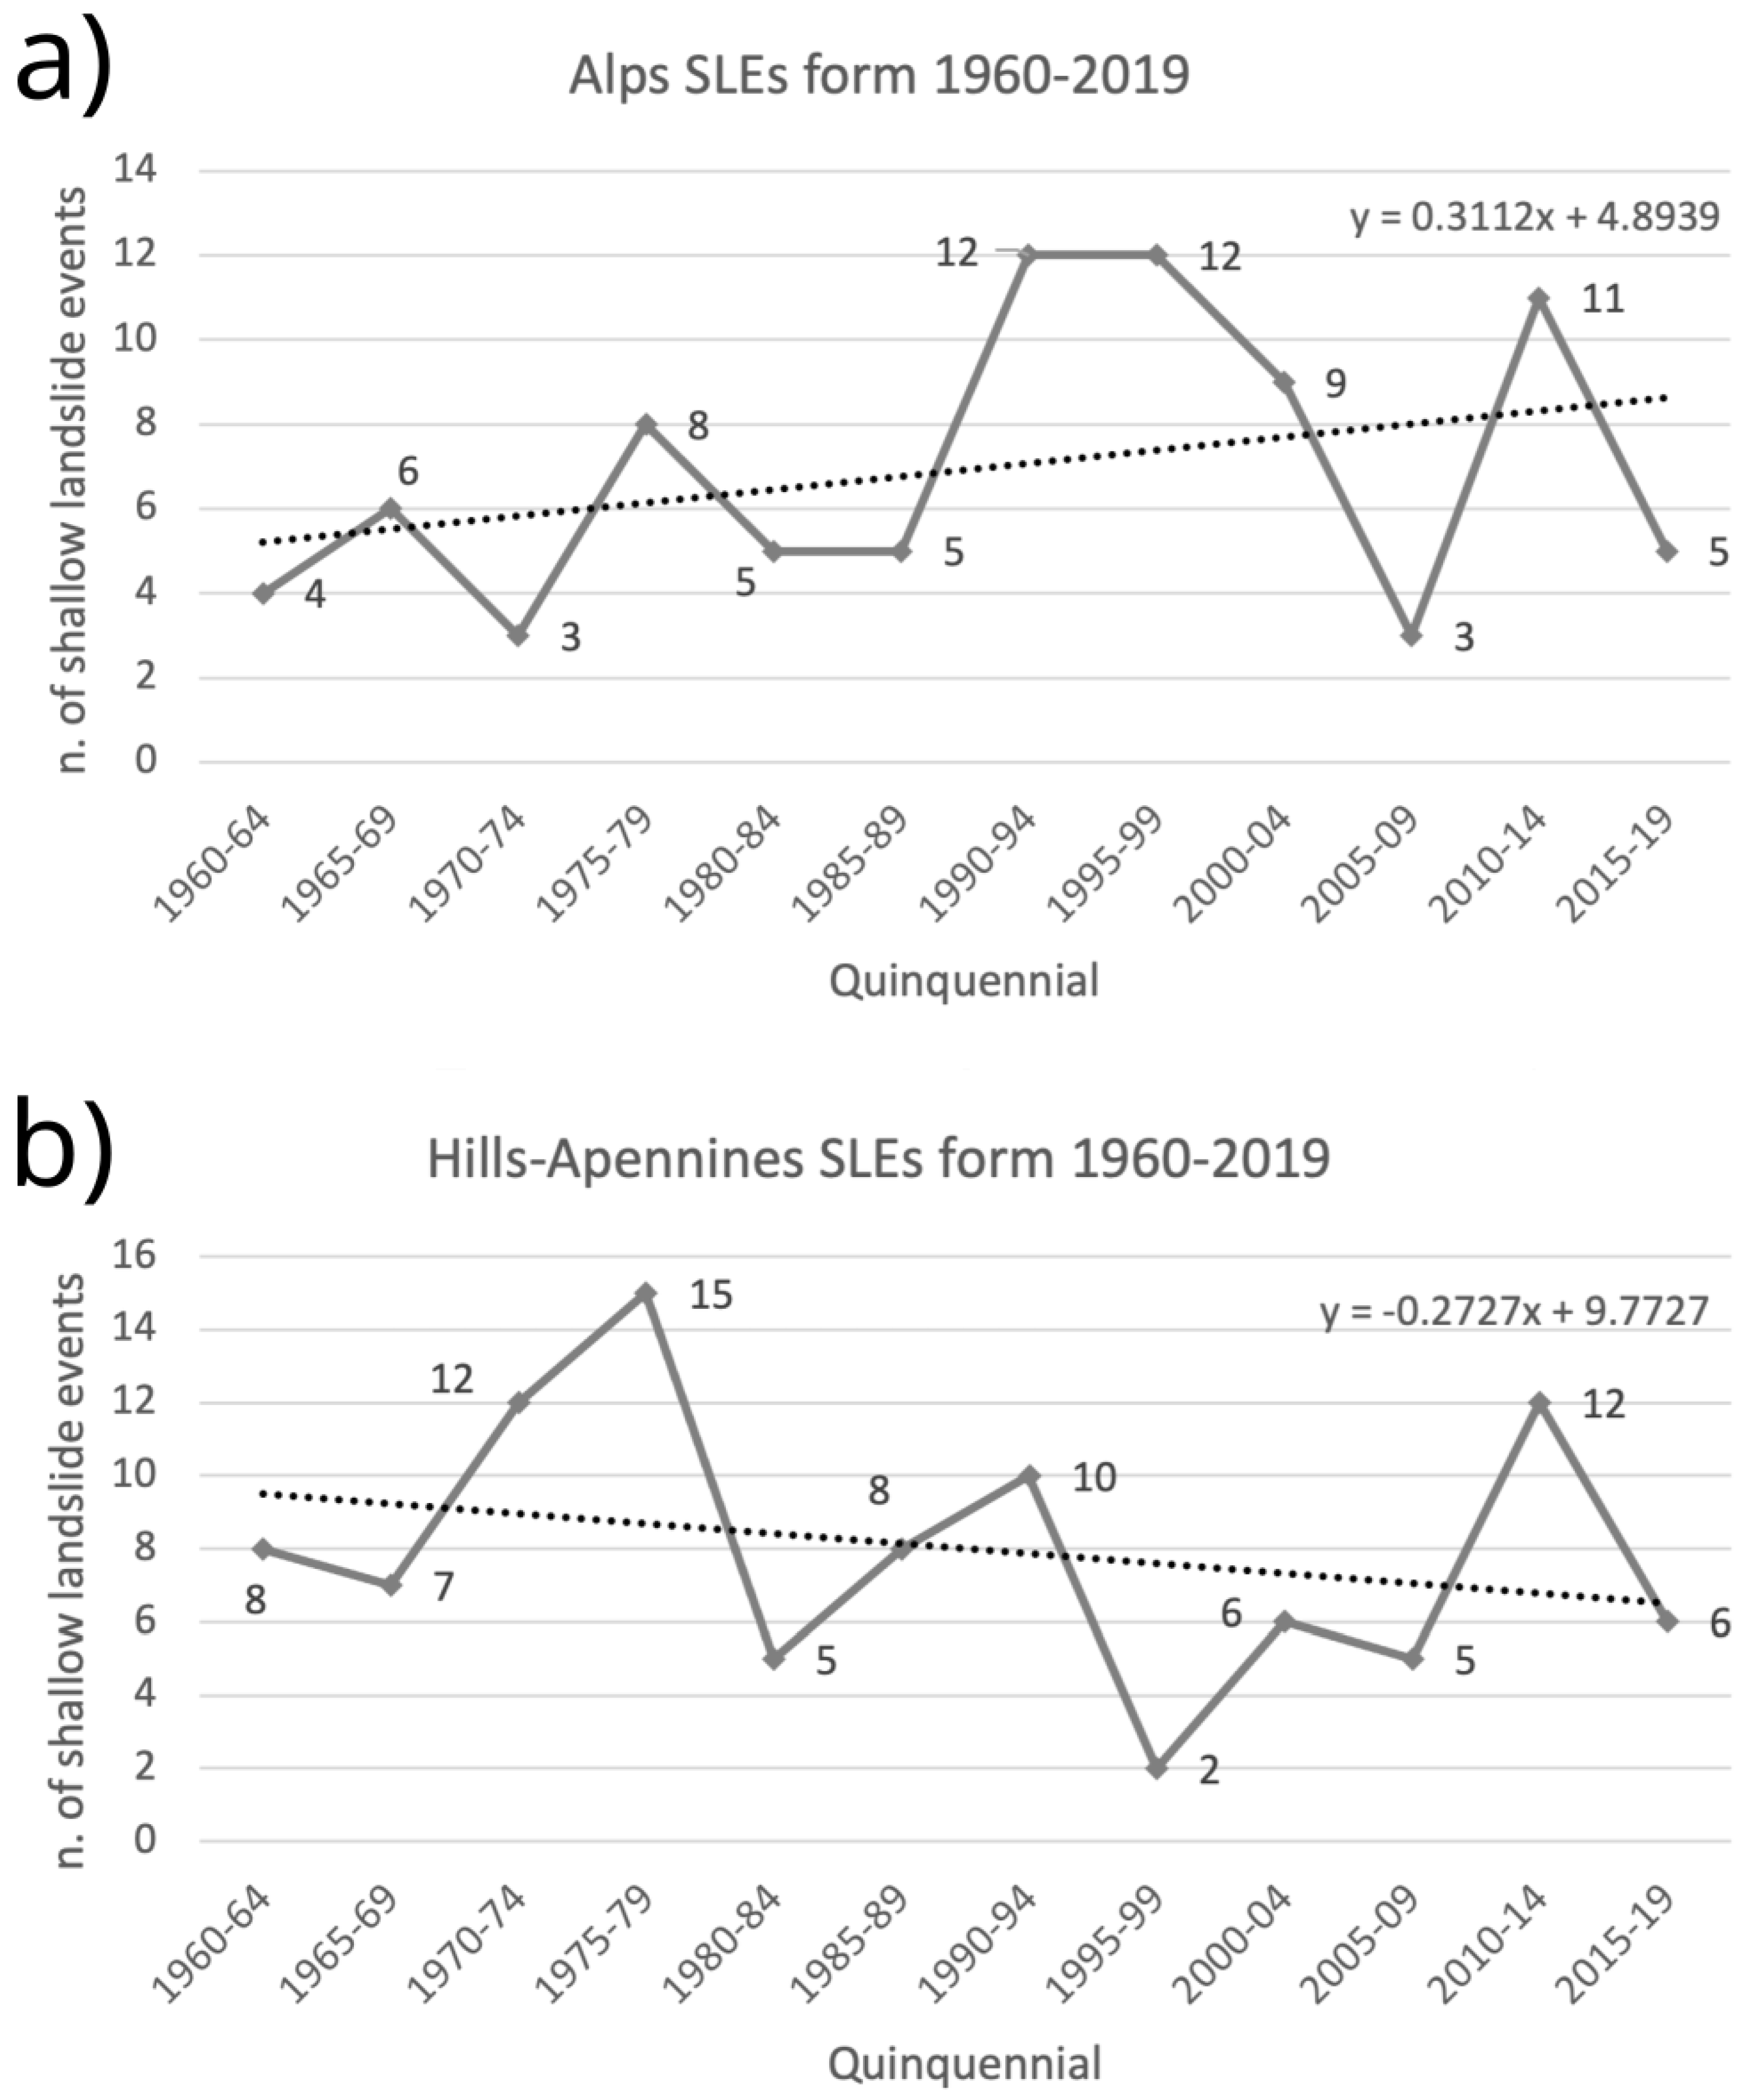
Figure 8 underlines only two weak trends in the number of shallow landslide sub-events: (a) a weakly growing trend in the spring events series in the Alps and (b) a slightly decreasing trend in hilly environments and Apennines. Considering the distribution of shallow landslide sub-events without considering the seasonality, the resulting trends are shown in
Figure 9a,b for the different environments.
The graphs of
Figure 9 clearly outline two opposite trends for the two environments that reflect what results from and can be explained by seasonal trends. There is, in fact, a generally weak growing trend in the number of sub-events grouped in 5-year intervals for the Alps, while the trend is opposite but equally little evident for the hilly and Apennines environments.
3.2. Variation in Rainfall Regime over the Piemonte Area
Precipitation is the main meteorological forcing for triggering shallow landslides. For this reason, an analysis of how the rainfall regime has varied in Piemonte over the last 60 years is crucial to assess the possible effects of climate change in terms of impacts over the territory. The historical dataset used in this work and derived from the regular gridded analysis produced by Arpa Piemonte is based on a daily timescale, so it does not allow detailed assessments of intense rainfall at the sub-daily scale. Nonetheless, the long historical period at hand and the logic of the data uniformly distributed on a regular grid over the whole study area allow us to extract information on both the variation of seasonal mean amounts and the general trend of rainfall days.
In this paper, a rainy day is defined as the period of 24 h in which at least 1 mm of rainfall was averaged over the position of the investigated area. For the purposes of this paper, the calculations were made on the average of the points of the gridded dataset falling within the administrative boundaries of Piemonte, which is about 240 daily values out of 480 possible.
Regarding the average annual precipitation over Piemonte, it has already been pointed out in
Figure 3 in
Section 1.2 that the data show no statistically significant trend over the past 65 years. For this reason, an attempt was made to perform the same trend analysis at the seasonal level using the Mann–Kendall test as a significance check parameter. The analysis was conducted by dividing the region into two groups: mountain environment, i.e., the grid points that fall geographically on mountains (the Alps and Apennines), and hill environment (
Figure 10), i.e., the grid points that fall essentially between the provinces of Asti and Alessandria.
The results of the statistical analyses are summarized in
Table 4.
As can be seen, no statistically significant trends were found, except for the case of winter precipitation in the mountain environment, where a decrease in mean rainfall of about 9 mm per decade was shown, with a significance close to the 90% threshold (
Figure 11).
The same decrease was found in winter rainfall in the hilly environment, but in this case, the significance of the trend is even lower (around the 85% threshold) and, therefore, hardly acceptable. Statistical analysis on both environments was then carried out for rainy days, as operationally defined in this section. The statistical results are shown in
Table 5.
In this case, only in the winter season, a statistically significant decrease was found for the mountain environment, amounting to about 1.5 days per 10 years; the overall decreasing trend is sharper in the hill environment, where the loss of rainy days is evident in all seasons, with different degrees of statistical reliability, particularly in summer where the 99% threshold is reached (
Figure 12).
Figure 12 shows the trend of rainfall days in hilly environments over Piemonte since the late 1950s. The decrease is estimated to be about 1.3 days every 10 years. This means that in 60 years, an average of 10 rainy days have been lost in the Piemonte hills during the summer months of June, July, and August.
3.3. Connection between Precipitation and Shallow Landslide Events and Evaluation of Regional Shallow Landslide Early Warning System Performance
As a result of the work described in the two previous paragraphs, long, large, and consistent datasets of both the meteorological forcing (rainfall) and ground effects (shallow landslides) are available for the study area.
The next step was to identify a quantitative correlation between cause and effects and to determine, using past events, whether the R-SLEWS trigger thresholds [
8] are effective for forecasting shallow landslide triggering. Initially, all shallow landslide events collected in the historical archive were considered, regardless of their time span, which is typically in the range of 1 and 5 days. In the 60 years between 1960 and 2019, there were 120 landslide events that affected any or all the environments considered in this work, i.e., the Alps, TPB, Apennines, and other hilly environments were found in the media and scientific/technical reports archive. Of all events, only the 24 h rainfall thresholds for shallow landslide triggering of the R-SLEWS were initially considered, which are, respectively, an average of 120 mm for the mountain environment and an average of 70 mm for the hilly environment. This approach was mandatory because the minimum time resolution of the NWIOI historical rainfall dataset is 24 h, from 00:00 h to 23:59 h, as one can see by the description in
Section 2.2 of this paper.
From a practical point of view, once the days when landslide events occurred were identified for each event, we checked whether the maximum daily precipitation had exceeded the respective trigger threshold of the R-SLEWS in at least one of the NWIOI dataset grid points falling in the Alpine, Apennines, or hilly environments.
The results were that some correspondence was found in 57 cases, which represent less than half of the sample size under consideration, which is an obviously unsatisfactory result.
However, with this approach, it must be taken into account that the major limitation of the NWIOI precipitation dataset is that the daily precipitation in 24 h is cumulated over a fixed time span ranging from 00:00 to 23:50.
This means that in all the cases when an intense rainfall event exceeds the R-SLEWS thresholds during the period between two consecutive days, we are not able to properly identify it with this kind of assessment. For this reason, we decided to extend the same analysis to the R-SLEWS 48 h thresholds, which are an average of 170 mm for the mountain environment and an average of 80 mm for the hilly environment.
This extended approach allowed the number of events correctly identified through the R-SLEWS thresholds (both 24 and 48 h) to be raised to 82 out of 120, resulting in a far better result.
After the hits by the R-SLEWS (82 out of 120) and the misses (32 out of 120) were identified, we focused on finding the false alarm rate in the same period.
To achieve this goal of constructing a reliable contingency table covering the study period between 1960 and 2019, we isolated all the events in which the daily precipitation in at least one of the NWIOI dataset grid points exceeds the R-SLEWS thresholds for mountain and hilly environments (including TPB), but no shallow landslide was recorded in the media/official reports archive. At the end of this analysis, it was verified that 65 cases could be classified as false alarms.
Finally, it was possible to construct a contingency table (
Table 6) describing the behavior of the 24 h R-SLEWS thresholds in connection to the shallow landslide events recorded.
The correct rejections were not considered because they would represent all the days when total rainfall was under the model thresholds and no shallow landslides occurred, which is a number that is excessive and insignificant for the purposes of this paper. Successful cases (hits) account for about 44% of the sample size (hits—H, missed alarm—MA, and false alarm—FA). However, the hits rise to 68% if we only take into account the events observed.
4. Discussion
The analyses carried out identify some weak trends in the rainfall regimes. The rainy days have decreased in general, with greater evidence in summer and spring characterized by a rate of decrease of approximately 10 days in 60 years.
As for seasonal mean precipitation, only winter in the Alps shows a weak decreasing trend by approximately 9 mm in 10 years. This variation has no remarkable impact on the triggering scenarios for shallow landslides.
Overall, the data indicate that the average seasonal precipitation has not changed significantly, except in winter in the Alps, suggesting that rainfall events are less frequent but more intense.
The number of shallow landslide events aggregated over five years shows a slight increase in the Alps and a marked decrease in the hilly–Apennines environments.
De facto, the decrease in rainy days in the hilly environment translates into fewer shallow landslide events occurrence.
These results underline that the only factor driving the behavior and the occurrence of shallow landslide events is the rainfall regime, whose variations directly affect the magnitude (number of shallow landslides per event), seasonality, and distribution of this landslide type, excluding the direct dependence on the other climatic variables that can influence the shallow landslide events in an indirect way, causing variations in rainfall event intensity and distribution (e.g., the effect of temperature increasing that can change the precipitation characteristics—type, spatial distribution, frequency, and seasonality, especially in the Alpine cryotic environment).
The rainfall regimes of Piemonte have not changed significantly as in other parts of the world (including some other Italian regions); for this reason, the evidence of the impacts of climate change on the behavior of this landslide type is less emphasized than what is reported in the international scientific literature regarding other areas, e.g., [
1,
2,
3,
4,
5,
6].
The subsequent cross-check with the historical rainfall data series using the OI technique highlighted that, in general, the thresholds defined by the R-SLEWS are effective in identifying shallow landslide events over the entire period under consideration (1990–2019) and are not affected by the weak trends in seasonal rainfall regime changes.
The cases of missed alarm (MA) can be explained either by the extreme localization of rainfall, which is not seen by the rainfall analysis dataset, or because it was exceeded in the 24-hour moving window between two consecutive days. In fact, considering the triggering threshold values of 48 h of rainfall duration, a significant decrease in missed alarms is obtained.
Using the support of the regional meteorological analysis bulletins, the failures of R-SLEWS, including false alarms (FAs), can be classified into five macro-categories:
Fourteen MA cases occurred in the years before 1990 when the NWIOI analysis dataset was based on less than 100 rainfall indicators to interpolate rainfall, and it is, therefore, more difficult to correctly quantify rainfall that has occurred in a specific and localized area.
In nine FA cases, the precipitation was extremely localized, which may have adversely affected the detection of shallow landslides that might been few and/or occurred in sparsely populated areas and, therefore, not reported.
In nine MA cases, the 24 h threshold was reasonably exceeded by the cumulate precipitation by rainfall events that interested two or more consecutive days, but the 48 h threshold was exceeded, giving a correct simulation of SLEs.
In four MA cases, light rainfall was observed over many days, which triggered shallow landslide events but did not cause the 24 and 48 h triggering thresholds to be exceeded.
In four FA cases, the explanation lies in the type of precipitation. The precipitation events were not characterized by rainfall but mainly by hail.
After the in-depth analysis of the results, it can, therefore, be stated that the effectiveness of the trigger thresholds is valid for the entire time series and for the different geographical/geological environments considered, guaranteeing a constant performance of the R-SLEWS over time unless future drastic changes in climate trends occur that are more emphasized than those observed in the period considered in this study.
In light of new data and with a view to continuously update, further development of this research will focus on identifying the likely scenarios for the shallow landslide events that could be defined by considering the climate change projections until 2100 at the regional scale, including this landslide type in the regional planning for medium–long term climate change impact mitigation.
5. Conclusions
In conclusion, our findings underscore the pivotal role of rainfall in triggering widespread shallow landslide events, with observed changes in rainfall regimes attributed to global warming.
While modest changes over the last 50 years have not adversely affected the current performance of Piemonte’s Shallow Landslide Early Warning System, continuous monitoring is crucial to adapt to potential future shifts.
These regional insights, derived from extensive data analysis, provide valuable contributions to the broader understanding of climate change impacts on common natural hazards in mountainous and hilly environments.
Looking ahead, our future research will delve into the influence of climate change scenarios projected to 2100 at the regional scale, shaping the regional strategic plan to mitigate climate change effects in the medium to long term, with a specific focus on including shallow landslides.
Author Contributions
Conceptualization, D.T. and C.R.; methodology, D.T. and C.R.; software, D.T. and C.R.; validation, D.T. and C.R.; formal analysis, D.T. and C.R.; investigation, D.T. and C.R.; resources, D.T. and C.R.; data curation, D.T. and C.R.; writing—original draft preparation, D.T. and C.R.; writing—review and editing, D.T. and C.R.; visualization, D.T. and C.R.; supervision, D.T. and C.R.; project administration, D.T. and C.R. All authors have read and agreed to the published version of the manuscript.
Funding
This research received no external funding.
Data Availability Statement
Conflicts of Interest
The authors declare no conflict of interest.
Correction Statement
This article has been republished with a minor correction to resolve spelling and grammatical errors. This change does not affect the scientific content of the article.
References
- Crozier, M.J. Deciphering the effect of climate change on landslide activity: A review. Geomorphology 2010, 124, 260–267. [Google Scholar] [CrossRef]
- Dijkstra, T.A.; Dixon, N. Climate change and slope stability: Challenges and approaches. Q. J. Eng. Geol. Hydrogeol. 2010, 43, 371–385. [Google Scholar] [CrossRef]
- Coe, J.A.; Godt, J.W. Review of approaches for assessing the impact of climate change on landslide hazards. Landslides and Engineered Slopes, Protecting Society Through Improved Understanding, Proceedings 11th International and 2nd North American Symposium on Landslides and Engineered Slopes, Banff, AB, Canada, 3–8 June 2012; Eberhardt, E., Froese, C., Turner, A.K., Leroueil, S., Eds.; Taylor & Francis Group: London, UK, 2012; pp. 371–377. [Google Scholar]
- Gariano, S.L.; Guzzetti, F. Landslides in a changing climate. Earth-Sci. Rev. 2016, 162, 227–252. [Google Scholar] [CrossRef]
- Sharma, A.; Roshani, H.S.; Rahaman, M.H. A systematic review for assessing the impact of climate change on landslides: Research gaps and directions for future research. Spat. Inf. Res. 2023. [Google Scholar] [CrossRef]
- Tiranti, D.; Cremonini, R. Editorial: Landslide Hazard in a Changing Environment. Front. Earth Sci. 2019, 7, 3. [Google Scholar] [CrossRef]
- Tiranti, D.; Rabuffetti, D. Estimation of rainfall thresholds triggering shallow landslides for an operational warning system implementation. Landslides 2010, 7, 471–481. [Google Scholar] [CrossRef]
- Tiranti, D.; Nicolò, G.; Gaeta, A.R. Shallow landslides predisposing and triggering factors in developing a regional early warning system. Landslides 2019, 16, 235–251. [Google Scholar] [CrossRef]
- Evans, S.G.; Clague, J.J. Recent climatic changes and catastrophic geomorphic processes in mountain environments. Geomorphology 1994, 10, 107–128. [Google Scholar] [CrossRef]
- Dehn, M.; Buma, J. Modelling future landslide activity based on general circulation models. Geomorphology 1999, 30, 175–187. [Google Scholar] [CrossRef]
- Dehn, M.; Bürger, G.; Buma, J.; Gasparetto, P. Impact of climate change on slope stability using expanded downscaling. Eng. Geol. 2000, 55, 193–204. [Google Scholar] [CrossRef]
- Dikau, R.; Schrott, L. The temporal stability and activity of landslides in Europe with respect to climatic change (TESLEC): Main objectives and results. Geomorphology 1999, 30, 1–12. [Google Scholar] [CrossRef]
- Collison, A.; Wade, S.; Griffiths, J.; Dehn, M. Modelling the impact of predicted climate change on landslide frequency and magnitude in SE England. Eng. Geol. 2000, 5, 205–218. [Google Scholar] [CrossRef]
- van Beek, L.P.H. Assessment of the Influence of Changes in Land Use and Climate on Landslide Activity in a Mediterranean Environment. Netherlands Geographical Studies; NGS 294; Utrecht University: Utrecht, The Netherlands, 2002; 360p, Available online: https://dspace.library.uu.nl/handle/1874/560 (accessed on 1 January 2023).
- Beniston, M. Climatic change in mountain regions. A review of possible impacts. Clim. Chang. 2003, 59, 5–31. [Google Scholar] [CrossRef]
- Hultén, C.; Andersson-Sköld, Y.; Ottosson, E.; Johansson, Å.; Edstam, T. Case studies of landslide risk due to climate change in Sweden. In Landslides and Climate Change: Challenges and Solutions, Proceedings of the International Conference on Landslides and Climate Change, Ventnor, UK, 21–24 May 2007; McInnes, R., Jakeways, J., Fairbank, H.E.M., Eds.; CRC Press, Taylor & Francis: Boca Raton, FL, USA, 2007; pp. 149–157. [Google Scholar]
- Francani, V.; Gattinoni, P. Relationship between climate change and landslide hazard in alpine areas interested by thawing permafrost. In Prediction and Simulation Methods for Geohazard Mitigation; Oka, F., Kimoto, S., Murakami, A., Eds.; Taylor & Francis Group: London, UK, 2009; pp. 97–102. ISBN 978-0-415-80482-0. [Google Scholar]
- Borgatti, L.; Soldati, M. Landslides as a geomorphological proxy for climate change: A record from the Dolomites (northern Italy). Geomorphology 2010, 120, 56–64. [Google Scholar] [CrossRef]
- Allen, S.K.; Cox, S.C.; Owens, I.F. Rock-avalanches and other landslides in the central Southern Alps of New Zealand: A regional assessment of possible climate change impacts. Landslides 2011, 8, 33–48. [Google Scholar] [CrossRef]
- Chang, S.-H.; Chiang, K.-T. The potential impact of climate change on typhoon-triggered landslides in Taiwan, 2010–2099. Geomorphology 2011, 133, 143–151. [Google Scholar] [CrossRef]
- Gariano, S.L.; Petrucci, O.; Guzzetti, F. Changes in the occurrence of rainfall-induced landslides in Calabria, southern Italy, in the 20th century. Nat. Hazards Earth Syst. Sci. 2015, 15, 2313–2330. [Google Scholar] [CrossRef]
- Palomba, M.; Giardino, M.; Ratto, S.; Pogliotti, P. Analysis of factor controlling landslide susceptibility in the Aosta Valley (NW Italy): Relationship to climatic and environmental changes. In Engineering Geology for Society and TerritoryClimate Change and Engineering Geology 1; Lollino, G., Manconi, A., Clague, J., Shan, W., Chiarle, M., Eds.; Springer International Publishing: Berlin/Heidelberg, Germany, 2015; pp. 435–438. [Google Scholar]
- Picarelli, L.; Comegna, L.; Guzzetti, F.; Gariano, S.L.; Mercogliano, P.; Rianna, G.; Santini, M.; Tommasi, P. Potential climate changes in Italy and consequences on land stability. In Slope Safety Preparedness for Impact of Climate Change, 1st ed.; Ho, K., Lacasse, S., Picarelli, L., Eds.; Taylor & Francis: London, UK, 2015; 46p. [Google Scholar]
- Winter, M.G.; Shearer, B. Climate change and landslide hazard and risk in Scotland. In Engineering Geology for Society and Territory Climate Change and Engineering Geology; Lollino, G., Manconi, A., Clague, J., Shan, W., Chiarle, M., Eds.; Springer International Publishing: Berlin/Heidelberg, Germany, 2015; pp. 411–414. [Google Scholar]
- Wood, J.L.; Harrison, S.; Reinhardt, L. Landslide inventories for climate impacts research in the European Alps. Geomorphology 2015, 228, 398–408. [Google Scholar] [CrossRef]
- Wood, J.L.; Harrison, S.; Turkington, T.; Reinhardt, L. Landslides and synoptic weather trends in the European Alps. Clim. Chang. 2016, 136, 297–308. [Google Scholar] [CrossRef]
- Ciabatta, L.; Camici, S.; Brocca, L.; Ponziani, F.; Stelluti, F.; Berni, N.; Moramarco, T. Assessing the impact of climate-change scenarios on landslide occurrence in Umbria Region, Italy. J. Hydrol. 2016, 541, 285–295. [Google Scholar] [CrossRef]
- Paranunzio, R.; Laio, F.; Chiarle, M.; Nigrelli, G.; Guzzetti, F. Climate anomalies associated to the occurrence of rockfalls at high-elevation in the Italian Alps. Nat. Hazard Earth Sys. Sci. Discuss. 2016, 16, 2085–2106. [Google Scholar] [CrossRef]
- Qigen, L.; Steger, S.; Pittore, P.; Zhang, J.; Wang, L.; Jiang, T.; Wang, Y. Evaluation of potential changes in landslide susceptibility and landslide occurrence frequency in China under climate change. Sci. Total Environ. 2022, 850, 158049. [Google Scholar] [CrossRef]
- Aditya, N.M.; Douglas, M.; Raphael, K.; Heimo, T.; Alexander, B.; Herwig, P. Climate change amplified the 2009 extreme landslide event in Austria. Clim. Chang. 2023, 176, 124. [Google Scholar] [CrossRef]
- Buma, J.; Dehn, M. Impact of climate change on a landslide in South East France, simulated using different GCM scenarios and downscaling methods for local precipitation. Clim. Res. 2000, 15, 69–81. [Google Scholar] [CrossRef]
- Soldati, M.; Corsini, A.; Pasuto, A. Landslides and climate change in the Italian Dolomites since the Late glacial. CATENA 2004, 55, 141–161. [Google Scholar] [CrossRef]
- Paolini, L.; Villalba, R.; Grau, H.R. Precipitation variability and landslide occurrence in a subtropical mountain ecosystem of NW Argentina. Dendrochronologia 2005, 22, 175–180. [Google Scholar] [CrossRef]
- Bracegirdle, A.; Menkiti, C.O.; Clark, A.R. Climate change impacts on landslide mechanisms and hazard in southern UK. In Landslides and Climate Change: Challenges and Solutions, Proceedings of the International Conference on Landslides and Climate Change, Ventnor, UK, 21–24 May 2007; McInnes, R., Jakeways, J., Fairbank, H., Mathie, E., Eds.; CRC Press, Taylor & Francis: Boca Raton, FL, USA, 2007; pp. 259–267. [Google Scholar]
- Baills, A.; Vandromme, R.; Desramaut, N.; Sedan-Miegemolle, O.; Grandjean, G. Changing patterns in climate-driven landslide hazard: An alpine test site. In Landslide Science and Practice: Global Environmental Change 4; Margottini, C., Canuti, P., Sassa, K., Eds.; Springer: Berlin/Heidelberg, Germany, 2013; pp. 93–98. [Google Scholar] [CrossRef]
- Chiarle, M.; Coviello, V.; Arattano, M.; Silvestri, P.; Nigrelli, G. High elevation rock falls and their climatic control: A case study in the Conca di Cervinia (NW Italian Alps). In Engineering Geology for Society and Territory. Climate Change and Engineering Geology 1; Lollino, G., Manconi, A., Clague, J.J., Shan, W., Chiarle, M., Eds.; Springer: Berlin/Heidelberg, Germany, 2015; pp. 423–443. [Google Scholar] [CrossRef]
- Huggel, S.; Clague, J.J.; Korup, O. Is climate change responsible for changing landslide activity in high mountains? Earth Surf. Process. Landf. 2012, 37, 77–91. [Google Scholar] [CrossRef]
- Saez, J.L.; Corona, C.; Stoffel, M.; Berger, F. Climate change increases frequency of shallow spring landslides in the French Alps. Geology 2013, 41, 619–622. [Google Scholar] [CrossRef]
- Fan, J.C.; Yang, C.H.; Chang, S.C.; Huang, H.Y.; Guo, J.J. Effects of climate change on the potential of the landslides in the basin of Kaoping stream. J. Chin. Soil Water Conserv. 2013, 44, 335–350. [Google Scholar]
- Dixon, N.; Brook, E. Impact of predicted climate change on landslide reactivation: Case study of Mam Tor, UK. Landslides 2007, 4, 137–147. [Google Scholar] [CrossRef]
- Malet, J.P.; Remaítre, A.; Maquaire, O.; Durand, Y.; Etchevers, P.; Guyomarch, G.; Déqué, M.; van Beek, L.P.H. Assessing the influence of climate change on the activity of landslides in the Ubaye Valley. In Landslides and Climate Change: Challenges and Solutions, Proceedings of the International Conference on Landslides and Climate Change, Ventnor, UK, 21–24 May 2007; McInnes, R., Jakeways, J., Fairbank, H.E.M., Eds.; CRC Press, Taylor & Francis: Boca Raton, FL, USA, 2007; pp. 195–205. [Google Scholar]
- Stoffel, M.; Huggel, C. Effects of climate change on mass movements in mountain environments. Prog. Phys. Geogr. 2012, 36, 421–439. [Google Scholar] [CrossRef]
- Yin, Z.; Qin, X.; Yin, Y.; Zhao, W.; Wei, G. Landslide developmental characteristics and response to climate change since the last glacial in the upper reaches of the Yellow river, NE Tibetan plateau. Acta Geol. Sin. 2014, 88, 635–646. [Google Scholar] [CrossRef]
- Rianna, G.; Zollo, A.L.; Tommasi, P.; Paciucci, M.; Comegna, L.; Mercogliano, P. Evaluation of the effects of climate changes on landslide activity of Orvieto clayey slope. Procedia Earth Plan. Sci. 2014, 9, 54–63. [Google Scholar] [CrossRef]
- Zollo, A.L.; Rianna, G.; Mercogliano, P.; Tommasi, P.; Comegna, L. Validation of a simulation chain to assess climate change impact on precipitation induced landslides. In Landslide Science for a Safer Geoenvironment, Volume 1 of Proceedings of World Landslide Forum 3; Sassa, K., Canuti, P., Yin, Y., Eds.; Springer: Cham, Switzerland, 2014; pp. 287–292. [Google Scholar]
- Ravanel, L.; Deline, P. Rockfall hazard in the Mont Blanc massif increased by the current atmospheric warming. In Engineering Geology for Society and Territory Climate Change and Engineering Geology 1; Lollino, G., Manconi, A., Clague, J., Shan, W., Chiarle, M., Eds.; Springer International Publishing: Berlin/Heidelberg, Germany, 2015; pp. 425–428. [Google Scholar]
- Stoffel, M.; Tiranti, D.; Huggel, C. Climate change impacts on mass movements—Case studies from the European Alps. Sci. Total Environ. 2014, 493, 1255–1266. [Google Scholar] [CrossRef]
- Piana, F.; Fioraso, G.; Irace, A.; Mosca, P.; d’Atri, A.; Barale, L.; Falletti, P.; Monegato, G.; Morelli, M.; Tallone, S.; et al. Geology of Piemonte region (NW Italy, Alps–Apennines interference zone). J. Maps 2017, 13, 395–405. [Google Scholar] [CrossRef]
- IPCC. Climate Change 2022: Impacts, Adaptation, and Vulnerability. In Contribution of Working Group II to the Sixth Assessment Report of the Intergovernmental Panel on Climate Change; Pörtner, H.-O., Roberts, D.C., Tignor, M., Poloczanska, E.S., Mintenbeck, K., Alegría, A., Craig, M., Langsdorf, S., Löschke, S., Möller, V., et al., Eds.; Cambridge University Press: Cambridge, UK; New York, NY, USA, 2022; 3056p. [Google Scholar] [CrossRef]
- Ronchi, C.; De Luigi, C.; Ciccarelli, N.; Loglisci, N. Development of a daily gridded climatological air temperature dataset based on an optimal interpolation of ERA-40 reanalysis downscaling and a local high resolution thermometers network. In Proceedings of the European Conference on Applied Climatology (ECAC), Amsterdam, The Netherlands, 29 September–3 October 2008. [Google Scholar]
- Piciullo, L.; Tiranti, D.; Pecoraro, G.; Cepeda, J.M.; Calvello, M. Standards for the performance assessment of territorial landslide early warning systems. Landslides 2020, 17, 2533–2546. [Google Scholar] [CrossRef]
- Kalnay, E. Atmospheric Modeling, Data Assimilation and Predictability; Cambridge University Press: Cambridge, UK, 2003; 368p. [Google Scholar] [CrossRef]
Figure 1.
Geographic environments of Piemonte. Barycentric coordinates of Piemonte: Lat (DMS) 45°00′00″ North; Long (DMS) 8°00′00″ East. The Alps border the Piemonte region to the north, west, and south. The Apennines mark the southeast border of the region. The hilly environment is distributed in the central and southeastern part of Piemonte: Turin Hill is the northwestern part of the hilly environment; TPB includes southern parts of Asti and Alessandria hills; Monferrato hills represent Alessandria’s northern hilly environment and the northeastern part of Asti hills.
Figure 2.
Maximum yearly temperature anomaly (positive in red and negative in blue) over Piemonte in the last seven decades with trends since 1958 (black line with gray bands) and 1994 (black line with gray bands). The reference period is 1991–2020. Data from Arpa Piemonte NWIOI daily dataset (modified from [
50]).
Figure 3.
Mean yearly precipitation anomaly (positive in orange and negative in blue) over Piemonte in the last seven decades with trends since 1958 (black line with gray bands). The reference period is 1991–2020. Data from Arpa Piemonte NWIOI daily dataset (modified from [
50]).
Figure 3.
Mean yearly precipitation anomaly (positive in orange and negative in blue) over Piemonte in the last seven decades with trends since 1958 (black line with gray bands). The reference period is 1991–2020. Data from Arpa Piemonte NWIOI daily dataset (modified from [
50]).
Figure 4.
Shallow landslide events distribution (x-axis) from 1960 to 2019 distinguished by environments: Alpine (a) Landslide events occurrence season per year (represented by circles’ color) with the magnitude (expressed as the indicative average number of occurred shallow landslides per event represented by circles’ size), (b) Season of occurrence (represented by circles’ color) and duration of rainfall event (days, on the y-axis) and the magnitude (expressed as the indicative average number of occurred shallow landslides per event represented by circles’ size).
Figure 5.
Shallow landslide events distribution (x-axis) from 1960 to 2019 distinguished by environments: TPB (a) Landslide events occurrence season per year (represented by circles’ color) with the magnitude (expressed as the indicative average number of occurred shallow landslides per event represented by circles’ size), (b) Season of occurrence (represented by circles’ color) and duration of rainfall event (days, on the y-axis) and the magnitude (expressed as the indicative average number of occurred shallow landslides per event represented by circles’ size).
Figure 6.
Shallow landslide events distribution (x-axis) from 1960 to 2019 distinguished by environments: Turin Hill and Apennines (a) Landslide events occurrence season per year (represented by circles’ color) with the magnitude (expressed as the indicative average number of occurred shallow landslides per event represented by circles’ size), (b) Season of occurrence (represented by circles’ color) and duration of rainfall event (days, on the y-axis) and the magnitude (expressed as the indicative average number of occurred shallow landslides per event represented by circles’ size). “A” in the circles indicates the Apennines environment; “H” in the circles indicates the Turin Hill environment.
Figure 7.
Shallow landslide (SL) triggering thresholds from SLOPS R-SLEWS. (a) SL triggering thresholds for different Alpine elevations. (b) SL triggering thresholds for different hilly environments (TPB includes Langhe and southern part of Asti and Alessandria hills); Turin Hill threshold includes the Monferrato hills (Alessandria’s northern hill) as the southeastern prosecution of Turin Hill.
Figure 8.
Shallow landslide sub-events (SLEs) that occurred in the period 1960–2019. (a) Shallow landslide sub-events distribution grouped by season of occurrence in the Alpine environment; (b) Shallow landslide sub-events distribution grouped by season of occurrence in Hills–Apennines environments.
Figure 9.
Shallow landslide sub-events (SLEs) that occurred in the period 1960–2019. (a) Shallow landslide sub-events distribution in the Alpine environment; (b) Shallow landslide sub-events distribution in Hills–Apennines environments. Dotted lines are the highlighted trends.
Figure 9.
Shallow landslide sub-events (SLEs) that occurred in the period 1960–2019. (a) Shallow landslide sub-events distribution in the Alpine environment; (b) Shallow landslide sub-events distribution in Hills–Apennines environments. Dotted lines are the highlighted trends.
Figure 10.
Map of the mountain (Alps–Apennines) environment (shaded blue) and hill environment (shaded red) over Piemonte, using the grid displacement of daily climatic data.
Figure 10.
Map of the mountain (Alps–Apennines) environment (shaded blue) and hill environment (shaded red) over Piemonte, using the grid displacement of daily climatic data.
Figure 11.
Precipitation anomaly in the winter season over the Alpine–Apennines environment in Piemonte in the last seven decades (blue line), with trends since 1958 (red line with gray bands). The reference period is 1991–2020.
Figure 11.
Precipitation anomaly in the winter season over the Alpine–Apennines environment in Piemonte in the last seven decades (blue line), with trends since 1958 (red line with gray bands). The reference period is 1991–2020.
Figure 12.
Rainy days anomaly in the winter season over the hill environment in Piemonte in the last seven decades (blue line), with trends since 1958 (red line with gray bands). The reference period is 1991–2020.
Figure 12.
Rainy days anomaly in the winter season over the hill environment in Piemonte in the last seven decades (blue line), with trends since 1958 (red line with gray bands). The reference period is 1991–2020.
Table 1.
Shallow landslide events that occurred in Piemonte from 1960 to 2019 aggregated in 5-year intervals.
Table 1.
Shallow landslide events that occurred in Piemonte from 1960 to 2019 aggregated in 5-year intervals.
| Quinquennium | Number of Shallow Landslide Events |
|---|
| 1960–1964 | 8 |
| 1965–1969 | 8 |
| 1970–1974 | 13 |
| 1975–1979 | 18 |
| 1980–1984 | 6 |
| 1985–1989 | 7 |
| 1990–1994 | 15 |
| 1995–1999 | 12 |
| 2000–2004 | 11 |
| 2005–2009 | 5 |
| 2010–2014 | 12 |
| 2015–2019 | 5 |
| Total | 120 |
Table 2.
Shallow landslide sub-events that occurred in the Alps from 1960 to 2019 aggregated in 5-year intervals.
Table 2.
Shallow landslide sub-events that occurred in the Alps from 1960 to 2019 aggregated in 5-year intervals.
| Alps |
|---|
| | Season vs. Number of Shallow Landslide Sub-Events | |
|---|
| Years | WI | SP | SU | FA | Total n. of SLS-Es |
|---|
| 1960–1964 | - | 1 | - | 3 | 4 |
| 1965–1969 | - | 1 | 1 | 4 | 6 |
| 1970–1974 | - | - | 2 | 1 | 3 |
| 1975–1979 | - | 2 | 2 | 4 | 8 |
| 1980–1984 | - | 2 | - | 3 | 5 |
| 1985–1989 | - | 3 | 1 | 1 | 5 |
| 1990–1994 | 2 | 3 | 1 | 6 | 12 |
| 1995–1999 | 1 | 4 | 2 | 5 | 12 |
| 2000–2004 | - | 3 | 3 | 3 | 9 |
| 2005–2009 | - | 2 | - | 1 | 3 |
| 2010–2014 | 1 | 4 | 2 | 4 | 11 |
| 2015–2019 | - | 1 | - | 4 | 5 |
| Total | 4 | 26 | 14 | 39 | 83 |
Table 3.
Shallow landslide sub-events that occurred in the hills and Apennines environments from 1960 to 2019 aggregated in 5-year intervals.
Table 3.
Shallow landslide sub-events that occurred in the hills and Apennines environments from 1960 to 2019 aggregated in 5-year intervals.
| Hills–Apennines |
|---|
| | Season vs. Number of Shallow Landslide Sub-Events | |
|---|
| Years | WI | SP | SU | FA | Total n. of SLS-Es |
|---|
| 1960–1964 | 2 | 1 | - | 5 | 8 |
| 1965–1969 | - | 3 | - | 4 | 7 |
| 1970–1974 | 5 | 5 | - | 2 | 12 |
| 1975–1979 | 1 | 8 | 2 | 4 | 15 |
| 1980–1984 | - | 2 | - | 3 | 5 |
| 1985–1989 | 1 | 6 | - | 1 | 8 |
| 1990–1994 | 1 | 2 | - | 7 | 10 |
| 1995–1999 | 1 | 1 | - | - | 2 |
| 2000–2004 | - | - | 4 | 2 | 6 |
| 2005–2009 | 2 | 1 | 1 | 1 | 5 |
| 2010–2014 | 3 | 6 | - | 3 | 12 |
| 2015–2019 | - | 1 | - | 5 | 6 |
| Total | 16 | 36 | 7 | 37 | 96 |
Table 4.
Results of the Mann–Kendall test applied to linear trends of mean seasonal precipitation in both environments (mountain and hills) and in all four seasons. The leftmost column has the p-value setting thresholds of statistical significance.
Table 4.
Results of the Mann–Kendall test applied to linear trends of mean seasonal precipitation in both environments (mountain and hills) and in all four seasons. The leftmost column has the p-value setting thresholds of statistical significance.
| Mountain Area: Seasonal Precipitation Trends |
| | Test Mann–Kendall |
| Season | tau | p-value |
| Winter (DJF) | −0.14 | 0.12 |
| Spring (MAM) | 0.04 | 0.64 |
| Summer (JJA) | 0.07 | 0.41 |
| Fall (SON) | 0.04 | 0.65 |
| Hill Area: Seasonal Precipitation Trends |
| | Test Mann–Kendall |
| Season | tau | p-value |
| Winter (DJF) | −0.123 | 0.15 |
| Spring (MAM) | 0.001 | 1 |
| Summer (JJA) | 0.015 | 0.86 |
| Fall (SON) | 0.005 | 0.96 |
Table 5.
Results of the Mann–Kendall test applied to linear trends of rainy days in both environments (mountain and hills) and in all four seasons. The leftmost column has the p-value setting thresholds of statistical significance.
Table 5.
Results of the Mann–Kendall test applied to linear trends of rainy days in both environments (mountain and hills) and in all four seasons. The leftmost column has the p-value setting thresholds of statistical significance.
| Mountain Area: Seasonal Rainfall Day Trends |
| | Test Mann–Kendall |
| Season | tau | p-value |
| Winter (DJF) | −0.05 | 0.58 |
| Spring (MAM) | −0.01 | 0.98 |
| Summer (JJA) | −0.15 | 0.08 |
| Fall (SON) | −0.04 | 0.69 |
| Hill Area: Seasonal Rainfall Day Trends |
| | Test Mann–Kendall |
| Season | tau | p-value |
| Winter (DJF) | −0.16 | 0.07 |
| Spring (MAM) | −0.21 | 0.02 |
| Summer (JJA) | −0.27 | 0.01 |
| Fall (SON) | −0.13 | 0.13 |
Table 6.
Contingency table of rainfall over R-SLEWS 24 h threshold versus the shallow landslide events (SLEs) observed during the years 1960–2019 in both Piemonte environments (mountain and hills).
Table 6.
Contingency table of rainfall over R-SLEWS 24 h threshold versus the shallow landslide events (SLEs) observed during the years 1960–2019 in both Piemonte environments (mountain and hills).
| | | Rainfall |
|---|
| YES | NO |
|---|
| SLEs | YES | 82 (H) | 65 (MA) |
| NO | 38 (FA) | - |
| Disclaimer/Publisher’s Note: The statements, opinions and data contained in all publications are solely those of the individual author(s) and contributor(s) and not of MDPI and/or the editor(s). MDPI and/or the editor(s) disclaim responsibility for any injury to people or property resulting from any ideas, methods, instructions or products referred to in the content. |
© 2023 by the authors. Licensee MDPI, Basel, Switzerland. This article is an open access article distributed under the terms and conditions of the Creative Commons Attribution (CC BY) license (https://creativecommons.org/licenses/by/4.0/).


