Article

Conceptual and Analytical Framework as Flood Risk Mapping Subsidy

by
Larissa Ferreira D. R. Batista
and
Alfredo Ribeiro Neto
*
Department of Civil and Environmental Engineering, Universidade Federal de Pernambuco, Recife 50740-530, PE, Brazil
*
Author to whom correspondence should be addressed.
GeoHazards 2022, 3(3), 395-411; https://doi.org/10.3390/geohazards3030020
Submission received: 3 April 2022 / Revised: 26 May 2022 / Accepted: 15 July 2022 / Published: 27 July 2022

Abstract

:
There are still gaps in defining values and category classifications of exposed items in quantitative damage analysis. This paper proposes a framework that refines the development of flood risk analysis at a local scale. This study first performs a quantitative risk analysis, based mainly on secondary data; it then attempts to communicate the results graphically, aiming to reduce the financial and human resources required. We propose an easily standardized database in a GIS environment, analyzing the influence of a reservoir for flood control and the construction of replicable local-scale risk curves. Hydrological (HEC-HMS) and 2D hydrodynamic (HEC-RAS) models were used to simulate hydrographs considering different return periods. For damage estimation, the processing included vectorization of lots, building use definition with Google Street View, classification of standard designs, and a field survey to validate those classes. In monetary value, this study calculated the effect of the construction of a reservoir for damage reduction, showing the potential to determine the effectiveness of measures adopted to mitigate flood impacts. In addition, for each simulated return period, exposure, hazard, and damage maps can be established, making it possible to perform a complete risk analysis.

1. Introduction

In the current global context of climate emergencies, there is a need for awareness and ownership of the concept of risk so that a paradigm shift can be carried out [1]. The goal is to leave the fixed idea of trying to control extreme natural events and move towards an idea of adapting our reality into a more sustainable one. Move from resistance to resilience, from control to governance. The focus is no longer just on managing the disaster and the after-effects, but also more emphatically on risk management, that which precedes, anticipates, and prevents. These ideas have been proposed in the Hyogo Framework for Action and the Sendai Framework for Disaster Risk Reduction [2]. The latter are documents adopted by members of the United Nations at conferences seeking to promote integrated and inclusive measures. The Sendai Framework highlights the need to understand the specific local characteristics and to collaborate at various scales and between different sectors. The four priorities defined are understanding risk, strengthening governance, investing in resilience, and increasing preparedness for more effective responses (“Build Back Better”; recovery, rehabilitation, and reconstruction).
In this context, some of the challenges in management are bureaucracy, discontinuity of public policies, and lack of cooperation between stakeholders [3], as well as having to deal with anthropogenic changes, such as environmental degradation and accelerated urbanization [4]. In this scenario, risk analyses have been increasingly recognized as necessary to develop more efficient management [5]. In Brazil, the work of civil defenses against disaster scenarios related to natural phenomena at the municipal level stands out. However, disaster management is more applicable to the country than risk management. The recording of public calamity situations, for example, is quite common, while flood management measures are rarer, even when such phenomena are imminent.
The most used approaches in risk analysis integrate economic, ecological, and engineering aspects. Research should cover economic damage assessment in the case of quantitative studies [6]. Up-to-date and accurate estimates of the potential losses from disasters significantly contribute to understanding risk, implementing mitigation measures, and post-disaster emergency planning [7]. As an internationally accepted standard method for assessing direct damage in urban areas, depth-damage functions are simplified models. When there is no or insufficient data, the transfer and applicability of loss models between different geographic regions are possible but problematic. Therefore, models should only be selected from similar locations [8]. However, recent studies indicate that creating more specific functions based on local data should be done instead of taking models from the literature and different contexts [9]. Local data based on secondary sources could increase the potential of application in other regions. However, even using secondary data, the estimations obtained with the depth-damage curves must have acceptable quality in order to not compromise the risk analysis.
Direct damage estimation is, therefore, an essential and difficult task, the validation of which must be carried out to reduce uncertainties in risk analysis [10]. The functions unique for each type of building are still very scarce in Brazil, especially in an empirical sense. Gaps in damage quantitative analysis include the definition of values and category classification of the exposed items. In addition, developing and updating damage curves is critical for more accurate assessments [11]. In this study, the urban scenario was more accurately represented with a lot-by-lot registration through Google Street View, promoting a classification of construction patterns that directly interfere with damage estimation. This measure allowed the adaptation of depth-damage curves using values of construction costs provided by the civil construction industry unions, which open the possibility of damage estimations in a broader spatial coverage, i.e., in a greater number of municipalities. This study provides an accessible method to conduct risk analysis in regions with lack of flood damage information, contributing to reducing uncertainties in the assessment.
The objective of the study was to propose a framework that refines the development of flood risk analysis on a local scale. The methodology was mainly based on secondary data, seeking to minimize high financial and human resource demand. Additionally, a quantitative analysis of dam implementation influence was carried out to investigate the reduction of flow peaks and, consequently, their contribution to damage mitigation in the residential sector of the municipality where the study was conducted.

2. Study Area

The Una River Basin is located between Pernambuco and Alagoas (Figure 1), in northeastern Brazil, with a total area of 6740.31 km2, containing 42 municipalities entirely, or partially, within its perimeter [12,13]. Regarding the terrain, the altitude varies significantly from one end of the basin to the other. In the eastern region, close to the coast, there is a strip of plain with altitudes below 100 m, and further west, there are higher altitudes, ranging from 800 to 1000 m [13].
Following the terrain profile, other physical characteristics vary in the longitudinal direction. The coastal area is hot and humid, with high rates of rainfall, especially in June, and Atlantic tropical evergreen forests, which have been extensively modified because of the cultivation of sugar cane, mangroves, and palm trees. In the westernmost part of the basin, the vegetation cover is similar to that of a semiarid region, with xerophilic and deciduous species, especially cacti and bromeliads [13].
The precipitation regime tends to have high indices in the mid and lower course, reducing in the river′s upper course. With an area of approximately 2900 km2, the latter has March as the wettest month, with an average annual precipitation between 600 and 800 mm, intermittent flow, and prominent flood peaks with medium recurrence. With approximately 2100 km2, the mid-course registers the most significant events between May and August, with an annual average rainfall of 1500 mm. With approximately 1700 km2, the lower course registers an average yearly rainfall of 2000 mm. It is still possible for rain, originating from atmospheric systems, to reach the entire basin. The large slopes in the local topography also contribute to the high energy flows and the subsequent damage caused to riverside cities [14].
The municipality of Palmares (shown in Figure 1), our main damage analysis area, is within the Una River basin perimeter, a region with a comprehensive history of floods. It has an area of 339.3 km2 and an estimated 63,500 inhabitants in 2020 [15]. Palmares stands out for its strategic location, close to capital cities and important inland cities. With a solid commercial and service sector, one of its main economic activities is the sugar industry.
In 2010, the Una River basin experienced the largest hydrological events ever recorded. On 17 June, a weather phenomenon called the “Easterly Wave” arrived in Pernambuco, intensified by the Atlantic Ocean temperature and strong trade winds. This combination resulted in a large concentration of rain in a short period and, consequently, in flood waves in the Una River basin. The precipitation of one day was equivalent to 70% of what was expected for the entire month. The flood event affected 67 cities in Pernambuco state and 19 in Alagoas state, with approximately 280,000 people affected and 79 deaths. In total, 102,420 people were displaced. In addition, 14,136 houses, 403 schools, 4478 km of roads, 142 bridges, two state hospitals, 85 health posts, and four municipal hospitals were damaged or destroyed. Furthermore, 27 municipalities declared a state of emergency and 17 declared calamity [16,17,18,19].
The 2010 flood event motivated the development of several preventive measures, such as the Serro Azul Dam (see Figure 1). Located in the municipality of Palmares, its construction dates back to 2017, and its drainage area covers 3299 km2. With a damming capacity of 303 million cubic meter, the dam can still regulate a flow of 850 L/s for other uses, including human supply, irrigation, leisure, and fishing [20].

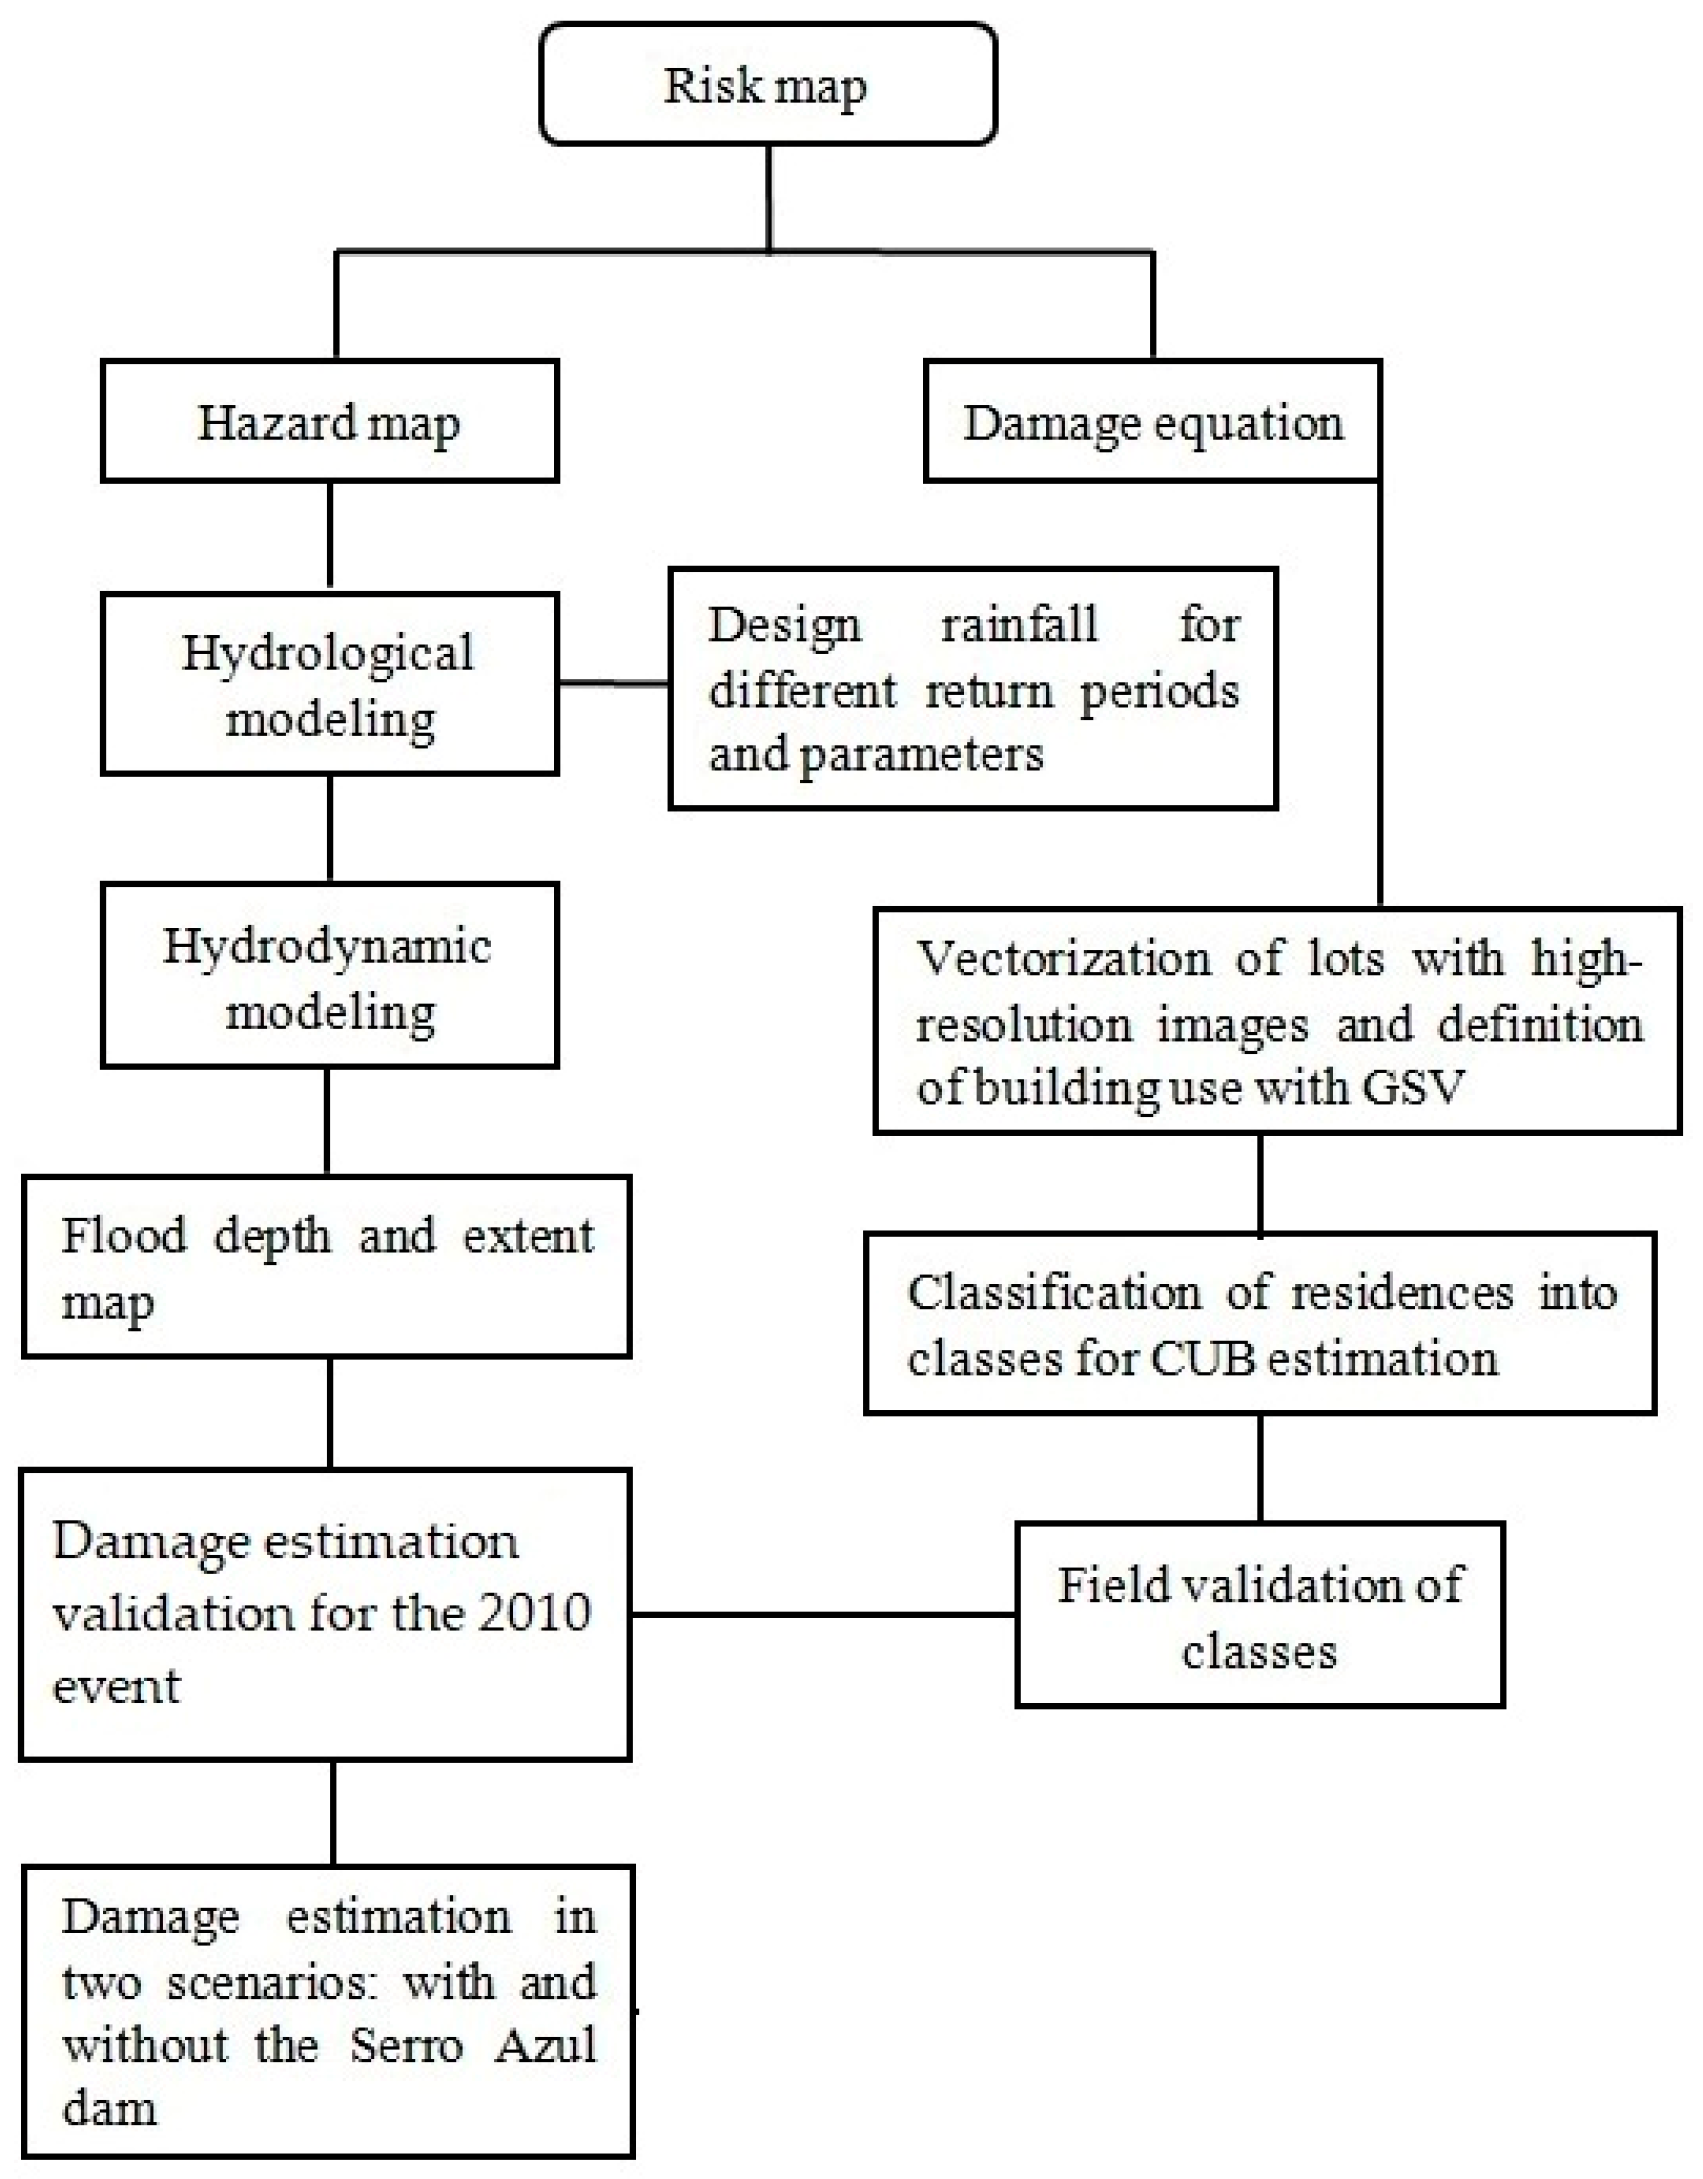
3. Materials and Methods

Synthesis, a relevant element in scientific work, is associated with locating, sorting, evaluating, and combining information. It can usually be achieved through transparent, reproducible, and organized procedures for summarizing such information [21]. This study is comprised of hydrological and hydrodynamic simulations, damage estimation, and risk map generation. Figure 2 shows the steps required to achieve these goals.

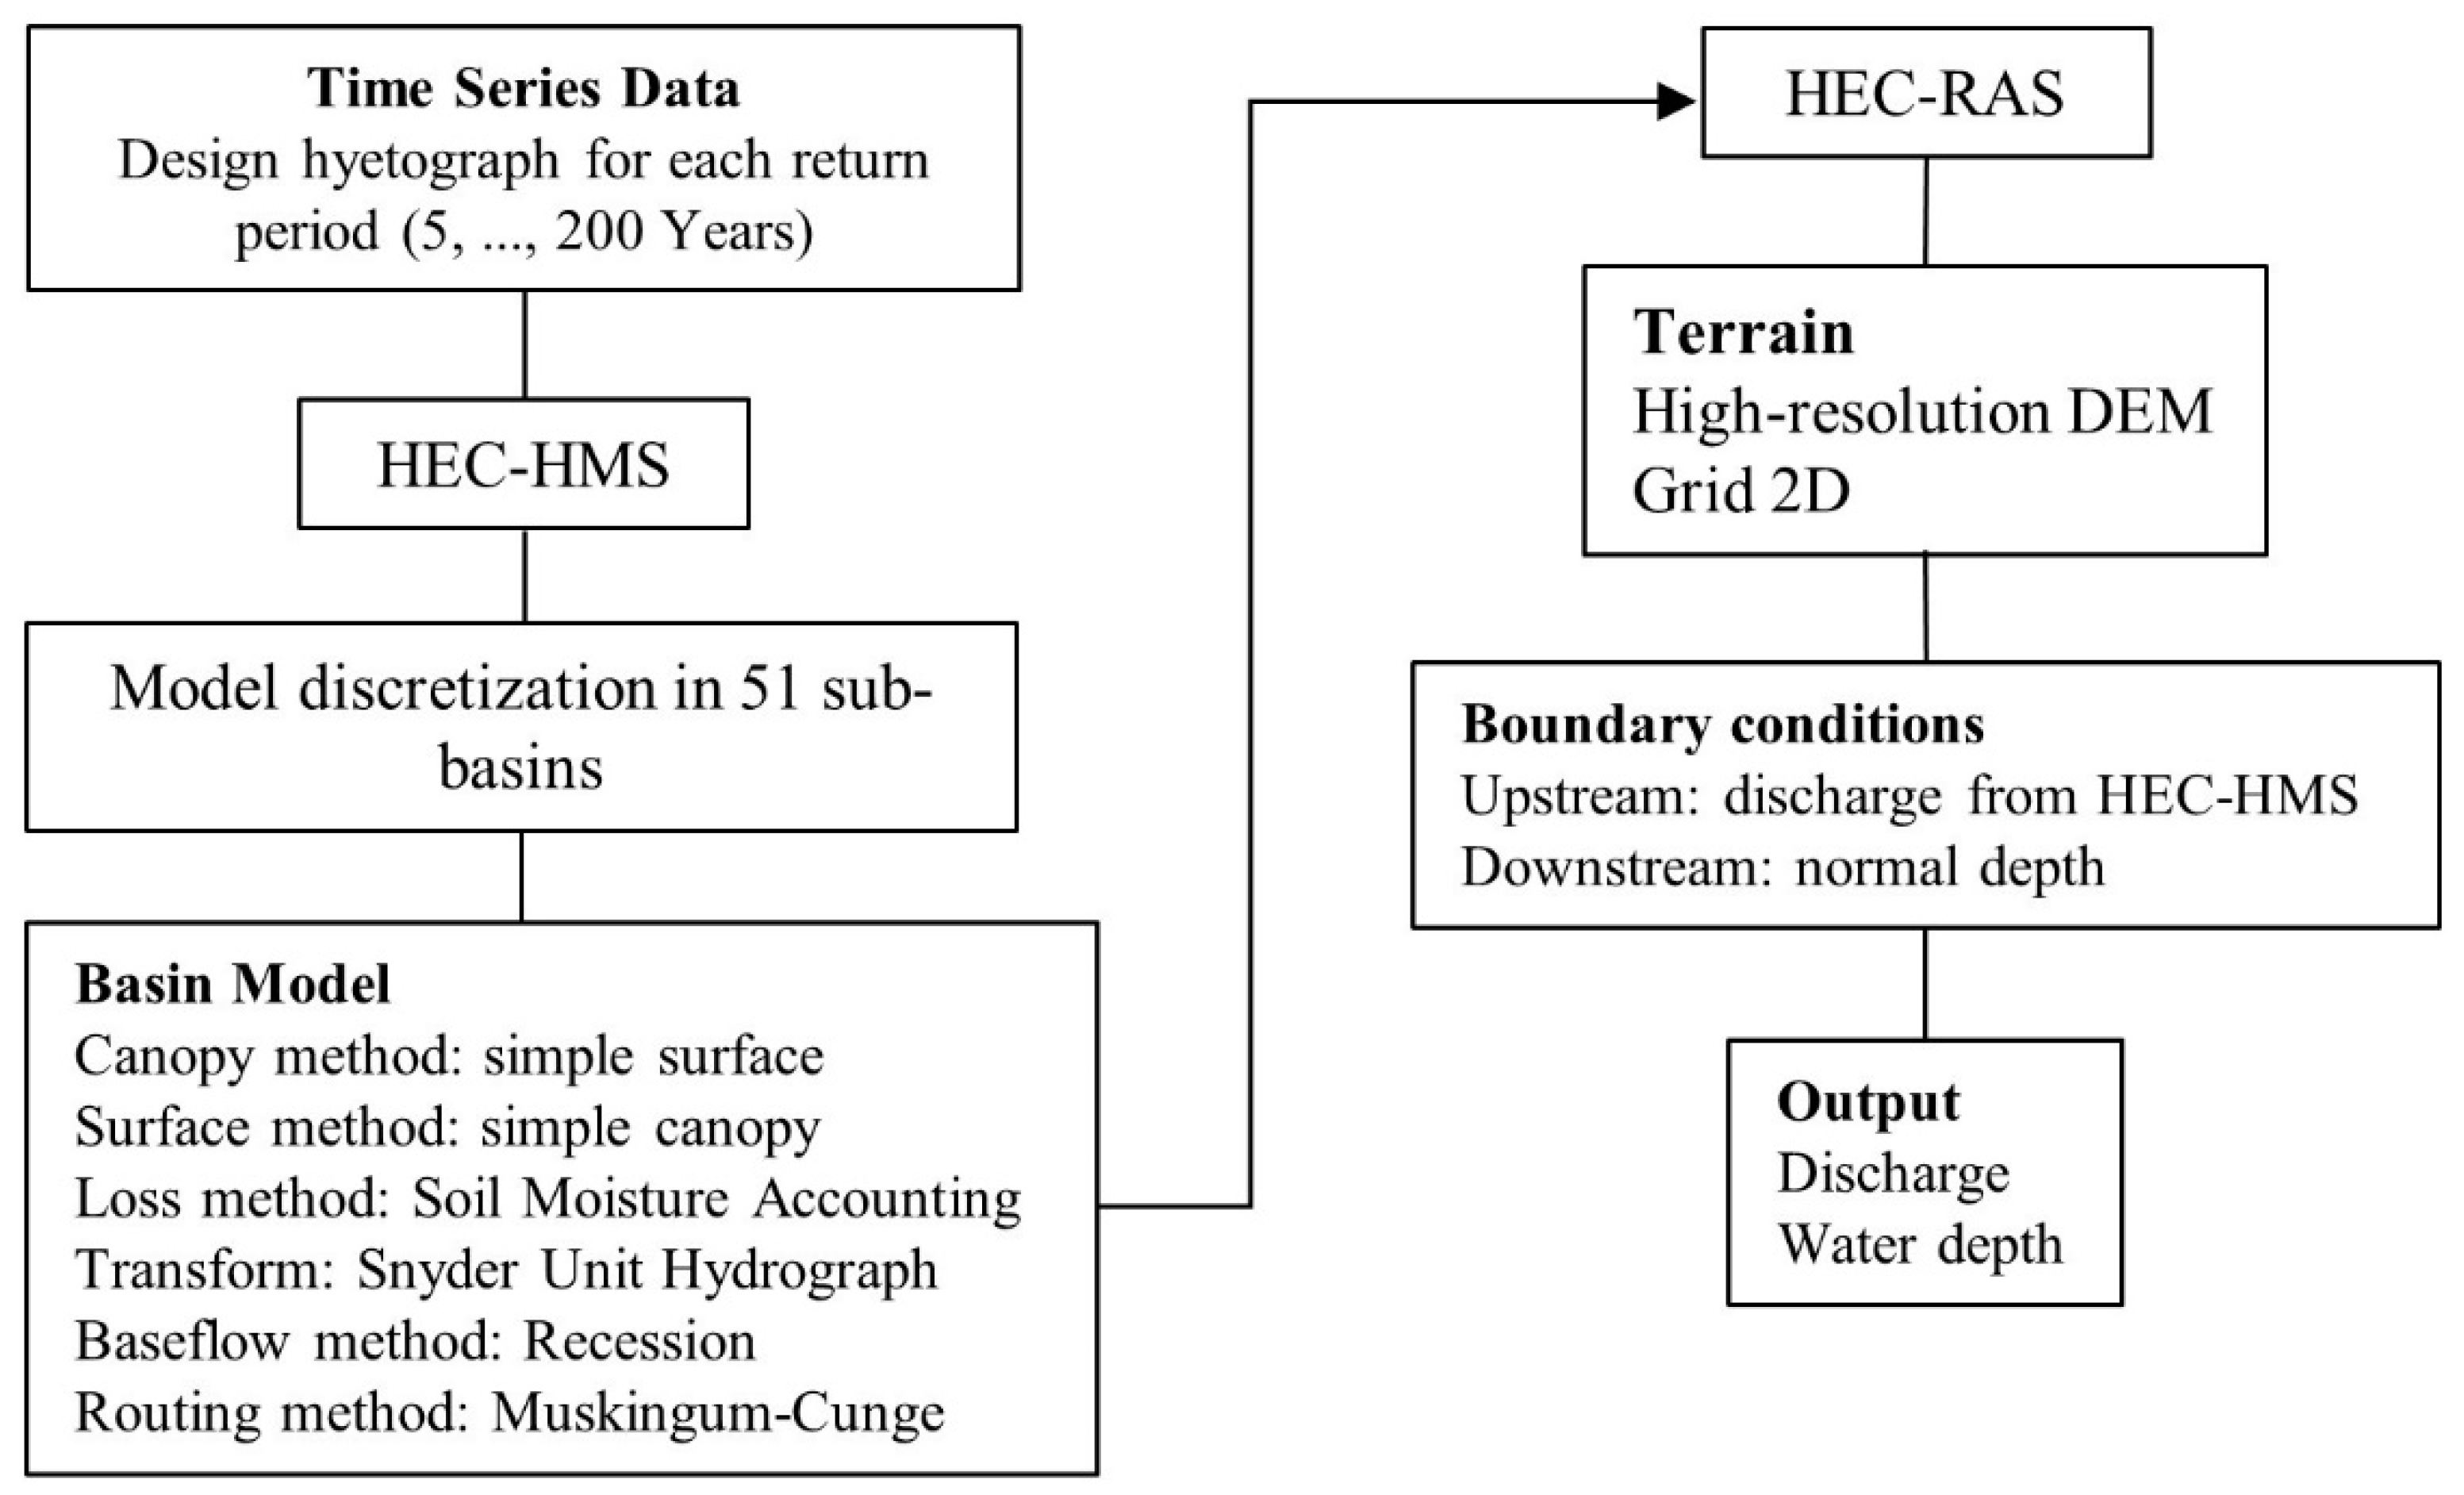
3.1. Hydrological and Hydrodynamic Modeling

Technological advances have expanded the possibilities regarding modeling. There are several models currently available. Li et al. (2019) [22] proposed a coupled model called TPMF from the TOPMODEL and MIKEFLOOD models, in a study applied in China. TOPMODEL is a semi-distributed top hydrological model and MIKEFLOOD is a hydrodynamic model that simulates 1D flow for channels and 2D flow for floodplains. In this specific work, a 1D–2D coupled model was used to simulate flood events. Another software is the European LISFLOOD, a physical and distributed hydrological model created for flood prediction and for the analysis of climate change in transnational basins. Gai et al. (2019) [23] applied this model in a study developed in China. The authors highlighted LISFLOOD as an appropriate hydrological model for water resources management planning at the basin scale.
In this study, the floodplains were simulated using the Hydrologic Engineering Center (HEC) models from the US Army Corps of Engineers. HEC models are free, have wide applicability, constant updates and technical support. The Hydrologic Modeling System (HEC-HMS) has the versatility to set up a simulation scheme according to the region′s characteristics and data availability. Other applications of these software can be found in Devi et al. (2019) [24], with projections of future scenarios, in Nharo et al. (2019) [25], with flood mapping even in the face of scarcity of data, and in Ribeiro Neto et al. (2015) [14], with analysis of the spatial and temporal variation of floods. As in Hadimlioglu et al. (2020) [26], a 2D model was sought to better represent the flow dynamics, and the progression of the flood, spatially and temporally. Another relevant aspect was the easy connectivity with Geographic Information Systems, both for pre- and post-processing. The model was set up for this application, as shown in Figure 3.
The river analysis system (HEC-RAS) model simulates the routing flow of rivers and canals. The scheme defined for this study considered the streamflow simulated with the HEC-HMS as input in the HEC-RAS model (upstream boundary condition), as shown in Figure 3, and the normal depth for the downstream boundary condition. The calculation of the normal depth requires the energy slope, but can be replaced by the bottom channel slope, as carried out in this study. The 2D version used in the simulations has an algorithm of solution based on finite volume that can handle different flow regimes with more accuracy, facilitating the modeling of steep rivers. This study used version 5.0.7 of the HEC-RAS, which calculates unsteady flow using the complete Saint Venant equations [27]. The 2D grid was created by defining a polygon that covered the entire region of interest (the urban area of the city of Palmares). Additional information helped in the delineation process, including the digital elevation model (DEM) and the image of the RAS Mapper (interface for geospatial data processing and visualization). The DEM had a spatial resolution of 1 m and accuracy of 25 cm.
The Serro Azul reservoir was represented in the HEC-HMS with the aim of simulating the effect of flood control. The geometry and dimensions of the hydraulic devices were informed in the HEC-HMS model, resulting in the output discharge calculated upstream of the Palmares with, and without, the reservoir. Details about parameter estimation and the calibration process of the models in the Una River basin have been described in previous studies [14,28]. The models satisfactorily represented the rainfall-runoff processes and the streamflow routing, providing the required information for the risk analysis.
The alternating block method [29] calculated the design storm hyetograph needed to simulate flood events for different return periods. The application of this method requires an intensity-duration-frequency (idf) curve, the specification of the return period, and the total duration of precipitation. Two idf curves, corresponding to two stations located in the municipalities of Palmares (Equation (1)) and São Benedito do Sul (Equation (2)), were used to represent extreme precipitation in the Una River basin [30]. The station at Palmares had a time series of 83 years (1934–2016) and São Benedito do Sul 25 years (1993–2017). The maximum precipitation data was fitted to the Gumbel probability density function and its adherence was verified using the Kolmogorov-Smirnov test with significance level of 5%. Figure 1 shows the region of influence of each idf equation used to calculate the design storm in the sub-basins for six return periods (5, 10, 25, 50, 100, and 200 years). Finally, the duration of the hyetographs was defined as twice the concentration time of the sub-basin. The Kirpich method, based on the length of the longest river and the elevation difference between the farthest point of the longest river and its mouth, was used to estimate the concentration time.
Palmares :   i = 901.23 · T 0.1810 ( t + 11.83 ) 0.7704
S ã o   Benedito   do   Sul :   i = 893.59 · T 0.2017 ( t + 11.83 ) 0.7704
where i is the intensity of the precipitation (mm·h−1), T is the return period in years, and t is the duration of the precipitation in minutes.
The HEC-HMS simulation was compared to the maximum streamflow obtained by Dantas [17] using a daily time series of 39 years at the Palmares stream gauge station (shown in Figure 1). The annual maximum streamflow series fit the generalized extreme value distribution, which allowed the discharge calculation for the six return periods (5, 10, 25, 50, 100, and 200 years).

3.2. Damage Analysis

Vulnerability, intrinsically linked to the exposed community and its respective demographic conditions, is often classified as damage resulting from flooding, especially in the case of quantitative analysis [31]. If model validation is already difficult for a hazard analysis because of the lack of data, it is much harder for a damage analysis. The absence of validation data is a common problem, resulting mainly from high financial and human demands. However, a standardized, reliable, comparable, and consistent database is essential to study the behavior, variability, and, consequently, the relationship between damage and the characteristics of extreme events [10]. Thus, the initial idea was to develop criteria for estimating damage at a local scale, based mostly on secondary data.

3.2.1. Components of Risk

Hazard indicators characterize extreme events and influence the damage caused by floods. Depth, velocity, and energy are examples of indicators summarized by Kreibich et al. [32] and Ribeiro Neto et al. [33]. In this study, water depth and extent were used to estimate the damage associated with the structural aspects of residential buildings. Exposure and vulnerability are the other two components of risk. The demographic conditions of the community influence vulnerability, and it is estimated as a function of flood damage. Depth-damage curves are the most used method, where it is possible to assess damage according to the water depth reached in the flood event. When the return period of the event is known, the depth-damage curves can become probability-damage curves, which is the engineering flood risk [34].
Penning-Rowsell and Chatterton [35] proposed a damage classification for structural and content losses. Through discussions with contractors and architectural personnel, structural damages were defined, resulting in a relationship between water depth and loss as a percentage of a dwelling′s value. The content losses were estimated based on the depreciation value of the furniture from current prices. Many studies conducted in several countries have adopted this concept [34,36,37]. For example, in Brazil, the relationship between water depth and the percentage of damaged buildings was estimated by Salgado [38]. Equation (3) summarizes the damage to buildings [39].
CRE = 0.50 × CUB × PED × AIC
  • CRE—cost of damages to buildings
  • CUB—basic unit cost of construction
  • PED—percentage of damaged building
  • AIC—inundated built area (m2)
The damage analysis was based on a standard single-family dwelling, adopting the Brazilian Standard NBR 12721/2005 and the CUB to characterize the buildings. The NBR 12721/2005 defines standard designs for different types of buildings (e.g., houses, buildings, and sheds) and uses (residential, commercial, and service). The CUB calculation method, which considers the cost per square meter for each type and use, is provided monthly by the unions of civil construction industry in all Brazilian states. The values used in this study are presented in Table 1.
Some elements used to categorize the dwellings are the composition of the building (rooms and their quantity), number of floors, specifications of finishing, and building area. The Supplementary Material describes the classes in Table 1 according to NBR 12721/2005. In Equation (3), the CUB is adjusted by a physical depreciation factor of 50%.
The PED is determined for intervals of water depth and calculated based on the standard designs and an index of quantification of the damage extension supported by specialists in civil construction [39]. The damages are calculated for depths greater than 0.50 m because, in general, buildings have a base above the curb. Table 2 lists the PED values as a function of the standard designs and classes of depth. The inundated built area (AIC) was calculated by intersecting the vectorized lots with the flooded area calculated by the HEC-RAS.
The analysis included an estimation of inventory, that is, the contents of a building. The value used was from a report on losses and damages resulting from the 2010 event prepared by the World Bank with support from the Pernambuco government [40]. The value was corrected for January 2021, considering the inflation of the period, and corresponded to the complete furniture of the housing unit. Assuming that the estimation of the World Bank considers an intermediate residential class, the values of the items refer to the standard design R1-N. Other personal items not listed were considered to add 15% to the final deal. A factor is multiplied by the values corresponding to class R1-N to estimate the inventory for other standard design classes (listed in the Supplementary Material). Equation (4) summarizes the inventory calculations [39]:
CRC = (0.5 × CCIP × Fm) × AIC/AIP
  • CRC—Damage costs for the contents of a building
  • CCIP—Damage costs of a standard design
  • AIP—Area of the standard design R1-N (m2)
  • Fm—Multiplier factor (values in the Supplementary Material)

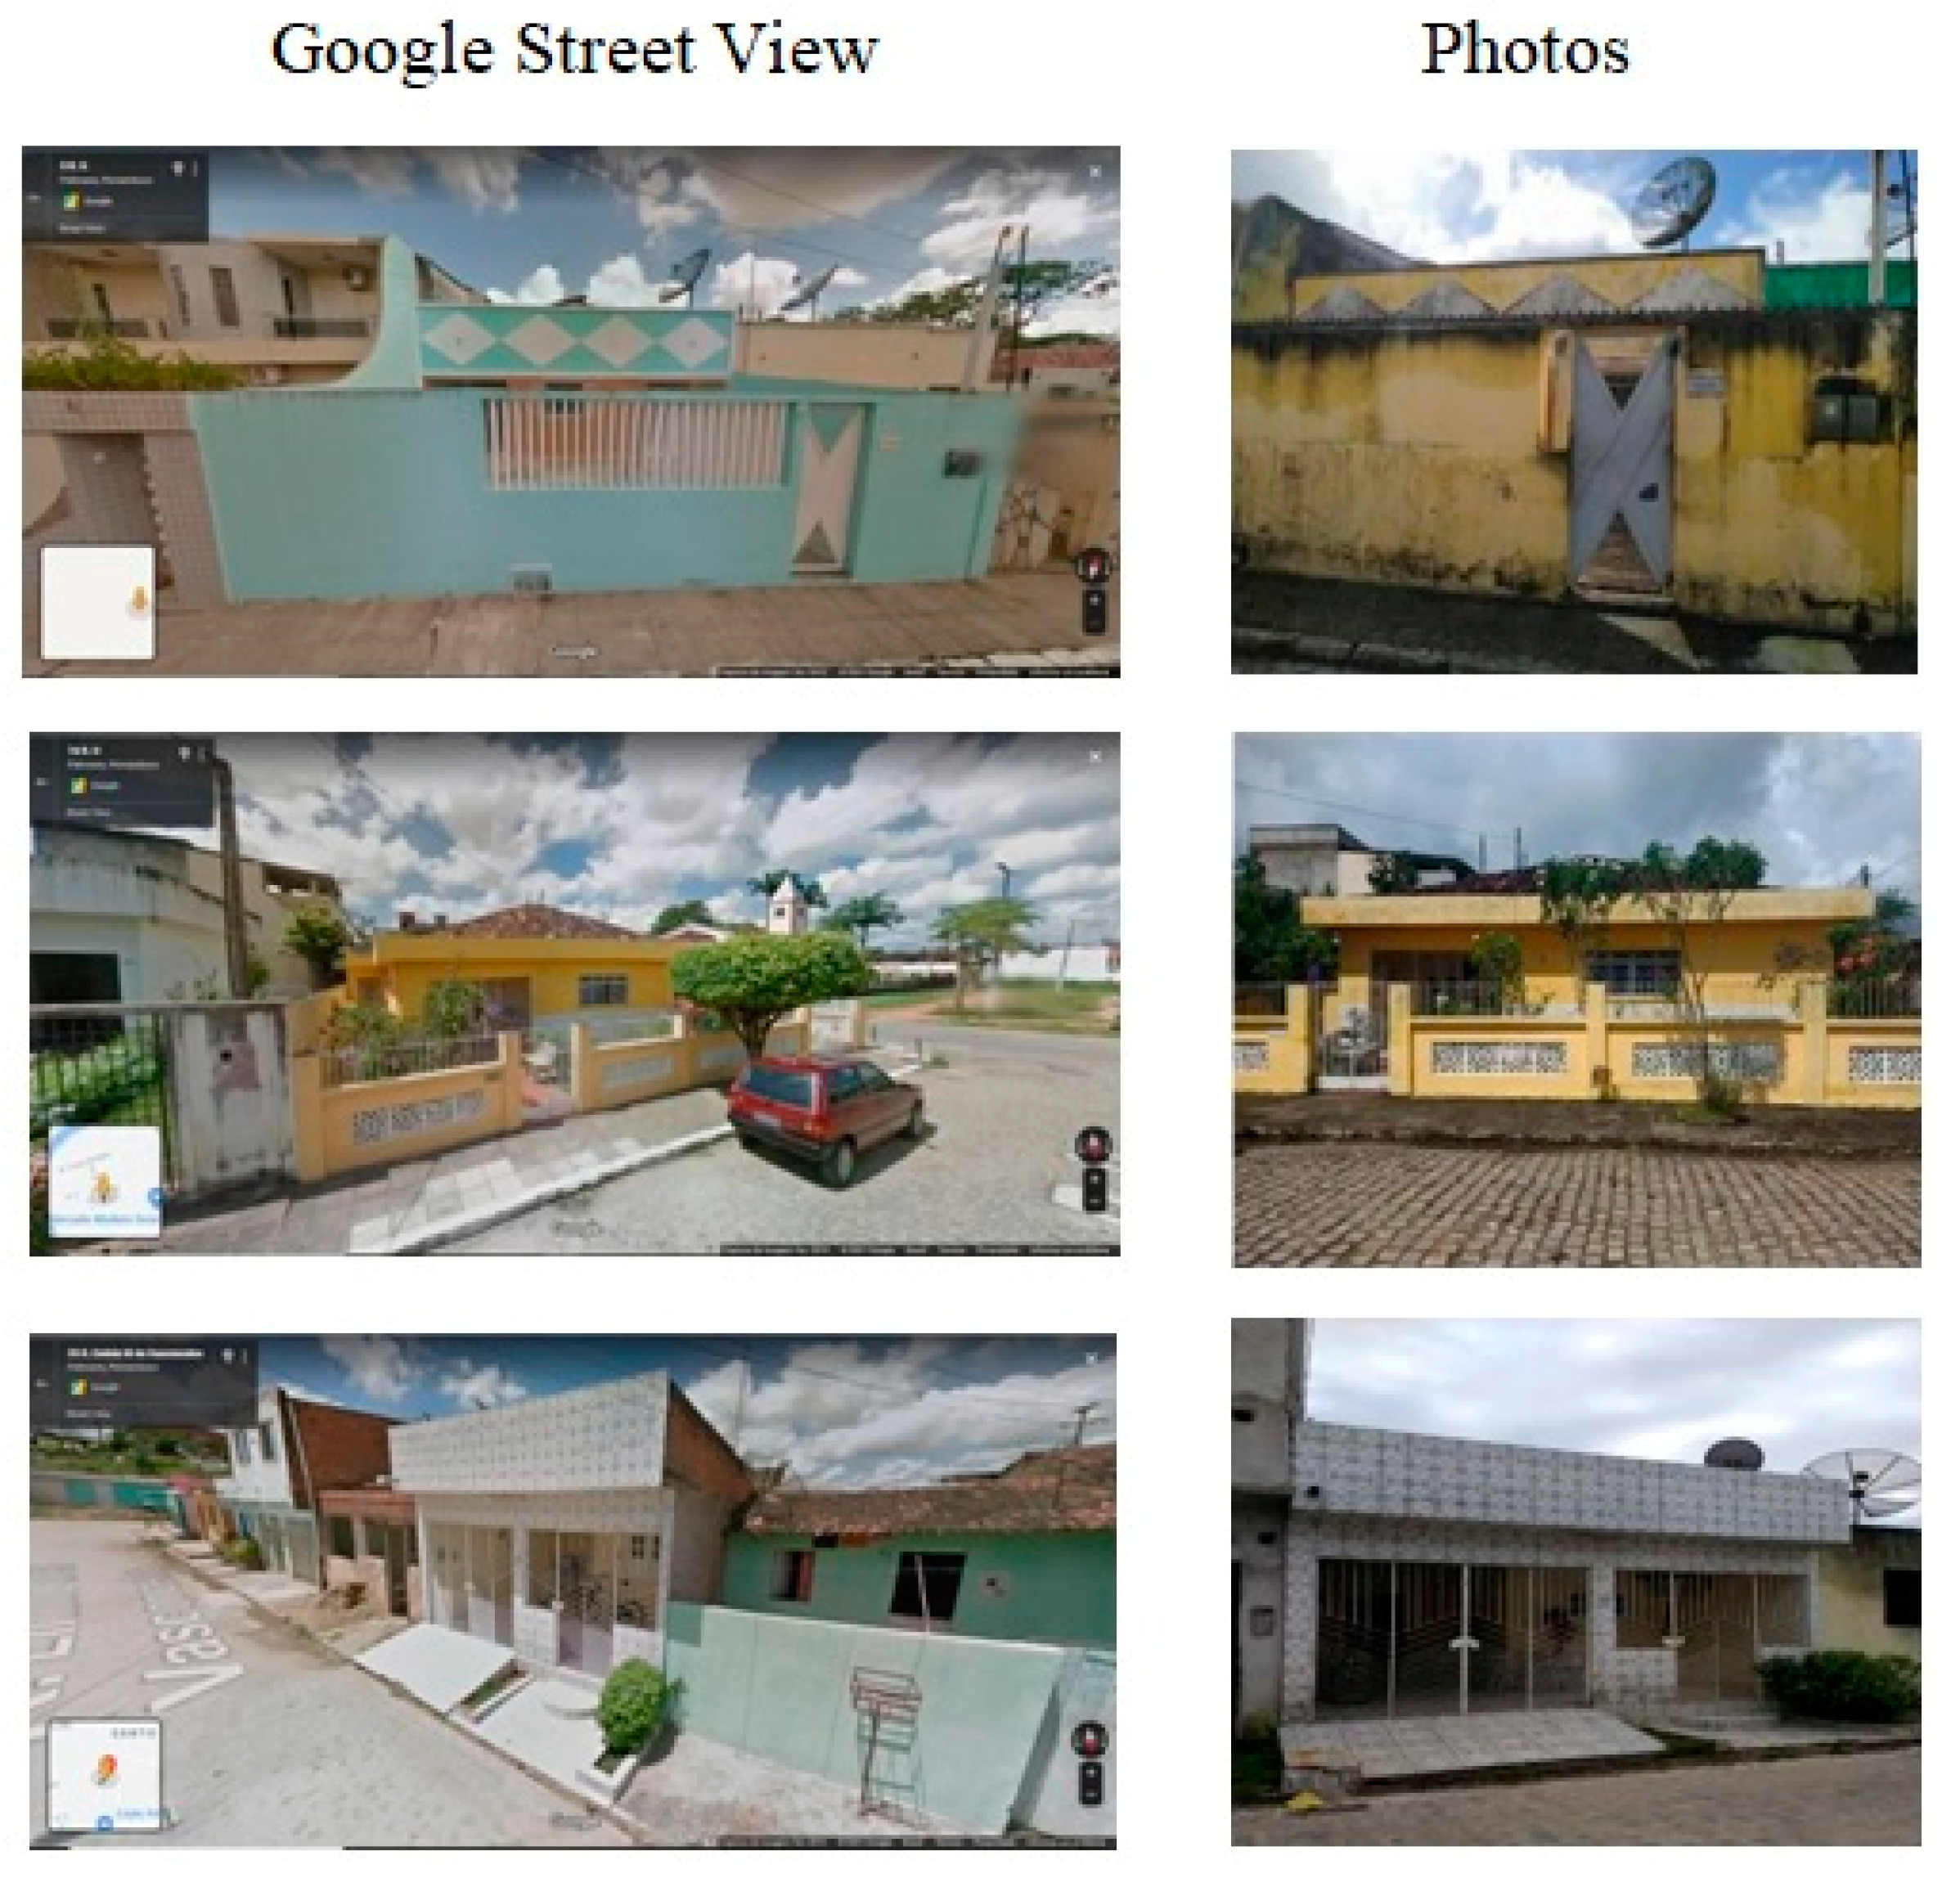
3.2.2. Buildings Dataset

All lots comprising the urban area affected by floods in Palmares were vectorized manually, taking as base map a high-resolution image from an aerial survey with spatial resolution of 20 cm and accuracy of 25 cm. In ArcGIS/ESRI, besides the calculation of the area of the lots, the vectors were associated with information (street name, building number, type, use, number of floors, roof area, and standard design), creating a georeferenced database. In addition, Google Street View, an application that provides panoramic views on the ground level, allowed the visualization of the frontage of the buildings. In Palmares, panorama photos were taken in 2012, two years before the high-resolution images.
According to Brazilian regulations, identifying each house building pattern is essential for damage estimation. Thus, the first parameter used was the built area of each lot (m2) calculated in a GIS environment. Subsequently, field visits were carried out, and a second classifying element was surveyed for validation, which was the identification and number of rooms in each visited residence. This information was then used to define the thresholds of area of the lots corresponding to each standard design. Field visits were conducted between July and August 2019. With 150 interviews in total, the sample had a confidence level of 90% and a margin of error of 6.46%. Data collection was performed with the support of the Android DataScope app, a collaborative platform that allows the creation and sharing of forms, in addition to offline data acquisition. The app also allowed the taking of photographs and exporting of the results in a CSV file.
The questionnaires aimed to validate residential pattern classes. We considered selecting houses to visit, keeping a balanced number of samples for each category. However, difficulties that were encountered, such as residents′ absence or refusal to answer, led us to select houses randomly. In addition, a different area of the city was covered in each visit to represent differences in urban morphology.

4. Results

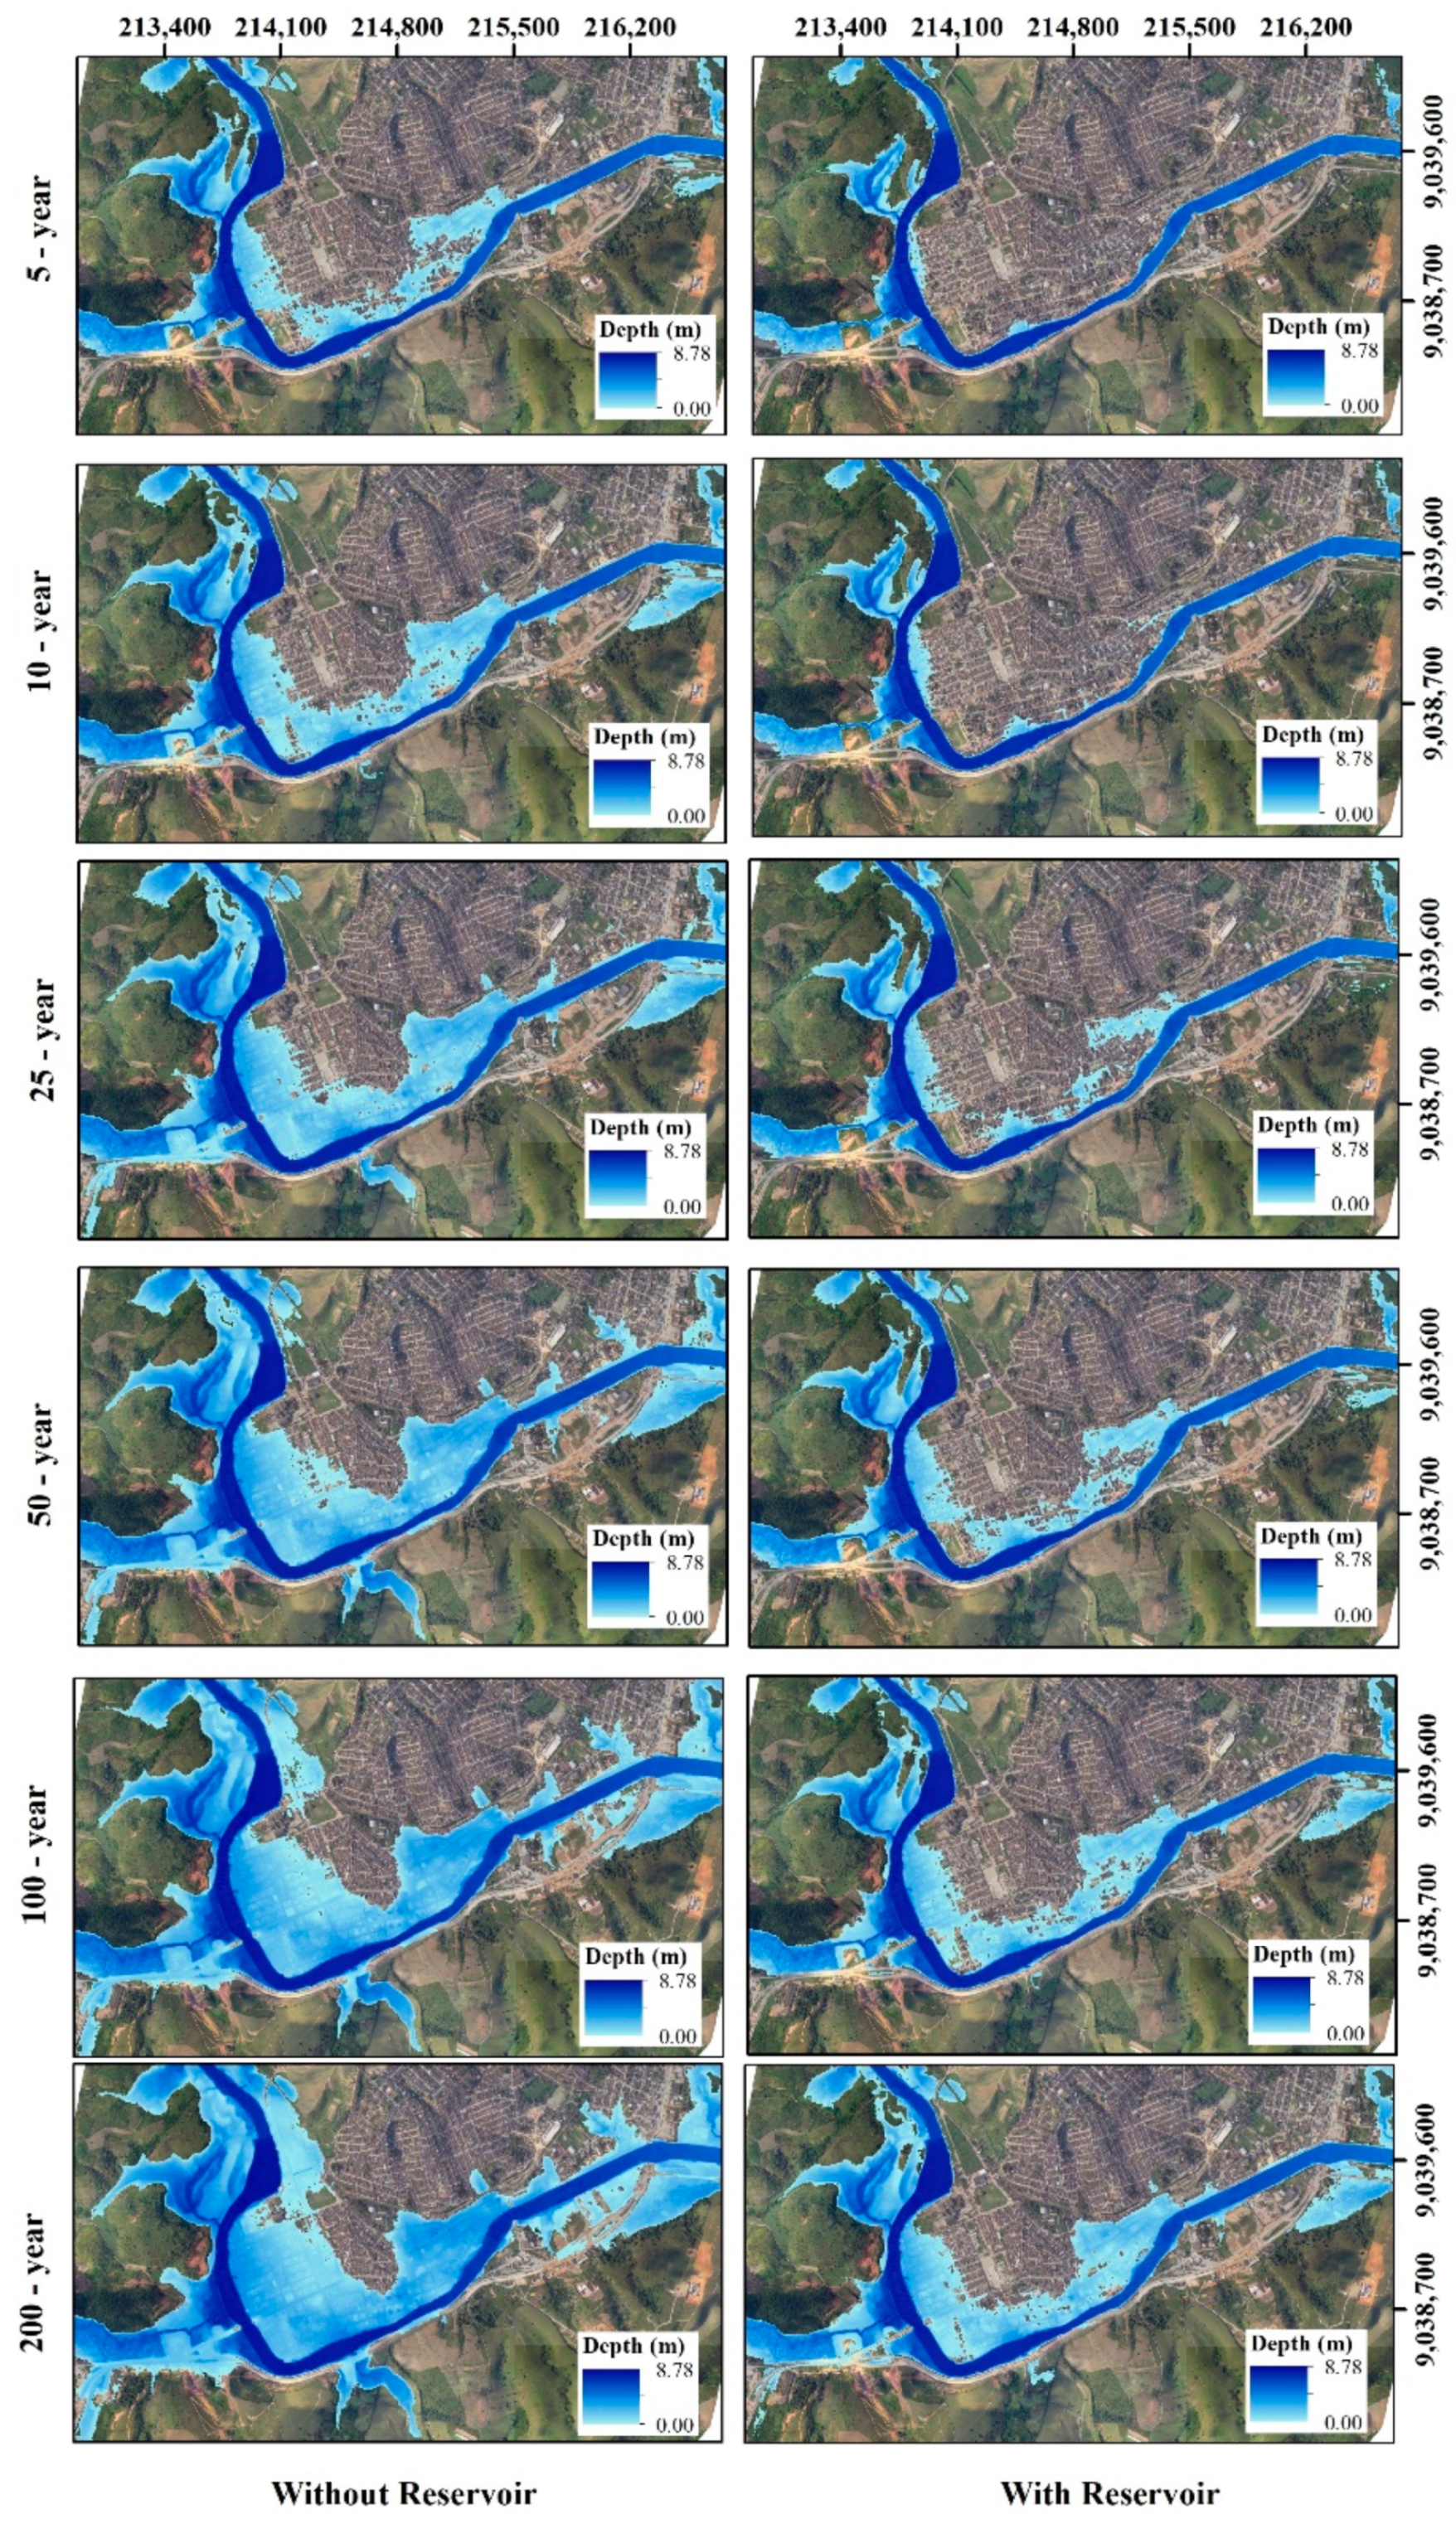
4.1. Flood Simulation

The first tests with the HEC-HMS had streamflow overestimation at the Palmares station, probably due to the use of the same return period for all sub-basins. The alternative was to apply the tool flow ratio available in the HEC-HMS. The flow ratio allows the user to control the flow in the sub-basins, defining a factor that regulates the hydrograph, by multiplying the factor by each ordinate.
The main characteristics of the hydrodynamic model were a computational grid with cells measuring 40 m, a simulation time step of 1 min, an output time step of 30 min, and a Manning roughness coefficient of 0.035. After some tests, the best value was found for the flow ratio (0.25), resulting in the discharges listed in Table 3 (with and without application of the flow ratio). The HEC-RAS simulation tended to produce a more significant discharge reduction because of the flow routing processes represented in the hydrodynamic model.
Simulations for different conditions were performed to test the sensitivity of 2D modeling in HEC-RAS. The analyzed parameters were the size of the 2D mesh cells, the Manning coefficient, and the use of break lines. The latter is a model device that forces the mesh cells to align and control the flow direction. Break lines can be used along any higher ground, levees, roads, or even the entire length of the banks of the main channel [41]. The values initially adopted for the mesh and the roughness coefficient were obtained from previous studies for the same region [14,18,42] and later compared to other extreme values. The tests were performed with three meshes formed by regular squares (15, 40, and 75 m), three values for the Manning coefficient (0.035, 0.06, 0.1), and the insertion or absence of break lines. The mesh size did not significantly influence the results, but it contributed substantially to the simulation time. The 15 × 15 m cell grid calculations required approximately 7 h and showed small instabilities at the end of the simulated hydrograph. The 40 × 40 m mesh took between 15 and 20 min, and the 75 × 75 m mesh took an average of 5 min to complete the simulations. Neither the different Manning values nor the break lines significantly interfered with the simulation results. Similarly, studies analyzing the performance of 2D modeling with HEC-RAS reached the same conclusion as Ongdas et al. [43].
Incorporating the Serro Azul reservoir in simulations produced discharge reductions that varied from 45.4% to 55% in HEC-HMS and from 43.5% to 54.6% in HEC-RAS. This reduction was directly proportional to the return periods, with the 200-year simulation presenting the most significant reduction percentage. Figure 4 illustrates the evolution of the water extent, considering all return periods with, and without, the effect of the Serro Azul reservoir.

4.2. Damage Estimation

Based on the limits of the flood extension registered in previous events (e.g., 2000, 2010, and 2017), the blocks and lots situated inside the inundation perimeter were vectorized (see Figure 5). There were 2733 buildings, of which 1852 were residential, 247 commercial, 185 mixed, 173 services, 86 abandoned, and 190 non-identified. Based on the field information, the buildings were classified according to Table S1 and then compared to the roof area, establishing the relation proposed in Table 4.
For the city of Palmares, the time difference between the surveyed images provided by Google Street View (2012) and the scene captured in the field survey (2019) did not show significant differences, with the largest difference being the painting of frontage (Figure 6). The standard design classification was based on the roof area of vectorized lots and the list of rooms in each residence. According to Brazilian regulations, these are also two of the most prominent elements in the differentiation of each pattern [44]. Standards also use finishing items; however, they showed less relevance for classification and were more inaccessible.
The built area was vital for classification, as it was easily affordable information, gained mainly through remote sensing. Among all the parameters present in the dataset, the built-up area stood out as the most relevant in the damage calculation. Google Street View, in turn, proved to be a very viable tool for carrying out analysis of this type, especially in the context of scarcity of financial, human, and data resources. Arrighi et al. [9] reinforced this idea, highlighting the surface area of the affected buildings as the first metric in the exposure analysis, in the case of their research, which was also carried out in a GIS environment at the lot scale. The number of floors is another parameter mentioned. Google Street View was the tool chosen to gather information and fill in the attribute table, which proved extremely effective.
Approximately 45% of the vectorized dwellings were in class R1-B, more basic homes with two bedrooms, a living room, a bathroom, a kitchen, and an area for a tank. Almost 34% of the houses were in the R1-N class, 12% in the RP1Q class, only 5% in the R1-A-class, and 4% were unidentified. There was also a predominance of type R1-A and R1-N residences in flatter parts of the city, planned neighborhoods with greater infrastructure and space. Standard R1-B and RP1Q dwellings, on the other hand, were primarily in areas with greater density, where the city design is more organic, such as on the banks of the river.
The World Bank [40] study estimated the damages caused by the 2010 flood event, which totaled BRL 3.4 billion in Pernambuco state (4% of the state′s GDP, 60% corresponding to direct costs, and 40% to indirect costs). Residential buildings registered a cost of BRL 10,250.00 per unit. Considering the 1852 residential buildings vectorized, the damage due to dwellings would be BRL 18,983,000 according to the World Bank [40] information. Applying Equations (1) and (2), the thresholds of Table 4, and the values of CUB, the damage estimation was BRL 15,292,572.56. These values demonstrated coherence in the developed methodology.

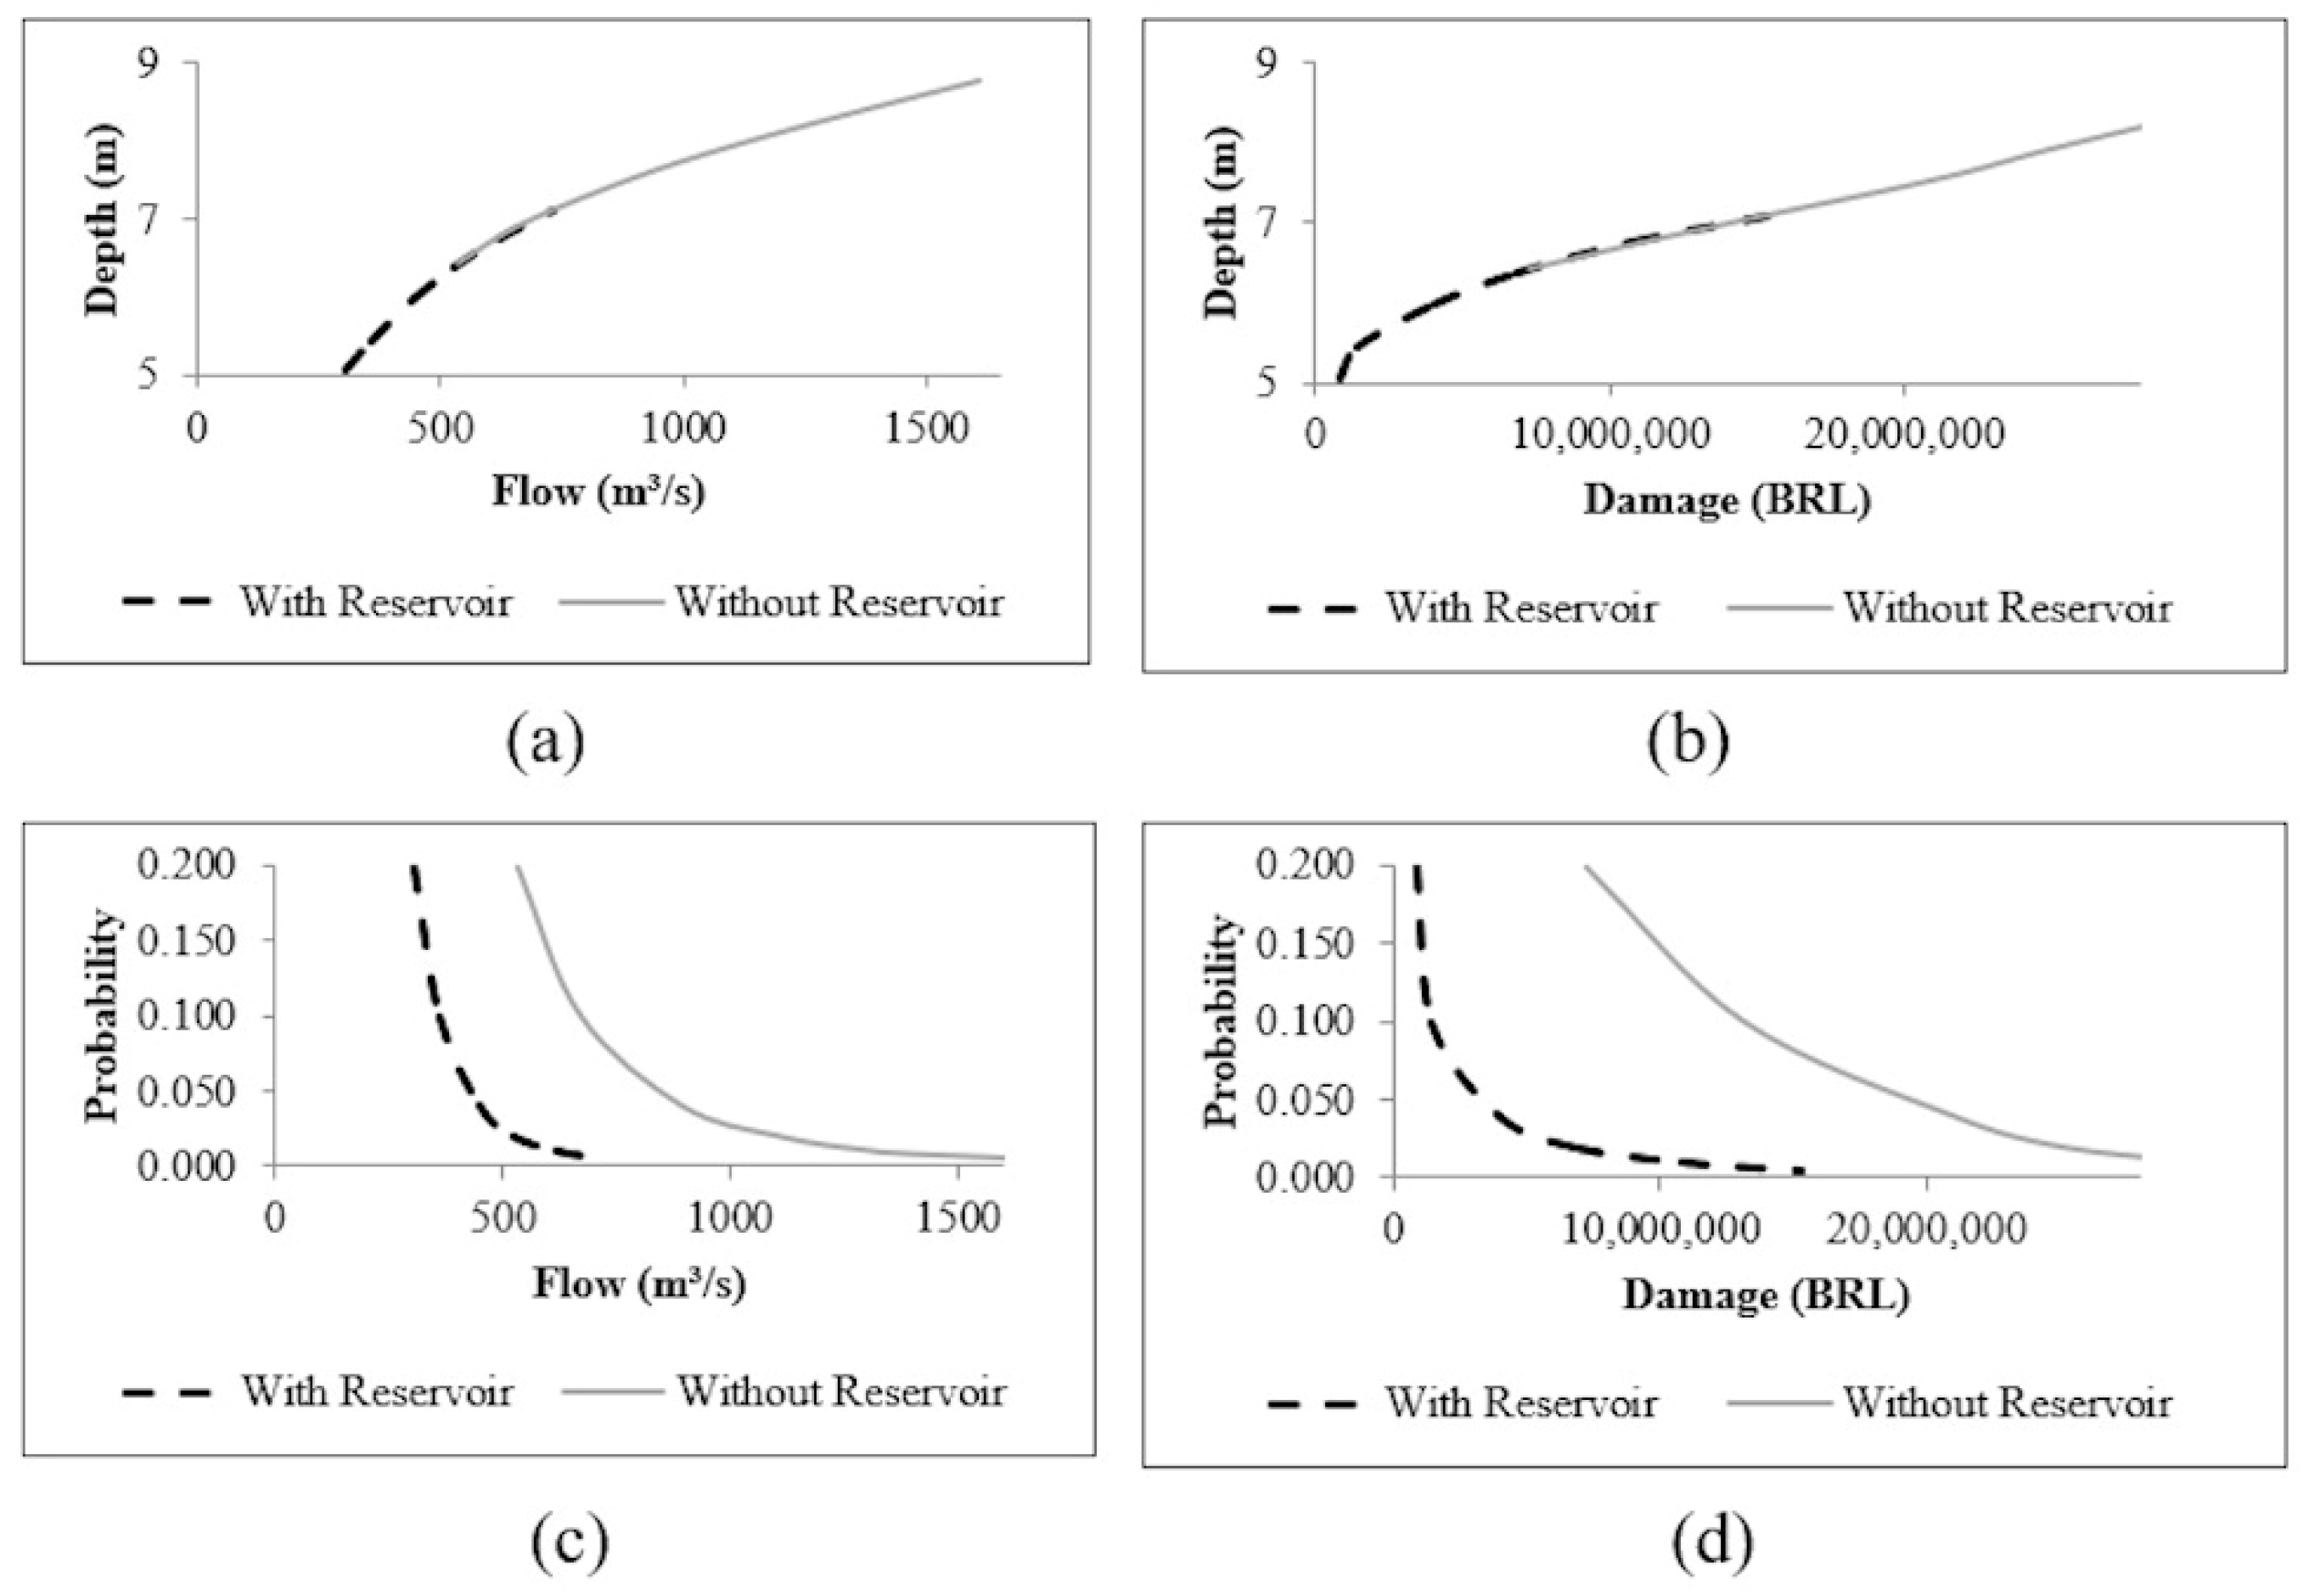
4.3. Risk Curve for Estimation of Benefits

The analysis of flood control measures must consider the probability of events and avoid overestimating the benefits [34]. The probability of an event with the respective damage allows building damage-probability curves (also called risk curves) to be developed, whose integral is the expected annual damage. The sequence of graphs in Figure 7 illustrates the damage estimation for each return period at Palmares. Given the streamflow, the depth was estimated (Figure 7a); then, for the same depth, the damage was calculated using Equations (1) and (2) (Figure 7b). The graph in Figure 7c shows the calculated probability associated with the streamflow, and the combination of the probability (Figure 7c) and the damage (Figure 7b) results in the relation shown in Figure 7d. The benefits of the control measures could be estimated by subtracting the areas under the curves in Figure 7d.
In the graphs of Figure 7, the solid line represents the scenario before the construction of the Serro Azul dam. In contrast, the dashed line corresponds to the conditions after the insertion of the dam. Before the dam, the calculated water depth values ranged from 6.42 to 8.78 m with a flow varying from 535 to 1606 m3/s. The depths lowered after installing the dam, varying between 5.05 and 7.10 m, with flows from 302 to 730 m3/s.
The construction of the Serro Azul reservoir led to a significant damage reduction according to the simulations of the return periods. Table 5 lists the damage caused by the return period, considering simulations with, and without, the Serro Azul reservoir. The total reduction, including structure and inventory, was 88.0%, 86.7%, 76.6%, 67.5%, 59.4%, and 51.7% for 5, 10, 25, 50, 100, and 200 years, respectively, revealing an inverse relationship between the percentage of reduction and the frequency of flood events. The annual benefits given by the Serro Azul reservoir would be BRL 3.5 million, considering only the residential sector. The global benefit certainly increased when considering other cities located downstream and other sectors, such as services and commerce.

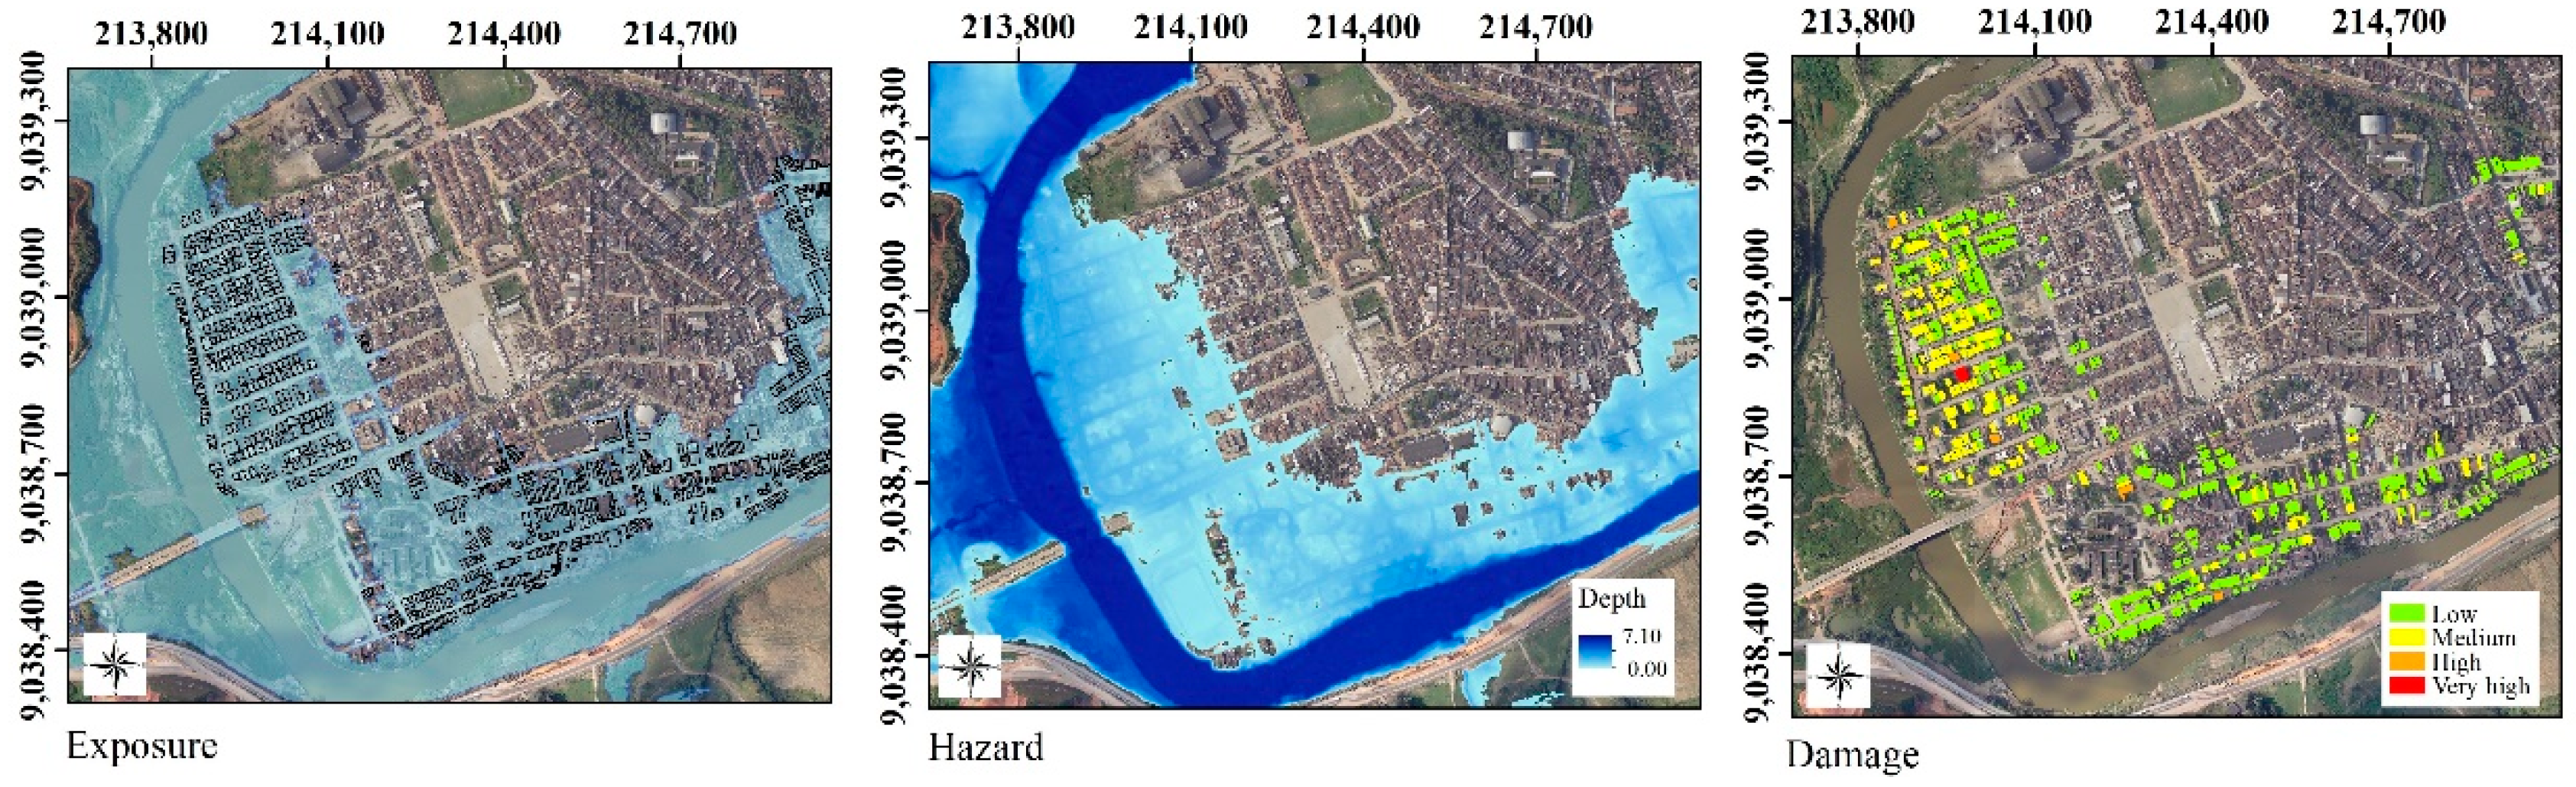
4.4. Maps of Risk Elements

The most significant hazard was concentrated in the channel and its immediate vicinity in all simulated scenarios, as in Amarnath et al. [45]. Similar to Andrade and Szlafsztein [46], exposure was presented here as flood extents, identified by the elements within the events′ scopes (Figure 8). The classes of damage in Figure 8 were used for the quartiles of the monetary values: low (0–25%), medium (25–50%), high (50–70%), and very high (75–100%). Damage analysis and the exposure of buildings for each event were evaluated through overlapping floodplains and built elements, as in Tincu et al. [47]. For the events of 5, 10, 25, 50, 100, and 200 years, 210, 343, 758, 1080, 1286, and 1431 exposed buildings were identified, respectively. In engineering, risk can be interpreted by studying different events, magnitudes, and respective damages. Thus, the values forming the constructed probability-damage curves were presented in a spatially distributed manner.
When considering the social dimension of vulnerability, the characteristics related to the society under study cannot be neglected. In the case of residences, for example, income and family education level are some of the factors that will influence their quality and, consequently, their response to extreme phenomena. Poorer families are likely to have more fragile housing than those with a better income (GOERL et al., 2012) [48]. This scenario was confirmed in the study area.
When analyzing indicators from the Brazilian Institute of Geography and Statistics (IBGE) Demographic Census (household income, age and total number of residents in private and collective households) there was a clear difference amongst areas, almost defining two very distinct sectors, one further to the south and the other to the east. In the field visits, it was possible to have a greater understanding of the local dynamics. Of the 150 residents interviewed, the vast majority have lived in Palmares for many years. When asked about the damage caused by floods, the answer was almost unanimous, everything was lost, repeatedly, especially at the big event in 2010. In this latter, besides all personal property, the damage caused to homes was diverse. Damaged ceilings, floors, finishes and doors. Covers and walls washed away by the water. Lots of mud, dirt and stench left behind.
With great unevenness in the terrain, Palmares still preserves the traces of its creation, high density on the banks of the Una River, but already showing expansion in areas of higher elevation. Even with the construction of the Serro Azul dam, and its proven importance for damage reduction, its combination with other measures, such as the removal of buildings located on river banks, as well as the association of structural and non-structural measures, led to the most favorable conditions of risk management, as highlighted by Amarnath et al. (2015) [45].

4.5. Discussion

The evaluation of the exposure (water extent) and hazard (water depth) for each return period was successful, showing the efficiency of model application (hydrologic and hydrodynamic) as being better than other procedures adopted under limited data conditions [47]. The relationship between the magnitudes of the events and their respective consequences was developed, enabling the estimation of the average annual damage after integration of the area below the flood risk curve or damage-probability curve. The damage reduction percentage due to the flood control installed in the Una River (between 51% and 88%) was close to that obtained by Shrestha and Kawasaki [49] (40–60%). Through the methodology of this research, the annual benefits provided by the Serro Azul dam are estimated at BRL 3.5 million per year for the residential sector, not counting isolated events likely to happen within this period. When considering other municipalities downstream of the dam and other sectors (service and commerce), there would be an increase in this number.
Fadel et al. [34] discussed how apparent non-action is the least costly measure. Any intervention will always have an initial cost, and benefits will only be provided later. The authors explained that other flood events are likely to occur in the medium and long term. As a result, the cost of accumulated damage will increase, easily overcoming a scenario in which no measures are implemented. In addition to being designed to protect the cities downstream from flood events, with the end of work on its pipeline, the Serro Azul dam will have expanded use, acting to supply municipalities in the Agreste region of Pernambuco. In Palmares, besides the effects of the Serro Azul, other measures were adopted, such as removing several buildings located on river banks, which could result in more benefits that were not considered in this study. The combination of structural and non-structural measures is the most favorable scenario for risk management in the scientific literature on this topic.
Finally, regarding the performance of risk analysis, it is important to highlight that uncertainty is inherent and uncertainties are present at significant levels throughout the process. The reduction of uncertainties depends on the existence of more works on the theme developed here. Thinking beyond the observed data enables comparisons to be made regarding the performance of risk curves. Although this is a current topic, it is not a new topic, and even so, it still has many gaps and few works actually trying to reach the end of the risk analysis. Collaborative initiatives have gained increasing prominence on this topic, with concepts such as collaborative mapping, crowdsourcing, voluntary geographic information and citizen science. In this research, for example, there were many sources of uncertainties, such as topographical data, flow characteristics, or model parameters. It is extremely important for decision-makers to take this limitation into account when developing public policies. A great effort to reduce uncertainties is found in validating hydrologic, hydrodynamic, and damage modeling. Validation techniques used here included comparing the results simulated by the model and observed data, comparing the performance of different models, and analyzing results by experts in the field. However, it is reaffirmed that validation still faces several challenges, such as scarcity, non-standardization, or non-availability of data in sufficient quantity and quality. Thus, damage models are often transferred from one region to another without adaptation, which is not recommended. The introduction of specific local data contributes to reducing these uncertainties. The hope is that the multiplication of studies on the subject can help create a database for comparison and validation of results [10].

5. Conclusions

This study was based on local data, applying damage estimation at the lot scale. The virtual classification of buildings allowed coverage of practically the entire constructed territory, without excessive demand for financial and human resources. The lot scale allowed for a local analysis of buildings, which was information not present in the IBGE Census data which covers social demographic information. We sought to minimize generalizations regarding urban morphology.
The registration of the exposed elements was performed satisfactorily. Building classification was completed, with the roof area being the main parameter in the methodology, where the use of affordable and secondary data was prioritized. The classification of residential standard designs, an essential step in the damage analysis, was possible due to the information obtained in the field survey, contributing to the understanding of the diversity present in loco. The results obtained were validated owing to the availability of damage estimation for the 2010 flood event.
Damage estimation methods allow for the consideration of different scenarios and contribute to risk analysis. In monetary value, this study calculated the effect of the construction of a reservoir for damage reduction, showing the potential to determine the effectiveness of measures adopted to mitigate flood impacts. In addition, the maps of exposure, hazard, and damage were elaborated for each simulated return period, making possible a complete risk analysis.
The understanding of risk is established and strengthened through quality information, accessible analysis methodologies, data spatialization, decision support, and the establishment of communication between the different participants. With its continental territory, Brazil has already been a site for several disastrous flood events. The search for combining methodologies and creating more robust risk maps for local regions aims to reduce costs and damages generated in the public and private sectors, especially to the population. It is important to highlight the possibility of applying the methods used in this research to other regions and cities, as almost all the data can be obtained secondarily.

Supplementary Materials

The following supporting information can be downloaded at: https://www.mdpi.com/article/10.3390/geohazards3030020/s1. Information about standard design of the buildings, Table S1: Main features of standard single-family home designs; Table S2: Multiplier factor of standard property contents (Fm).

Author Contributions

Conceptualization, A.R.N. and L.F.D.R.B.; methodology, A.R.N. and L.F.D.R.B.; validation, A.R.N. and L.F.D.R.B.; formal analysis, A.R.N. and L.F.D.R.B.; investigation, A.R.N. and L.F.D.R.B.; data curation, A.R.N. and L.F.D.R.B.; writing—original draft preparation, A.R.N. and L.F.D.R.B.; writing—review and editing, A.R.N. and L.F.D.R.B.; visualization, L.F.D.R.B.; supervision, A.R.N.; project administration, A.R.N.; funding acquisition, A.R.N. All authors have read and agreed to the published version of the manuscript.

Funding

This research was funded by the National Council for Scientific and Technological Development (CNPq), grant number 441951/2020-1 and the Brazilian Research Network on Global Climate Change (Rede CLIMA). The second author is supported by the CNPq (Grant 308065/2021-2).

Conflicts of Interest

The authors declare no conflict of interest.

References

  1. Roos, M.M.D.; Hartmann, T.T.; Spit, T.T.J.M.; Johann, G.G. Constructing risks—Internalisation of flood risks in the flood risk management plan. Environ. Sci. Policy 2017, 74, 23–29. [Google Scholar] [CrossRef]
  2. UNISDR—The United Nations Office for Disaster Risk Reduction. Sendai Framework for Disaster Risk Reduction 2015–2030; UNISDR: Geneva, Switzerland, 2015. [Google Scholar]
  3. Tanwattana, P. Systematizing community-based disaster risk management (CBDRM): Case of urban flood-prone community in Thailand upstream area. Int. J. Disaster Risk Reduct. 2018, 28, 798–812. [Google Scholar] [CrossRef]
  4. Jahangiri, K.; Eivazi, M.-R.; Mofazali, A.S. The role of foresight in avoiding systematic failure of natural disaster risk management. Int. J. Disaster Risk Reduct. 2017, 21, 303–311. [Google Scholar] [CrossRef]
  5. Fadel, A.W.; Marques, G.F.; Goldenfum, J.A. Mapeamento do risco de prejuízo como medida de gestão de adaptação às inundações. Geociências 2018, 37, 121–136. [Google Scholar] [CrossRef] [Green Version]
  6. Whelchel, A.W.; Reguero, B.G.; Wesenbeeck, B.; Renaud, F.G. Advancing disaster risk reduction through the integration of science, design, and policy into eco-engineering and several global resource management processes. Int. J. Disaster Risk Reduct. 2018, 32, 29–41. [Google Scholar] [CrossRef] [Green Version]
  7. McGrath, H.; Stefanakis, E.; Nastev, M. Sensitivity nalysis of flood damage estimates: A case study in Fredericton, New Brunswick. Int. J. Disaster Risk Reduct. 2015, 14, 379–387. [Google Scholar] [CrossRef]
  8. Cammerer, H.; Thieken, A.H.; Lammel, J. Adaptability and transferability of flood loss functions in residential areas. Nat. Hazards Earth Syst. Sci. 2013, 13, 3063–3081. [Google Scholar] [CrossRef] [Green Version]
  9. Arrighi, C.; Mazzanti, B.; Pistone, F.; Castelli, F. Empirical flash flood vulnerability functions for residential buildings. SN Appl. Sci. 2020, 2, 904. [Google Scholar] [CrossRef] [Green Version]
  10. Molinari, D.; Bruijn, K.M.; Castillo-Rodriguez, J.T.; Aronica, G.T.; Bouwer, L.M. Validation of flood risk models: Current practice and possible improvements. Int. J. Disaster Risk Reduct. 2019, 33, 441–448. [Google Scholar] [CrossRef]
  11. Almeida, L.V.Q.; Eleuterio, J.C. Estado da arte de curvas de danos potenciais de inundações para o setor habitacional. In Proceedings of the XXIII Simpósio Brasileiro de Recursos Hídricos, Foz do Iguaçu, Brazil, 24–28 November 2018. [Google Scholar]
  12. APAC. Bacias Hidrográficas. Available online: http://www.apac.pe.gov.br/ (accessed on 24 May 2018).
  13. CONDEPE/FIDEM. Rio Una, GL 4 e GL 5; Agência Estadual de Planejamento e Pesquisas de Pernambuco: Recife, Brazil, 2006; 85p.
  14. Ribeiro Neto, A.; Cirilo, J.A.; Dantas, C.E.O.; Silva, E.R. Caracterização da formação de cheias na bacia do rio Una em Pernambuco: Simulação hidrológica-hidrodinâmica. Rev. Bras. Recur. Hídricos 2015, 20, 394–403. [Google Scholar]
  15. IBGE—Instituto Brasileiro de Geografia e Estatística. Palmares. Rio de Janeiro: IBGE. 2014. Available online: http://cidades.ibge.gov.br/brasil/pe/palmares (accessed on 14 November 2018).
  16. PERNAMBUCO. Plano Hidroambiental da Bacia Hidrográfica do Rio Capibaribe: Tomo I—Diagnóstico Hidroambiental; Secretaria de Recursos Hídricos e Energéticos (SRHE): Recife, Brazil, 2010; Volume 01/03. [Google Scholar]
  17. Dantas, C.E.O. Previsão e Controle de Inundações em Meio Urbano com Suporte de Informações Espaciais de Alta Resolução. Ph.D. Thesis, Federal University of Pernambuco, Recife, Brazil, 2012. [Google Scholar]
  18. Alves, F.H.B.A. Sistema de Previsão de Enchentes: Integração de Modelos de Previsão de Chuva, Simulação Hidrológica e Hidrodinâmica. Master’s Dissertation, Federal University of Pernambuco, Recife, Brazil, 2017. [Google Scholar]
  19. Batista, L.F.D.R.; Ribeiro Neto, A.; Montenegro, S.M.G.L.M. Adaptation mechanisms for extreme events in the Capibaribe River Basin, Brazil. In Proceedings of the XVI World Water Congress, Cancun, Mexico, 29 May–3 June 2017. [Google Scholar]
  20. ITEP—Instituto de Tecnologia de Pernambuco. Relatório de Impacto Ambiental: Estudo de Impacto Ambiental—EIA: Sistema de Controle de Cheias da Bacia do Rio Una–Barragem Serro Azul; Instituto de Tecnologia de Pernambuco: Recife, Brazil, 2011; 41p. [Google Scholar]
  21. Nakagawa, S.; Samarasinghe, G.; Haddaway, N.R.; Westgate, M.J.; O’Dea, R.E.; Noble, D.W.A.; Lagisz, M. Research weaving: Visualizing the future of research synthesis. Trends Ecol. Evol. 2019, 4, 224–238. [Google Scholar] [CrossRef] [Green Version]
  22. Li, W.; Lin, K.; Zhao, T.; Lan, T.; Chen, X.; Du, H.; Chen, H. Risk assessment and sensitivity analysis of flash floods in ungauged basins unsing coupled hydrologic and hydrodynamic models. J. Hydrol. 2019, 572, 108–120. [Google Scholar] [CrossRef]
  23. Gai, L.; Nunes, J.P.; Baartman, J.E.M.; Zhang, H.; Wang, F.; Roo, A.; Ritsema, C.J.; Geissen, V. Assessing the impact of human interventions on floods and low flows in the Wei River Basin in China using the LISFLOOD model. Sci. Total Environ. 2019, 541, 611–625. [Google Scholar] [CrossRef] [PubMed]
  24. Devi, N.N.; Sridharan, B.; Kuiry, S.N. Impact of urban sprawl on future flooding in Chennai city, India. J. Hydrol. 2019, 574, 486–496. [Google Scholar] [CrossRef]
  25. Nharo, T.; Makurira, H.; Gumindoga, W. Mapping floods in the middle Zambezi Basin using earth observation and hydrological modeling techniques. Phys. Chem. Earth 2019, 114, 102787. [Google Scholar] [CrossRef]
  26. Hadimlioglu, A.; Scott, A.K.; Starek, M.J. FloodSim: Flood simulation and visualization framework using position-based fluids. J. Geo-Inf. 2020, 9, 163. [Google Scholar] [CrossRef] [Green Version]
  27. Brunner, G.W. HEC-RAS, River Analysis System Hydraulic Reference Manual; U.S. Army Corps of Engineers: Davis, CA, USA, 2016; 547p.
  28. Lima Neto, O.C.; Ribeiro Neto, A.; Alves, F.H.B.; Cirilo, J.A. Sub-daily hydrological-hydrodynamic simulation in flash flood basins: Una River (Pernambuco/Brazil). Rev. Ambiente Água 2020, 15, e2556. [Google Scholar] [CrossRef]
  29. Chow, V.T.; Maidment, D.R.; Mays, L.W. Applied Hydrology; McGraw-Hill: New York, NY, USA, 1988. [Google Scholar]
  30. Alcântara, L.R.P. Espacialização dos Parâmetros das Equações de Intensidade—Duração E Frequência Para Municípios da Mata Sul do Estado de Pernambuco. Bachelor’s Dissertation, Federal University of Pernambuco, Caruaru, Brazil, 2018. [Google Scholar]
  31. Albano, R.; Mancusi, L.; Abbate, A. Improving flood risk analysis for effectively supporting the implementation of flood risk management plans: The case study of “Serio” Valley. Environ. Sci. Policy 2017, 75, 158–172. [Google Scholar] [CrossRef]
  32. Kreibich, H.; Piroth, K.; Seifert, I.; Maiwald, H.; Kunert, U.; Schwarz, J.; Merz, B.; Thieken, A.H. Is flow velocity a significant parameter in flood damage modeling? Nat. Hazards Earth Syst. Sci. 2009, 9, 1679–1692. [Google Scholar] [CrossRef]
  33. Ribeiro Neto, A.; Batista, L.F.D.R.; Coutinho, R.Q. Methodologies for generation of hazard indicator maps and flood prone areas: Municipality of Ipojuca/PE. Rev. Bras. Recur. Hídricos 2016, 21, 377–390. [Google Scholar]
  34. Fadel, A.W.; Marques, G.F.; Goldenfum, J.A.; Medellin-Azuara, J.; Tilmant, A. Full Flood Cost: Insights from a risk analysis perspective. J. Environ. Eng. 2018, 144, 04018071. [Google Scholar] [CrossRef]
  35. Penning-Rowsell, E.C.; Chatterton, J.B. The Benefits of Flood Alleviation; Saxon House: Farnborough, UK, 1977; 297p. [Google Scholar]
  36. Win, S.; Zin, W.W.; Kawasaki, A.; San, Z.M.L.T. Establishment of flood damage function models: A case study in the Bago River Basin, Myanmar. Int. J. Disaster Risk Reduct. 2018, 28, 688–700. [Google Scholar] [CrossRef]
  37. Oubennaceur, K.; Chokmani, K.; Nastev, M.; Lhissou, R.; Alem, A.E. Flood risk mapping for direct damage to residential buildings in Quebec, Canada. Int. J. Disaster Risk Reduct. 2019, 33, 44–54. [Google Scholar] [CrossRef]
  38. Salgado, J.C.M. Avaliação Econômica de Projetos de Drenagem e de Controle de Inundações em Bacias Urbanas. Master’s Dissertation, Federal University of Rio de Janeiro, Rio de Janeiro, Brazil, 1995. [Google Scholar]
  39. Nagem, F.R.M. Avaliação Econômica dos Prejuízos Causados Pelas Cheias Urbanas. Master’s Dissertation, Federal University of Rio de Janeiro, Rio de Janeiro, Brazil, 2008. [Google Scholar]
  40. World Bank. Avaliação de Perdas e Danos: Inundações Bruscas em Pernambuco—Junho de 2010; World Bank: Brasília, Brazil, 2012; 75p. [Google Scholar]
  41. Brunner, G.W. CEIWR-HEC. HEC-RAS, River Analysis System User’s Manual Version 5.0; U.S. Army Corps of Engineers: Davis, CA, USA, 2016; 962p.
  42. Lima Neto, O.C. Modelagem Hidrológica e Hidrodinâmica com Intervalo de Tempo Sub-Diário na Bacia do rio Una em Pernambuco. Master’s Dissertation, Federal University of Pernambuco, Recife, Brazil, 2019. [Google Scholar]
  43. Ongdas, N.; Akiyanova, F.; Karakulov, Y.; Muratbayeva, A.; Zinabdin, N. Application of HEC-RAS (2D) for flood hazard maps generation for Yesil (Ishim) River in Kazakhstan. Water 2020, 12, 2672. [Google Scholar] [CrossRef]
  44. NBR 12721; Avaliação de Custos de Construção para Incorporação Imobiliária e Outras Disposições para Condomínios Edilícios. Associação Brasileira de Normas Técnicas (ABNT): Rio de Janeiro, Brazil, 2005.
  45. Amarnath, G.; Umer, Y.M.; Alahacoon, N.; Inada, Y. Modelling the flood-risk extent using LISFLOOD-FP in a complex watershed: Case study of Mundeni Aru River Basin, Sri Lanka. Int. Assoc. Hydrol. Sci. 2015, 370, 131–138. [Google Scholar] [CrossRef]
  46. Andrade, M.M.N.; Szlafsztein, C.F. Vulnerability assessment including tangible and intangible components in the índex composition: Na Amazon case study of flooding and flash flooding. Sci. Total Environ. 2018, 630, 903–912. [Google Scholar] [CrossRef]
  47. Tîncu, R.; Zêzere, J.L.; Cracium, I.; Lazar, G.; Lazar, I. Quantitative micro-scale flood risk assessment in a section of the Trotus River, Romania. Land Use Policy 2020, 95, 103881. [Google Scholar] [CrossRef]
  48. Goerl, R.F.; Kobiyama, M.; Pellerin, J.R.G. Proposta metodológica para mapeamento de áreas de risco de inundação: Estudo de caso do município de Rio Negrinho–SC. Bol. Geogr. 2012, 30, 81–100. [Google Scholar] [CrossRef] [Green Version]
  49. Shrestha, B.B.; Kawasaki, A. Quantitative assessment of flood risk with evaluation of the effectiveness of dam operation for flood control: A case of the Bago River Basin of Myanmar. Int. J. Disaster Risk Reduct. 2020, 50, 101707. [Google Scholar] [CrossRef]
Figure 1. Una river basin location map.
Geohazards 03 00020 g001
Figure 2. Flowchart of the methods used in the study (GSV: Google Street View; CUB: Basic unit cost of construction).
Geohazards 03 00020 g002
Figure 3. Scheme of the hydrological and hydrodynamic modeling.
Geohazards 03 00020 g003
Figure 4. Floodplain simulations with and without the Serro Azul reservoir.
Geohazards 03 00020 g004
Figure 5. Lots and blocks vectorized.
Geohazards 03 00020 g005
Figure 6. Google Street View (2012) versus Photos (2019).
Geohazards 03 00020 g006
Figure 7. Steps to calculate the risk curve: (a) depth Vs flow (b) depth Vs damage (c) probability Vs flow (d) probability Vs damage.
Geohazards 03 00020 g007
Figure 8. 200-year flood maps (with Serro Azul reservoir).
Geohazards 03 00020 g008
Table 1. The basic unit cost of construction (CUB) in Pernambuco state (January 2021) in Brazilian Real (BRL).
Standard DesignBRL/m2
R1-B1690.30
R1-N2034.58
R1-A2585.64
RP1Q1541.08
Source: http://www.sindusconpe.com.br/servicos/cub. Accessed on 1 March 2021.
Table 2. Percentage of a damaged building (PED) [39].
Standard DesignWater Depths (m)
0.50 a 0.750.75 a 1.001.00 a 1.501.50 a 2.002.00 a 2.50
R1-B0.0950.1640.1700.1960.210
R1-N0.0560.1300.1370.1670.183
R1-A0.0420.1330.1370.1640.173
RP1Q0.0400.1420.1470.1740.183
Table 3. Maximum discharges at Palmares station simulated without the Serro Azul reservoir.
Return Period (Years)Reference Discharge from Dantas [17] (m³/s)HEC-HMS without Flow Ratio (m³/s)HEC-HMS with Flow Ratio (m³/s)HEC-RAS (m³/s)
54753541563535
106384322705670
258185581938898
501088667211441097
1001320796913821335
2001570354116561607
Table 4. Thresholds of roof area for standard design classification.
Standard DesignThreshold (m2)
RP1Q0–39.56
R1-B39.56–58.64
R1-N58.64–92.21
R1-A92.21–110.33
Table 5. Damage estimation in Palmares-values for January 2021.
Return Period (Years)Building Structure (BRL)Inventory (BRL)
Without ReservoirWith ReservoirWithout ReservoirWith Reservoir
53,792,011.98354,954.693,004,784.01404,689.39
108,848,708.64558,847.123,757,347.57775,503.50
2515,563,438.551,731,554.144,682,790.481,957,286.92
5018,980,767.523,546,706.465,263,626.742,885,755.04
10023,239,583.906,733,074.435,643,534.943,515,636.04
20027,167,627.2210,835,456.375,987,146.003,927,110.04
Publisher’s Note: MDPI stays neutral with regard to jurisdictional claims in published maps and institutional affiliations.

