Article

Analytical and Numerical Thermodynamic Equilibrium Simulations of Steam Methane Reforming: A Comparison Study

1
Laboratory of Thermal Sciences and Sustainability, University of Trás-os-Montes and Alto Douro, 5001-801 Vila Real, Portugal
2
CQ-VR, Chemistry Research Centre, University of Trás-os-Montes and Alto Douro, 5001-801 Vila Real, Portugal
3
Department of Engineering, School of Sciences and Technology, University of Trás-os-Montes and Alto Douro, 5000-801 Vila Real, Portugal
*
Author to whom correspondence should be addressed.
Reactions 2024, 5(1), 246-259; https://doi.org/10.3390/reactions5010011
Submission received: 17 January 2024 / Revised: 4 March 2024 / Accepted: 5 March 2024 / Published: 8 March 2024

Abstract

:
Computer simulation is a crucial element in the design of chemical processes. Although numerous commercial software options are widely recognized, the expense associated with acquiring and sustaining valid software licenses can be prohibitive. In contrast, open-source software, being freely available, provides an opportunity for individuals to study, review, and modify simulation models. This accessibility fosters technology transfer and facilitates knowledge dissemination, benefiting both academic and industrial domains. In this study, a thermodynamic equilibrium steady-state analysis of steam methane reforming using a natural-gas-like intake fuel was conducted. An analytical method was developed on the Microsoft Excel platform, utilizing the material balance equations system. The obtained results were compared to numerical methods employing the free-of-charge chemical process simulation software COCO and DWSIM. The investigation explored the influence of temperature, pressure, and steam-to-carbon ratio to determine optimal operating conditions. The findings suggest that higher temperatures and lower pressures are highly favorable for this process, considering that the choice of steam-to-carbon ratio depends on the desired conversion, with a potential disadvantage of coke formation at lower values. Consistent results were obtained through both analytical and numerical methods. Notably, simulations performed using DWSIM showed a deviation of 6.42% on average compared to COCO values. However, it was observed that the analytical method tended to overestimate the results by an average of 3.01% when compared to the simulated results from COCO, highlighting the limitations of this analytical approach.

1. Introduction

One of the biggest issues facing the world now is the energy transition, which will necessitate the creation of numerous new technologies that will enable the affordable production of low-carbon energy vectors [1].
Hydrogen (H2) is seen as an attractive carrier and alternative to fossil fuels due to its combustion without emitting environmental pollutants and its high energy potential [1,2]. Numerous researchers suggest hydrogen as the future’s primary energy carrier, offering a sustainable solution to replace fossil fuels [1,2,3,4]. However, hydrogen is not naturally available in nature, necessitating the use of other materials and fuels for its production [5]. One of the predominant methods for hydrogen production is steam methane reforming (SMR). In total, 80 to 85% of hydrogen production is derived from this technique and uses natural gas as a source of methane [6,7,8]. This process involves the reaction of methane (CH4) with steam, facilitated by a high-temperature catalyst, resulting in synthesis gas with elevated hydrogen concentrations. The endothermic nature of this reaction (1) requires a heat source, commonly provided by the combustion of excess methane within the reactor [2].
C H 4 + H 2 O C O + 3 H 2 Δ R H 0 = 206   k J   mol 1
The SMR reaction typically occurs at elevated temperatures (900–1200 K) and pressures (5–25 bar) [6,9], with a preference for high temperatures and low pressures. Due to the production of high concentrations of carbon monoxide (CO) in the reaction products, the SMR process is inherently coupled with the water–gas shift reaction (WGS) (2). This process promotes the conversion of CO to carbon dioxide (CO2) through a catalytic reaction with steam, minimizing CO concentrations and increasing H2 output [10].
C O + H 2 O C O 2 + H 2 Δ R H 0 = 41   k J   mol 1
While the WGS reaction is exothermic and favored by low temperatures, the combination of both reactions (1) and (2) provides an endothermic global reaction (3).
C H 4 + 2 H 2 O C O 2 + 4 H 2 Δ R H 0 = 164.9   k J   mol 1
However, steam methane reforming is a complex process troubled by several drawbacks. The necessity for high temperatures introduces challenges related to heat transfer and diffusion, along with issues such as coke formation, poisoning, sintering, and oxidation, ultimately resulting in catalyst deactivation [11]. Additionally, other undesired reactions may also occur during the process [12].
Steam reforming extends beyond methane and can involve other alkanes such as propane [13,14,15], butane [16,17], methanol [18,19], and ethanol [20], among others. The choice of catalyst plays a crucial role in determining the efficiency of the steam reforming reaction. Generally, Ni-based reforming catalysts with Al2O3 supports are widely favored in the industry due to their affordability and high activity. However, it is important to note that these catalysts are susceptible to carbon deposition, known as the Boudouard reaction, leading to catalyst deactivation [21,22,23].
In the present study, a comparative approach was employed to simulate the steady-state steam methane reforming process through equilibrium reactions, concurrently exploring the thermodynamics to identify optimal theoretical conditions for this process. Numerical methods were employed to assess the capabilities of the current free chemical process simulation software available on the market. These numerical results were compared against an analytical method developed on the Microsoft Excel (Microsoft 365 MSO, version 2401 Build 16. 0. 17231. 20236) platform for a comprehensive comparison.
Currently, advanced software simulation codes are available, enabling the prediction of products outputs, energy consumption, and various parameters associated with the SMR (steam methane reforming) process. These software codes are highly valuable for both the design and optimization of chemical processes [24]. While some software in this category is commercially popular, the acquisition and maintenance of valid software licenses can often be prohibitively expensive. In contrast, open-source software is accessible to all, allowing individuals with an interest in studying, reviewing, or modifying simulation models created using open-source tools to do so freely [25].
COCO stands as a compilation of CAPE-OPEN software elements designed for steady-state process simulation and interoperability testing within the CAPE-OPEN framework. This simulation environment exclusively relies on CAPE-OPEN, enabling developers and industries to comprehensively assess and harness the capabilities of CAPE-OPEN technology [25]. In this research, the flowsheet environment within COCO, known as COFE, was employed in conjunction with COCO’s thermodynamics library, TEA. DWSIM, based on sequential modular solution techniques, is better suited for analysis problems due to its strong thermodynamic engine and standalone thermodynamic library (DTL). However, it is difficult to perform dynamic simulations due to iterations and parameter values in output streams or equipment [26].

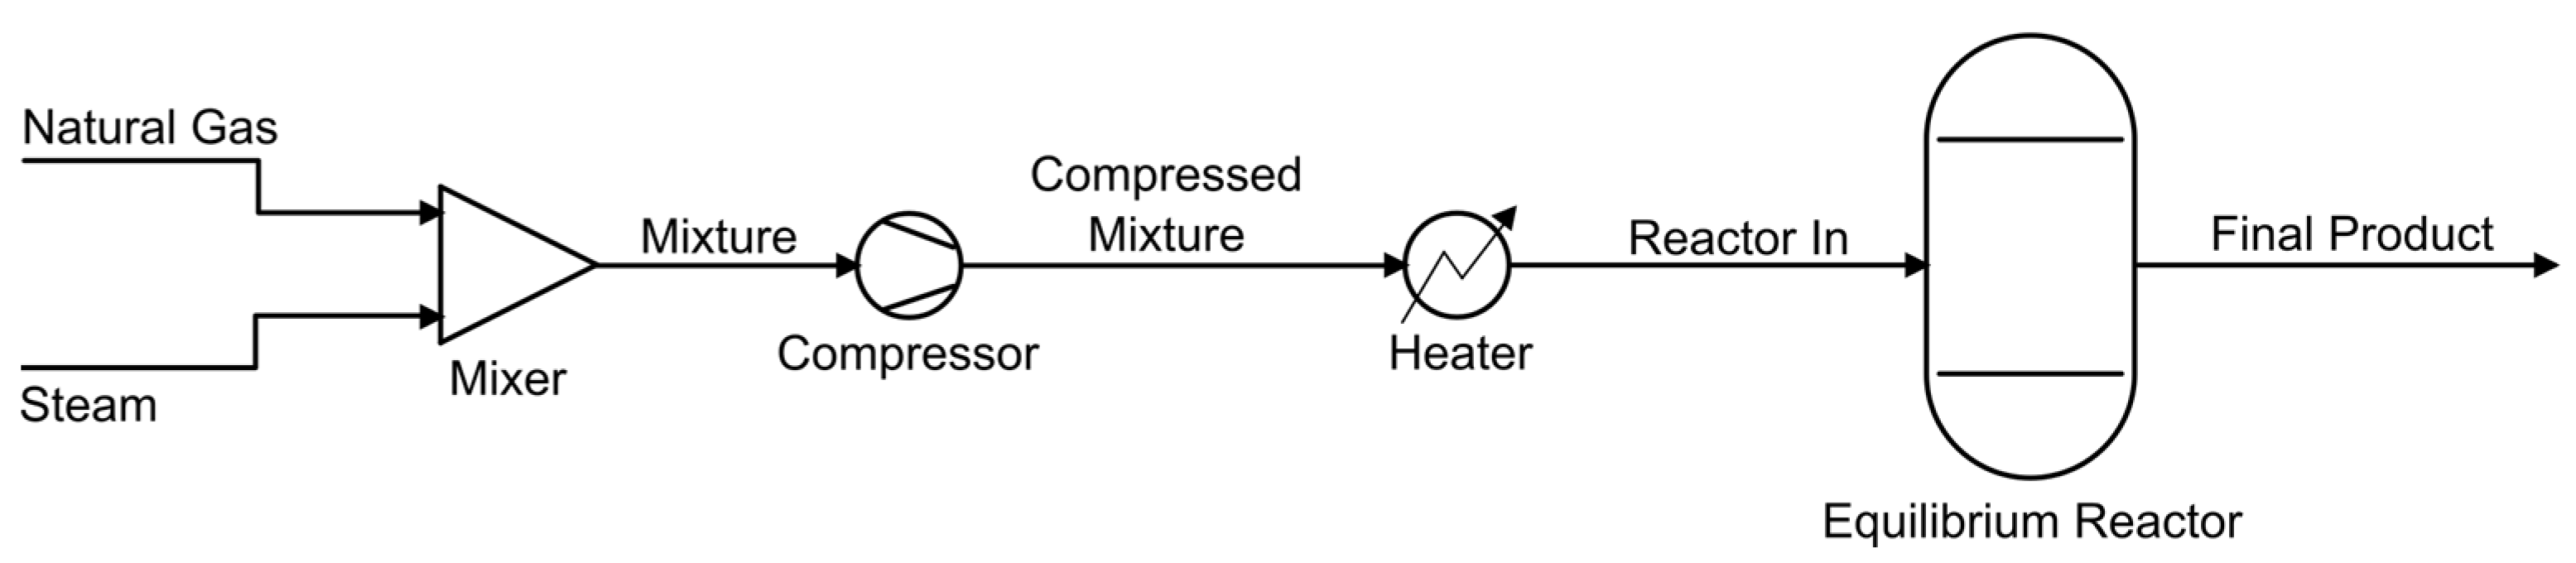
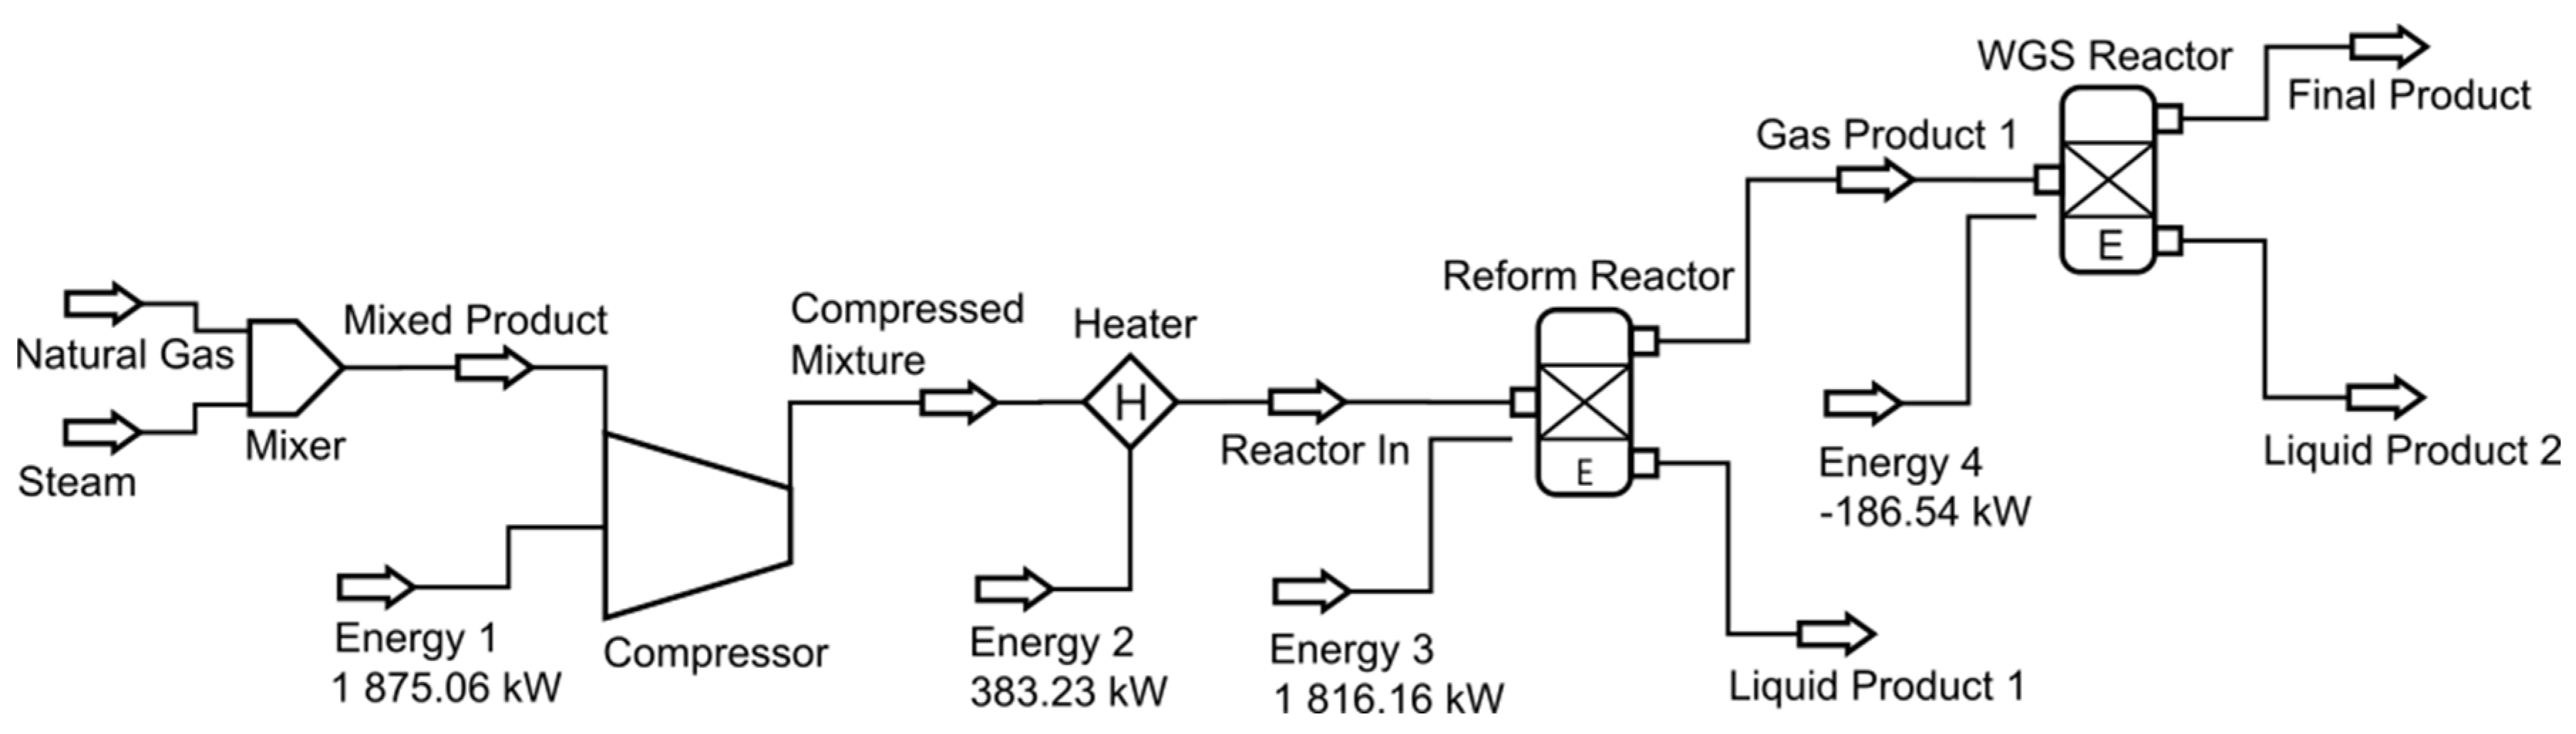
2. Materials and Methods

In the present study, three distinct approaches were employed to simulate the steam methane reforming process, involving one analytical and two numerical methods. The analytical method was initially executed using Microsoft Excel software. When utilizing thermodynamic equilibrium models, the chemical composition of the constituents can be assessed either through the minimization of Gibbs energy (non-stoichiometric) [27] or by solving the system of equilibrium constants and material balance equations (stoichiometric) [28]. While the former is widely employed in thermodynamic equilibrium evaluation, this study utilized the latter method, detailed below.
Considering the following reaction,
a A + b B c C + d D
The equilibrium constant for partial pressures is defined as
K e q = P D P 0 d × P C P 0 c P B P 0 b × P A P 0 a
By using Dalton’s law,
P i = X i × P T
Replacing the values of partial pressures in (5) leads to
K e q = X D . P T P 0 d × X C . P T P 0 c X B . P T P 0 b × X A . P T P 0 a
K e q = X D d . X C c X B b . X A a × P T P 0 d + c b a
with P T being the total pressure, P i the partial pressure of each constituent, P 0 the reference pressure (1 bar), and X i the molar fraction value. Another way of expressing the equilibrium constant of a reaction is through the variation in Gibbs energy, where
K e q = exp Δ G 0 R T
with
Δ G 0 = Δ H 0 T Δ S 0
The equations resulting from the material balance analysis can be solved with the introduction of the equilibrium constants that were calculated for each reaction involved in the process.
  • Reform reaction:
K e q = X C O . X H 2 3 X C H 4 . X H 2 O × P T P 0 2
  • WGS reaction:
K e q = X C O 2 . X H 2 X C O . X H 2 O
As for heat balance, it is also important to study how values can be influenced by external factors. From the first law of thermodynamics, we have
Δ H ˙ + Δ E k ˙ + Δ E p ˙ = Q ˙ W ˙
Considering Δ E k ˙ = Δ E p ˙ = W ˙ = 0 , the resulting equation is
Δ H ˙ = Q ˙ = H ˙ o u t H ˙ i n = n i × H ^ i o u t n i × H ^ i i n
By considering the standard enthalpy of formation and assuming the ideal gas state,
H ^ i = Δ H f 0 + T r e f T C ^ p d T
Numerical analysis was performed using the CAPE-OPEN Flowsheet Environment (COFE) included in the COCO software. The COCO simulator is a free-to-charge process modeling environment allowing chemical process simulations while providing an intuitive graphical user interface. A single equilibrium reactor was used to simulate both reactions necessary. The system created and used for this software is shown in Figure 1.
For another round of numerical analysis on SMR, the DWSIM software was employed. This chemical process simulator holds distinct advantages over the COCO software, being open-source and capable of accommodating both steady-state and dynamic-state simulations. First attempts were made to simulate both chemical processes in a single equilibrium reactor, like the one performed in the COCO software, but convergence errors were obtained. As a result, two distinct reactors were implemented, the reforming reactor (reform reactor) followed by the water–gas shift reactor (WGS reactor), as shown in Figure 2. It is important to note that the stream called “liquid product 1” has only the purpose of completing the connections to the reform reactor. No water is removed from the reforming reactor, allowing the WGS reaction to take place in the next reactor. In this manner, the successful convergence of the system was achieved, and we proceeded with the simulations.
Both numerical software used the Peng–Robinson thermodynamic package, and all methods assume the ideal gas law. Also, no unwanted reactions such as coke formation were considered for each chemical process due to the limitations of the analytical method. For the steam methane reforming simulation, a mixture of methane and ethane was used to simulate natural gas steam reforming at an intake flow rate of 5.16 kmol/min (0.57 kmol/min of natural gas and 4.59 kmol/min of steam). Natural gas is represented by the following mole percentages: 90% methane, 6% ethane, 2% carbon dioxide, and 2% nitrogen. The mole fractions at the reactor inlet are as follows: 17.44% methane, 1.16% ethane, 0.39% carbon dioxide, 0.39% nitrogen, and 80.62% water. The stoichiometric steam-to-carbon (S/C) ratio being 1 mole of carbon to 4 moles of steam was initially considered. The effect of temperature, pressure, steam-to-carbon (S/C) ratio, and heat balance was studied to evaluate the optimal operational conditions for each process. For the SMR process, a temperature range of 600 °C to 900 °C was considered, while pressure ranged from 1 bar to 25 bar.

3. Results and Discussion

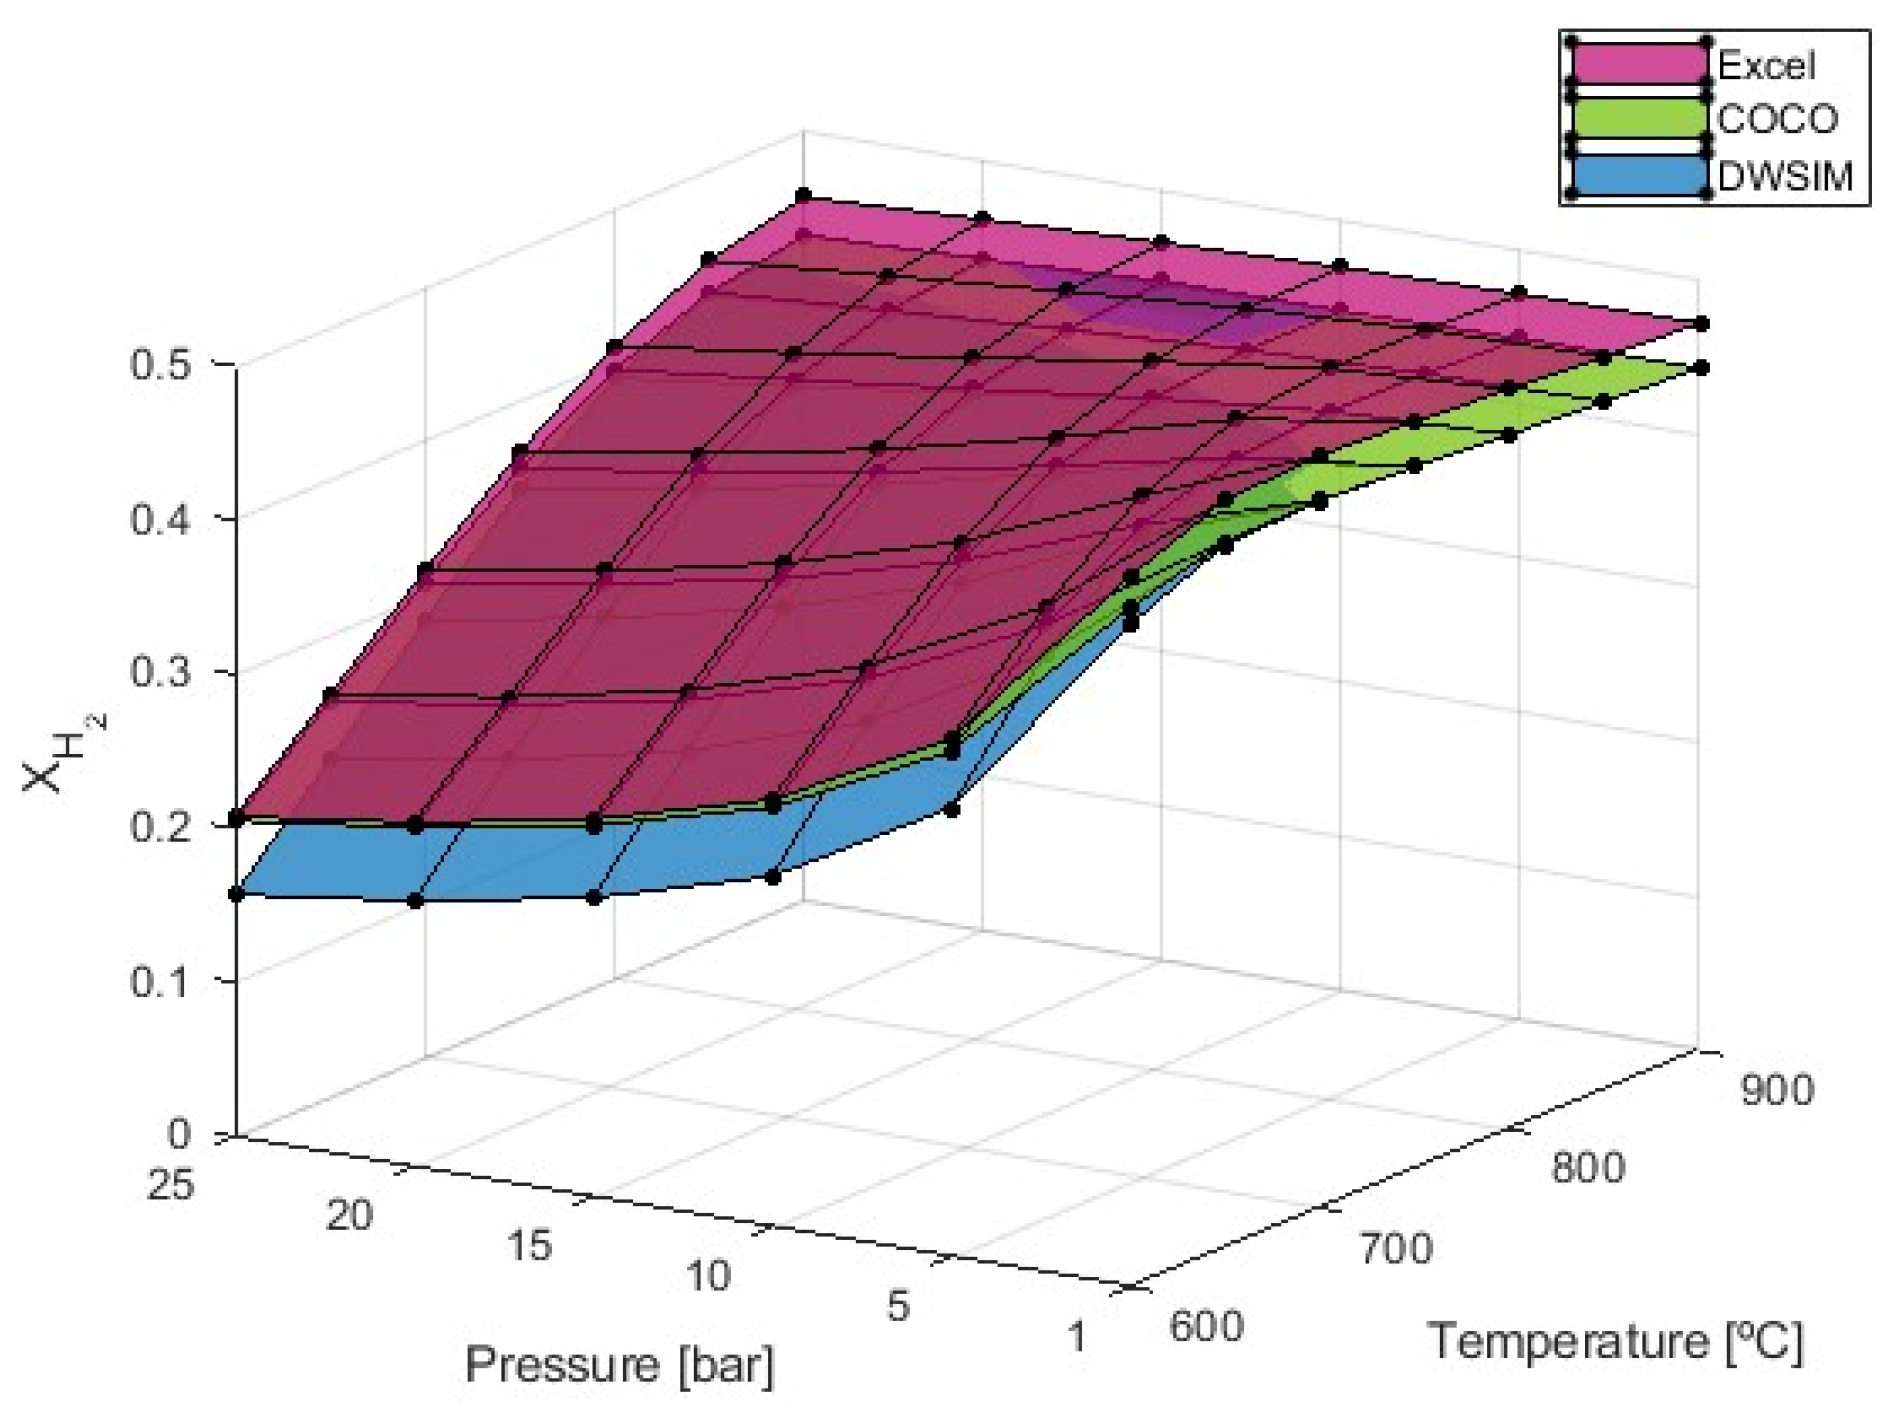
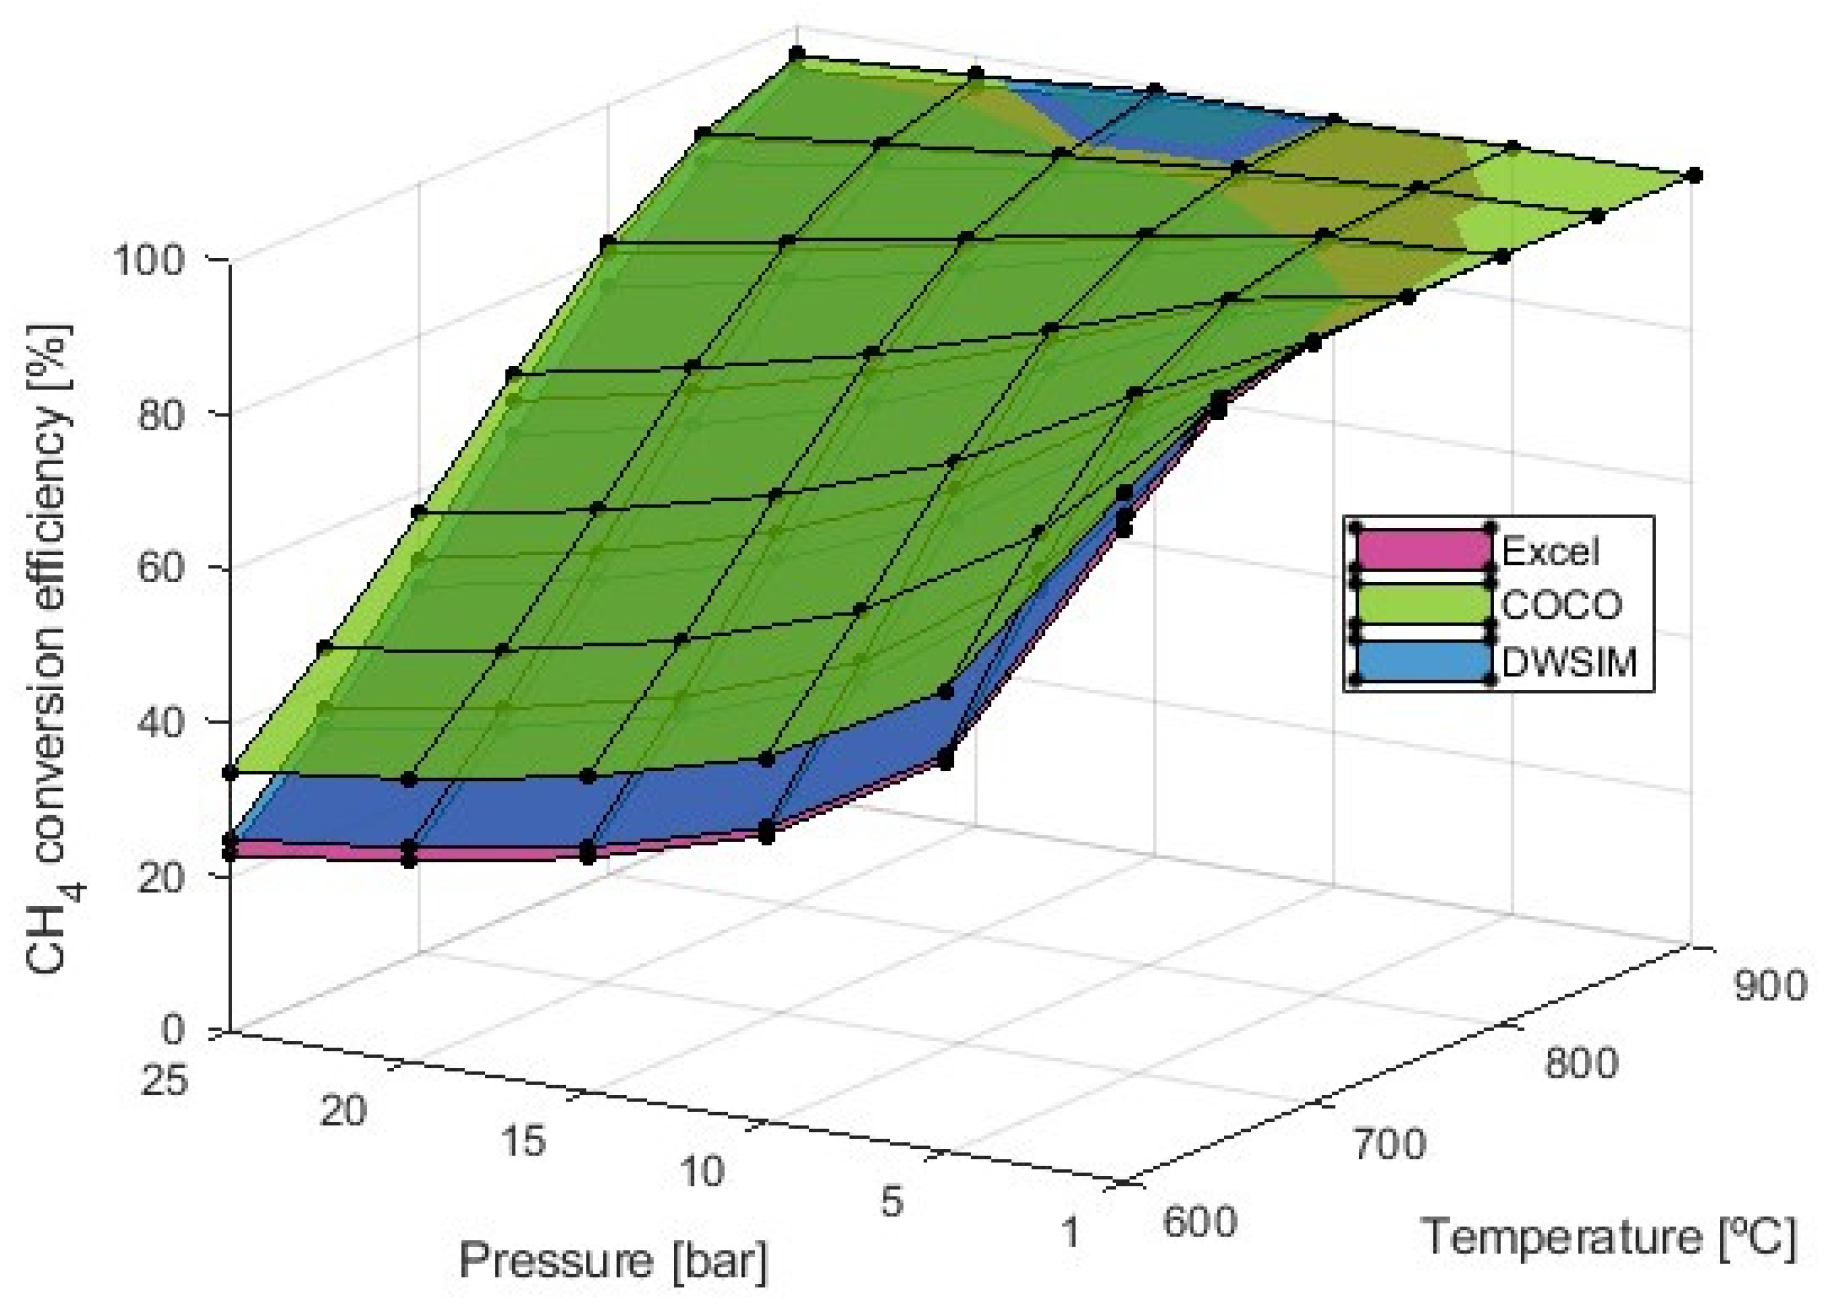
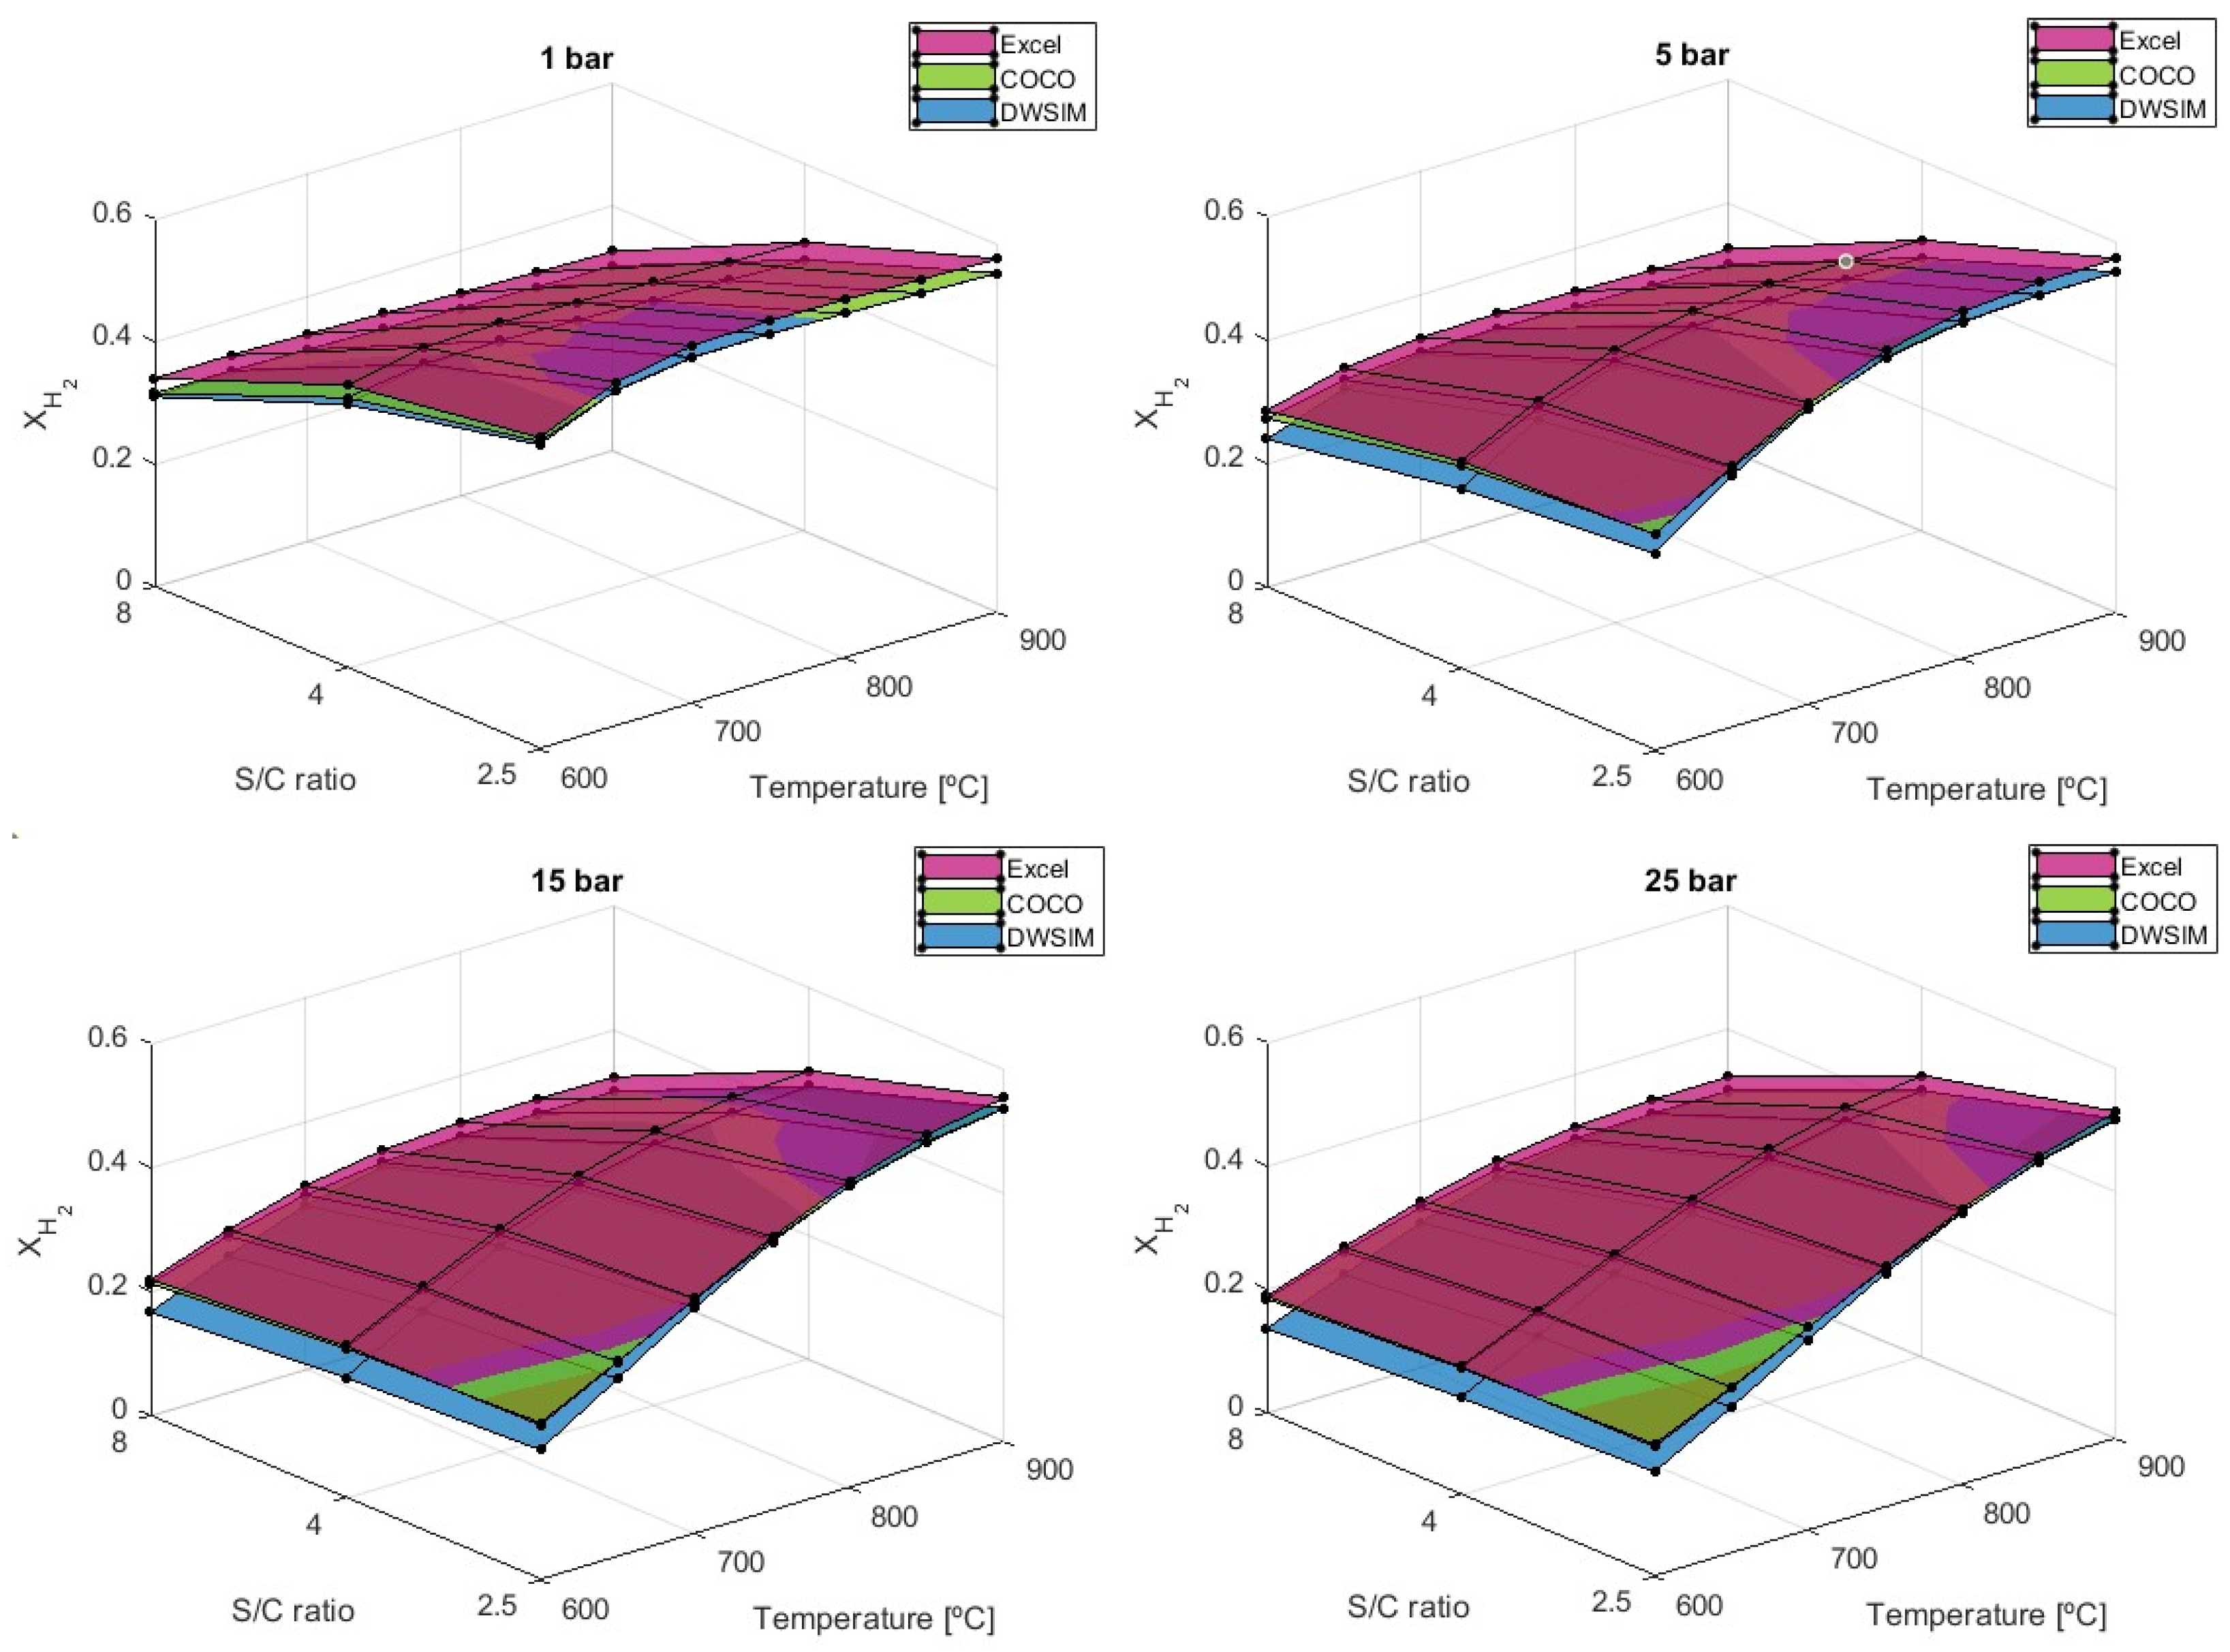
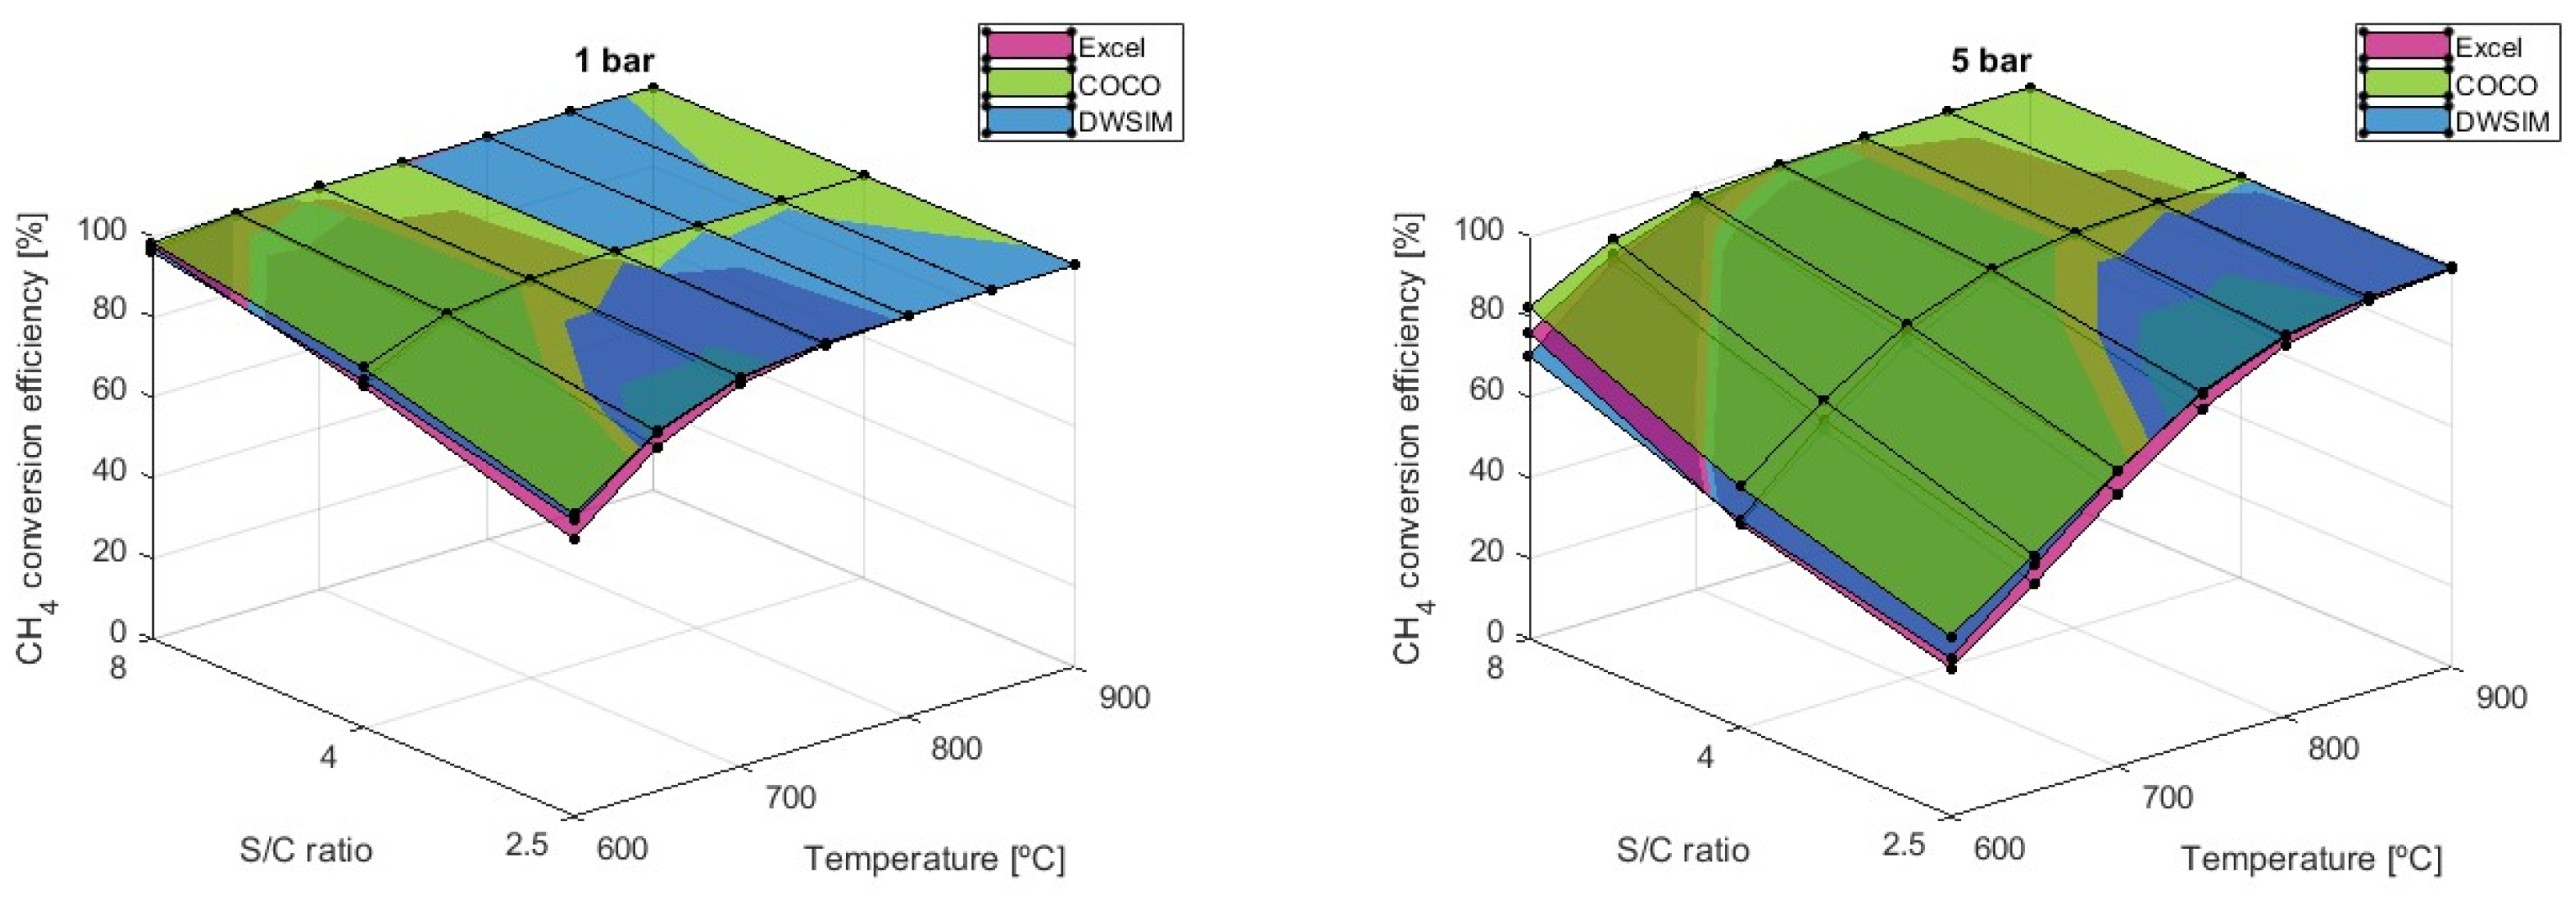
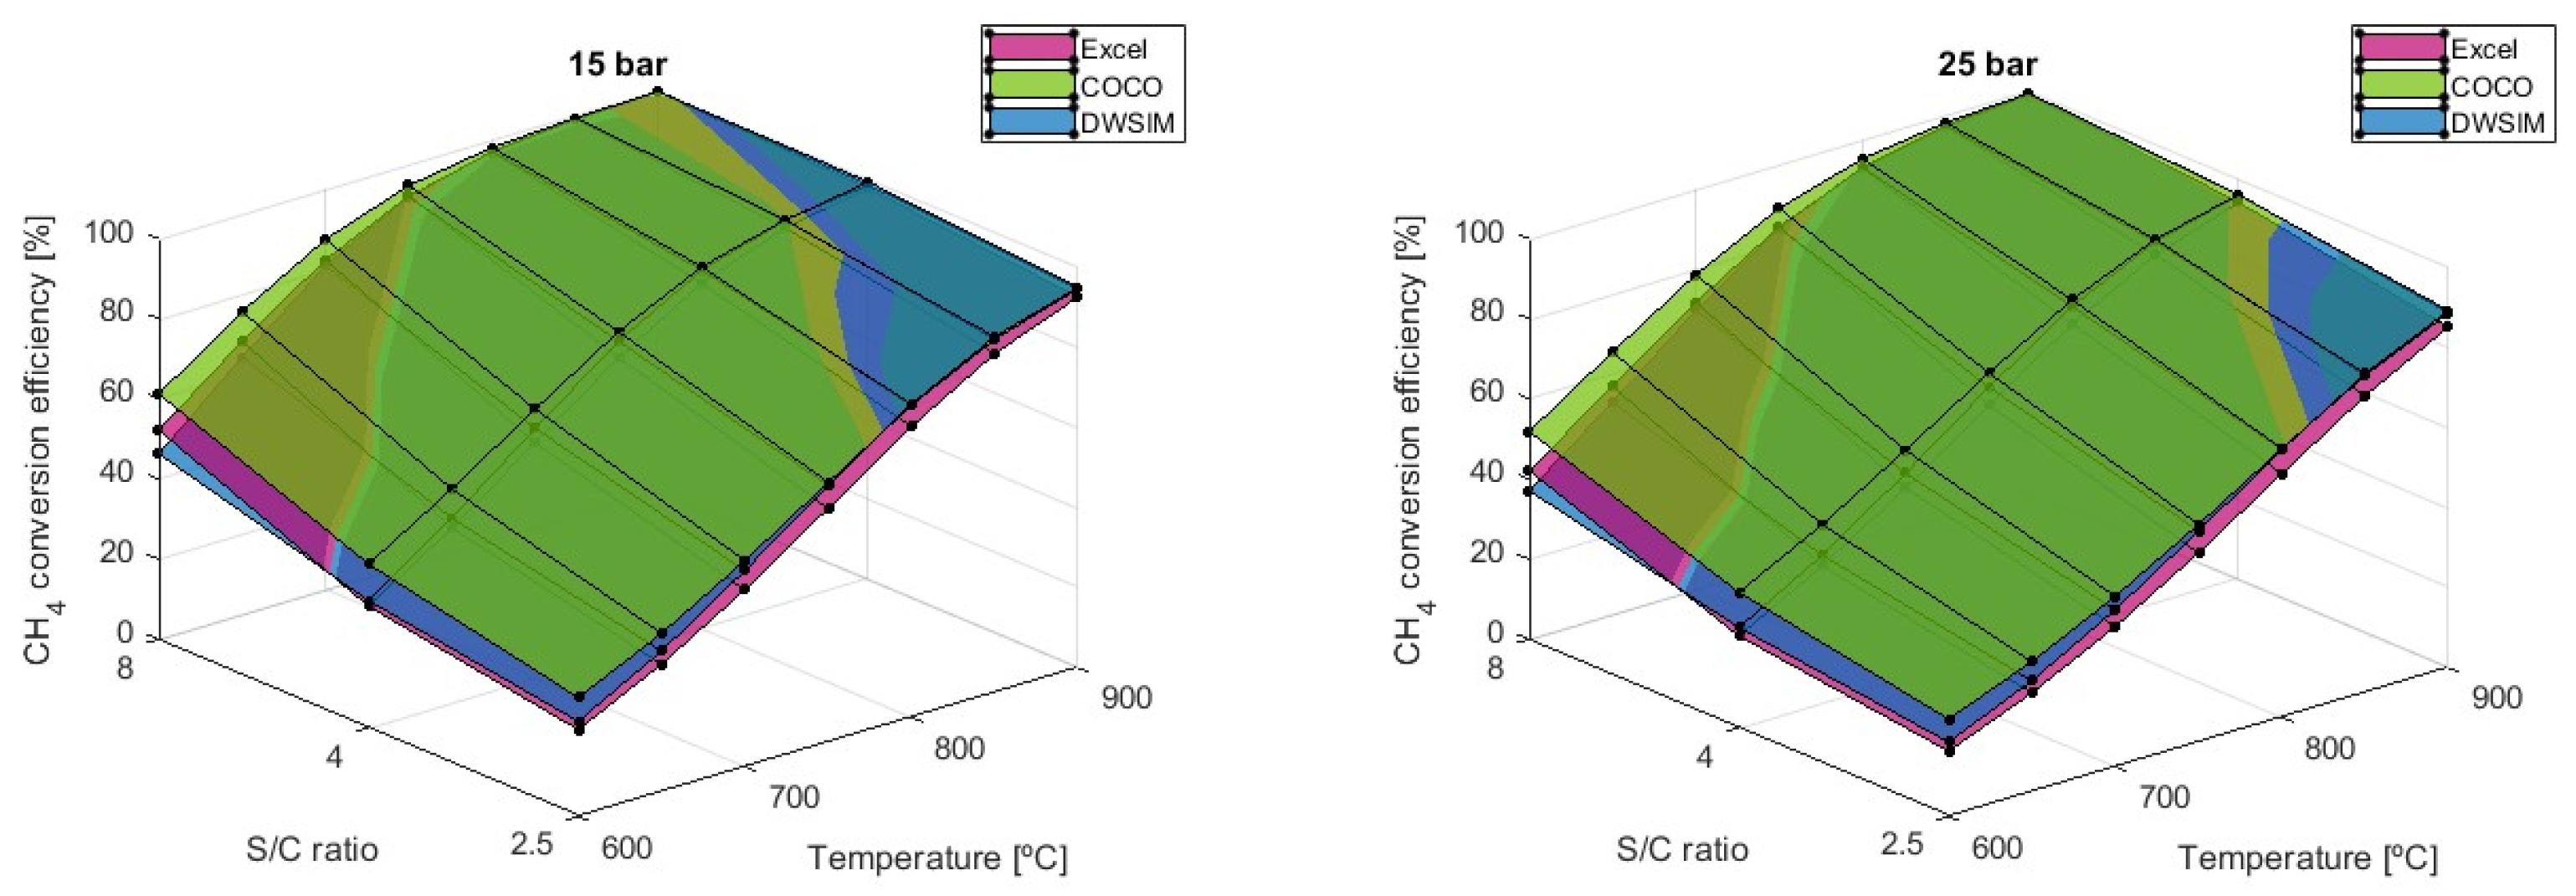
3.1. Hydrogen Production

With a fixed steam-to-carbon ratio (S/C = 4), the production of hydrogen in mole number demonstrates an increase with rising temperature, as illustrated in Figure 3. This outcome aligns with our expectations, considering the endothermic nature of the reforming reaction, where the equilibrium constant is favorable at higher temperatures. Conversely, the mole number of hydrogen decreases with increasing pressure, affirming that the SMR process is more advantageous at lower pressures. The observed trend indicates that the increase in temperature maximizes hydrogen production up to a certain temperature threshold, dependent on the pressure applied during the reaction. Beyond this reference point, higher temperatures exhibit a detrimental effect, leading to a decline in hydrogen production (Table 1). Because of this, the maximum values of X H 2 can be attained at 700 °C and 1 bar of pressure according to all three simulation methods.
While the results from the Microsoft Excel and COCO software (version 3.7.0.0) are very similar at lower temperatures, the results from DWSIM have shown lower values of hydrogen production. At 25 bar of pressure and 600 °C, the DWSIM simulation indicates that the hydrogen molar fraction would be equal to 0.157 compared to the values of 0.207 from Microsoft Excel and 0.205 from COCO. As temperatures increases, on the other hand, simulations provided by COCO and DWSIM provided up-to-par results, while results from the Microsoft Excel simulations are 6.16% higher in general.
In the study conducted by Di Nardo et al. (2024), they reported X H 2 values of 0.225 at 600 °C, 0.311 at 700 °C, 0.321 at 800 °C, and 0.319 at 900 °C, all under a pressure of 1 bar and an S/C ratio of 4 and at an intake flow rate of 8 kmol/h [29].
As for the CH4 conversion efficiency, Figure 4 indicates that increasing pressures in the reaction result in reduced efficiency, necessitating higher temperatures to achieve equivalent conversion values attainable at lower pressures. As the simulations in Microsoft Excel accounted for the total conversion of ethane, considering both reforming and water–gas shift (WGS) reactions, this enabled the solution of the equation system to be derived from material balance. In contrast, when utilizing numerical analysis, this stringent condition is not required, leading to a slight expected difference in the molar fraction of CH4. The decision to consider the total conversion of ethane aimed at simplifying the calculation process, driven by constraints within the Excel approach. The introduction of the ethane conversion reaction would have led to an overwhelming number of equations and variables, making the manual calculation of numerous equilibrium constants highly challenging within the Excel framework. In COCO and DWSIM, where complete conversion was not achieved, the results showed similar conversion values in both approaches: 66% for S/C = 2.5, 74% for S/C = 4, and 83% for S/C = 8. For the same reason, the CH4 dry reforming reaction in the material balances was not included, which possibly lead to an even greater difference in the molar fraction of CH4. Remarkably, consistent results were achieved through simulations conducted in both Microsoft Excel and DWSIM, covering the entire range of temperatures and pressures. However, values obtained from COCO simulations were consistently higher than those from the other software, although this discrepancy diminishes when temperatures reach 800 °C.

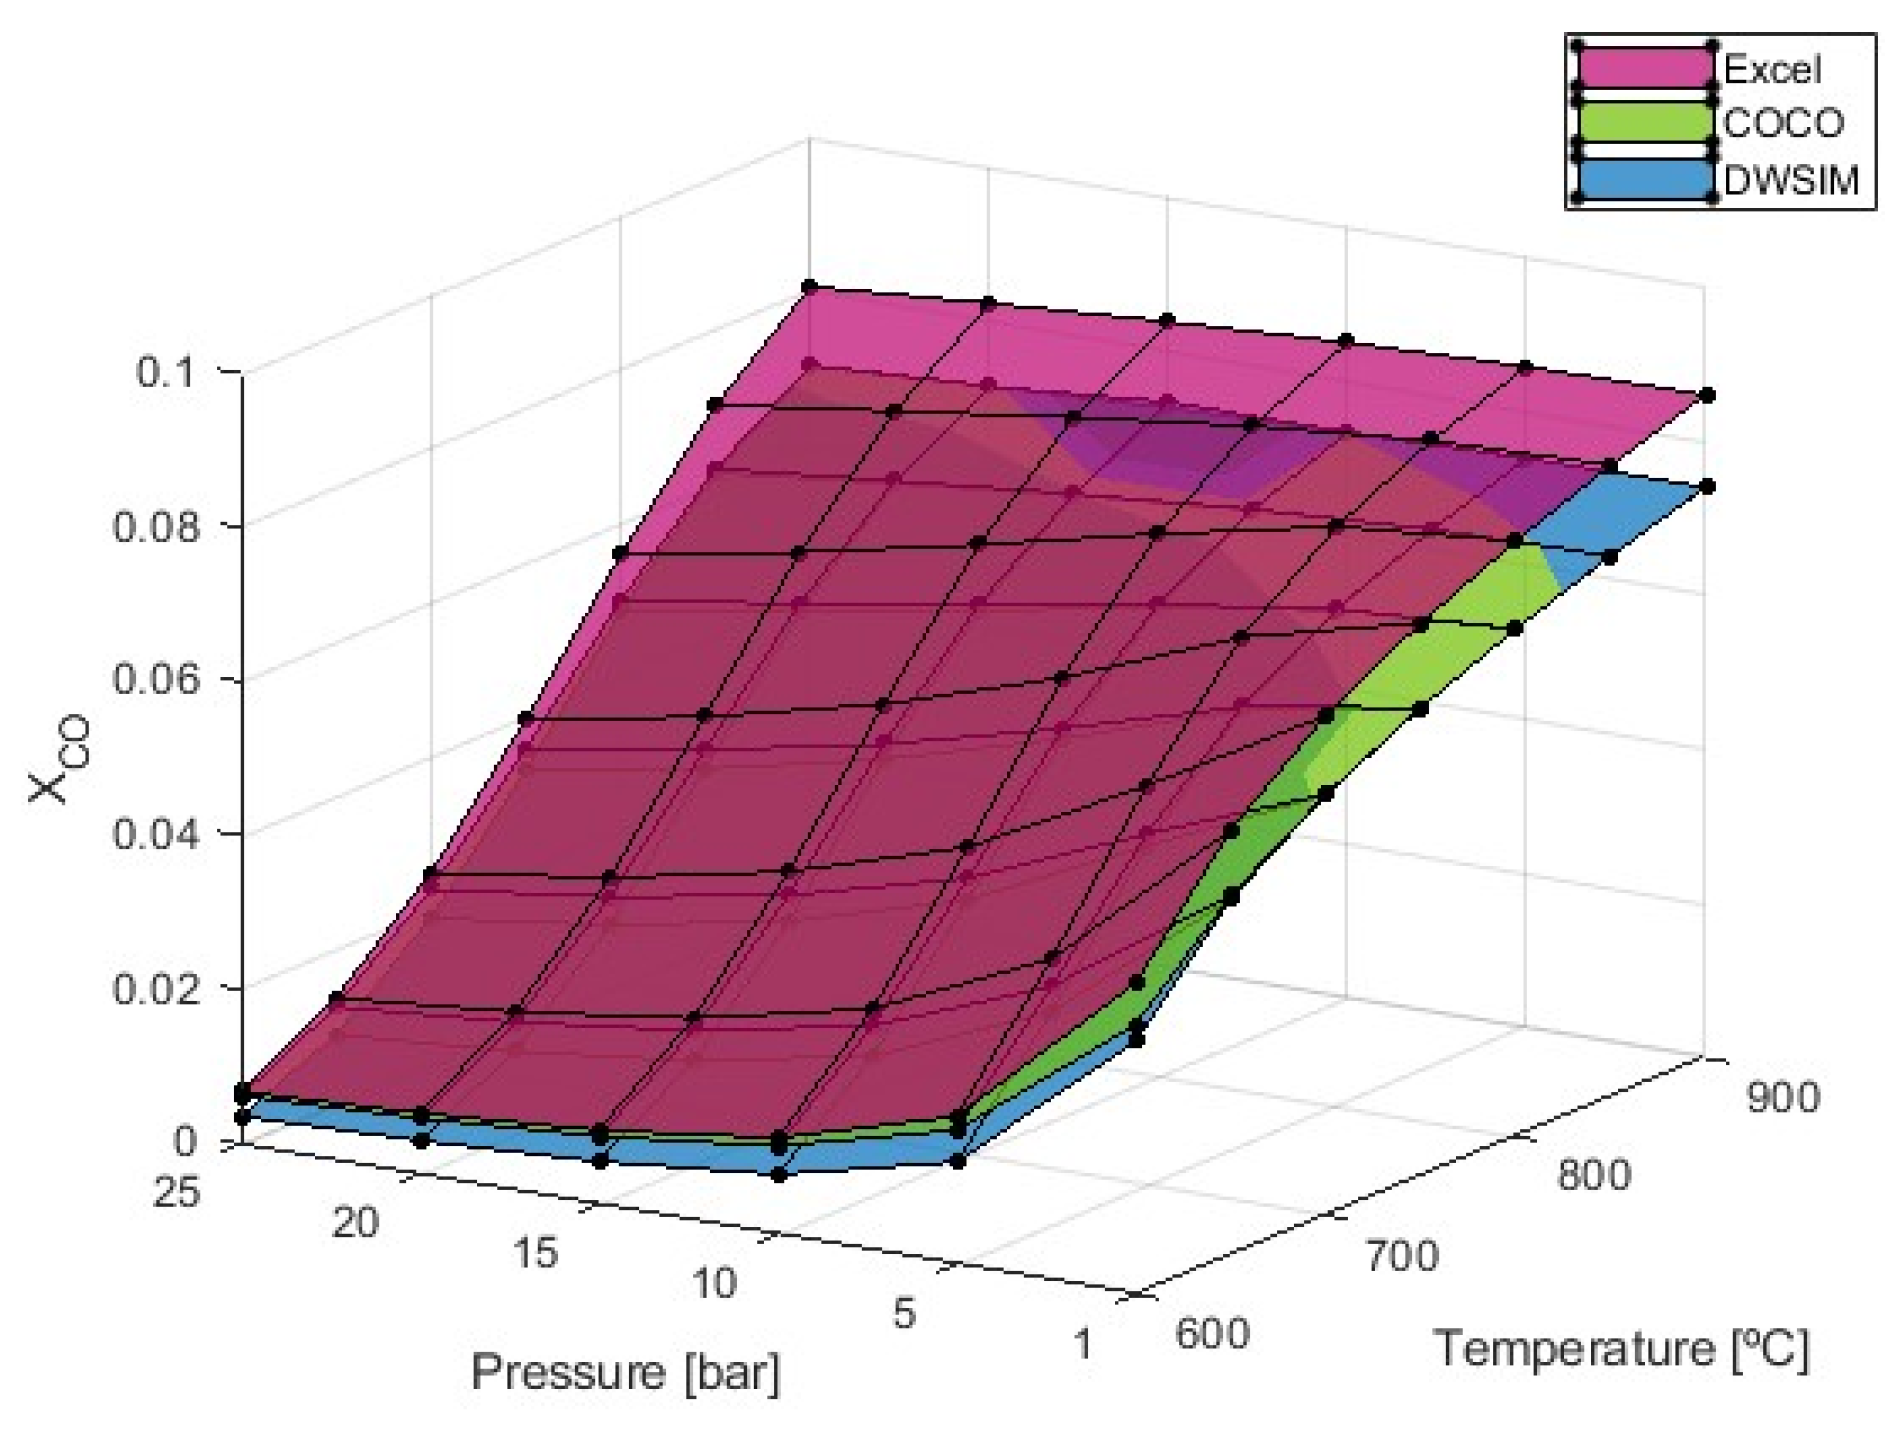
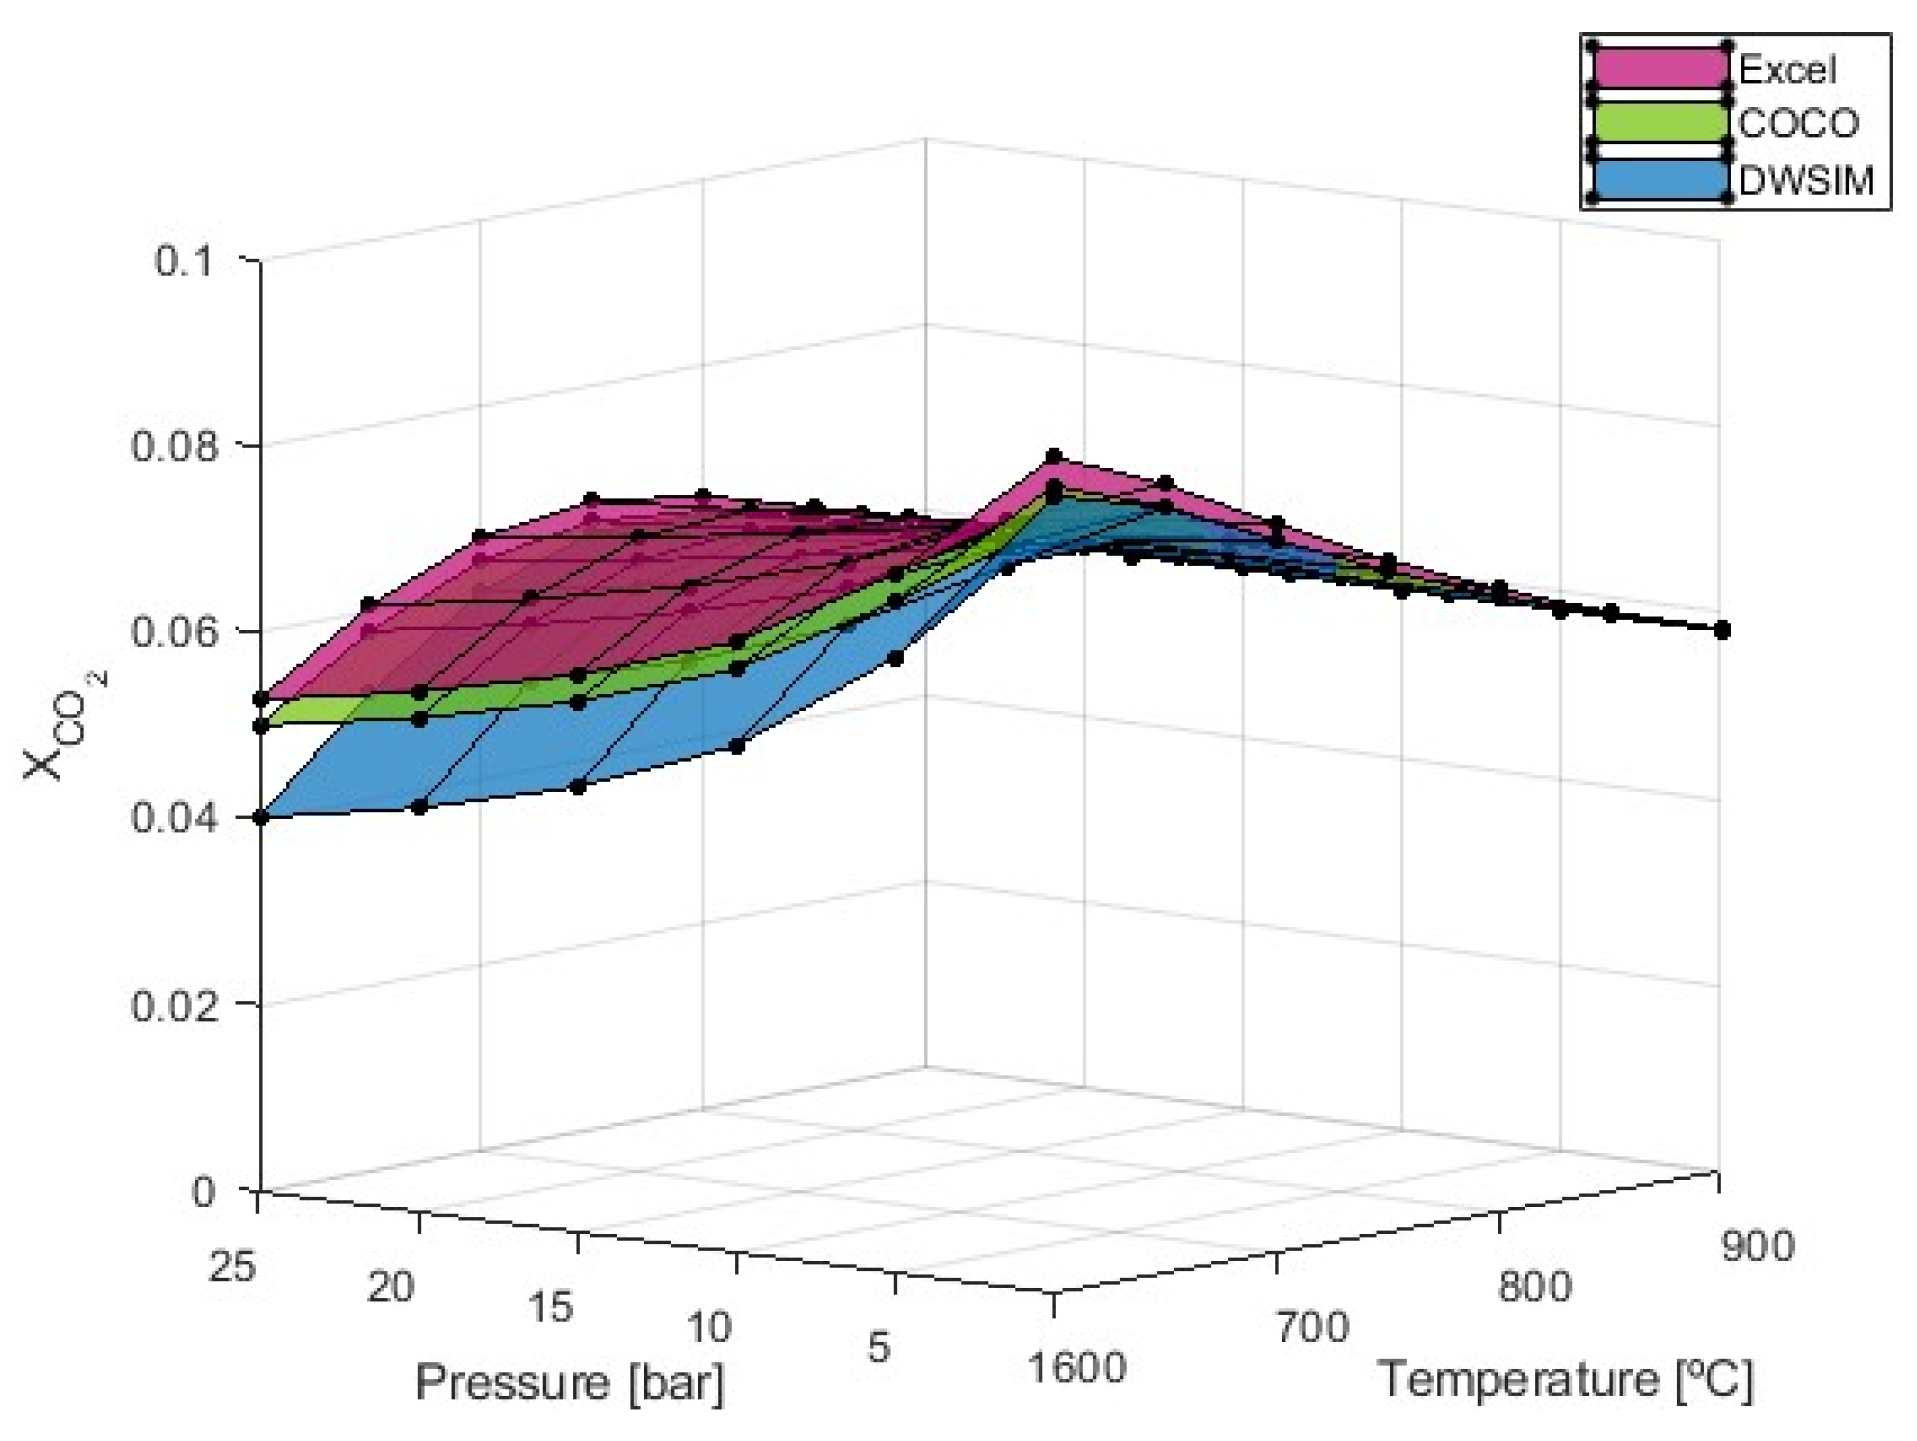
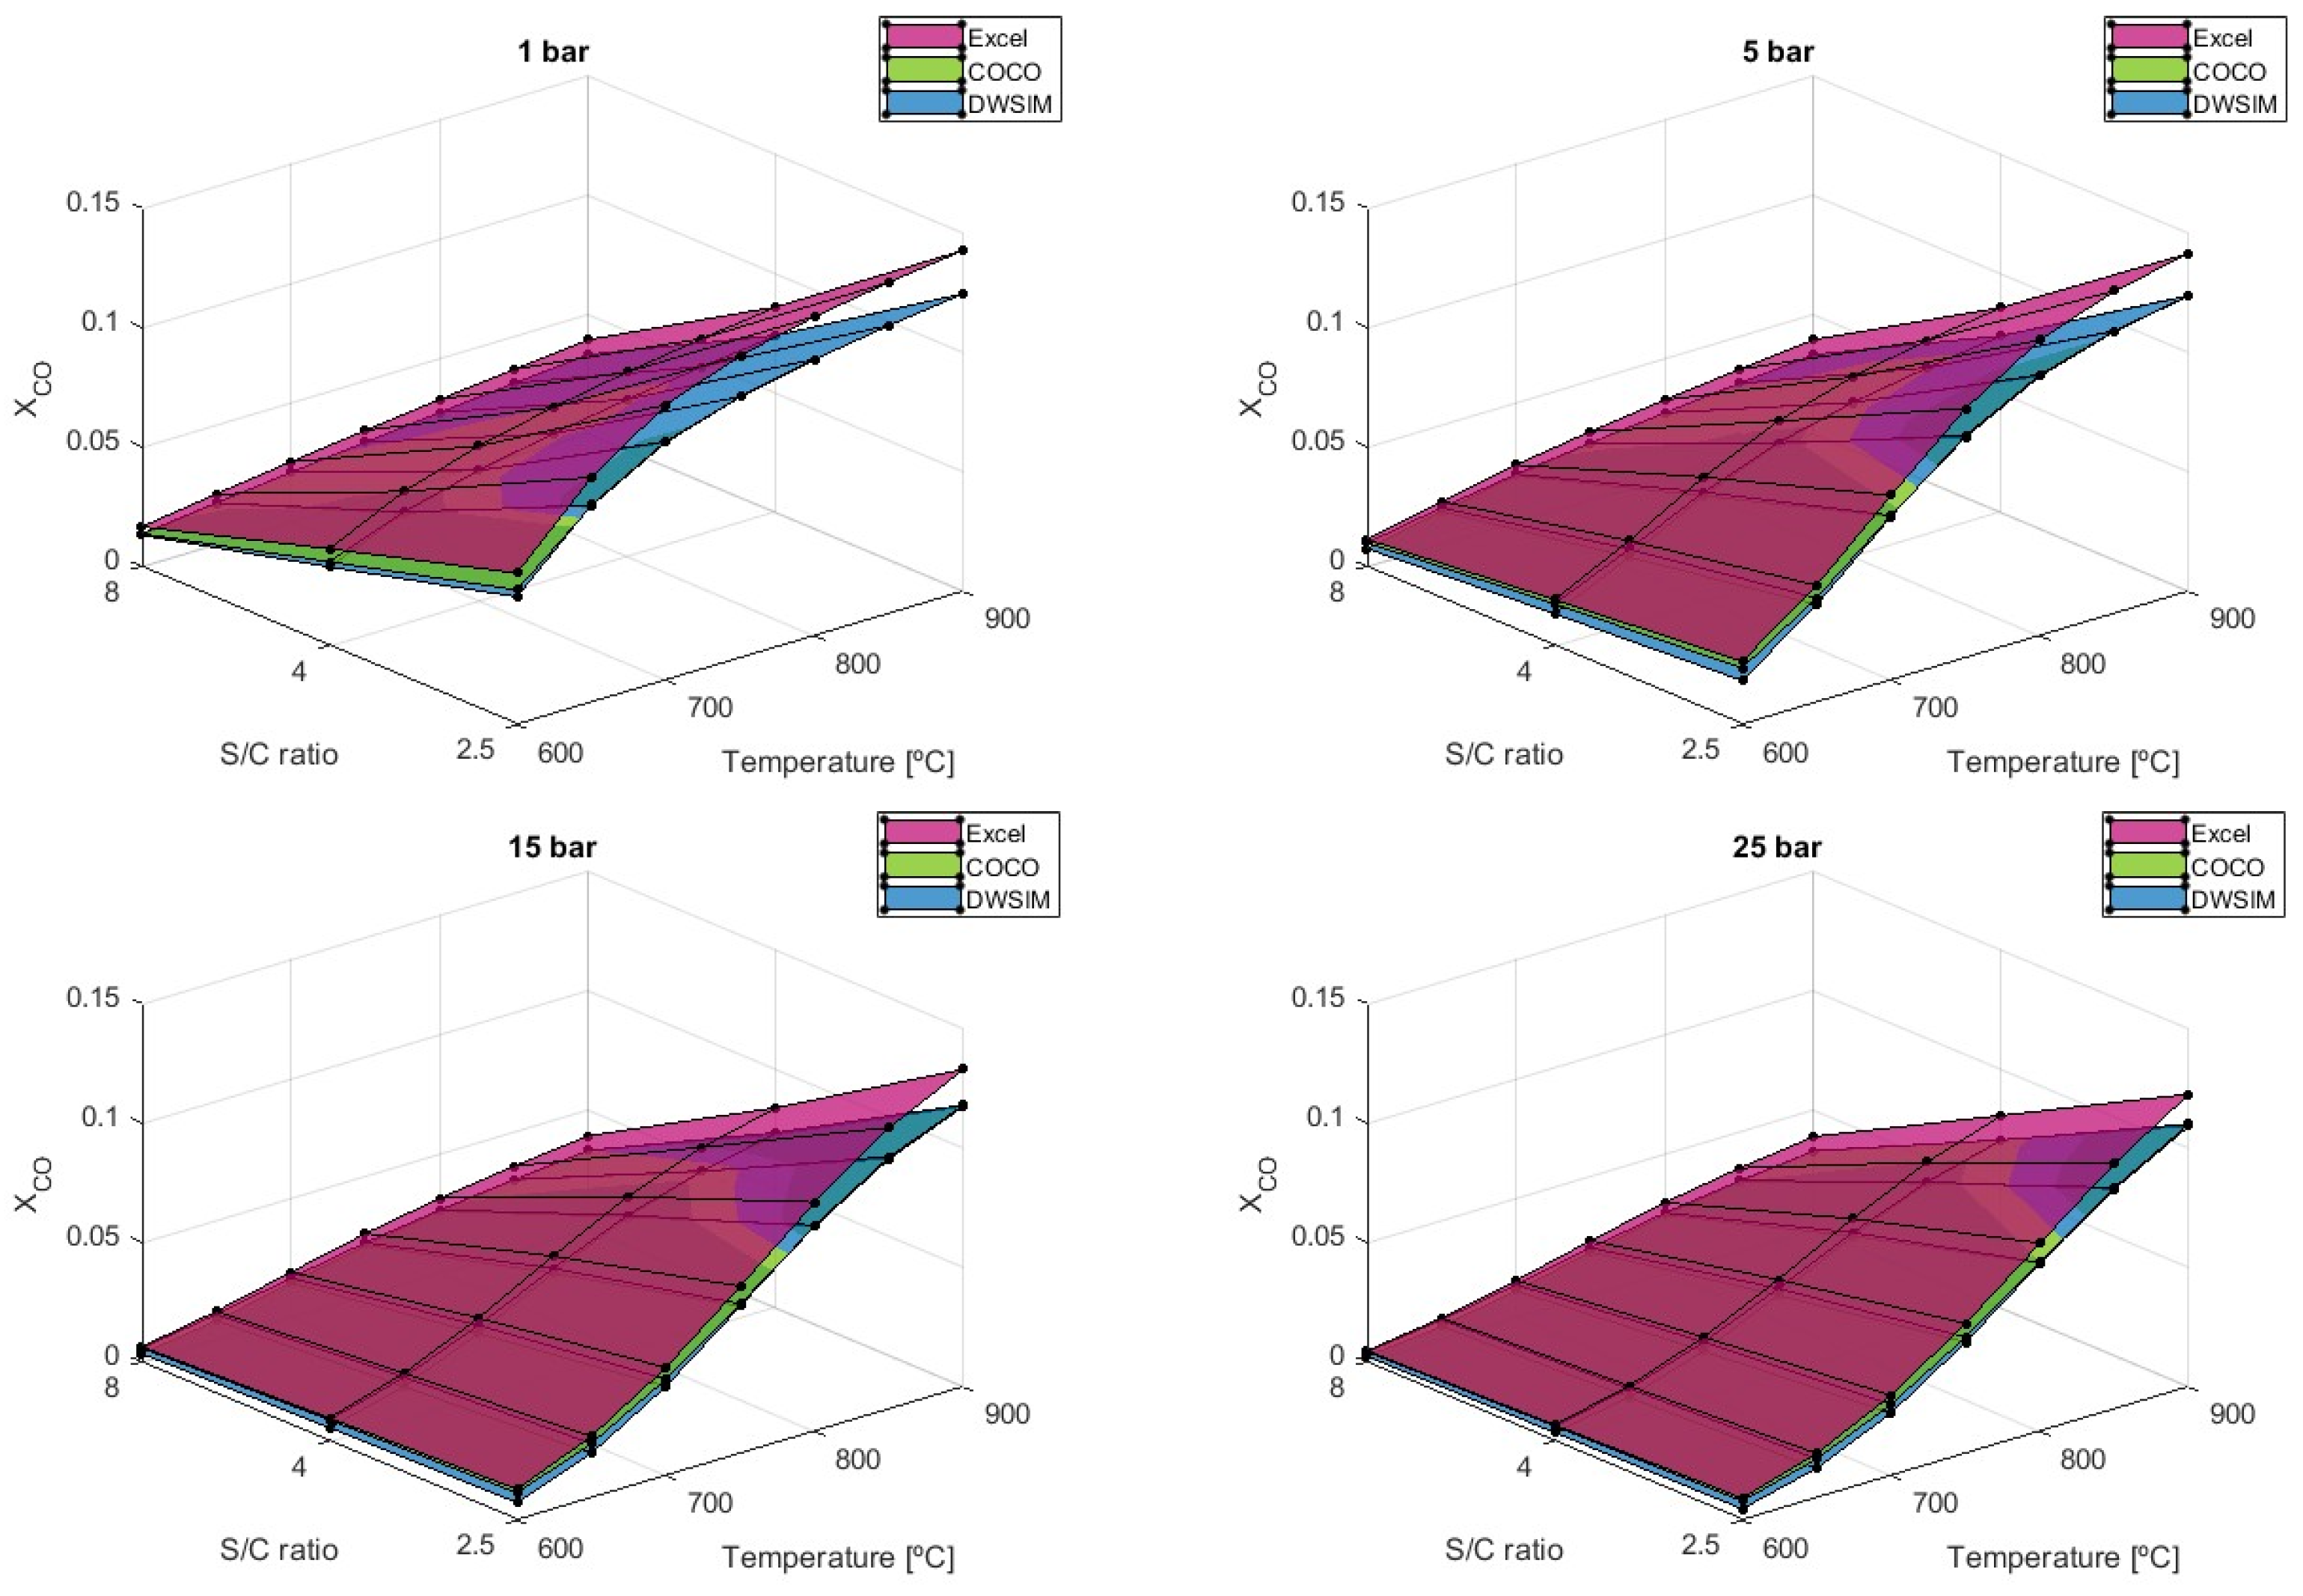
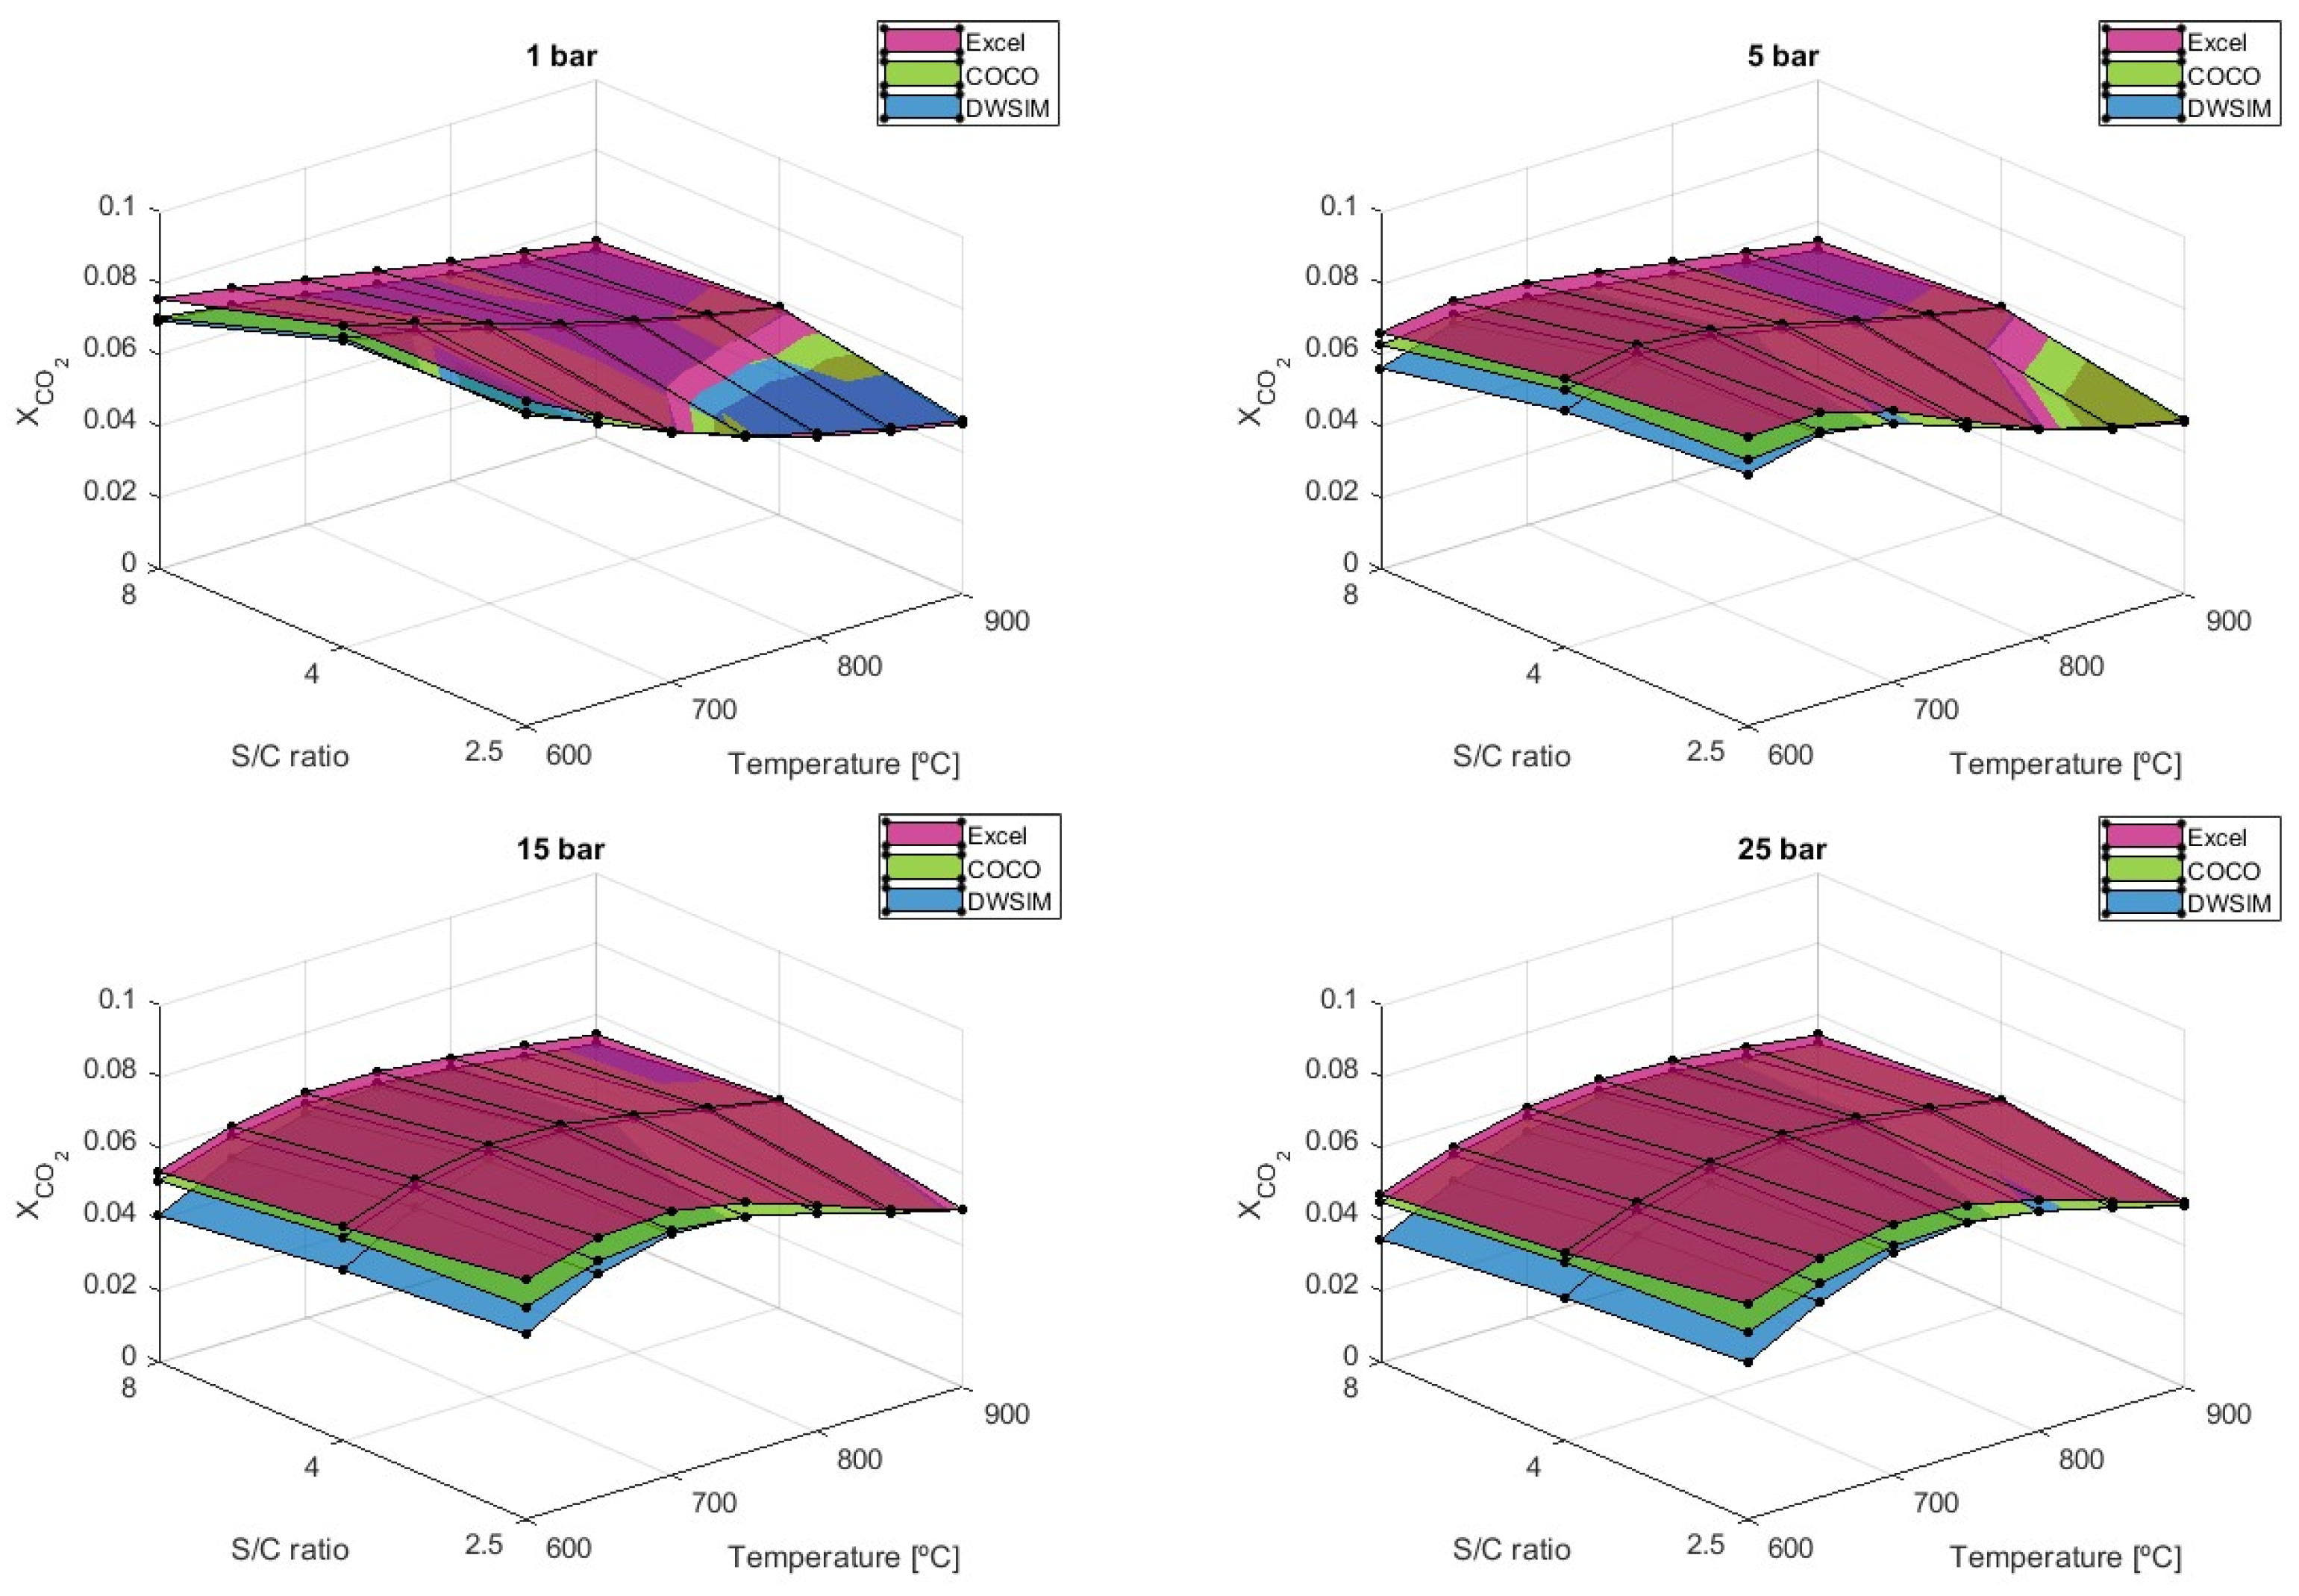
3.2. Production of Carbonaceous Products
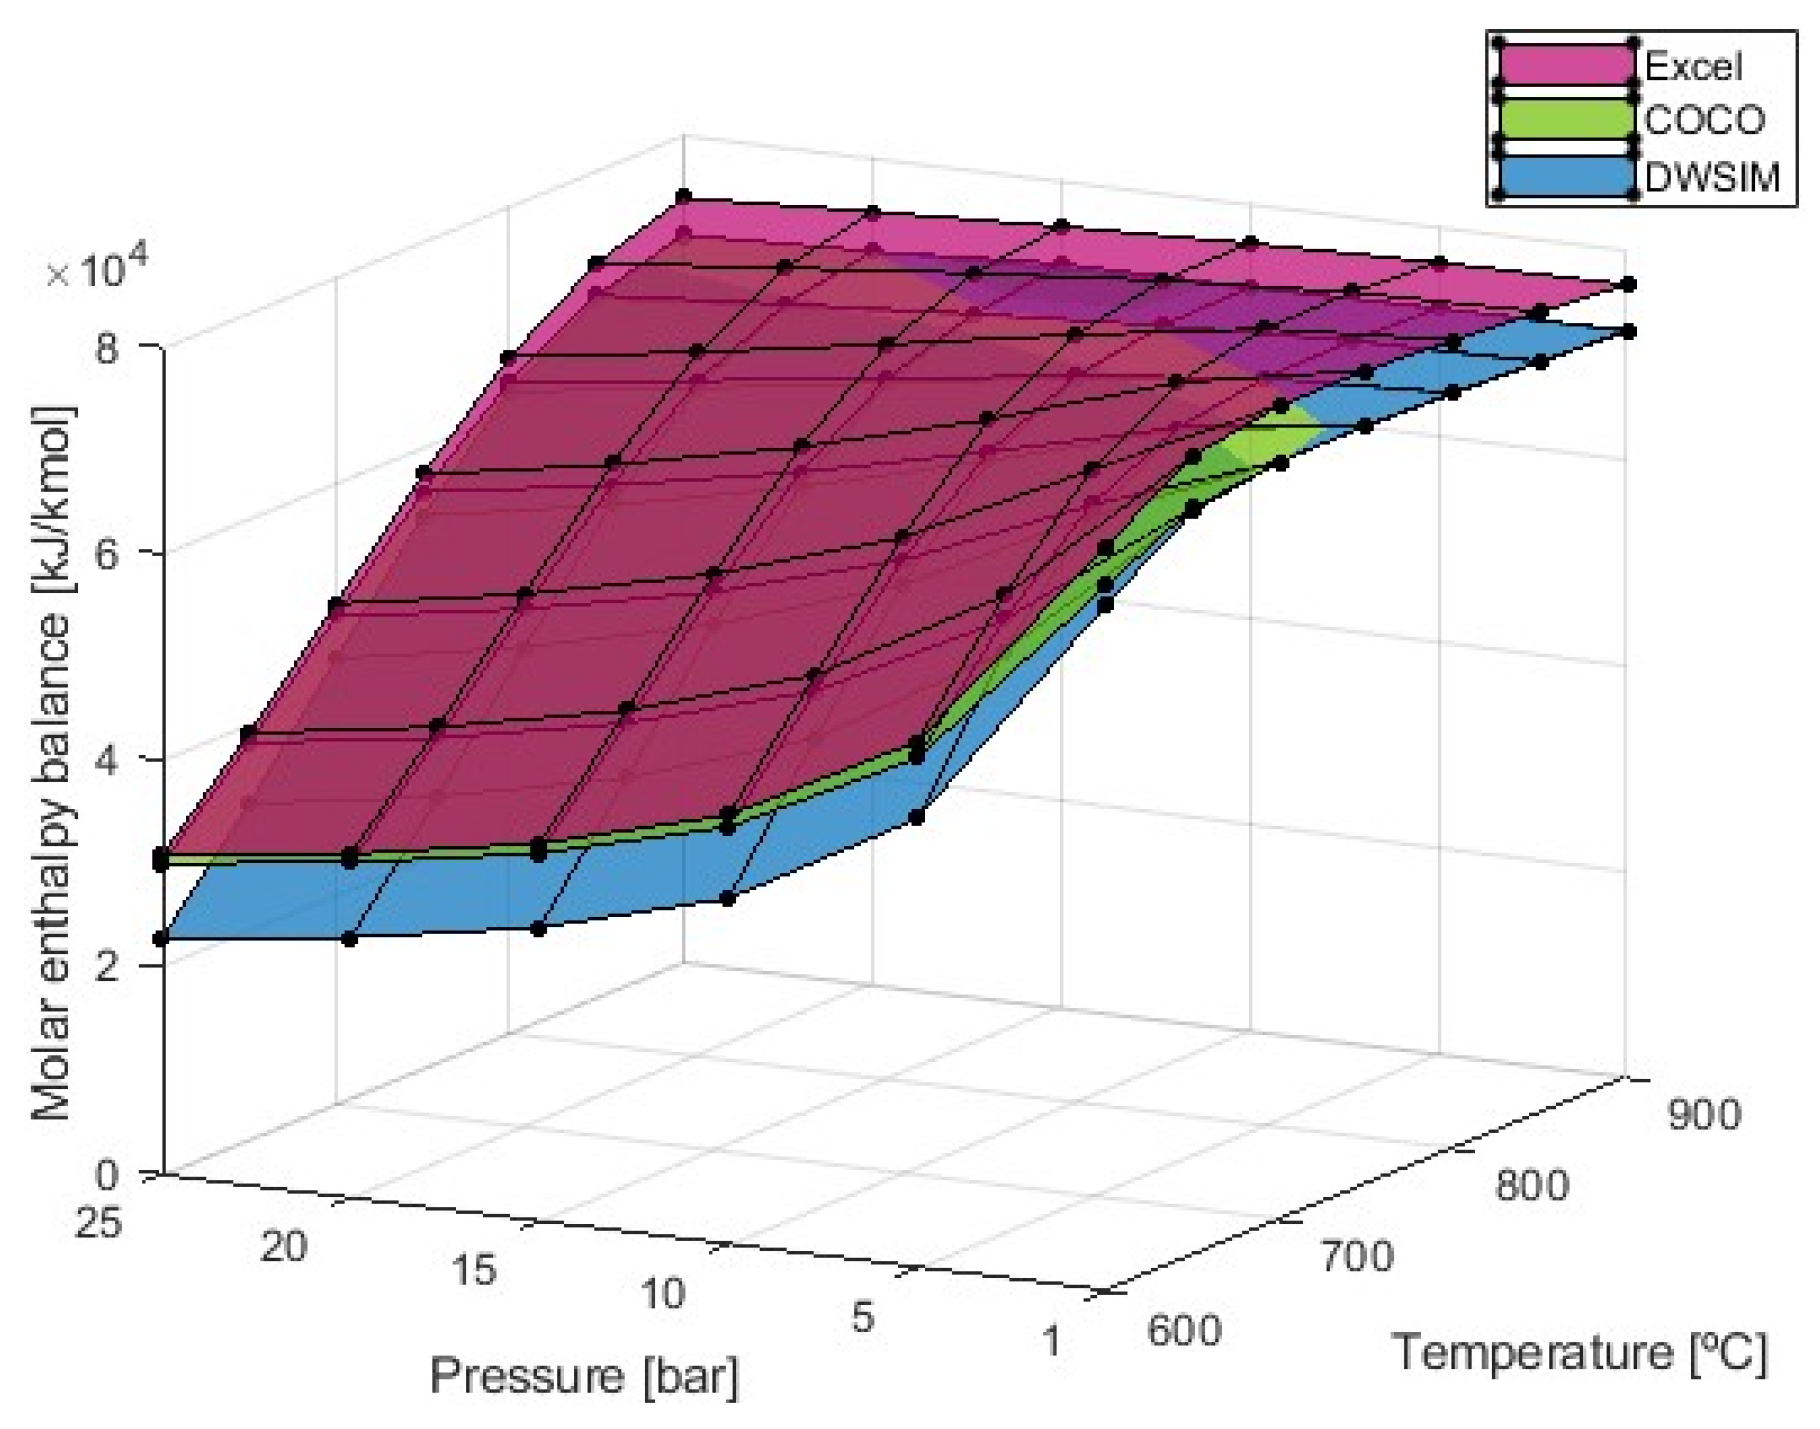
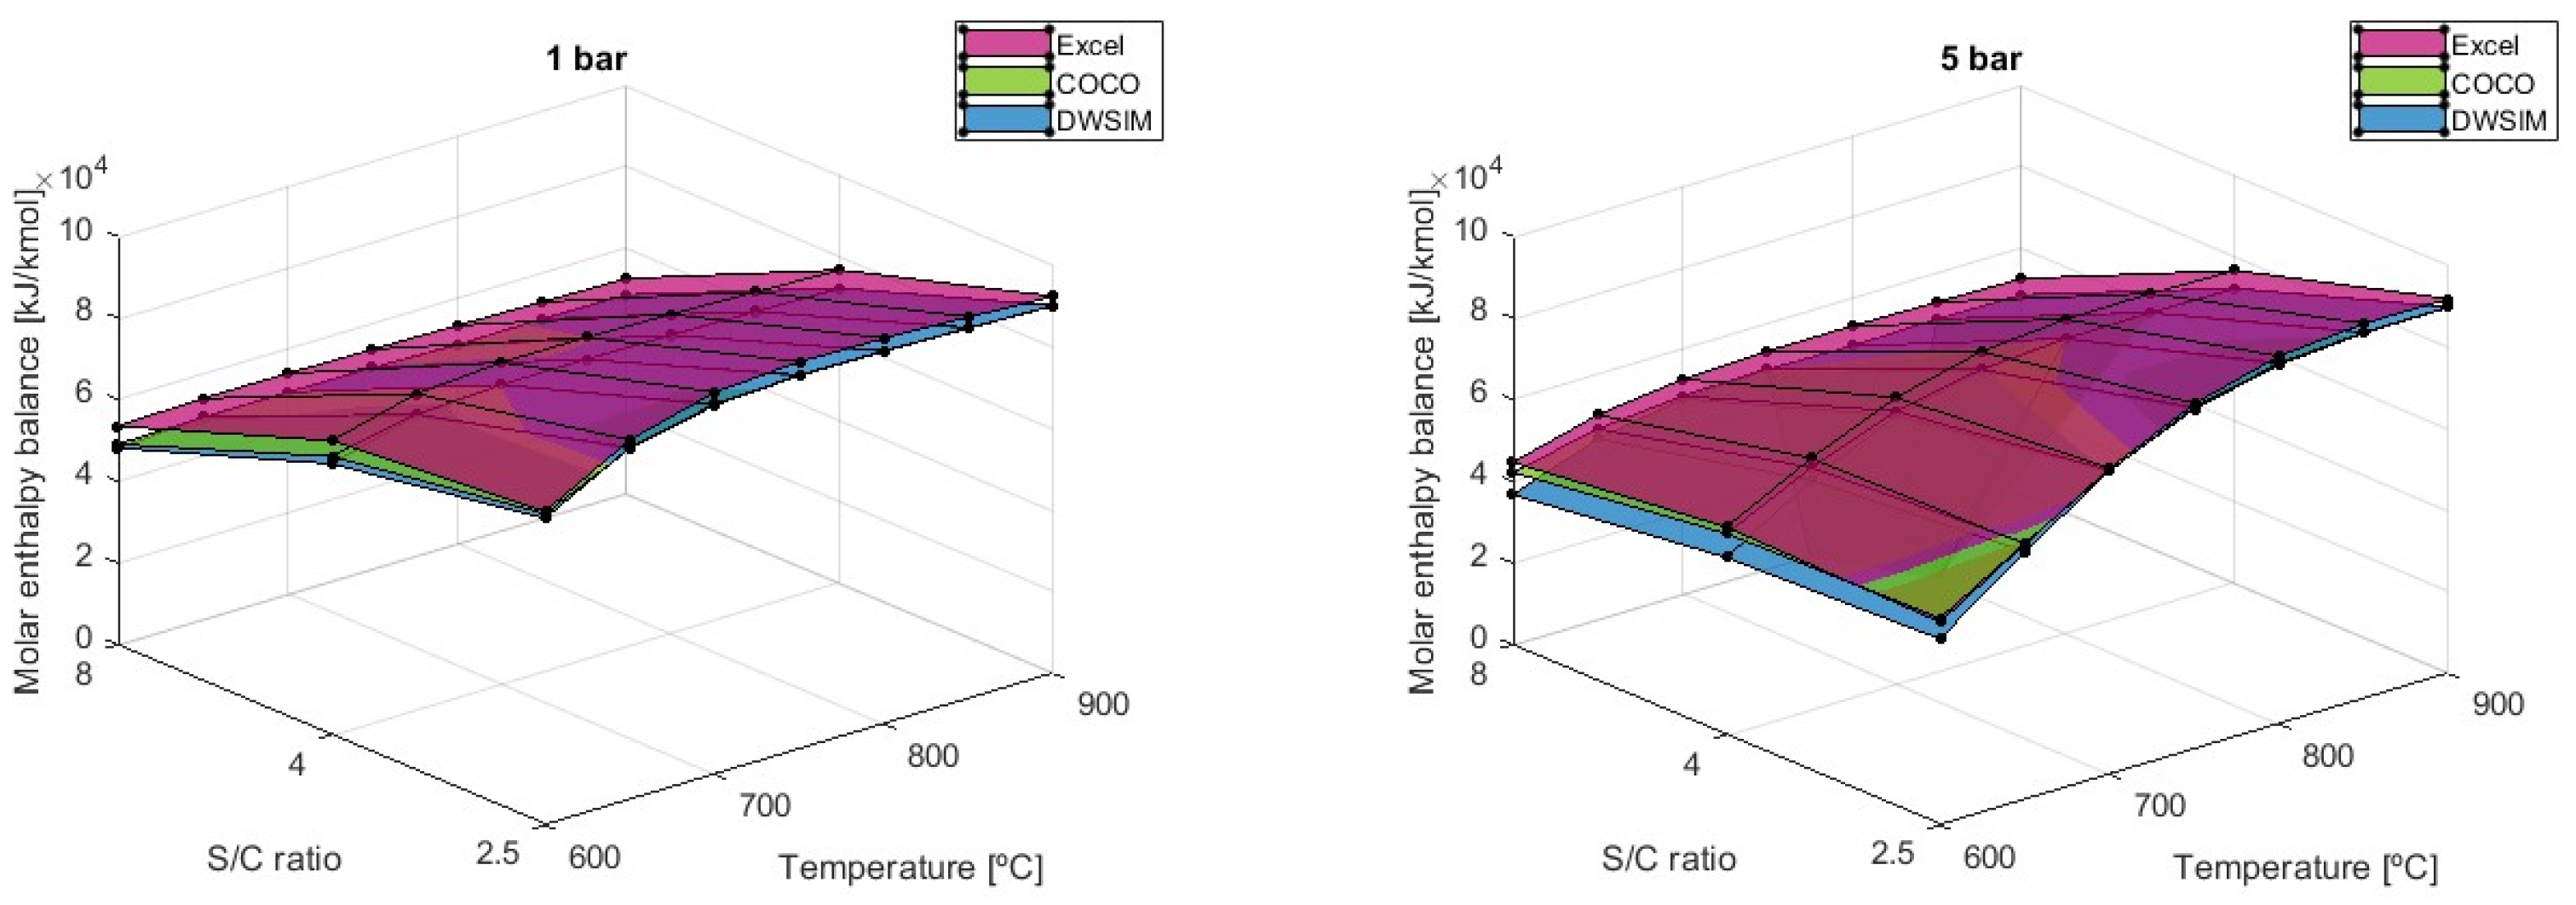
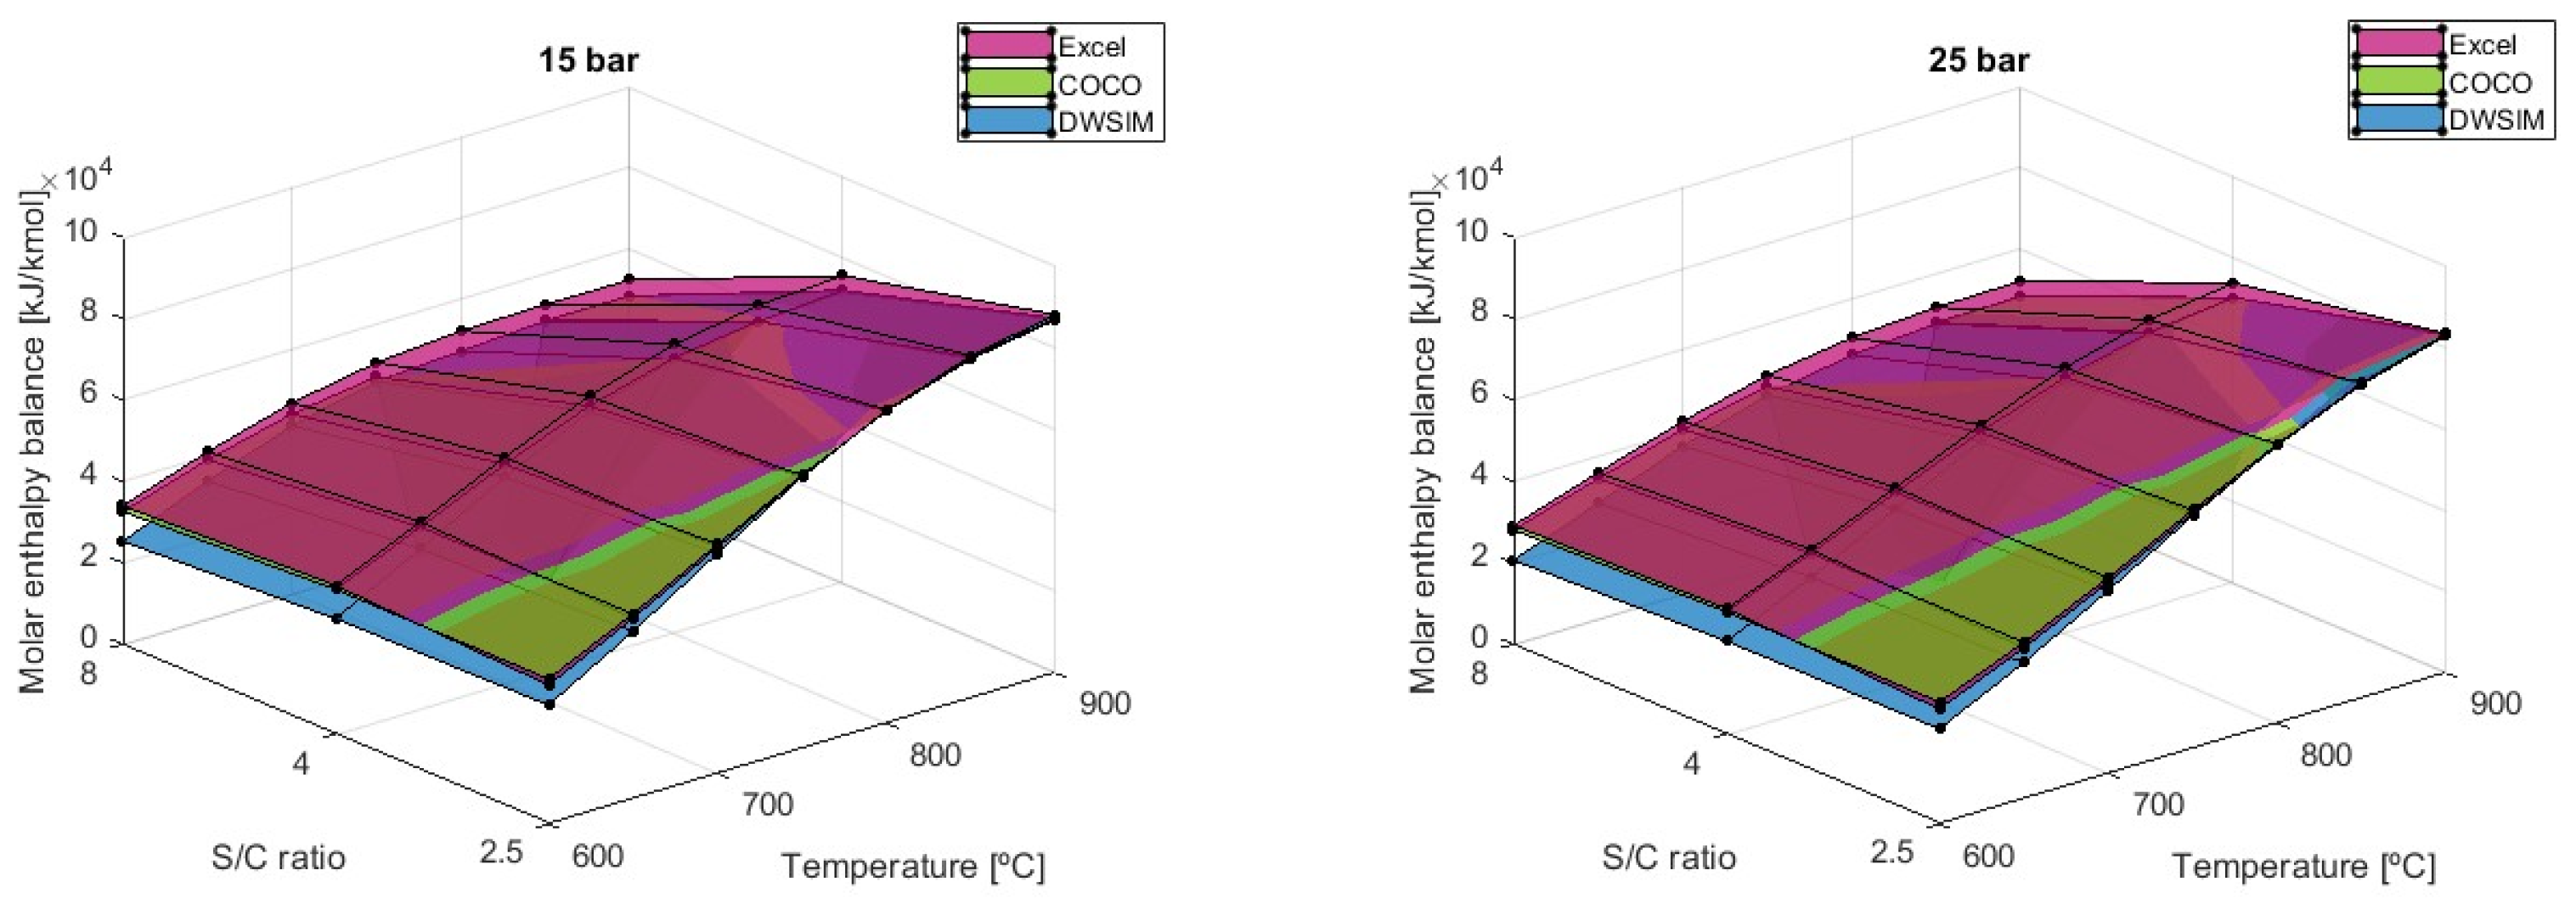
Evaluating the impact factor of the production of carbonaceous products resulting from the studied reactions is important given their potential to significantly influence the performance of these processes. As mentioned previously, the formation of coke due to solid particles of carbon during the reaction was not considered. However, carbon oxides were investigated, as depicted in Figure 5.
The formation of carbon monoxide increases with temperature while decreasing with pressure. The results from both numerical models converge to 0.074 at 900 °C and 1 bar of pressure, representing the conditions where the maximum values of CO formation are observed. However, simulations conducted through the analytical method have produced higher values, with a progressively increasing deviation as temperatures rise, when compared to the results obtained from the numerical models. Under conditions of maximum CO formation, the results from the Microsoft Excel simulations are 16.19% higher than the values obtained from both COCO and DWSIM.
Carbon dioxide formation exhibits distinct behavior compared to carbon monoxide. The results presented in Figure 6 show that X C O 2 decreases with rising temperatures when a pressure of 1 bar is used. On the other hand, when higher pressures are applied, X C O 2 will initially increase until a certain value of temperature is reached. This temperature will be dependent on the pressure used. The simulations performed have shown that this reference temperature is 650 °C at P = 5 bar, 700 °C for P = 10 bar and P = 15 bar, and 750 °C for P = 20 bar and P = 25 bar. From these reference points, higher temperatures will eventually lead to a decrease in X C O 2 due to the exothermic nature of the WGS reaction, which favors CO formation at high temperatures while maintaining the highest CO2 levels at low temperatures; these results were expected. Maximum values of X C O 2 are observed when temperature and pressure are the lowest at 600 °C and 1 bar with an average value of 0.088. When pressure is increased, simulations run using the DWSIM software (v8.6.8) typically produce results that are 15.12% below those obtained using Microsoft Excel and COCO. On the other hand, all three models produced results that were essentially identical at 1 bar of pressure.

3.3. Heat Balance

Figure 7 illustrates the molar enthalpy balance values between the output and input mixture of the reforming reactor. Employing the fuel described in Section 2, the considered fuel intake was 5.16 kmol/min.
The heat balance exhibits a similar behavior to hydrogen production in that it increases with higher temperatures and decreases with higher pressures. Lower reaction temperatures notably affect the required energy, especially when higher pressures are applied. However, at 900 °C, the pressure choice has a minimal influence on the calculated heat balance. The results further indicate that the energy required for the reaction tends to a maximum value with higher temperatures. It was observed that this maximum value is achieved at higher temperatures as pressure increases. The maximum enthalpy balance obtained is 78,871 kJ/kmol at 700 °C, according to simulations from the Microsoft Excel software. According to the numerical models, the results are practically identical at 700 °C, with a heat balance of 73,424 kJ/kmol and beyond this temperature. Only below this temperature do the results from COCO and DWSIM diverge from one another, with the COCO simulation results approaching the Microsoft Excel results at the lowest temperature.

3.4. Steam-to-Carbon Ratio Study (S/C)

The influence of the steam-to-carbon ratio (S/C) can provide different results and is very important regarding catalyst deactivation [30]. The effect of the steam-to-carbon ratio was studied on the reaction indices (CH4 conversion, product outputs, and enthalpy balance) with values of 2.5, 4, and 8. Firstly, the hydrogen production study has shown evidence that lower values of S/C tend to increase the hydrogen molar fraction, as shown in Figure 8.
At lower temperatures, S/C of 2.5 exhibits a slightly higher hydrogen output compared to both the stoichiometric ratio of 4 and 8. The minimum X H 2 output of 0.136 obtained from DWSIM is attained at S/C = 8, T = 600 °C, and P = 25 bar, while the maximum value of 0.577 given by the simulation in Microsoft Excel is achievable at S/C = 2.5, T = 900 °C, and P = 1 bar. In contrast to the simulations from DWSIM, the results from the Microsoft Excel and COCO simulations are very comparable across all the tests run, especially at higher pressures. The results obtained from the analytical model are typically 3.85% and 9.21% higher than the numerical solutions offered by COCO and DWSIM, respectively. At higher temperatures, the hydrogen output rises, but this benefit might not be worth it compared to the additional drawbacks that come with lower S/C ratios. The comparison between our study and the results reported by Carapellucci, R. and Giordano, L. (2020) [31] highlights a slight variation in the X H 2 values under similar conditions. While they obtained a result of 0.56 for an S/C = 2 and P = 10 bar at 800 °C, our study yielded an X H 2 value of 0.52 for an S/C = 2.5 and P = 10 bar at the same temperature in the analytical approach and 0.51 in COCO and DWSIM.
Despite having a higher hydrogen output, the S/C ratio of 2.5 has a less efficient reaction conversion than higher ratios, as demonstrated in Figure 9.
When using the reaction conditions of T = 600 °C and P = 5 bar, the CH4 conversion efficiency can vary from 37.0% using S/C = 2.5 to 76.0% with S/C = 8, according to simulations performed in Microsoft Excel. Another conclusion to be made is that as the S/C ratio increases, as does the conversion efficiency of the reaction, which can also be attained at lower temperatures. As previously mentioned, higher pressures tend to harm the reaction, and as higher-pressure scenarios are simulated, the differences between each model’s results become greater. This time, the COCO simulation results revealed a conversion efficiency that is, on average, 6.14% higher than that of the DWSIM simulation and 8.97% higher than that of the Microsoft Excel model. In general, DWSIM simulations were also 2.40% higher than the analytical model results.
While lower S/C ratios maximize hydrogen production, the carbonaceous products are also more significant and can be accompanied by catalyst problems and worse performance. This is proven by the graph in Figure 10, which translates to the higher values of carbon monoxide that can appear at lower S/C ratios.
The simulations performed have shown that CO formation can severely increase by using lower values of the S/C ratio. Under the given conditions of T = 900 °C and P = 1 bar, the mole fraction of CO increases by 119.72% when the steam-to-carbon ratio (S/C) is reduced from 8 to 4. Furthermore, an additional 66.10% increase in X C O is observed when S/C is further decreased to 2.5 from 4. Both numerical simulation models have provided up-to-par results throughout every reaction condition. The Microsoft Excel model, on the other hand, predicts higher values, in which the difference becomes more significant as higher temperatures are applied.
As for X C O 2 , the lower S/C ratio of 2.5 can attain the maximum output of carbon dioxide when temperatures below 700 °C are used (Figure 11). At 700 °C, the values of X C O 2 are very similar to the S/C ratio of 2.5 and 4.
An S/C ratio of four has been shown to hold the highest output of carbon dioxide when temperatures are equal to or higher than 750 °C across all pressure ranges. It is observable that all three simulation models can provide similar X C O 2 values at low pressure, although a significant difference starts to appear when higher pressures are applied. COCO simulations have shown to differ by 4.01%, on average, compared to the analytical model, while DWSIM results differed by 8.71%. Only a difference of 3.66% is verified when both numerical simulations are compared.
Heat balance is also very influenced by the S/C factor because as the enthalpy of the reactants is much higher and increases slightly, the enthalpy of products increases severely, which leads to a lower heat balance as the S/C ratio goes up, as shown in Figure 12.
However, the analytical model has shown that the enthalpy balance is higher when using an S/C of 4 at a temperature of 600 °C when pressure is 5 bar or above. The same conclusion is drawn when temperatures are at 650 °C with pressure equal to 10 bar and above and when T = 700 °C with P ≥ 20 bar. It was determined that at a fixed temperature, the pressure rise will gradually narrow the gap between values obtained for each S/C ratio and that the maximum heat balance simulated would shift the S/C ratio from 2.5 to 4. Using a fuel intake of 5.16 kmol/min, the resulting heat balance is maximized out at T = 900°C, P = 1 bar, and S/C = 2.5, with an average value of 90,969 kJ/kmol. The results of the COCO simulation differed by −3.71% in terms of heat balance when compared to the analytical model, while the DWSIM results differed by −9.37%. DWSIM simulations on heat balance have demonstrated that there is an average difference of 5.29% between the two numerical solutions when compared to the outcomes from the COCO simulation.

4. Conclusions

The thermodynamic analysis conducted in this study underscores the importance of considering various reaction conditions when idealizing a steam methane reforming process. Hydrogen production exhibited a direct correlation with rising temperatures, peaking at 700 °C, and a converse relationship with increasing pressure. Lower steam-to-carbon (S/C) ratios, particularly at 2.5, maximized hydrogen output but at the expense of reduced CH4 conversion efficiency. The formation of CO increased with temperature but decreased with pressure, showcasing a trade-off with hydrogen production. Notably, Microsoft Excel simulations displayed significantly higher CO values than COCO and DWSIM, particularly at elevated temperatures. Additionally, CO2 formation demonstrated complex behavior, peaking at lower temperatures and pressures, with DWSIM consistently showing lower values than Microsoft Excel and COCO. The heat balance increased with higher temperatures but decreased with higher pressures, reaching a maximum at 700 °C. Lower S/C ratios, especially at 2.5, maximized heat balance at specific temperature and pressure conditions, emphasizing the impact of enthalpy differences. While higher temperatures and lower pressures generally favored hydrogen production and efficiency, the choice of S/C ratio needs careful consideration to balance enhanced hydrogen concentration with potential challenges related to carbonaceous products and catalyst performance.
The comparative analysis with the literature underscored the variations in X H 2 values, highlighting the influence of methodological differences and specific conditions on the outcomes. The software comparison among Microsoft Excel, COCO, and DWSIM revealed consistent trends, with differences attributed to model complexities and solver methods. COCO tended to provide higher values in hydrogen production, CO, and CO2 compared to DWSIM, while Microsoft Excel often showed higher CO values. The DWSIM results, on average, are 6.42% lower than those from COCO. The COCO simulations differ by 3.01% from the Microsoft Excel method, while the DWSIM results exhibit a larger difference of 10.42%. This disparity can be attributed to the analytical method’s limitations, where the possible dry reforming reaction of methane (due to the small CO2 content) was not included. Nonetheless, analytical models using Microsoft Excel have proven to be highly effective, providing results comparable to numerical software, although the efficacy depends on the intake fuel considered and the constraints of solving the material balance equation system.

Author Contributions

Conceptualization, A.B.; methodology, A.B., B.V. and M.O.; validation, A.B., M.O. and B.V.; formal analysis, A.B., M.O. and B.V.; investigation, A.B. and B.V.; data curation, A.B.; writing—original draft preparation, B.V. and A.B.; writing—review and editing, M.O. and A.B.; visualization, A.B. and B.V.; supervision, A.B. All authors have read and agreed to the published version of the manuscript.

Funding

This research received no external funding.

Data Availability Statement

The data presented in this study are available upon request from the corresponding author. The data are not publicly available due to institutional indications.

Conflicts of Interest

The authors declare no conflicts of interest.

References

  1. De Medeiros, F.G.M.; Lopes, F.W.B.; de Vasconcelos, B.R. Prospects and Technical Challenges in Hydrogen Production through Dry Reforming of Methane. Catalysts 2022, 12, 363. [Google Scholar] [CrossRef]
  2. Haryanto, A.; Fernando, S.; Murali, N.; Adhikari, S. Current Status of Hydrogen Production Techniques by Steam Reforming of Ethanol: A Review. Energy Fuels 2005, 19, 2098–2106. [Google Scholar] [CrossRef]
  3. Rosen, M.A.; Koohi-Fayegh, S. The prospects for hydrogen as an energy carrier: An overview of hydrogen energy and hydrogen energy systems. Energy Ecol. Environ. 2016, 1, 10–29. [Google Scholar] [CrossRef]
  4. Elam, C.C.; Padró, C.E.; Sandrock, G.; Luzzi, A.; Lindblad, P.; Hagen, E.F. Realizing the hydrogen future: The International Energy Agency’s efforts to advance hydrogen energy technologies. Int. J. Hydrogen Energy 2003, 28, 601–607. [Google Scholar] [CrossRef]
  5. Cipriani, G.; Di Dio, V.; Genduso, F.; La Cascia, D.; Liga, R.; Miceli, R.; Galluzzo, G.R. Perspective on hydrogen energy carrier and its automotive applications. Int. J. Hydrogen Energy 2014, 39, 8482–8494. [Google Scholar] [CrossRef]
  6. Simpson, A.P.; Lutz, A.E. Exergy analysis of hydrogen production via steam methane reforming. Int. J. Hydrogen Energy 2007, 32, 4811–4820. [Google Scholar] [CrossRef]
  7. Lee, S.; Kim, H.S.; Park, J.; Kang, B.M.; Cho, C.-H.; Lim, H.; Won, W. Scenario-Based Techno-Economic Analysis of Steam Methane Reforming Process for Hydrogen Production. Appl. Sci. 2021, 11, 6021. [Google Scholar] [CrossRef]
  8. Wang, J.; Liu, Z.; Ji, C.; Liu, L. Heat Transfer and Reaction Characteristics of Steam Methane Reforming in a Novel Composite Packed Bed Microreactor for Distributed Hydrogen Production. Energies 2023, 16, 4347. [Google Scholar] [CrossRef]
  9. Richter, J.; Rachow, F.; Israel, J.; Roth, N.; Charlafti, E.; Günther, V.; Flege, J.I.; Mauss, F. Reaction Mechanism Development for Methane Steam Reforming on a Ni/Al2O3 Catalyst. Catalysts 2023, 13, 884. [Google Scholar] [CrossRef]
  10. Shagdar, E.; Lougou, B.G.; Shuai, Y.; Ganbold, E.; Chinonso, O.P.; Tan, H. Process analysis of solar steam reforming of methane for producing low-carbon hydrogen. RSC Adv. 2020, 10, 12582–12597. [Google Scholar] [CrossRef] [PubMed]
  11. Van Beurden, P. On the Catalytic Aspects of Steam-Methane Reforming; Technical Report I04-003; Energy Research Centre of the Netherlands (ECN): Amsterdam, The Netherlands, 2004. [Google Scholar]
  12. Hou, K.; Hughes, R. The kinetics of methane steam reforming over a Ni/α-Al2O catalyst. Chem. Eng. J. 2001, 82, 311–328. [Google Scholar] [CrossRef]
  13. Barnoon, P.; Toghraie, D.; Mehmandoust, B.; Fazilati, M.A.; Eftekhari, S.A. Comprehensive study on hydrogen production via propane steam reforming inside a reactor. Energy Rep. 2021, 7, 929–941. [Google Scholar] [CrossRef]
  14. Ramantani, T.; Evangeliou, V.; Kormentzas, G.; Kondarides, D.I. Hydrogen production by steam reforming of propane and LPG over supported metal catalysts. Appl. Catal. B Environ. 2022, 306, 121129. [Google Scholar] [CrossRef]
  15. Stefanidis, G.D.; Vlachos, D.G. Intensification of steam reforming of natural gas: Choosing combustible fuel and reforming catalyst. Chem. Eng. Sci. 2010, 65, 398–404. [Google Scholar] [CrossRef]
  16. Jeong, H.; Kang, M. Hydrogen production from butane steam reforming over Ni/Ag loaded MgAl2O4 catalyst. Appl. Catal. B Environ. 2010, 95, 446–455. [Google Scholar] [CrossRef]
  17. Avcı, A.K.; Trimm, D.L.; Aksoylu, A.; Önsan, Z. Hydrogen production by steam reforming of n-butane over supported Ni and Pt-Ni catalysts. Appl. Catal. A Gen. 2004, 258, 235–240. [Google Scholar] [CrossRef]
  18. Sá, S.; Silva, H.; Brandão, L.; Sousa, J.M.; Mendes, A. Catalysts for methanol steam reforming—A review. Appl. Catal. B Environ. 2010, 99, 43–57. [Google Scholar] [CrossRef]
  19. Iulianelli, A.; Ribeirinha, P.; Mendes, A.; Basile, A. Methanol steam reforming for hydrogen generation via conventional and membrane reactors: A review. Renew. Sustain. Energy Rev. 2014, 29, 355–368. [Google Scholar] [CrossRef]
  20. Contreras, J.; Salmones, J.; Colín-Luna, J.; Nuño, L.; Quintana, B.; Córdova, I.; Zeifert, B.; Tapia, C.; Fuentes, G. Catalysts for H2 production using the ethanol steam reforming (a review). Int. J. Hydrogen Energy 2014, 39, 18835–18853. [Google Scholar] [CrossRef]
  21. Kim, T.W.; Park, J.C.; Lim, T.-H.; Jung, H.; Chun, D.H.; Lee, H.T.; Hong, S.; Yang, J.-I. The kinetics of steam methane reforming over a Ni/γ-Al2O3 catalyst for the development of small stationary reformers. Int. J. Hydrogen Energy 2015, 40, 4512–4518. [Google Scholar] [CrossRef]
  22. Kokka, A.; Petala, A.; Panagiotopoulou, P. Support Effects on the Activity of Ni Catalysts for the Propane Steam Reforming Reaction. Nanomaterials 2021, 11, 1948. [Google Scholar] [CrossRef]
  23. Christensen, K.; Chen, D.; Lødeng, R.; Holmen, A. Effect of supports and Ni crystal size on carbon formation and sintering during steam methane reforming. Appl. Catal. A Gen. 2006, 314, 9–22. [Google Scholar] [CrossRef]
  24. Zalazar-Garcia, D.; Fernandez, A.; Rodriguez-Ortiz, L.; Torres, E.; Reyes-Urrutia, A.; Echegaray, M.; Rodriguez, R.; Mazza, G. Exergo-ecological analysis and life cycle assessment of agro-wastes using a combined simulation approach based on Cape-Open to Cape-Open (COCO) and SimaPro free-software. Renew. Energy 2022, 201, 60–71. [Google Scholar] [CrossRef]
  25. Van Baten, J.M. An introduction to COCO. In Proceedings of the AIChE Annual Meeting, Salt Lake City, UT, USA, 4–9 November 2007. [Google Scholar]
  26. Jain, R.; Moudgalya, K.M.; Fritzson, P.; Pop, A. Development of a Thermodynamic Engine in OpenModelica. In Proceedings of the 12th International Modelica Conference, Prague, Czech Republic, 15–17 May 2017; pp. 89–99. [Google Scholar]
  27. Li, Y.; Wang, Y.; Zhang, X.; Mi, Z. Thermodynamic analysis of autothermal steam and CO2 reforming of methane. Int. J. Hydrogen Energy 2008, 33, 2507–2514. [Google Scholar] [CrossRef]
  28. Pashchenko, D. Thermodynamic equilibrium analysis of steam methane reforming based on a conjugate solution of material balance and law action mass equations with the detailed energy balance. Int. J. Energy Res. 2020, 44, 438–447. [Google Scholar] [CrossRef]
  29. Di Nardo, A.; Portarapillo, M.; Russo, D.; Di Benedetto, A. Hydrogen production via steam reforming of different fuels: Thermodynamic comparison. Int. J. Hydrogen Energy 2024, 55, 1143–1160. [Google Scholar] [CrossRef]
  30. Nieva, M.A.; Villaverde, M.M.; Monzón, A.; Garetto, T.F.; Marchi, A.J. Steam-methane reforming at low temperature on nickel-based catalysts. Chem. Eng. J. 2014, 235, 158–166. [Google Scholar] [CrossRef]
  31. Carapellucci, R.; Giordano, L. Steam, dry and autothermal methane reforming for hydrogen production: A thermodynamic equilibrium analysis. J. Power Sources 2020, 469, 228391. [Google Scholar] [CrossRef]
Figure 1. Chemical process simulation diagram using COCO software.
Reactions 05 00011 g001
Figure 2. Chemical process simulation diagram using DWSIM.
Reactions 05 00011 g002
Figure 3. X H 2 resulting from the SMR simulation process with S/C = 4.
Reactions 05 00011 g003
Figure 4. C H 4 conversion efficiency study with S/C = 4.
Reactions 05 00011 g004
Figure 5. X C O obtained from the SMR simulation process with S/C = 4.
Reactions 05 00011 g005
Figure 6. X C O 2 fraction obtained from the SMR simulation process with S/C = 4.
Reactions 05 00011 g006
Figure 7. Molar enthalpy balance obtained from the SMR simulation process.
Reactions 05 00011 g007
Figure 8. X H 2 results comparison for different S/C ratios.
Reactions 05 00011 g008
Figure 9. C H 4 conversion efficiency results comparison for different S/C ratios.
Reactions 05 00011 g009aReactions 05 00011 g009b
Figure 10. X C O results comparison for different S/C ratios.
Reactions 05 00011 g010
Figure 11. X C O 2 results comparison for different S/C ratios.
Reactions 05 00011 g011
Figure 12. Molar heat balance results comparison for different S/C ratios (Fuel intake = 5.16 kmol/min).
Reactions 05 00011 g012aReactions 05 00011 g012b
Table 1. X H 2 resulting from the SMR simulation process with S/C = 4.
TemperatureSoftware1 Bar
600 °CExcel0.461
COCO0.441
DWSIM0.430
700 °CExcel0.489
COCO0.459
DWSIM0.459
800 °CExcel0.481
COCO0.451
DWSIM0.451
900 °CExcel0.472
COCO0.443
DWSIM0.443
Disclaimer/Publisher’s Note: The statements, opinions and data contained in all publications are solely those of the individual author(s) and contributor(s) and not of MDPI and/or the editor(s). MDPI and/or the editor(s) disclaim responsibility for any injury to people or property resulting from any ideas, methods, instructions or products referred to in the content.

