1. Introduction
The production of biodiesel yields approximately 10% by weight of glycerol as a by-product. This compound is widely used in the food and beverage industry, in pharmaceutical applications as a solvent and humectant, and in cosmetic applications as an emollient and emulsifier for creams. It is also widely used as an ingredient in toiletries and cosmetics such as toothpastes, lotions, shaving creams, deodorants and make-up [
1,
2,
3]. However, its reactivity makes it a raw material for the synthesis of other chemical compounds, which are currently obtained by petrochemical methods [
4,
5]. For example, the hydrogenolysis of glycerol leads to the formation of glycols and propanols [
6,
7,
8].
In particular, 1-propanol (1-POH) is an important chemical product which is currently obtained by the hydroformylation of ethylene [
9,
10]. It is used in the production of printing inks, rubber, paints, essential oils, antifreeze, brake fluids and cosmetic lotions. In particular, the synthesis of glycols has received more attention in the literature than the synthesis of propanols [
2,
11,
12].
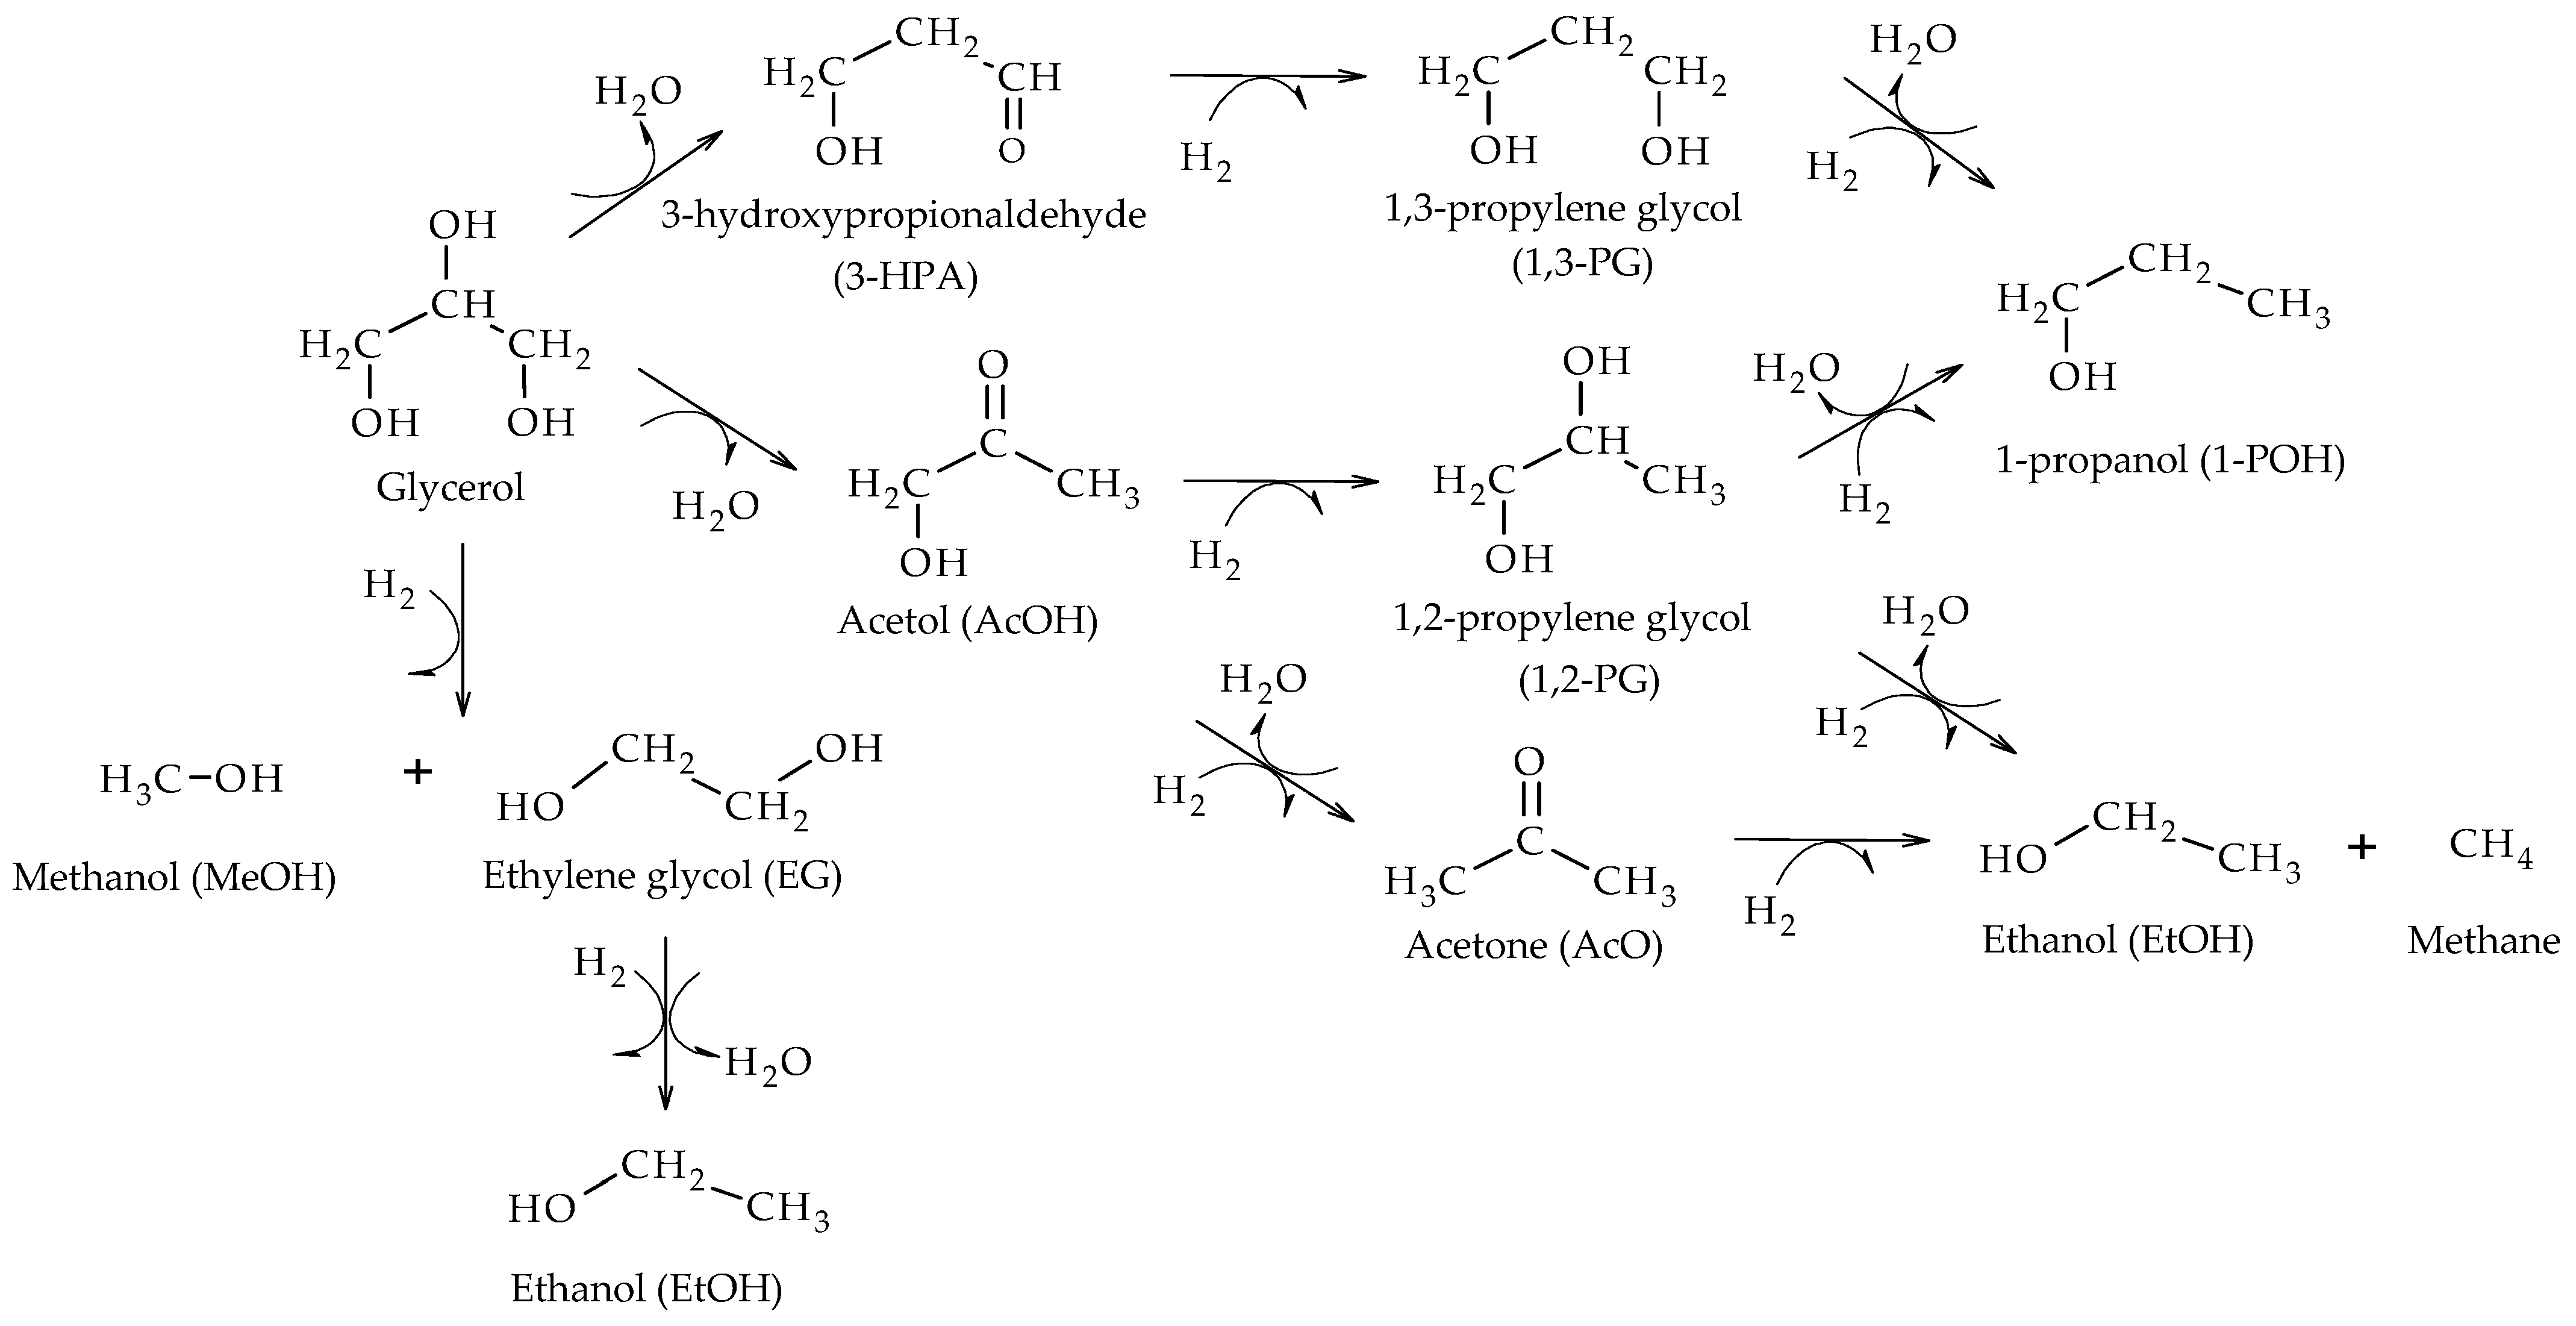
The hydrogenolysis of glycerol takes place through a first dehydration stage of C-O bond cleavage reactions and subsequent hydrogenation stages [
13]. Then, 1-propanol (1-POH) is produced from the additional hydrogenolysis of 1,2-propylene glycol (1,2-PG) and 1,3-propylene glycerol (1,3-PG). In addition, C–C bond cleavage reactions form ethylene glycol (EG) and methanol (MeOH), while ethanol (EtOH) would be produced through EG hydrogenolysis or the degradation of acetone (AcO) and 1,2-PG. The complex set of reactions is shown in
Scheme 1.
As regards the metallic phases, noble metals such as Ru [
14,
15], Pt [
16,
17,
18] and Pd [
19,
20] are very active for the hydrogenation of glycerol reaction, but they favor undesirable C-C bond cleavage reactions.
Ryneveld et al. evaluated different Pd catalysts supported on Al
2O
3, C, and SiO
2, and found that Pd/Al
2O
3 resulted to be much more active in glycerol hydrogenolysis than Pd/SiO
2 and Pd/C catalysts, because of the grater acidity of Al
2O
3 compared to that of SiO
2 and C. Pd/Al
2O
3 showed 19% of glycerol conversion with 10% selectivity to 1-POH compared to Pd/SiO
2 and Pd/C that both showed almost 2% glycerol conversion, at 180 °C, 8 MPa H
2 initial pressure and 24 h of reaction. However, Pd/Al
2O
3 catalyst favors undesirable C-C cleavage bond reactions, that led to the formation of secondary products, such as EG, EtOH and MeOH. If operative conditions are optimized, Pd/C although, can achieve 38% of glycerol conversion with 52% selectivity to 1-POH, at a temperature reaction of 250 °C, 8 MPa of H
2 pressure and 24 h. Moreover, authors showed that Ru/C, under the same operative conditions, can reach a ~99% of glycerol conversion with low selectivity towards 1-POH (~18%), due to C-C cleavage bond reactions [
12].
Zhu et al. obtained propanols with high selectivity (~80%) and a glycerol conversion of 100% at 200 °C and 5 MPa of H
2, employing 10 wt.% of glycerol solutions in water and 0.045 h
−1 of space velocity in a liquid-phase continuous flow reactor. These authors employed Pt catalysts supported over ZrO
2 modified with HSiW, which presented a good balance between acid sites and surface-active species for hydrogenation [
17].
Bhanuchander et al. used a Pt-supported catalyst on TiP in vapor phase hydrogenolysis at 220 °C and 0.1 MPa of H
2, using 10 wt.% glycerol solutions and 1.02 h
−1 of space velocity (WHSV). The authors obtained a glycerol conversion of 100% and a high selectivity towards 1-POH (~87%), attributing these results to the strength of the acid sites and the high dispersion of Pt atoms [
2]. The same conclusions were reached by Priya et al. who used Pt catalysts supported on ZrO
2 modified with phosphotungstic acid [
21].
Other authors studied catalysts based on non-noble metals, such as Shozi et al., who supported Mo and W on SiO
2 and γ-Al
2O
3. The best results were obtained using a Mo/SiO
2 catalyst, achieving 42% of glycerol conversion with ~40% of selectivity towards 1-POH, at a temperature reaction of 325 °C, 6 MPa of H
2, 60 wt.% glycerol in water and 10 h
−1 of space velocity (LHSV) [
18].
Due to their ability to cleave C-O bonds and their lower cost, Ni or Cu-based catalysts could be an interesting alternative [
22]. For example, Ryneveld et al. investigated Ni-supported catalysts over SiO
2 and Al
2O
3. Their results demonstrated that Ni/Al
2O
3 presented the best performance, reaching ~100% conversion of glycerol and ~43% selectivity towards 1-POH at 320 °C, 6 MPa of H
2 and 3 h
−1 of space velocity (LHSV). The authors associated these results to the higher concentration of strong acid sites on the Ni/Al
2O
3 catalyst compared to Ni/SiO
2, which favored the dehydration of glycerol to acetol. Moreover, the Ni/SiO
2 catalyst presented a growth in particles size, to form large clusters which were due to sintering [
23].
Based on the above, a bifunctional catalyst is required, in which the support plays an important role not only in the dispersion of the active phase but also in the suitable surface acidic properties for this reaction.
In order to consider an industrial scale application, it is necessary to have kinetic expressions that allow the appropriate design of reactors. Regarding glycerol hydrogenolysis, studies related to kinetics appear to be limited in the literature and most of them have been carried out in liquid-phase conditions to produce 1,2-PG in batch reactors. In this sense, simple kinetic models based on the power law [
24,
25,
26,
27,
28,
29] and Langmuir-Hinshelwood-Hougen-Watson (LHHW) expressions have been developed, considering one [
29,
30,
31,
32] or two types of active sites [
33,
34,
35,
36,
37]. For most of these catalysts, the stability has never been proved, or as least not reported yet, which is a very crucial topic, as catalyst deactivation is a serious issue in liquid-phase reactions.
In a previous work, we have prepared Ni catalysts supported over a carbon composite (C) modified with Al(H
2PO
4)
3 with contents between 1 and 40 wt.%, which were evaluated in the glycerol hydrogenolysis reaction. We have determined that, for contents between 4 and 10 wt.%, the formation of aluminum phosphates (AlPO
x) and the nickel phosphide phase (Ni
2P) favors the formation of 1-POH [
38]. Then, these catalysts were employed in a two-step reaction process, maximizing the yield at 1-POH [
39].
The aim of this work is to evaluate different operation variables in the glycerol hydrogenolysis reaction such as H2 pressure, temperature, glycerol concentration and water concentration, employing the Ni/C catalyst modified with a 4 wt.% of Al(H2PO4)3 to produce 1-POH. To the best of our knowledge, there is no information on kinetic models developed to describe the formation of 1-POH from glycerol hydrogenolysis, so this research proposes a simple kinetic model based on the power law, useful for the design of industrial-scale reactors.
2. Materials and Methods
2.1. Supports and Catalysts Synthesis
The carbon-based composite (C), employed as support, was prepared from TEOS and a phenolic resin, following a preparation method already described in a previous work [
40]. Then, the C support was modified by impregnating Al(H
2PO
4)
3 to reach a 4 wt.% precursor (from Sigma-Aldrich, Darmstadt, Germany). Finally, the modified support (CPAl) was dried at 110 °C during 24 h and calcined in an oven at 400 °C for 30 min (10 °C min
−1).
The catalyst was prepared by incipient wetness impregnation using NiCl2·6H2O (Sigma-Aldrich) as source of Ni (5 wt.% in the final solid) and ethanol as solvent. The solid obtained, named Ni/CPAl, was dried at 110 °C during 24 h and activated in H2 (50 cm3 min−1) at 400 °C for 90 min (10 °C min−1).
2.2. Characterization
N2 adsorption–desorption measurements were performed at −196 °C using Micromeritics ASAP 2020 equipment (Micromeritics Instrument Corporation, Norcross, GA, USA). Specific surface area calculations were carried out using the Brunauer–Emmett–Teller (BET) method, and the samples were pretreated under vacuum in two stages of 1 h each: the first at 100 °C and the second at 300 °C.
The strength and number of acid sites of the support and the catalyst were determined using potentiometric titration with n-butylamine. The technique was performed by suspending 0.05 g of the solid in acetonitrile and kept under stirring for 3 h. The suspension was titrated with a 0.05 M solution of n-butylamine in acetonitrile. The electrode’s potential variation was registered with a digital pH meter (Metrohm 794 Basic Titrino apparatus with a double junction electrode, purchased by Metrohm, C.A.B.A, Buenos Aires, Argentina).
The nature of the acid–base sites was determined by the isopropanol (IPA) decomposition reaction test. The technique was performed in a continuous-flow fixed-bed reactor between 120 and 300 °C, at atmospheric pressure, with a feed of 4.5% IPA in Helium at 40 cm3 min−1.
X-ray diffractograms were obtained using Cu Kα radiation in a Panalytical X’Pert PRO instrument (Malvern Panalytical Ltd., Malvern, United Kingdom) at a voltage of 40 kV and an amperage of 20 mA, scanning in the 2θ range of 10–70° with a step of 0.02°. PDF charts from the International Center for Diffraction Data were used to identify the crystalline phases.
The solid-state NMR experiments were carried out at room temperature in a 7 T Bruker Avance II-300 spectrometer equipped with a 4 mm MAS probe. The operating frequency for 31P and 27Al was 121.5 and 78.2 MHz, respectively. AlPO4 was used as an external reference for both cores. 31P 1D spectra were recorded using a π/2 pulse (4.8 μs) and a 30 s delay between two pulses. For the 27Al 1D spectra, the π/2 pulse was 1 μs and the recycling delay was 2 s. The spinning rate for all the samples was 10 kHz.
The Ni content of samples was determined by Atomic Absorption Spectrometry. The equipment utilized was an IL Model 457 spectrophotometer (Thermo Fisher Scientific, Waltham, MA, USA), with a single channel and double beam.
Temperature-programmed reduction tests (TPR) were carried out using a conventional dynamic equipment and the response was measured using a TCD and MS detectors. The catalyst samples were calcined in Ar at 300 °C for 180 min. The feed flow was a H2/N2 ratio of 1/9 and the heating rate was 10 °C min−1 from room temperature up to 1000 °C.
Transmission-electron microscopy (TEM) images were taken by means of a TEM JEOL 100 C instrument (JEOL USA, Inc., Peabody, MA, USA), operated at 200 kV. A graphite pattern was used for calibration. In this analysis, a suspension in 2-propanol was prepared by stirring the solid sample with ultrasound for 10 min. To estimate the average diameter volume/area (d
va), the particles were considered spherical, and Equation (1) was used for the calculation, where n
i is the number of particles with diameter d
i.
Histograms of particle size distribution for fresh and used samples were obtained from microphotographs using the technique of clear field image, counting around 200 particles.
2.3. Catalytic Activity Test
A stainless-steel high-pressure reactor BR-100 (Berghof Products + Instruments, Eningen unter Achalm, Germany) was employed to carry out the glycerol hydrogenolysis reactions. The reactor has a volume of 100 mL, operated in batch mode. The magnetic stirring was set at 1000 rpm to ensure kinetically controlled conditions.
The reactor was first purged with nitrogen (Air Liquide, Pacheco, Bs. As., Argentina, 99.99%) and then with hydrogen (Air Liquide, Pacheco, Bs. As., Argentina, 99.99%). The catalyst was previously reduced at 400 °C for 90 min in H2 flow (50 cm3 min−1) using a heating rate of 10 °C min−1.
As the glycerol hydrogenolysis takes place in the liquid phase in the presence of a solid catalyst and gaseous hydrogen, the system is a typical example of a gas–liquid–solid reaction system. For these systems, the absence of internal and external mass and heat transfer resistances must be ensured to develop true kinetic models with valid kinetic expressions. As the reactor contains only a 10% v/v of liquid solution and the remaining volume is occupied by high pressure hydrogen, the gas phase mass transfer resistance can be considered negligible as the gas–liquid interphase is saturated with H2. The absence of external mass transfer was evaluated by varying the stirring speed between 500 and 1000 rpm, verifying that there was no resistance above 750 rpm. Thus, a stirring speed of 1000 rpm was selected to conduct all the experiments. The catalyst was ground to ensure the absence of internal mass transfer resistances. In addition, heat transfer resistances were considered negligible to ensure a uniform temperature within the reactor.
Temperatures of 220–260 °C, 0.5–4 MPa of H2 initial pressure, with 30–80 wt.% aqueous glycerol solutions, catalyst/glycerol mass ratios between 0.05 and 0.16 and reaction times between 0.5 and 8 h were used in the catalytic tests.
After the reaction, the reactor was cooled to room temperature and samples of the liquid and gas phases were taken. A Shimadzu GC-8A chromatograph equipped with a thermal conductivity detector (TCD) with a Hayesep D 100–120 column was used to quantify and identify the gaseous reaction products (Shimadzu Corporation, Tokyo, Japan), and an GCMS-QP505A Shimadzu chromatograph with FID and MS detectors was used to identify and quantify the liquid products (purchased by Agilent, Santa Clara, CA, USA).
The total conversion of glycerol (X
T) was determined using Equation (2).
The conversion of glycerol to liquid products (X
L) was determined using Equation (3).
The conversion of glycerol to gas products (X
G) was determined using Equation (4).
The selectivity of liquid products was defined by Equation (5).
The carbon balance was calculated using Equation (6).
The accuracy of the measurements was within 5%, and the experiments could be reproduced with a relative error of 10%.
2.4. Kinetic Model
As it can be observed in
Scheme 1, the formation of 1,2-propylene glycol (1,2-PG), 1,3-propylene glycol (1,3-PG), ethylene glycol (EG) and methanol (MeOH) proceeds through the reaction between glycerol (Gly) and hydrogen (H
2), releasing water (H
2O) in the case of glycols. However, 1- propanol (1-POH) is produced through the hydrogenolysis of 1,2-PG and 1,3-PG and acetone (AcO) is produced by the hydrogenolysis of acetol (AcOH), which comes from glycerol dehydration. On the other hand, ethanol (EtOH) would be produced through EG hydrogenolysis or the degradation of acetone (AcO) and 1,2-PG. In all cases, the formation equations can be combined to be glycerol, H
2 and H
2O dependent.
A kinetic model based on the power law was proposed because of its simplicity, which makes this type of model very useful for reactor design. In this sense, Equation (7) was proposed to describe the formation rates of each compound j (
).
In Equation (7),
,
and
are the partial orders with respect to glycerol, hydrogen and water, respectively, while
is the kinetic coefficient of the formation rate of compound j. In particular, the overall rate of glycerol consumption (
) was expressed with Equation (8).
The molar concentration of H
2 in the liquid phase (
) was estimated by employing Henry’s constant (
) and considering only the solubility of H
2 in water, using Equation (9), where
is the molar fraction of H
2 in gas phase. Henry’s constant value was corrected by temperature according to Equation (10).
The values of
(T
0) and
at T
o = 298 K were obtained from the NIST (National Institute of Standards and Technology) database [
41].
The formation rates for each compound j (r
j) were calculated with the differential method from the concentration profiles (C
j) versus reaction time (t), adjusting various operative variables such as initial glycerol concentration, initial hydrogen pressure and initial water concentration. The kinetic coefficients (k
j) and the partial reaction orders with respect to glycerol (α
j), hydrogen (β
j) and water (γ
j) were then calculated using multiple linear regression according to Equation (11). To evaluate the deviation of the estimated parameters, a 95% confidence limit was established.
The apparent activation energy (Ea
j) and the pre-exponential factor (k
oj) for the reaction formation of each compound j were then estimated by linearizing Equation (12) (Arrhenius law) using the concentration vs. temperature profiles.
Once the kinetic parameters were determined, the balance equations were numerically integrated using Euler’s method.
3. Results and Discussion
3.1. Support and Catalyst Characterization
Table 1 shows the textural and acid–base properties of the CPAl support and the Ni/CPAl catalyst. By N
2 adsorption–desorption, it was determined that both present type IV isotherm with H3 hysteresis loops, characteristic of mesoporous materials. The isotherms are available in the
Supplementary Materials (Figure S1).
The Ni/CPAl catalyst has a slightly higher SBET value than the corresponding CPAl support, which could be due to the reduction under H2 flow at 400 °C, which can unblock some pores and increase the SBET value. However, the catalyst retains the mesoporosity observed in the support.
The surface acid–base properties of the CPAl support were investigated by potentiometric titration with n-butylamine and the isopropanol decomposition reaction. As it has been reported for carbonaceous supports, potentiometric titration is more suitable to evaluate surface acidity than techniques that use the adsorption of pyridine due to the difficulties caused by the presence of micropores in these materials.
The initial potential (E
i) of the potentiometric titration curves indicates the average strength of the acid sites. In this sense, initial potentials lower than −100 mV indicate that the acid sites are very weak, while initial potentials between −100 and 0 mV indicate that they are weak. On the other hand, if the initial potential is between 0 and 100 mV, the acid sites are strong, while if the initial potential exceeds 100 mV, they are very strong. In addition, the amount of n-butylamine added when the plateau is reached (mmol g
−1) indicates the amount of acid sites present in the solid [
42].
Table 1 shows the results of acid strength and number of acid sites for the CPAl support and the Ni/CPAl catalyst. The titration curves are shown in the
Supplementary Materials (Figure S2). As it can be seen, CPAl has a very strong acid strength (E
i = 254 mV) due to the incorporation of Al-P species [
43]. With respect to the Ni/CPAl catalyst, a significant decrease in the acid strength is observed, which could be due to the reduction treatment under H
2 flow at 400 °C, which would eliminate acid sites from the catalyst.
To determine the nature and strength of the sites present in the catalyst, the isopropanol (IPA) decomposition technique (IPA) was employed. This technique allows the nature of the sites to be identified based on the products generated during decomposition [
44]. These products can be propylene, diisopropyl ether (DIPE) and water by dehydration or acetone and hydrogen by dehydrogenation of IPA. In this sense, the selectivity to propylene and DIPE is related to strong Lewis acid and base surface sites, whereas propylene and acetone are produced in the presence of weak Lewis acid sites or strong base sites. When the only reaction product is propylene, the sites can be either strong Lewis or Brønsted acid sites [
44]. Since the CPAl support has propylene as the only reaction product (
Table 1), this indicates that this material has strong acid sites, which may be Lewis or Bronsted sites.
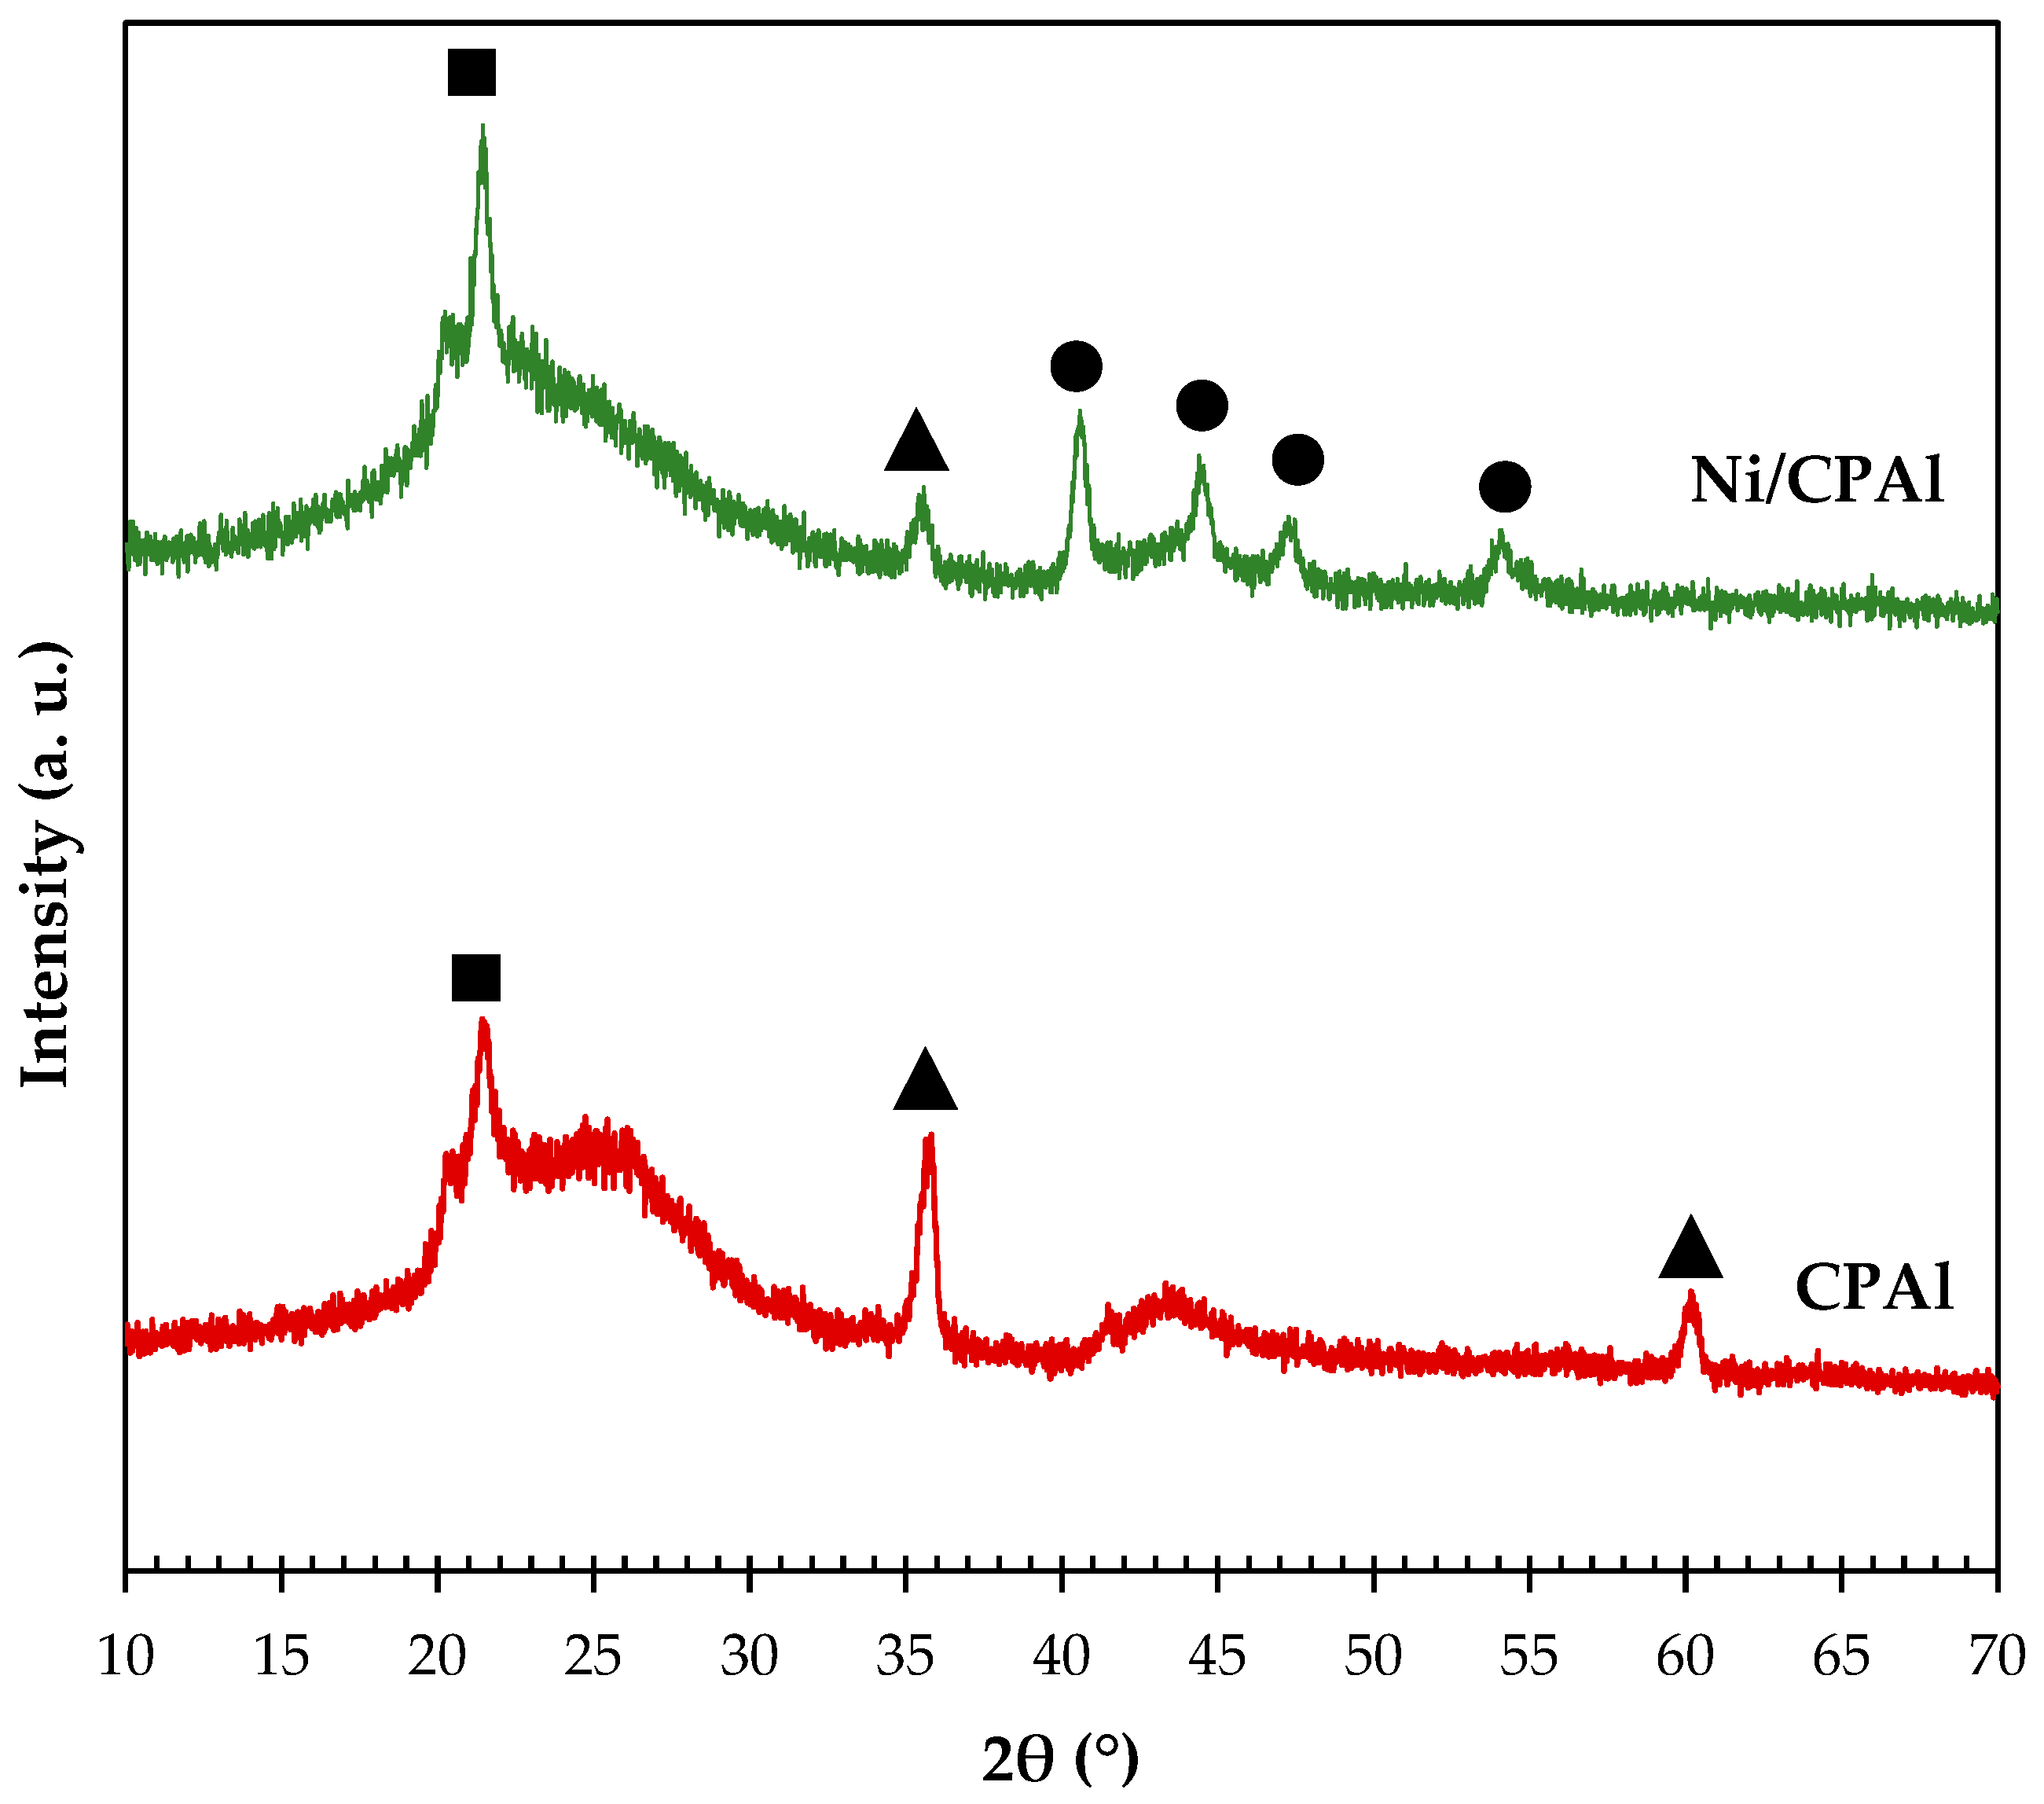
The XRD spectra of the support and the catalyst are shown in
Figure 1. The broad peaks observed in all patterns near 2θ = 20° and 45° are attributed to graphitic planes (002) and (101), respectively. Then, both patterns show a peak at 2θ = 21.8° which is attributed to SiO
2 in the tridymite crystalline phase (■). Two peaks at 2θ = 35.7° and 60.0° are also observed, which are assigned to the (111) and (220) planes of silicon carbide (▲) (JCPDS 22-1316). The presence of Si is due to the use of TEOS during the preparation method. In this sense, a thermogravimetric analysis was performed, confirming a Si content of 14.7 wt.%.
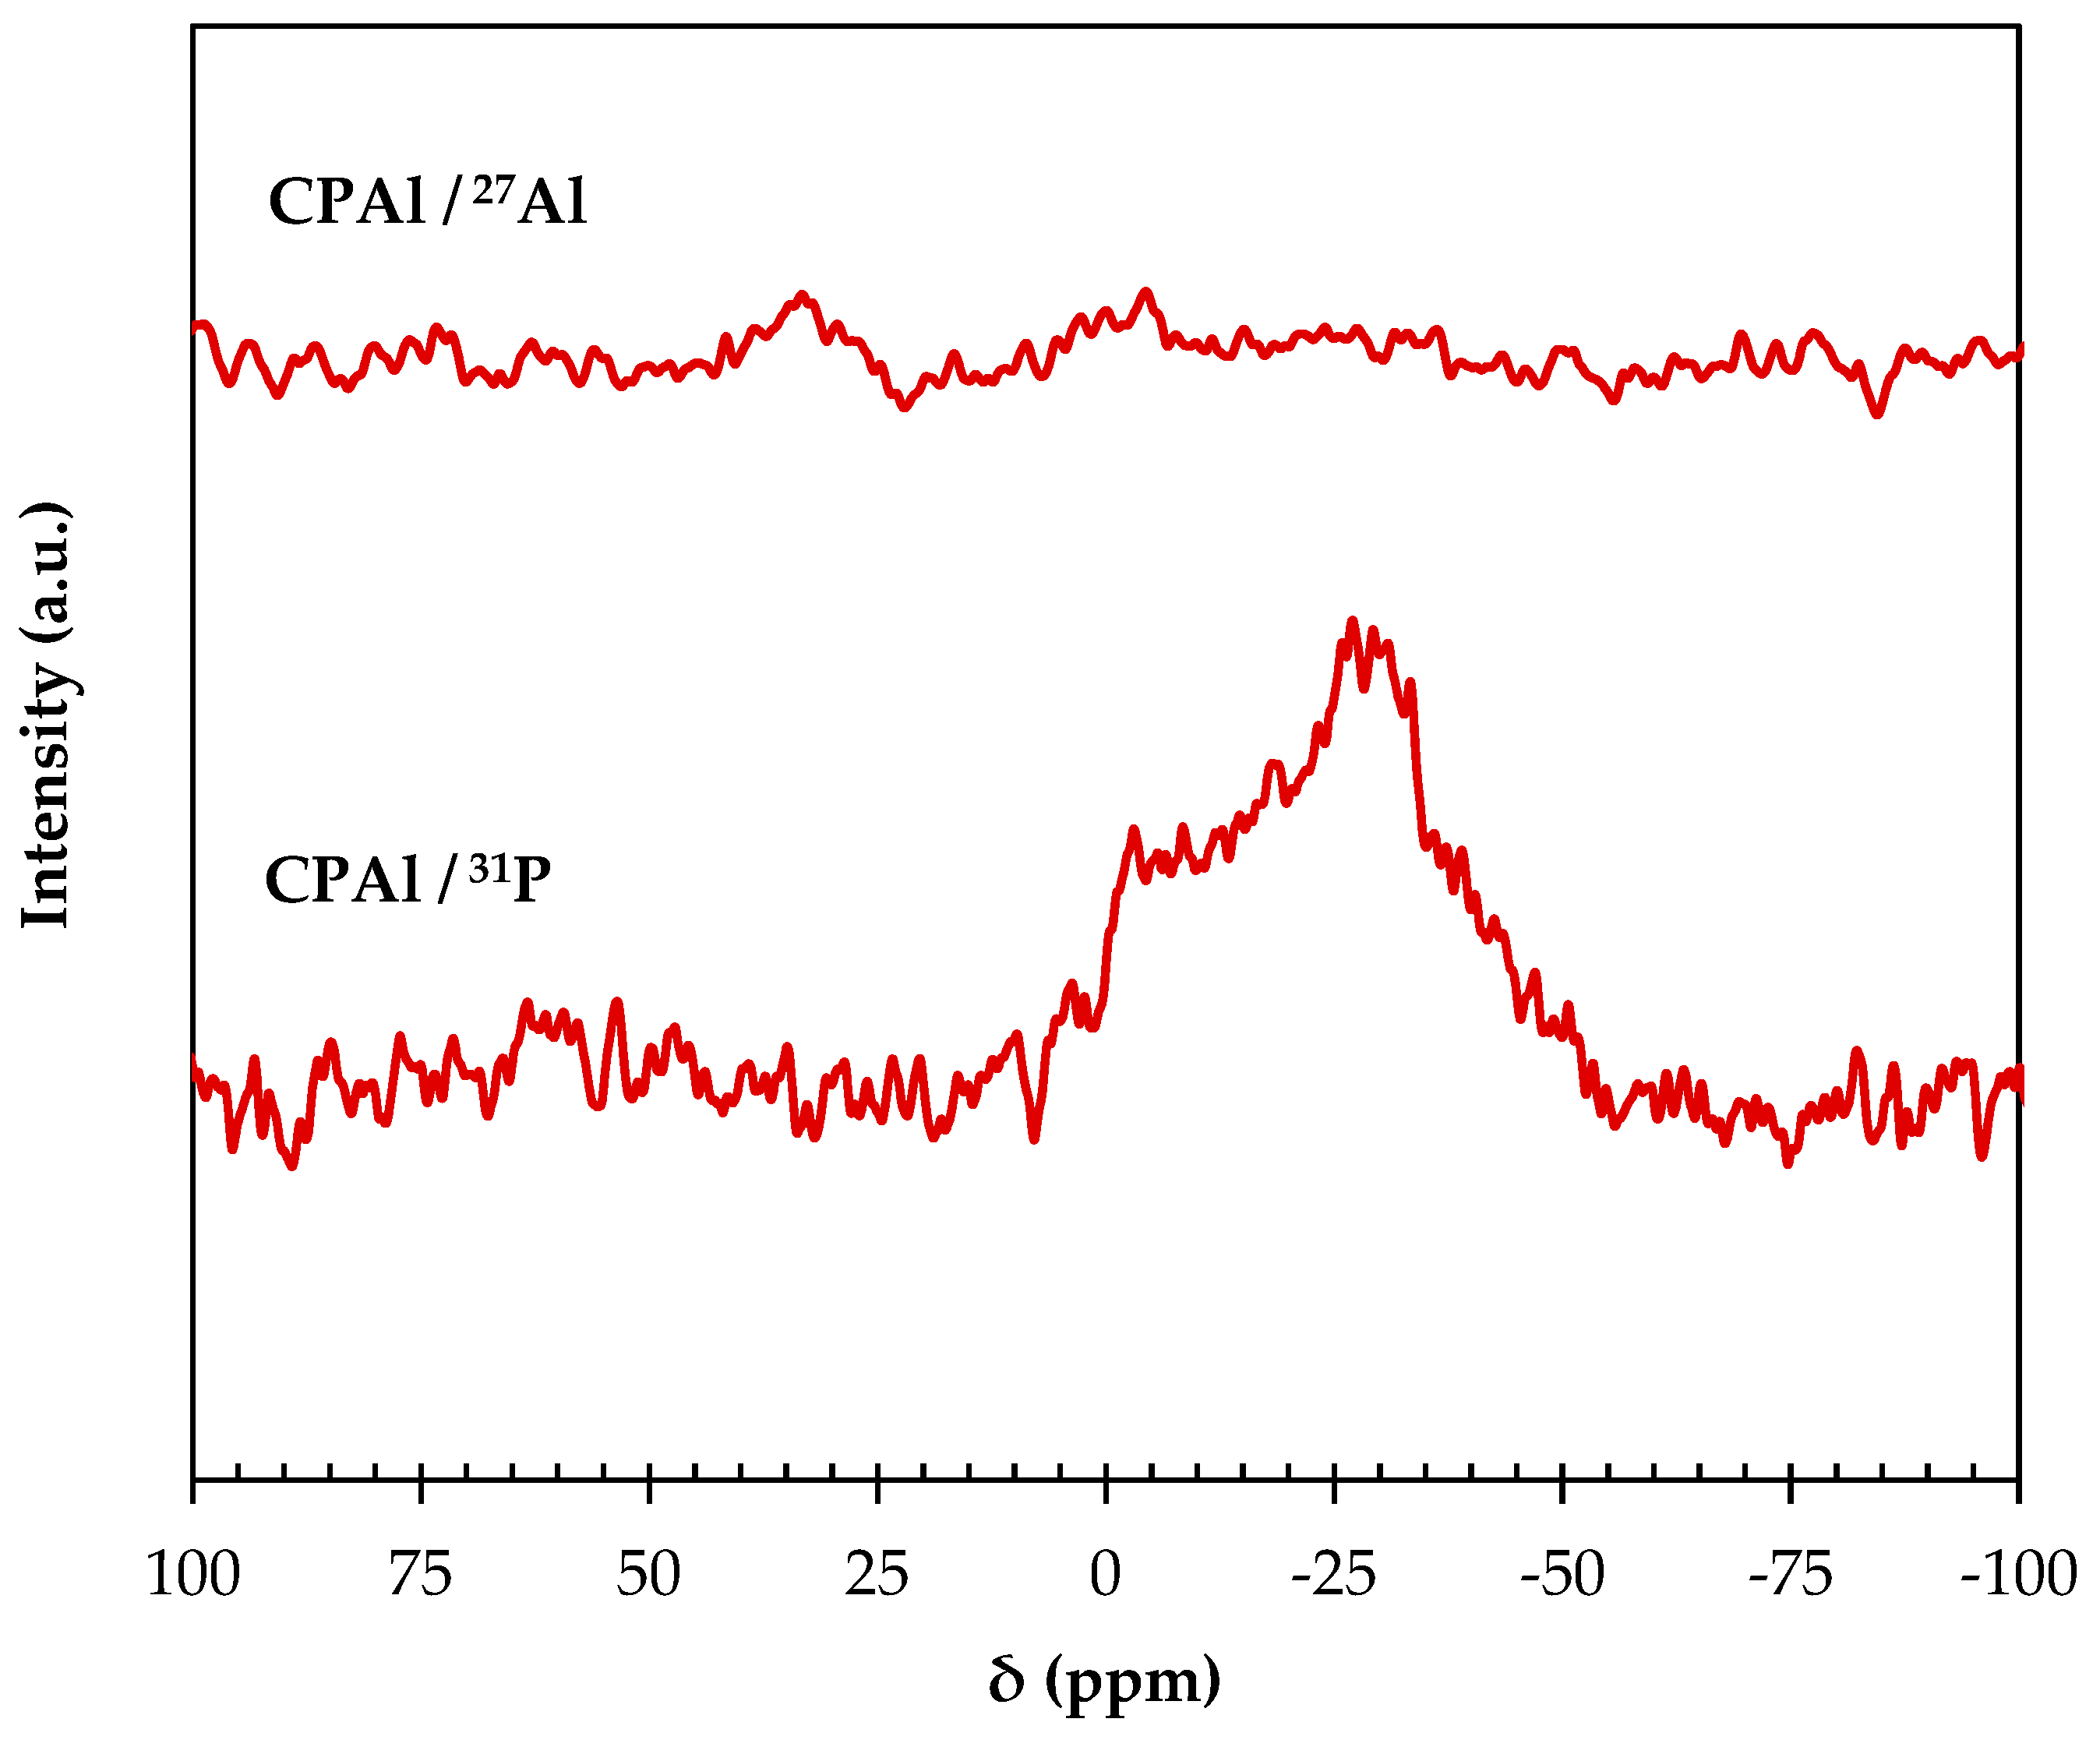
Since it is not possible to observe phases assigned to P and/or Al species in the support by XRD technique, NMR spectroscopy of
31P (P-NMR) and
27Al (Al-NMR) was performed on the CPAl support (
Figure 2). As it can be seen, the P-NMR spectra for the CPAl support shows a band at −27 ppm, which can be attributed to different species of aluminum orthophosphate (AlPO
x) [
45]. The shape of the band indicates that these species are mainly amorphous [
46]. According to the acidity results, these AlPO
x species would act as strong acid sites, which could be Lewis or Brønsted sites. Furthermore, bands associated with aluminum species cannot be distinguished in Al-NMR spectra, due to the low Al content in this support.
By atomic absorption analysis, it was determined that in the Ni/CPAl catalyst the Ni content was very close to 4.7 wt.%.
The TPR profile of Ni/CPAl catalyst (not shown here) does not show any reduction peak in the range 100–900 °C, which would indicate that Ni is already reduced during preparation (pre-treatment in Ar atmosphere) or due to the formation of a Ni-P phase.
To corroborate this, an XRD analysis of the catalyst was performed, and the results are shown in
Figure 1. As it can be seen, the diffractogram of the Ni/CPAl catalyst does not show the presence of metallic nickel, and the presence of peaks at 2θ = 40.6°, 44.5° and 47.1° and 54.1° correspond to planes (111), (201), (210) and (300) of the Ni
2P phase (●) (JCPDS 74-1385, XRD spectra in
Figure S3). It has been observed that when the Ni/P molar ratio is higher than 1.4, various Ni-P phases such as Ni
12P
5 and Ni
3P can be promoted, while Ni/P molar ratios lower than 1 lead to the formation of the Ni
2P phase with large particle sizes [
47,
48,
49,
50]. Ni/CPAl catalyst has a Ni/P molar ratio of 0.64, which is consistent with the formation of the Ni
2P phase.
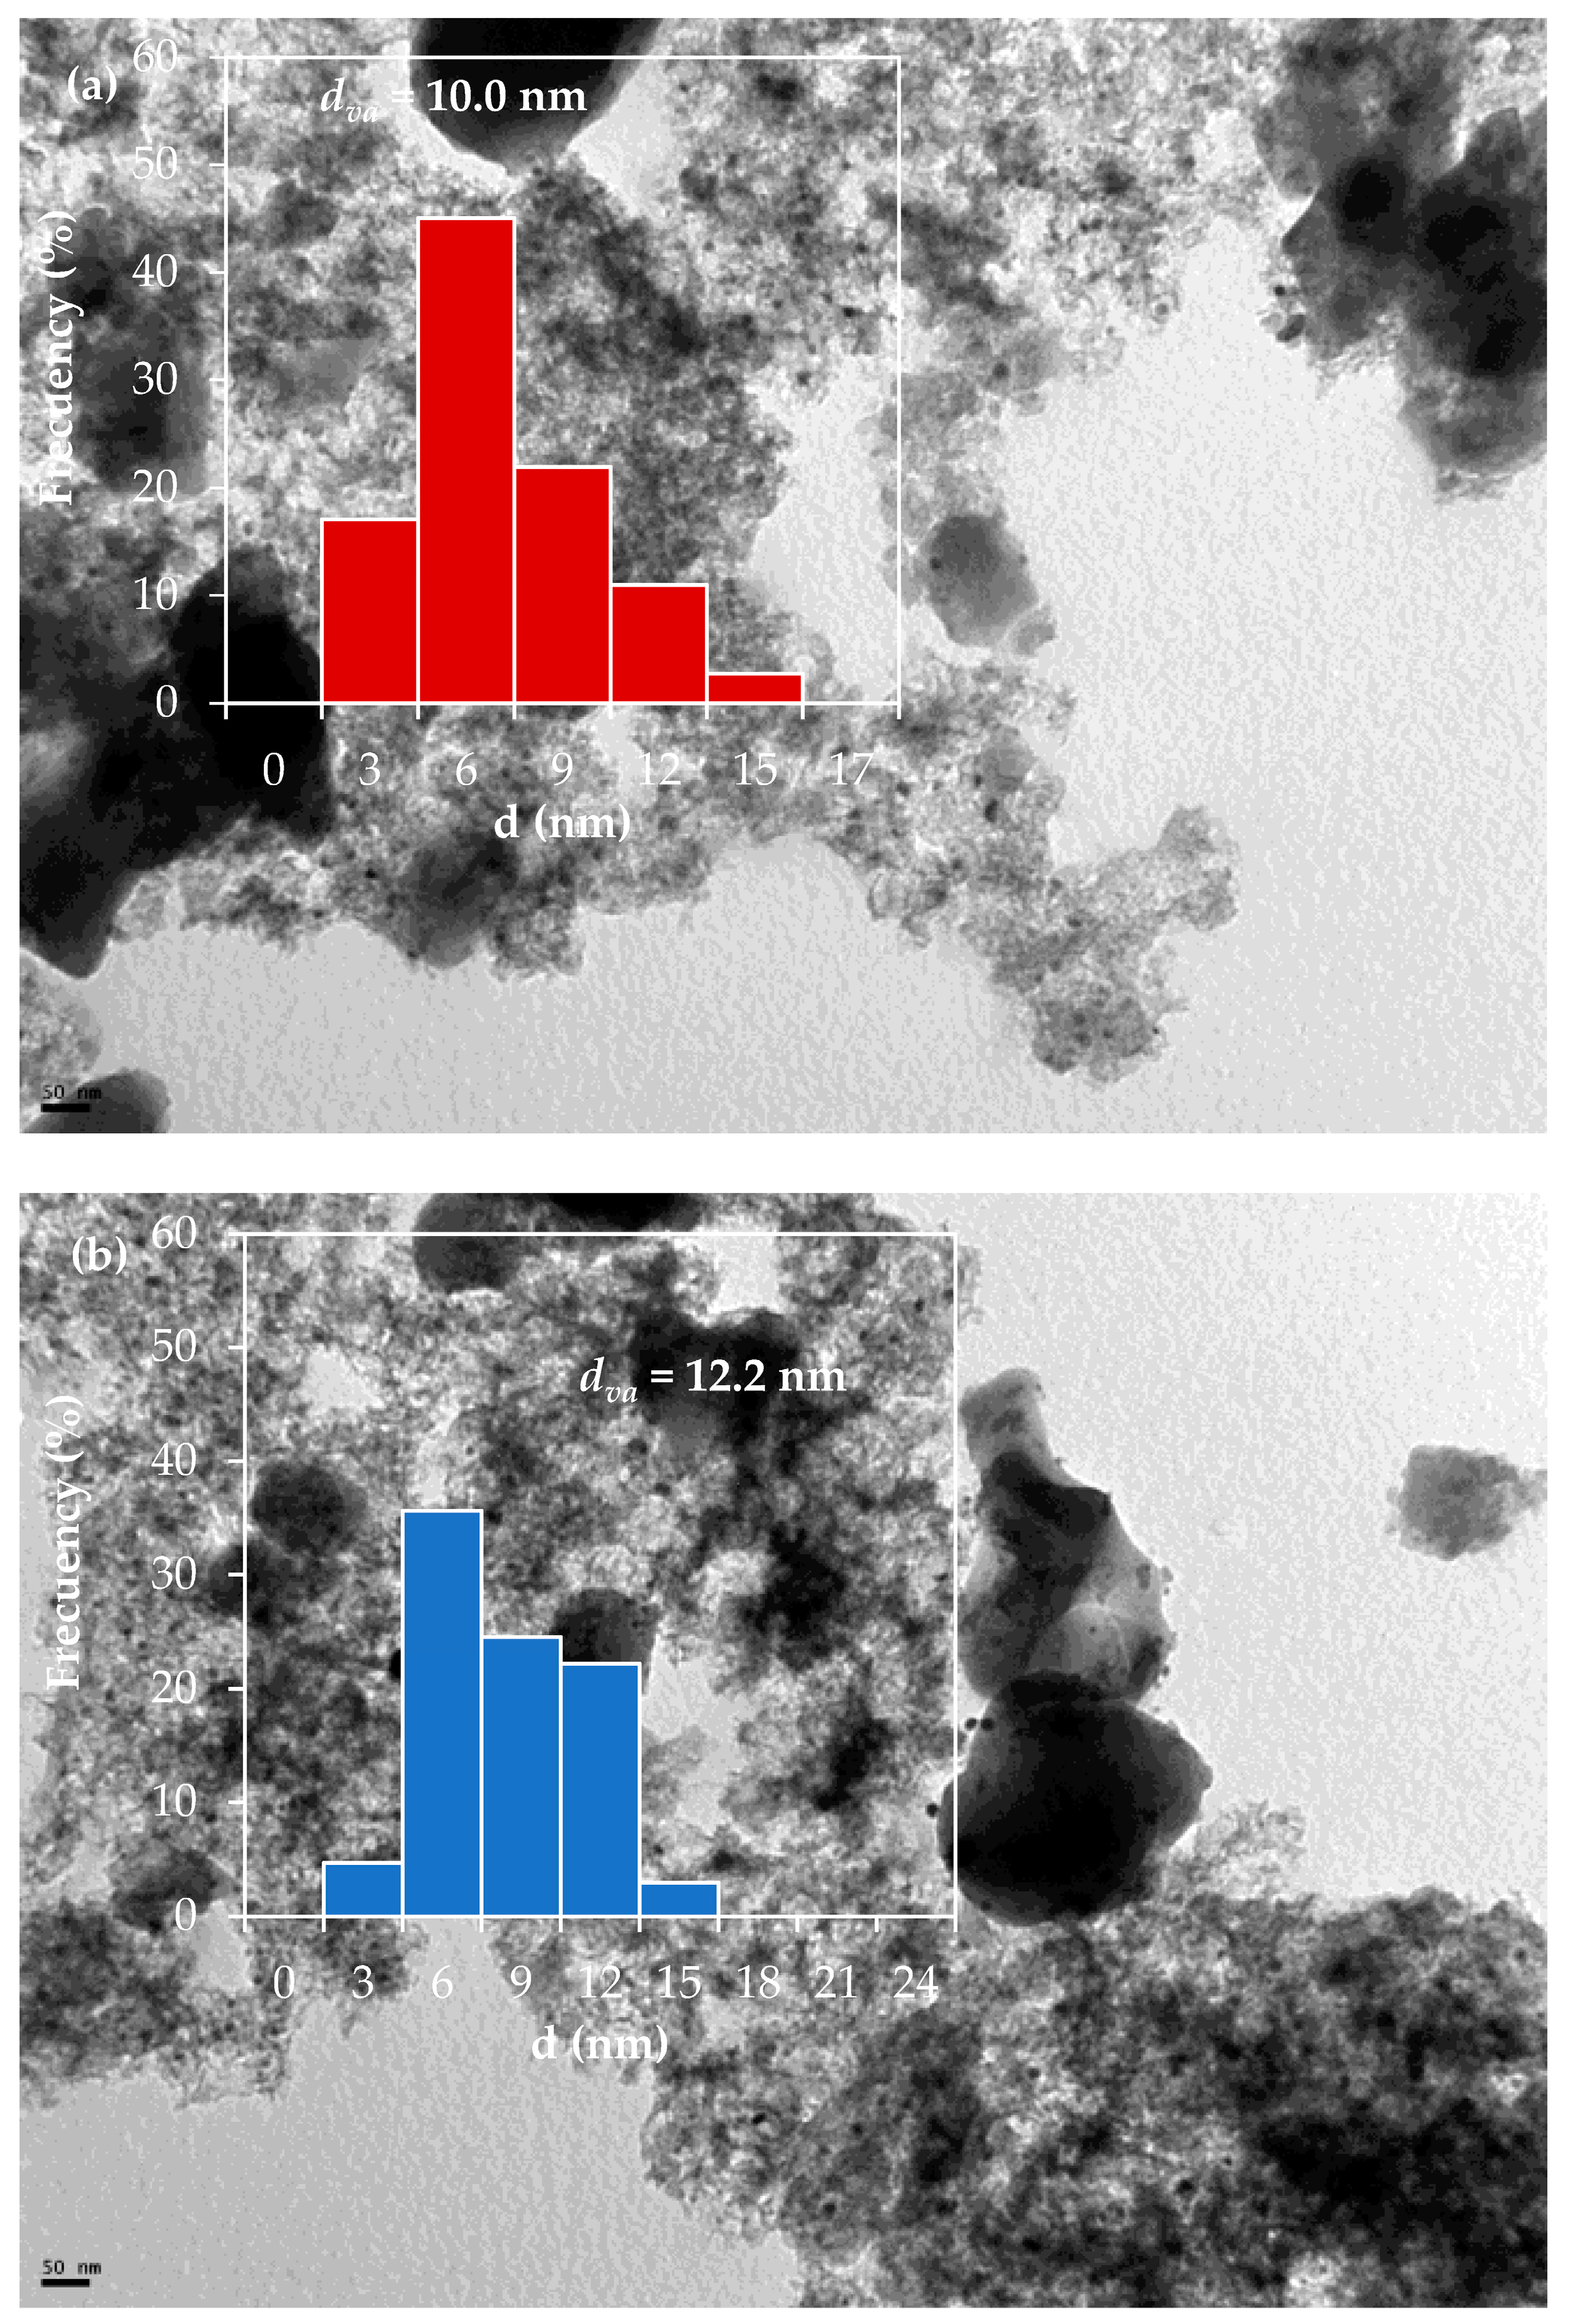
TEM analysis was carried out to determine the size distribution of the metallic particles. As it can be observed from
Figure 3a, the Ni/CPAl catalyst presents an average diameter volume/area (d
va) of 10.0 nm.
3.2. Catalytic Activity
In order to study the effect of the operation variables on the performance of the Ni/CPAl catalyst in the hydrogenolysis of glycerol, different tests were carried out by varying reaction time (0.5–8 h), glycerol concentration (30–55 wt.%), hydrogen pressure (0.5–4 MPa), water concentration (20–45 wt.%) and temperature (220–260 °C). The reaction products identified in the liquid phase were C3: 1-propanol (1-POH), 1,2-propylene glycol (1,2-PG), acetol (AcOH), acetone (AcO); C2: ethanol (EtOH); and C1: methanol (MeOH). Furthermore, the conversion to gaseous products (mainly CO2 and methane) was very low in all cases, between 0.5 and 1%, and the carbon balance for all runs was close to 98%.
3.2.1. Effect of Reaction Time
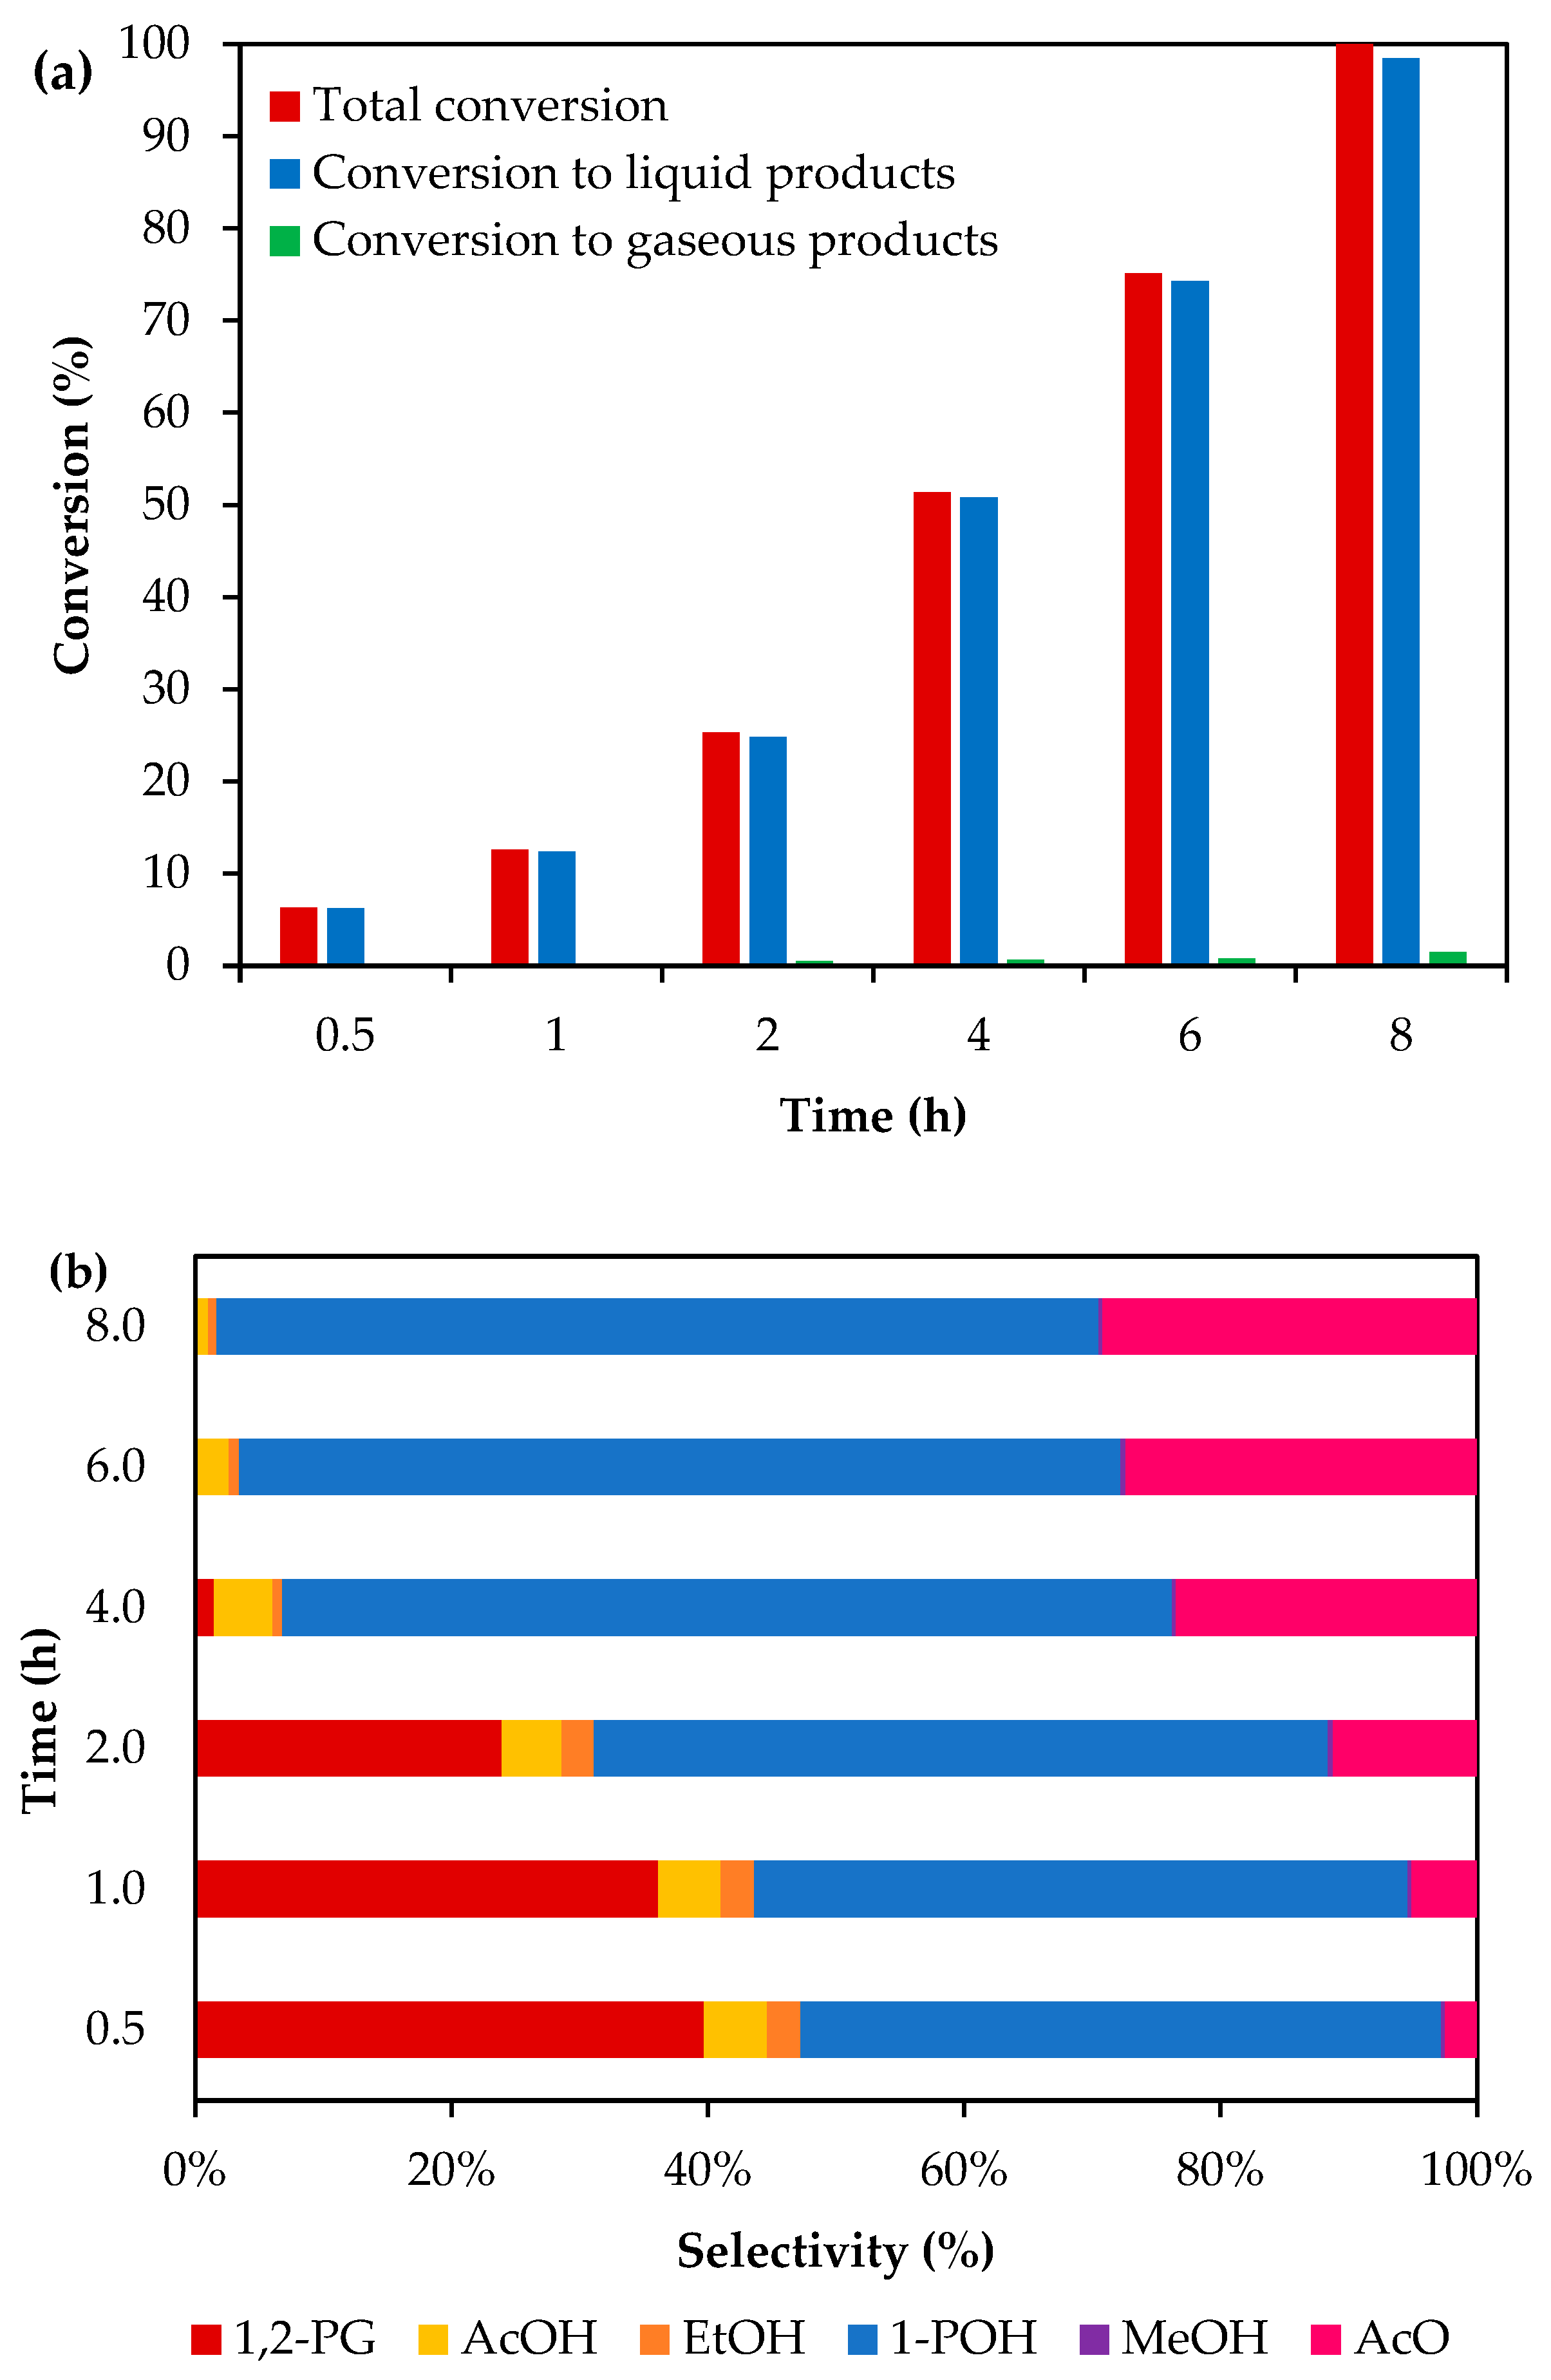
Figure 4 shows the results of conversion and selectivity as a function of reaction time. Previously, we have determined that the presence of Ni
2P, responsible of the C-O bond cleavage and the AlPO
x species, that increase the surface acidity, favors both the conversion of glycerol and the selectivity towards 1-POH [
38]. As it can be seen from
Figure 4a, the conversion of both gaseous and liquid products increases with reaction time, which is expected in batch reactors.
Figure 4b shows that the selectivity to 1-POH and AcO increases as the selectivity of 1,2-PG decreases with reaction time. This would indicate that 1,2-PG is a reaction intermediary. After 4 h of reaction time 1,2-PG is totally consumed and at 8 h of reaction time, 1-POH and AcO are the main liquid products with selectivity values of 68.8% and 29.2%, respectively.
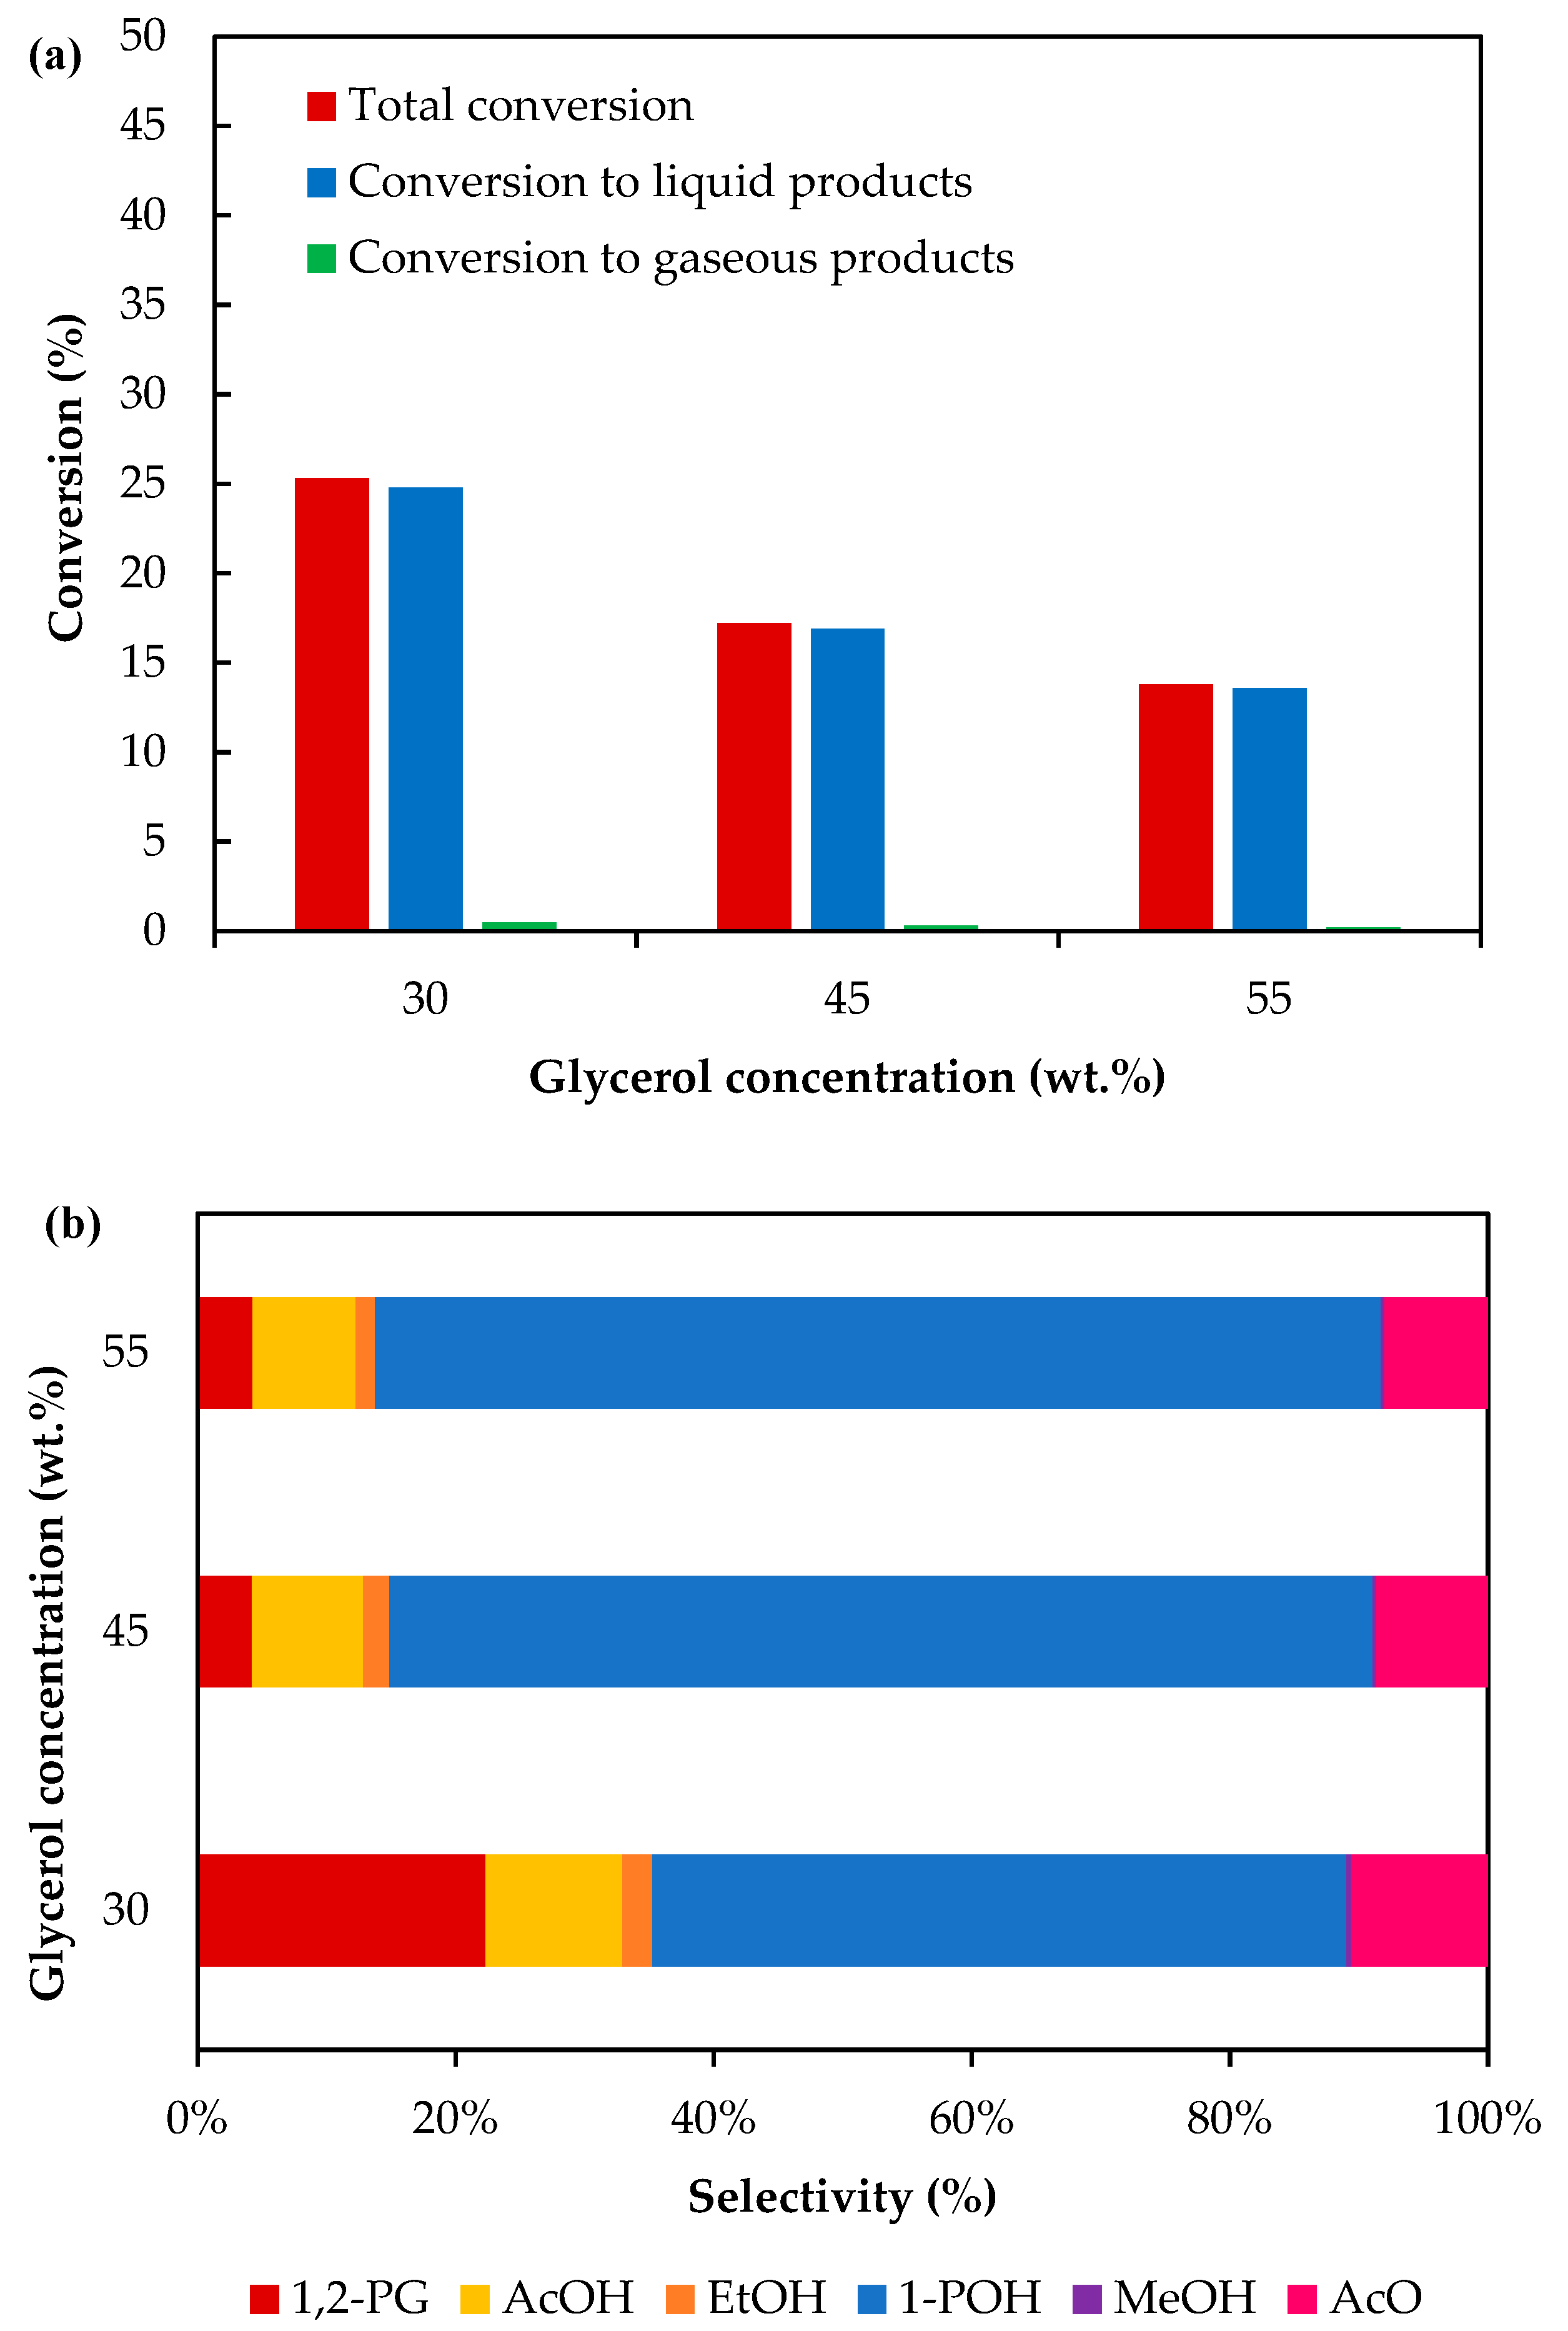
3.2.2. Effect of Glycerol Concentration
In order to study the effect of glycerol concentration on the reaction parameters, the concentration of glycerol was varied between 30 and 55 wt.%, keeping constant the catalyst mass and the water content. However, as the total volume increases, water is also affected and its concentration also decreases, from 70 to 45 wt.%. The reactions were carried out at 260 °C, 2 MPa of H
2 initial pressure and 2 h, varying the catalyst/glycerol mass ratio between 0.05 and 0.16 (
Figure 5).
It can be seen in
Figure 5 that as the initial concentration of glycerol increases, the conversion decreases. This behavior is attributed to the fact that, since the number of acid sites remains constant, there are fewer active sites available to catalyze the reaction as the glycerol concentration increases. In this sense, the maximum glycerol conversion achieved is 25%, for an initial glycerol concentration of 30 wt.%. Selectivity values at similar conversion levels can be compared using information of
Figure 4. For a ~13% glycerol conversion, a 51% selectivity to 1-POH can be observed when the glycerol concentration is 30 wt.%. From
Figure 5b, selectivity to 1-POH is about 79% when the glycerol concentration is 55 wt.%, for a similar glycerol conversion (~12%). This indicates that selectivity towards 1-POH increases with increasing glycerol concentration. This behavior can be explained by the fact that the 1,2-PG generated by glycerol hydrogenolysis is consumed to produce 1-POH, as 1,2-PG selectivity decreases with the increase in glycerol concentration.
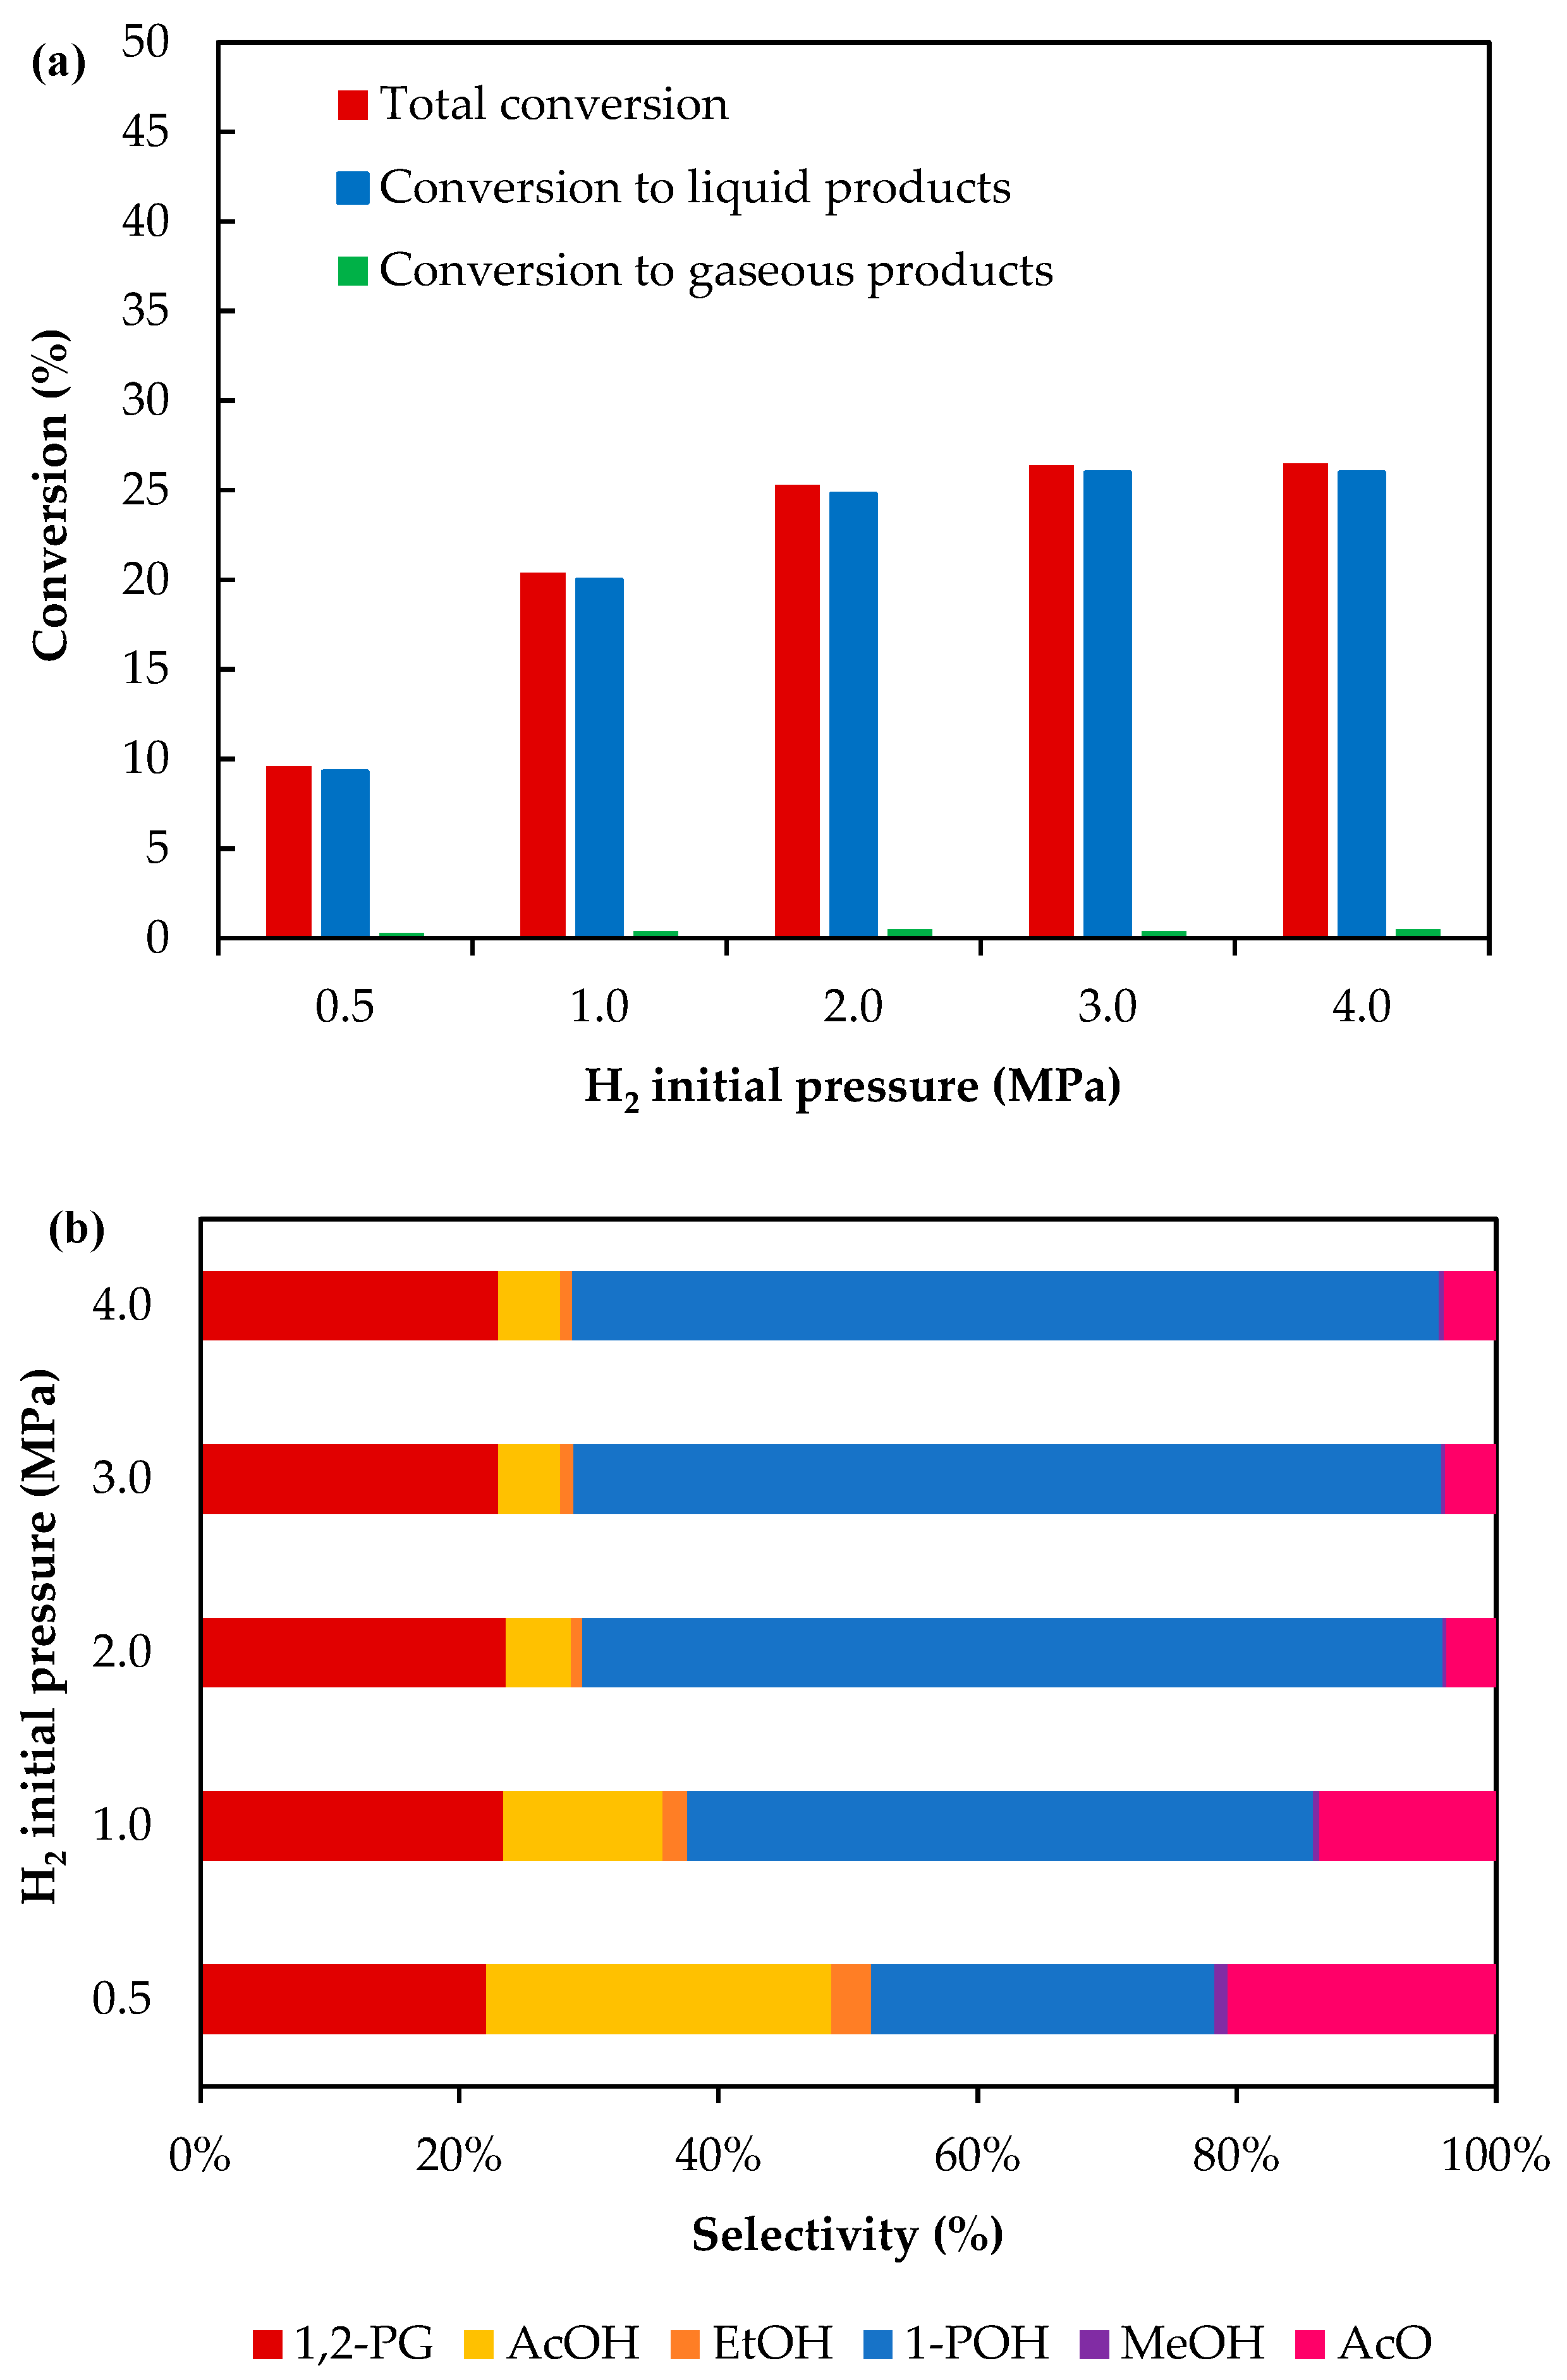
3.2.3. Effect of Initial H2 Pressure
The effect of H
2 initial pressure over glycerol conversion and selectivity to liquid products was studied by varying the H
2 partial pressure between 0.5 and 4 MPa. For pressures between 0.5 and 2 MPa, the initial total pressure was kept at 2.0 MPa, varying the partial pressure with N
2. The results are shown in
Figure 6.
It can be seen that glycerol conversion increase for initial H
2 pressures between 0.5 and 2.0 MPa. Selectivity values at similar conversion levels can be compared using information found within
Figure 4. For a ~13% glycerol conversion, a 51% selectivity to 1-POH can be observed when hydrogen pressure is 2 MPa. From
Figure 6b, selectivity to 1-POH is about 26% when hydrogen pressure is 0.5 MPa, for a similar glycerol conversion (~10%). This behavior is due to the availability of H
2 to react with glycerol and 1,2-PG to form 1-POH. For pressures above 2 MPa, the increase in H
2 pressure has no significant effect on the activity parameters.
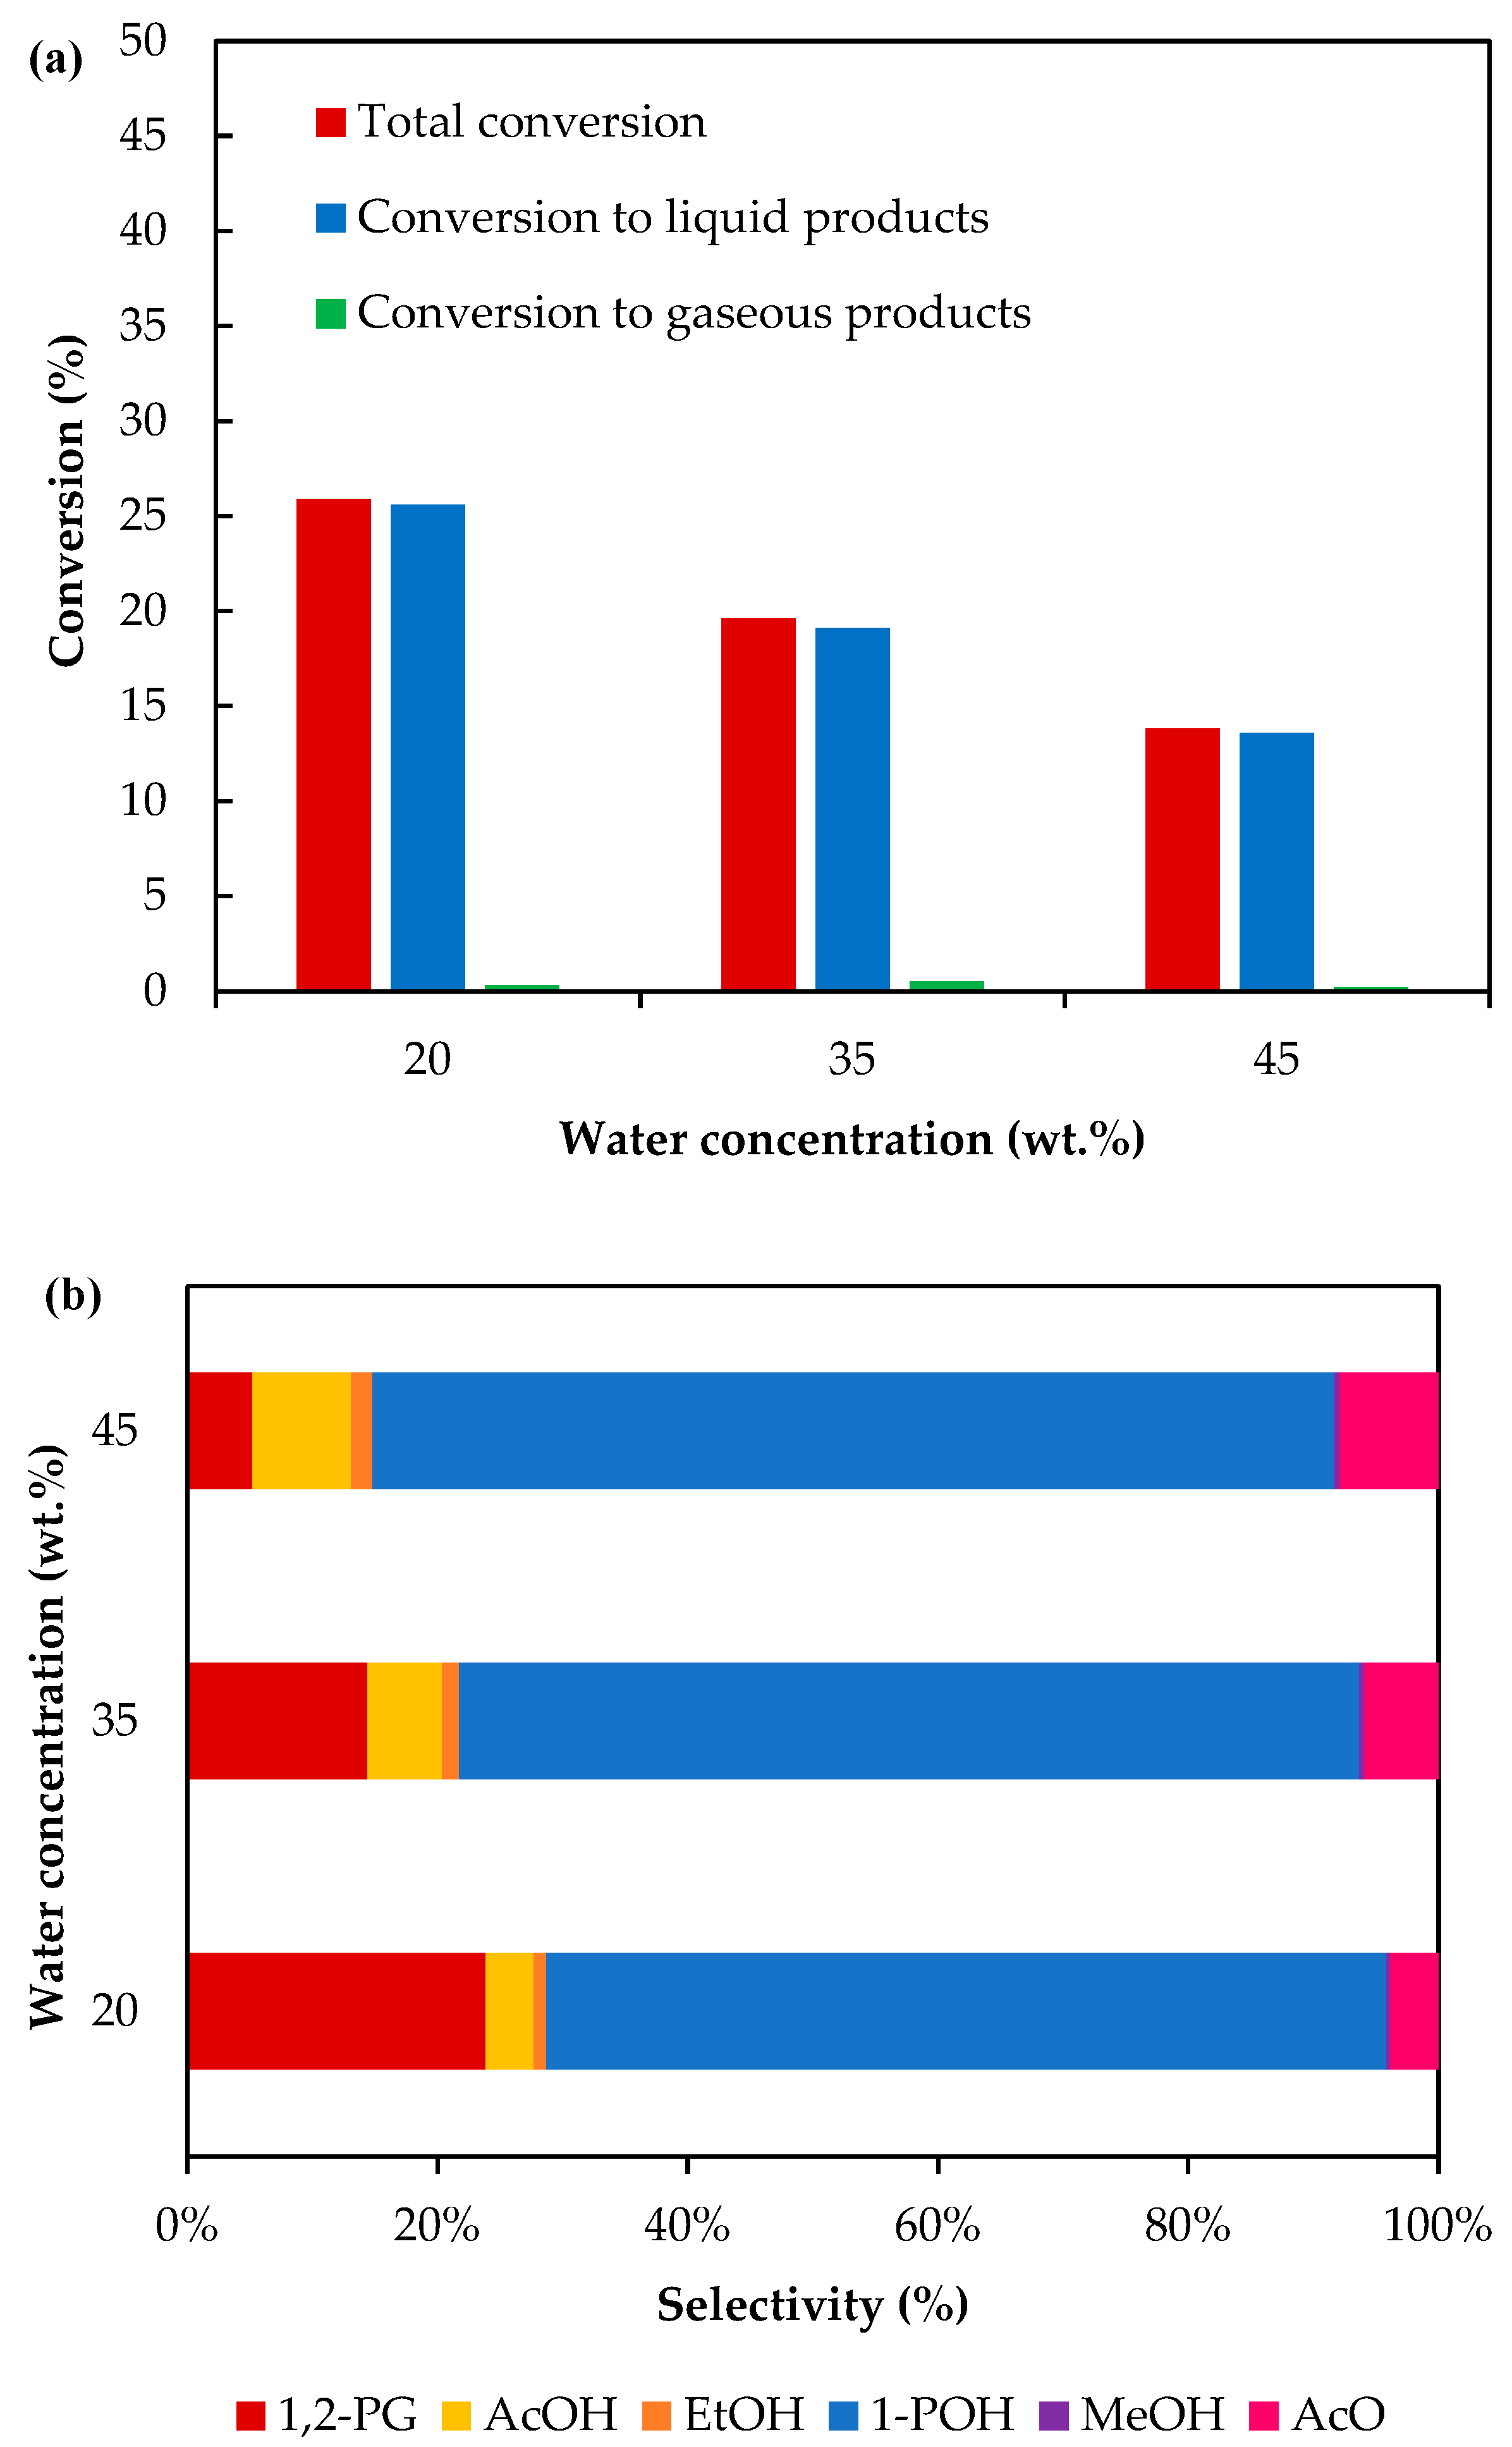
3.2.4. Effect of the Water Concentration
The effect of water concentration was studied in the range 20–45 wt.%, which corresponds to glycerol concentrations between 80 wt.% and 55 wt.%. The reaction tests were carried out with a catalyst/glycerol mass ratio = 0.05, at 260 °C, 2 MPa of H
2 initial pressure and 2 h. The results are shown in
Figure 7. As it can be seen, glycerol conversion decreases as the water concentration increases. This behavior is expected as water is a by-product of the reaction, so its formation shifts the equilibrium towards the reactants [
51]. It has been reported that in the presence of Rh
0.02Cu
0.4/Mg
5.6Al
1.98O
8.57 catalyst, glycerol conversion decreases from 91% to 69% when the water content increases from 0 wt.% to 40 wt.%, using ethanol as a solvent at 180 °C and 2 MPa of H
2 [
52]. For the same increase in water content, similar results were obtained using Ni/Ce-Mg catalyst, with a decrease in glycerol conversion from 80% to 43% [
53].
On the other hand, the selectivity towards 1-POH increases with increasing water concentration. Selectivity values at similar conversion levels can be compared using information of
Figure 4. For a ~25% of glycerol conversion a 57% selectivity to 1-POH can be observed when water concentration is 70 wt.%. From
Figure 7b, selectivity to 1-POH is about 66% when water concentration is 20 wt.%, for a similar glycerol conversion (~12%). This behavior is due to a decrease in 1,2-PG selectivity as shows
Scheme 1, indicating that 1-POH is favored by dehydration reaction steps for low water contents.
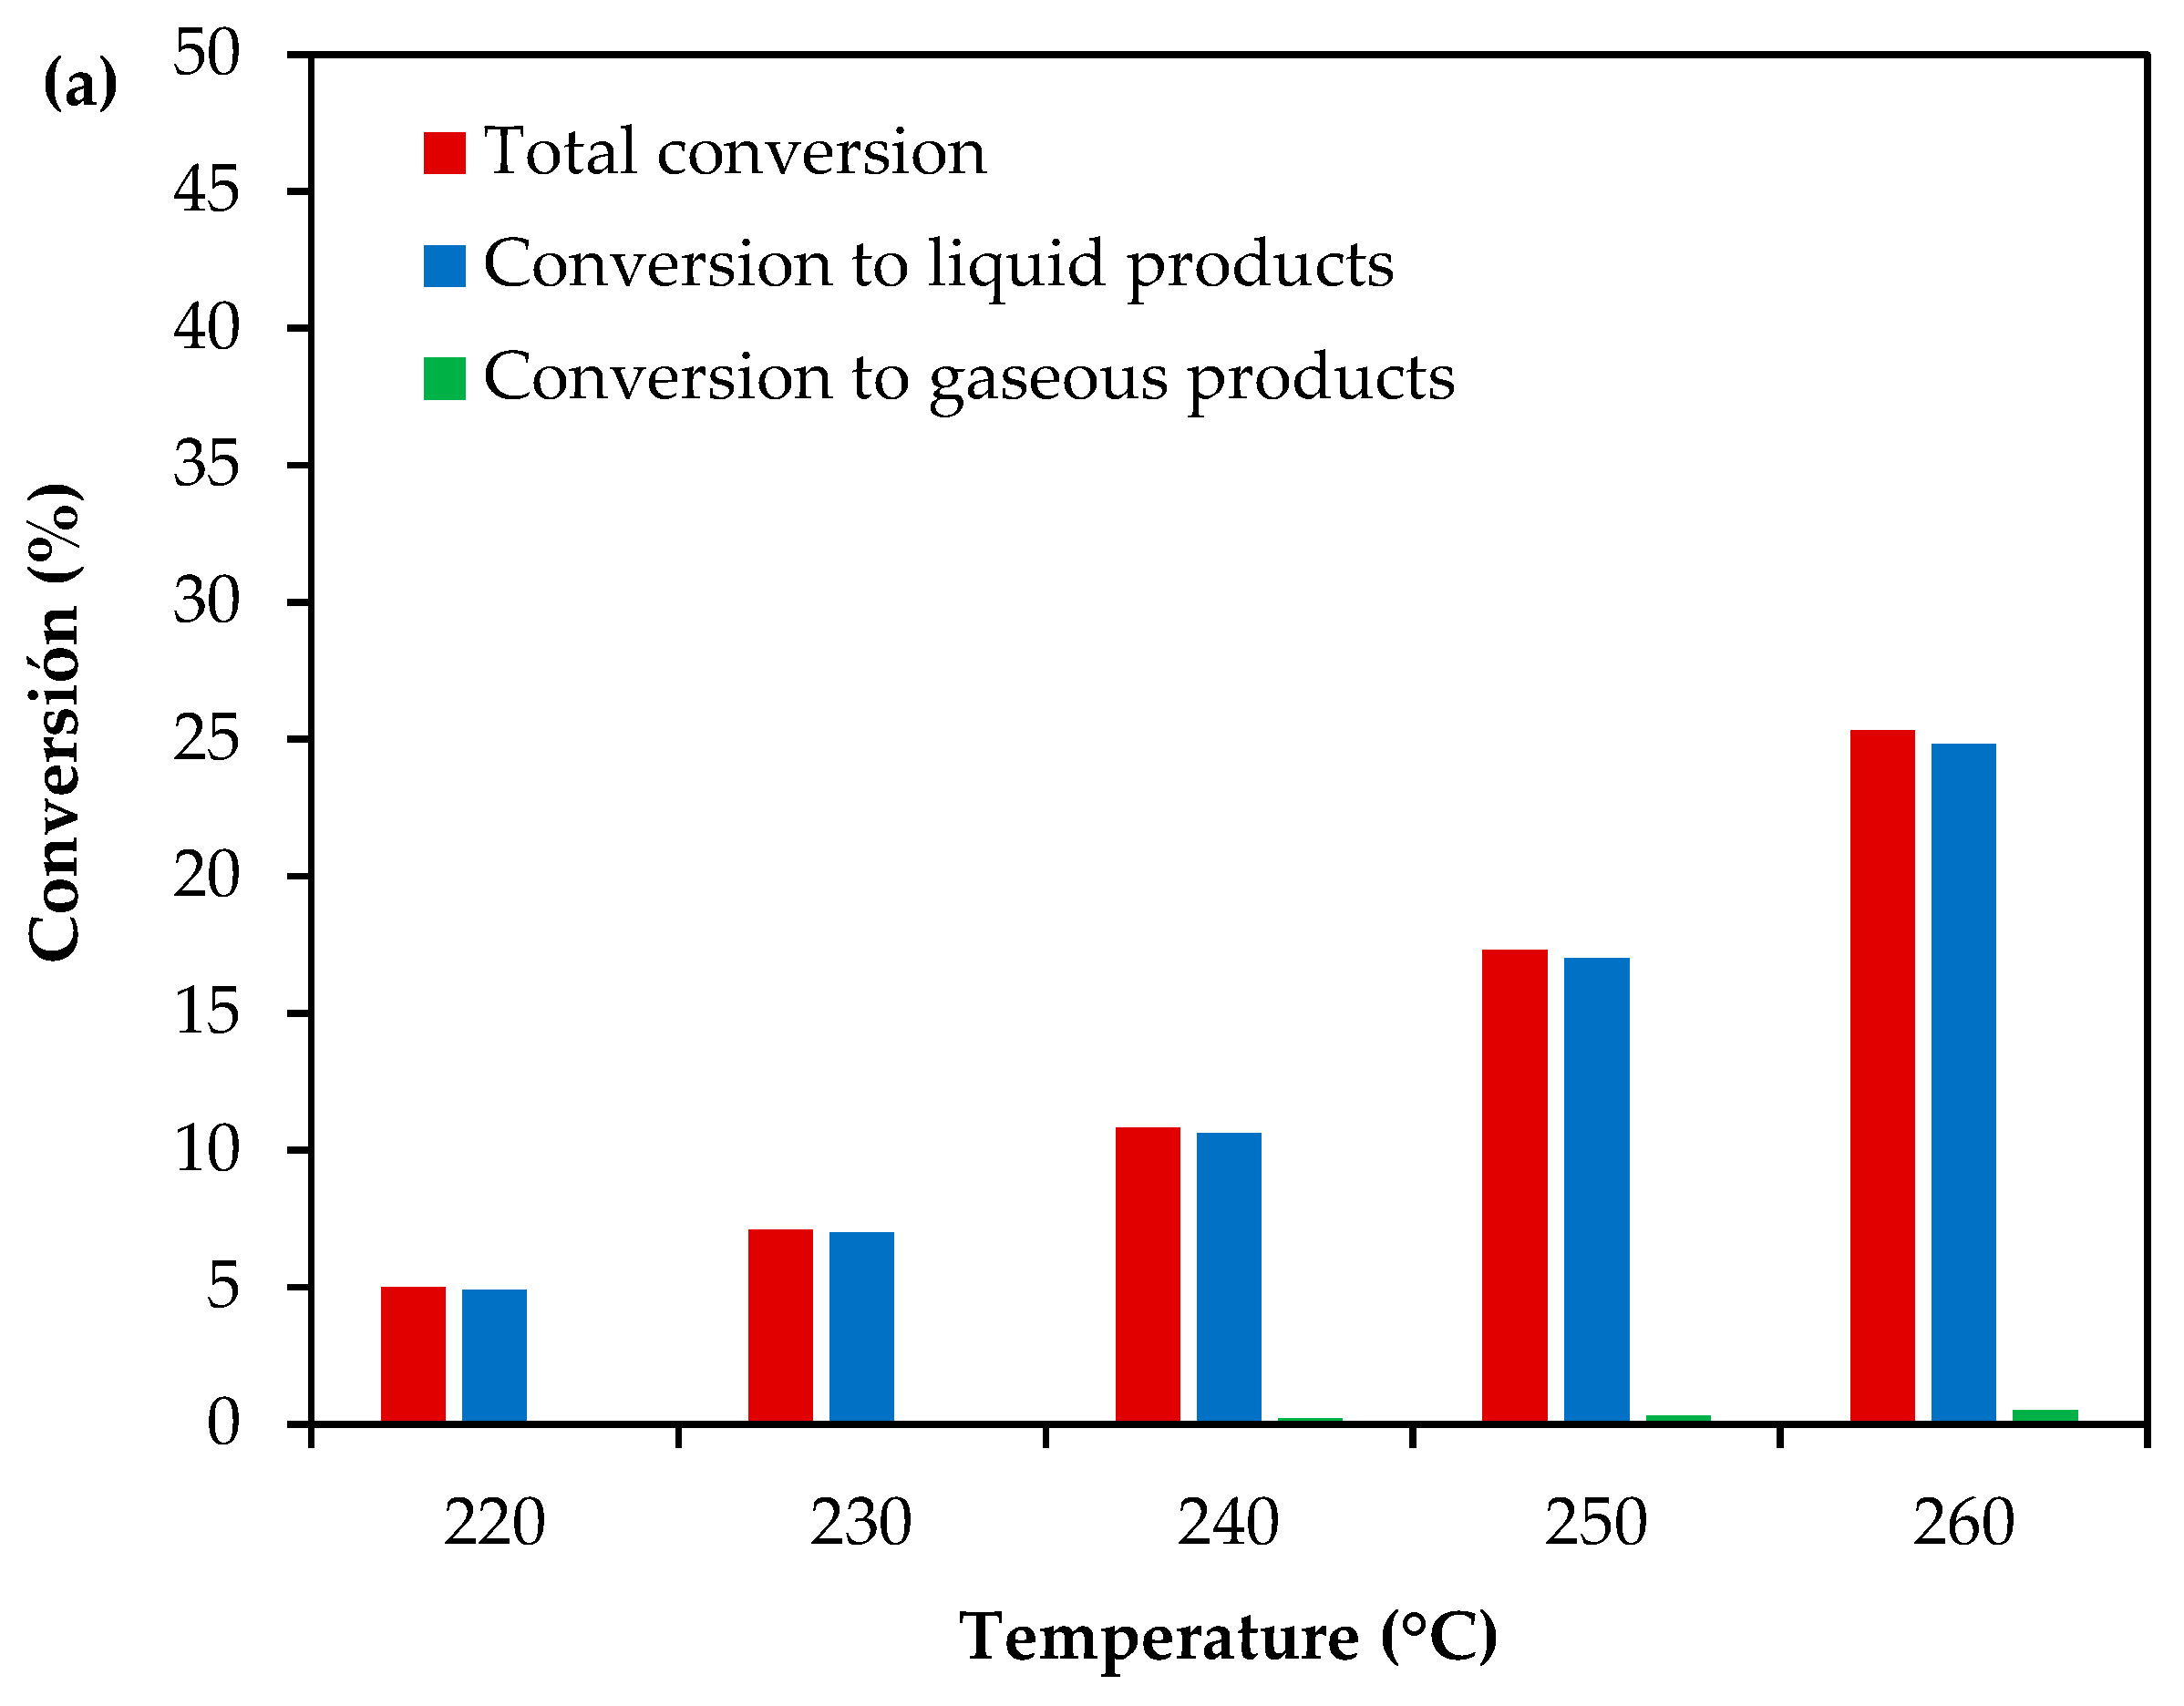
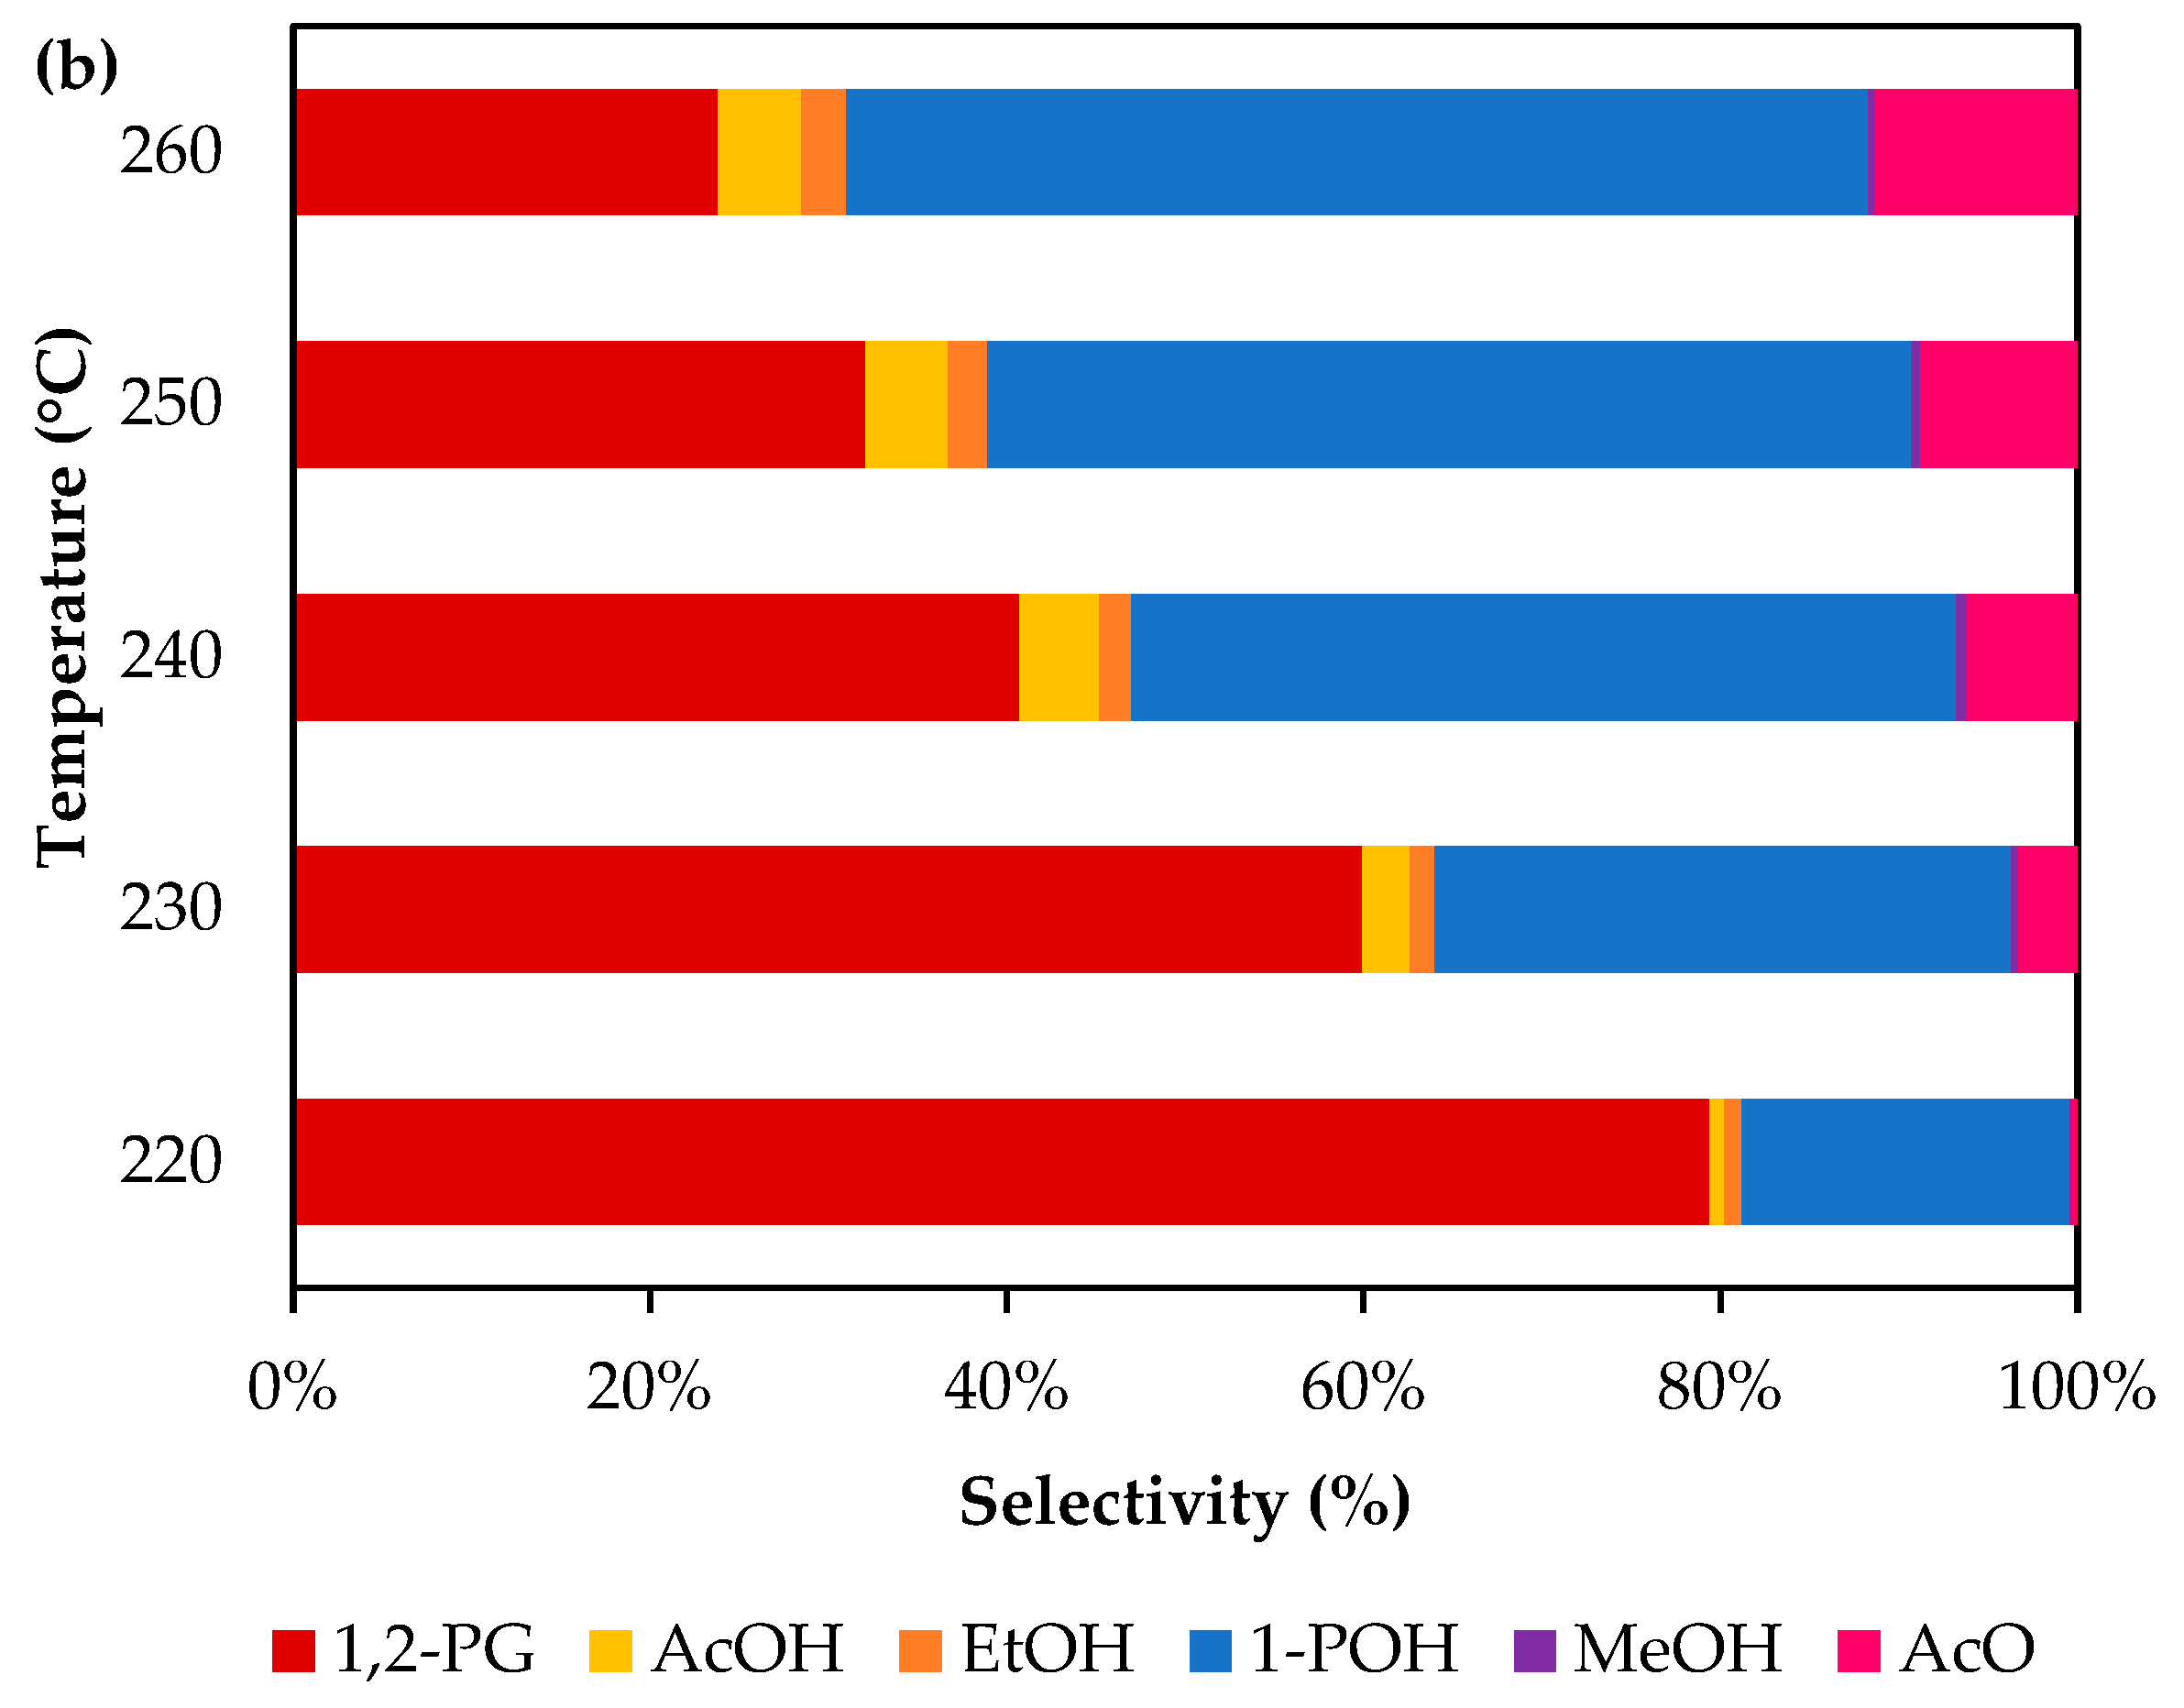
3.2.5. Effect of Temperature
The effect of temperature was studied for the range 220–260 °C, employing 2 MPa of H
2 initial pressure, a catalyst/glycerol mass ratio = 0.16, 30 wt.% of glycerol in the reaction mixture and 2 h. The results shown in
Figure 8 indicate that glycerol conversion and the selectivity towards 1-POH increase as temperature is increased, while the selectivity towards 1,2-PG decreases. Selectivity values at similar conversion levels can be compared using information found within
Figure 4. For a ~6% glycerol conversion, a 50% selectivity to 1-POH and 39% selectivity to 1,2-PG can be observed when the temperature is 260 °C. From
Figure 8b, selectivity values to 1-POH and 1,2-PG are about 18% and 79% when temperature is 220 °C for a similar glycerol conversion (~5%). This would indicate that the formation of 1-POH is favored with temperature at expenses of 1,2-PG consumption.
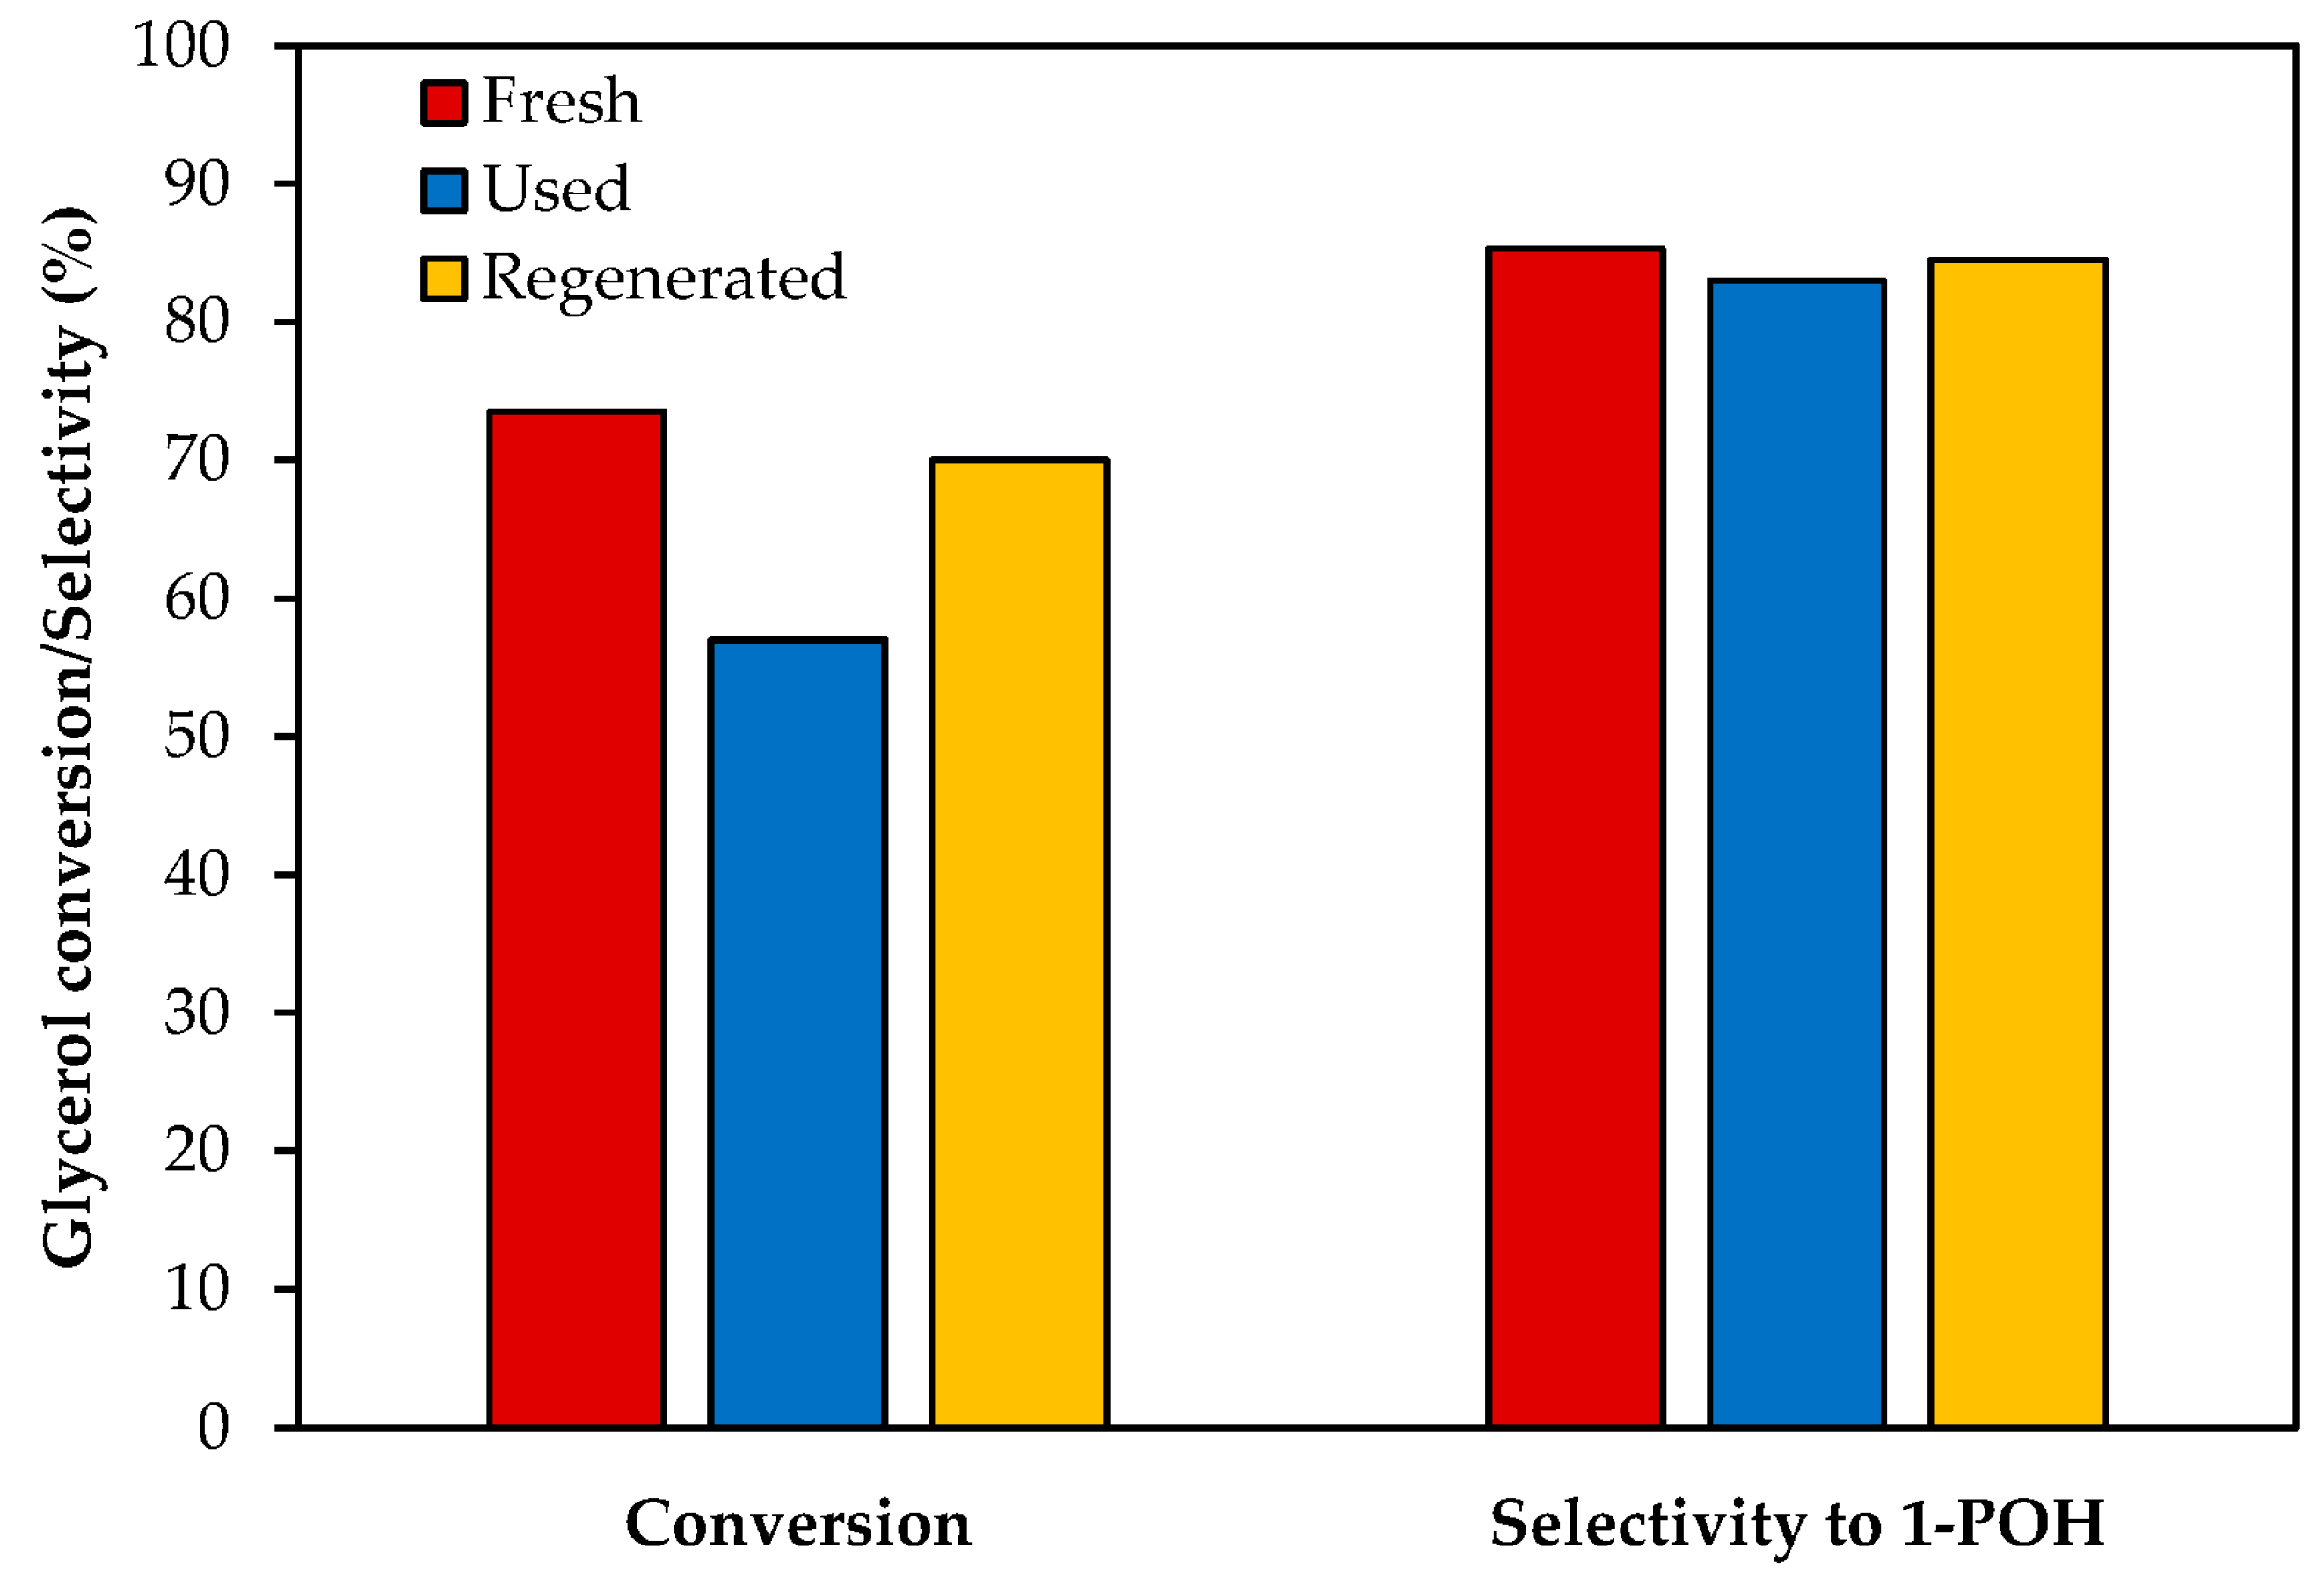
3.3. Catalyst Reusability
The reusability of the catalyst was studied by carrying out reaction cycles with the Ni/CPAl catalyst at 260 °C, 6 h of reaction, 30 wt.% glycerol aqueous solution, a catalyst/glycerol mass ratio = 0.16 and 2 MPa of initial H
2 pressure. After the first use, the catalyst was washed with ethanol, without any thermal regeneration process. According to
Figure 9, loss of activity of approximately 22% is observed compared to the fresh sample. The characterization results of this sample by TEM show a slight increase in the particle size, from 10.0 nm to 12.2 nm, as shown in
Figure 3b, while the potentiometric titration (
Figure S4) indicates an initial potential Ei = 78 mV that is practically the same as in the fresh sample, as shown in
Table 1. Also, as it can be seen from
Table 1, the specific surface area decreases by 14% of its original value (isotherms in
Figure S5). As an XRD analysis demonstrated that the structure remained unchanged after the reaction cycle (
Figure S6), the adsorption of reaction products could be responsible of deactivation. To confirm this, the catalyst was washed with ethanol and then regenerated under hydrogen flow at 400 °C for 90 min. After this regeneration treatment, it was found that the glycerol conversion and product selectivity were similar to those obtained with fresh catalyst, leading to the conclusion that the thermal treatment would allow the elimination of the adsorbed compounds.
3.4. Kinetic Model
Since the conversion to gaseous products was very low in all cases (0.5–1%), they were not considered for the development of the kinetic model. Furthermore, the results show that AcOH and 1,2-PG are intermediates in the formation of AcO and 1-POH, which are the main liquid products when 100% glycerol conversion is reached. For this reason, and considering the global formation rates, AcOH and 1,2-PG were not included in the kinetic model.
For the other liquid products, the partial reaction orders with respect to glycerol (α
j), H
2 (β
j) and water (γ
j) are shown in
Table 2.
As it can be seen, all the partial orders were estimated with a multiple correlation coefficient (R2) between 0.85 and 0.99, indicating a good agreement of the results obtained in the different experiments.
For some of the compounds, some partial orders give negative values, as expected for heterogenous catalytic systems. This could be due to the adsorption of glycerol, H2 or water in the active sites, which decreases the reaction rate values.
In particular, for the glycerol consumption, the partial order with respect to glycerol is 0.07, suggesting that the global reaction is nearly zero order. In addition, the partial order with respect to water is −0.98, suggesting a negative first order.
Table 3 shows the different catalysts used in the glycerol hydrogenolysis reaction in the liquid phase using kinetic models based on the power law. For these catalytic systems, the reaction conditions and the partial orders with respect to glycerol and H
2 for the glycerol consumption reaction are presented. For some of the catalysts, the experiments indicate that the rate of glycerol consumption strongly depends on its concentration rather than on the concentration of H
2 in the liquid phase, with α
gly > β
H2 [
54,
55], while for others the opposite result has been obtained [
56,
57]. Our results are consistent with the latter.
Table 4 shows the pre-exponential factors and the apparent activation energies estimated from the Arrhenius law employing the results obtained from the concentration vs. temperature profiles.
The results obtained from
Table 4 show that the estimation of the parameters is in good agreement with the experimental results, with linear correlation coefficients near to ~1. For the glycerol consumption rate, the apparent activation energy is 89 kJ mol
−1, which is the lowest value obtained among all the activation energies. This may indicate that the glycerol molecule is more reactive than any of the liquid products.
Table 5 shows some of the activation energies obtained from the literature for the glycerol consumption rate, in different temperature ranges. As it can be seen, our results are in agreement with the values reported in the literature for other catalytic systems.
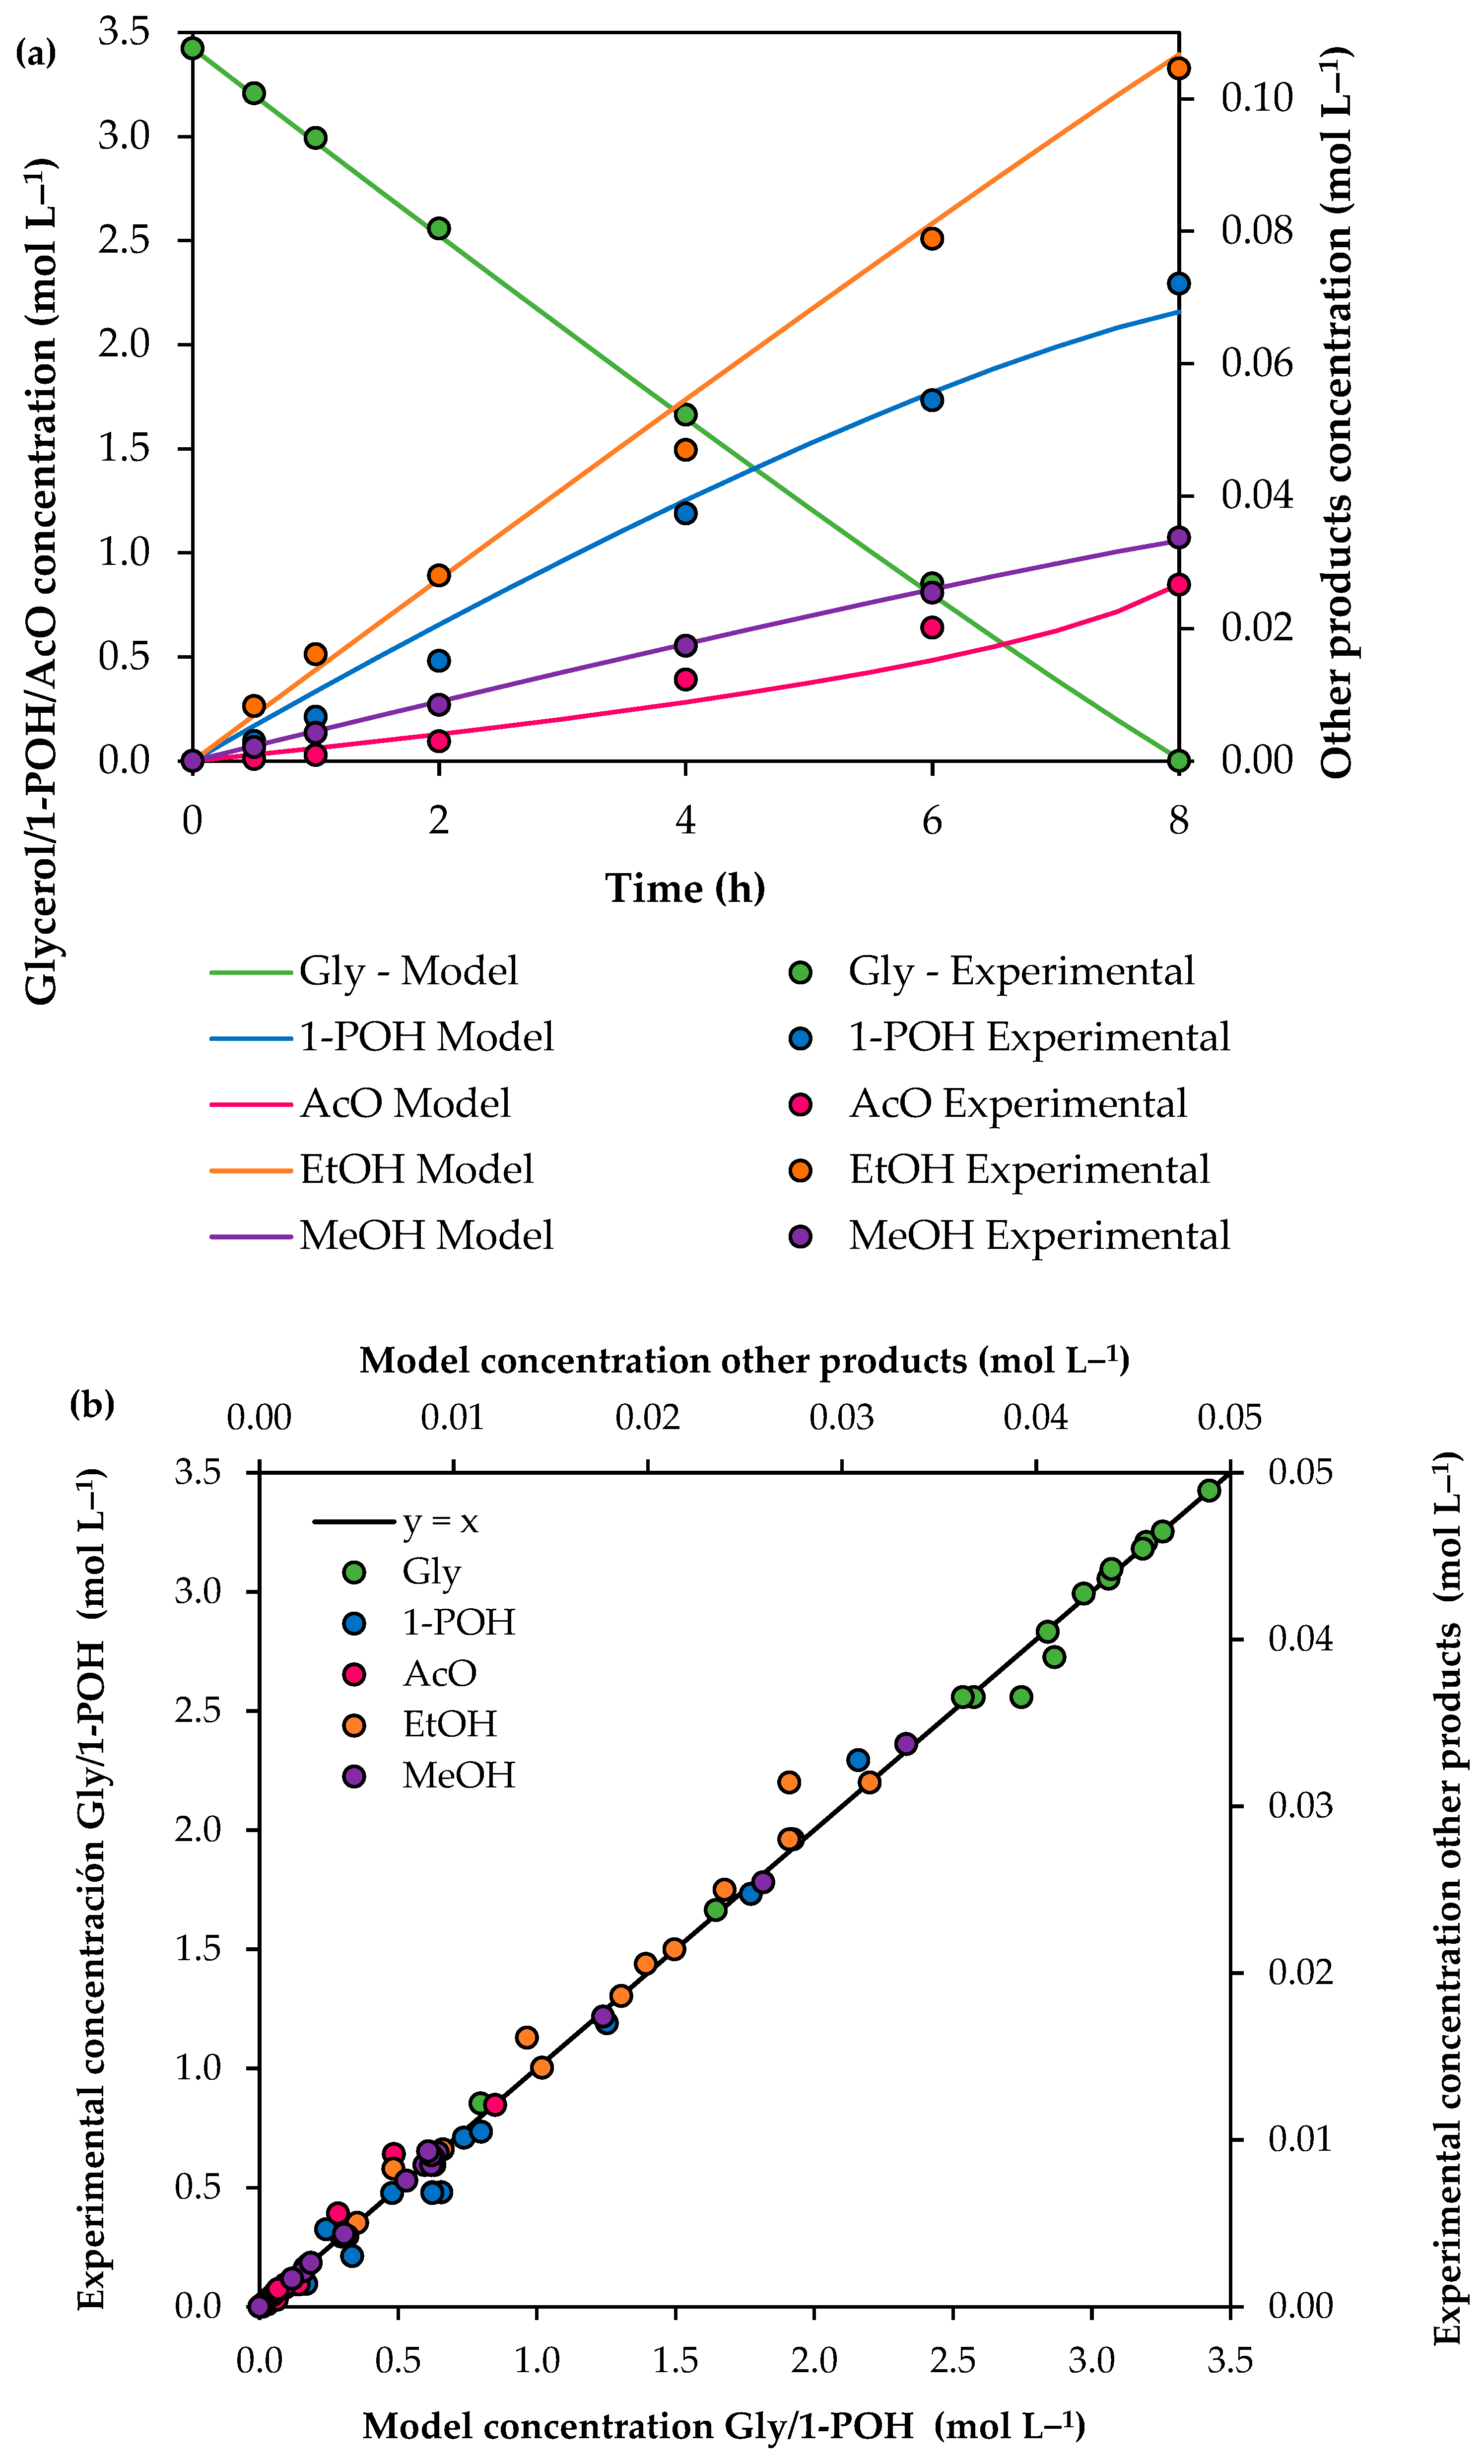
Figure 10a shows the experimental results (dots) and the solid lines show the concentration of glycerol and products as a function of time based on the power law model. The parity plot of the predicted and experimental concentrations is shown in
Figure 10b.
As it can be seen from the results, the experimental values and the ones estimated using the power-law model exhibit very good agreement. To establish a quantitative deviation of the experimental values with respect to those predicted by the model, the average percentage errors (E) were calculated individually for the concentrations of glycerol and the liquid products according to Equation (13).
In Equation (13), i represents the i-th experiment, N represents the number of experiments, Cexp is the concentration obtained from the experiments and Cmod is the concentration predicted from the model.
The results obtained indicate that the model allows estimating the experimental concentration of all the compounds with an average error below 7%.
4. Conclusions
The aim of this work is to evaluate different operation variables in the glycerol hydrogenolysis reaction to 1-propanol, such as H2 pressure, temperature, glycerol and water concentration and develop a simple kinetic model based on the power law, useful for the design of industrial-scale reactors. For this purpose, a Ni catalyst supported over a carbon composite modified with a 4 wt.% of Al(H2PO4)3 (Ni/CPAl) was prepared, characterized and tested in different experiments. Temperatures of 220–260 °C, 0.5–4 MPa of H2 initial pressure, with 30–80 wt.% aqueous glycerol solutions and catalyst/glycerol mass ratios between 0.05 and 0.16 were used in the catalytic tests.
The results of support and catalyst characterization indicate that the presence of AlPOx moderates the surface acidity and the formation of Ni2P lead to high selectivity to 1-propanol in the Ni/CPAl catalyst. Catalytic results indicated that the Ni/CPAl catalyst can lead to total glycerol conversion and 74% selectivity to 1-propanol at 260 °C and 2 MPa of H2 initial pressure using a 30 wt.% glycerol aqueous solution and 8 h of reaction time. After a first reaction cycle, a slight increase in particle size from 10 to 12 nm was detected, but no changes in acidity and structure were observed. These results indicated that the adsorption of reaction products may cause deactivation, but a thermal treatment was successfully implemented to allow their elimination.
Based on the above, a power-law kinetic model was proposed to describe the glycerol consumption and the formation rates of the main liquid products. All the partial orders were estimated with multiple correlation coefficients between 0.85 and 0.99, indicating a good agreement of the results obtained in the different experiments.
In particular, for the glycerol consumption, partial orders of 0.07, 0.68 and −0.98 were determined with respect to glycerol,H2 and water, and an apparent activation energy of 89 kJ mol−1 was estimated. The results obtained indicate that the experimental values and those estimated using the power-law model are in very good agreement, and the experimental concentrations can be predicted with an average error of less than 7%.


