
Okra Micro-Cellulose Crystal (MCC) and Micro-Clay Composites for the Remediation of Copper, Nickel, and Dye (Basic Yellow II) from Wastewater


 , , ,
, , ,  and
and
Abstract
:1. Introduction
2. Experimental
2.1. Reagents
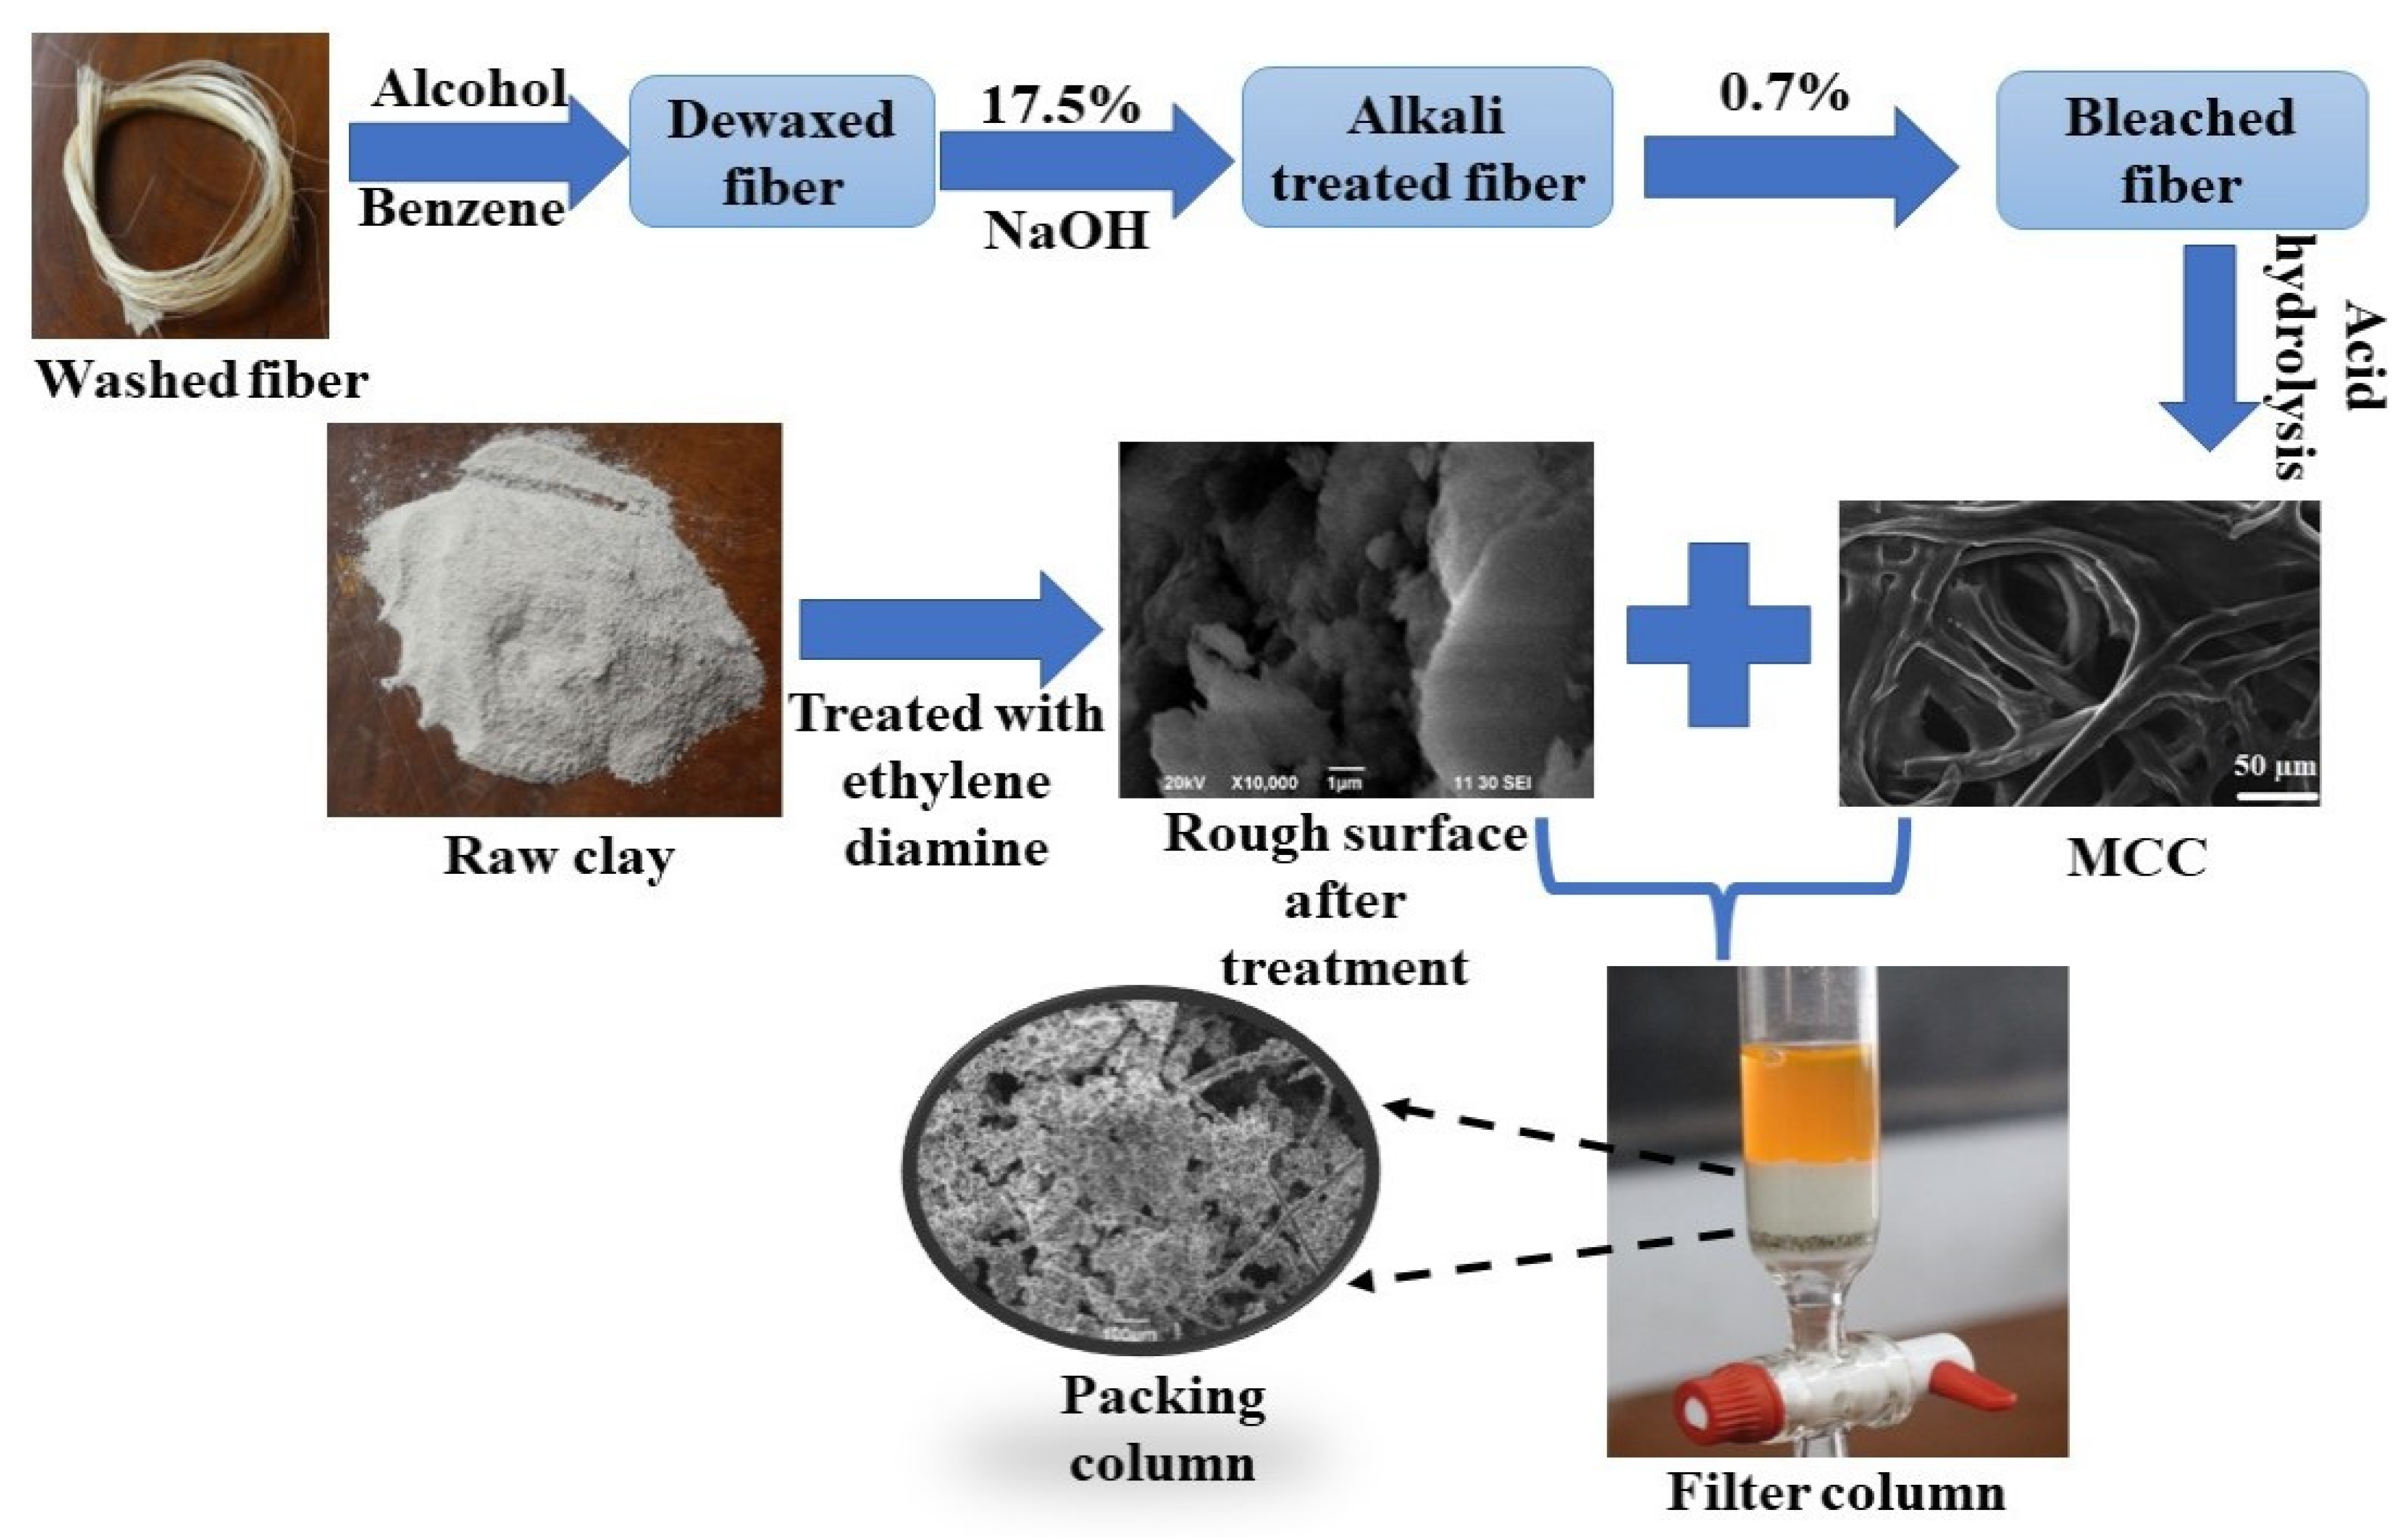
2.2. Preparation of MCC
2.2.1. Collection and Modification of Clay
2.2.2. Preparation of Composite
2.2.3. Sample Preparation
2.3. Characterization
2.3.1. Thermogravimetric Analysis (TGA)
2.3.2. FTIR Spectroscopy
2.3.3. SEM Analysis
2.3.4. XRD Analysis
2.3.5. Metal Analysis by AAS
2.3.6. Dye Absorbance Analysis by UV–Vis Spectrophotometer
3. Result and Discussion
3.1. Okra Fiber and MCC Analysis
3.1.1. Thermogravimetric Analysis
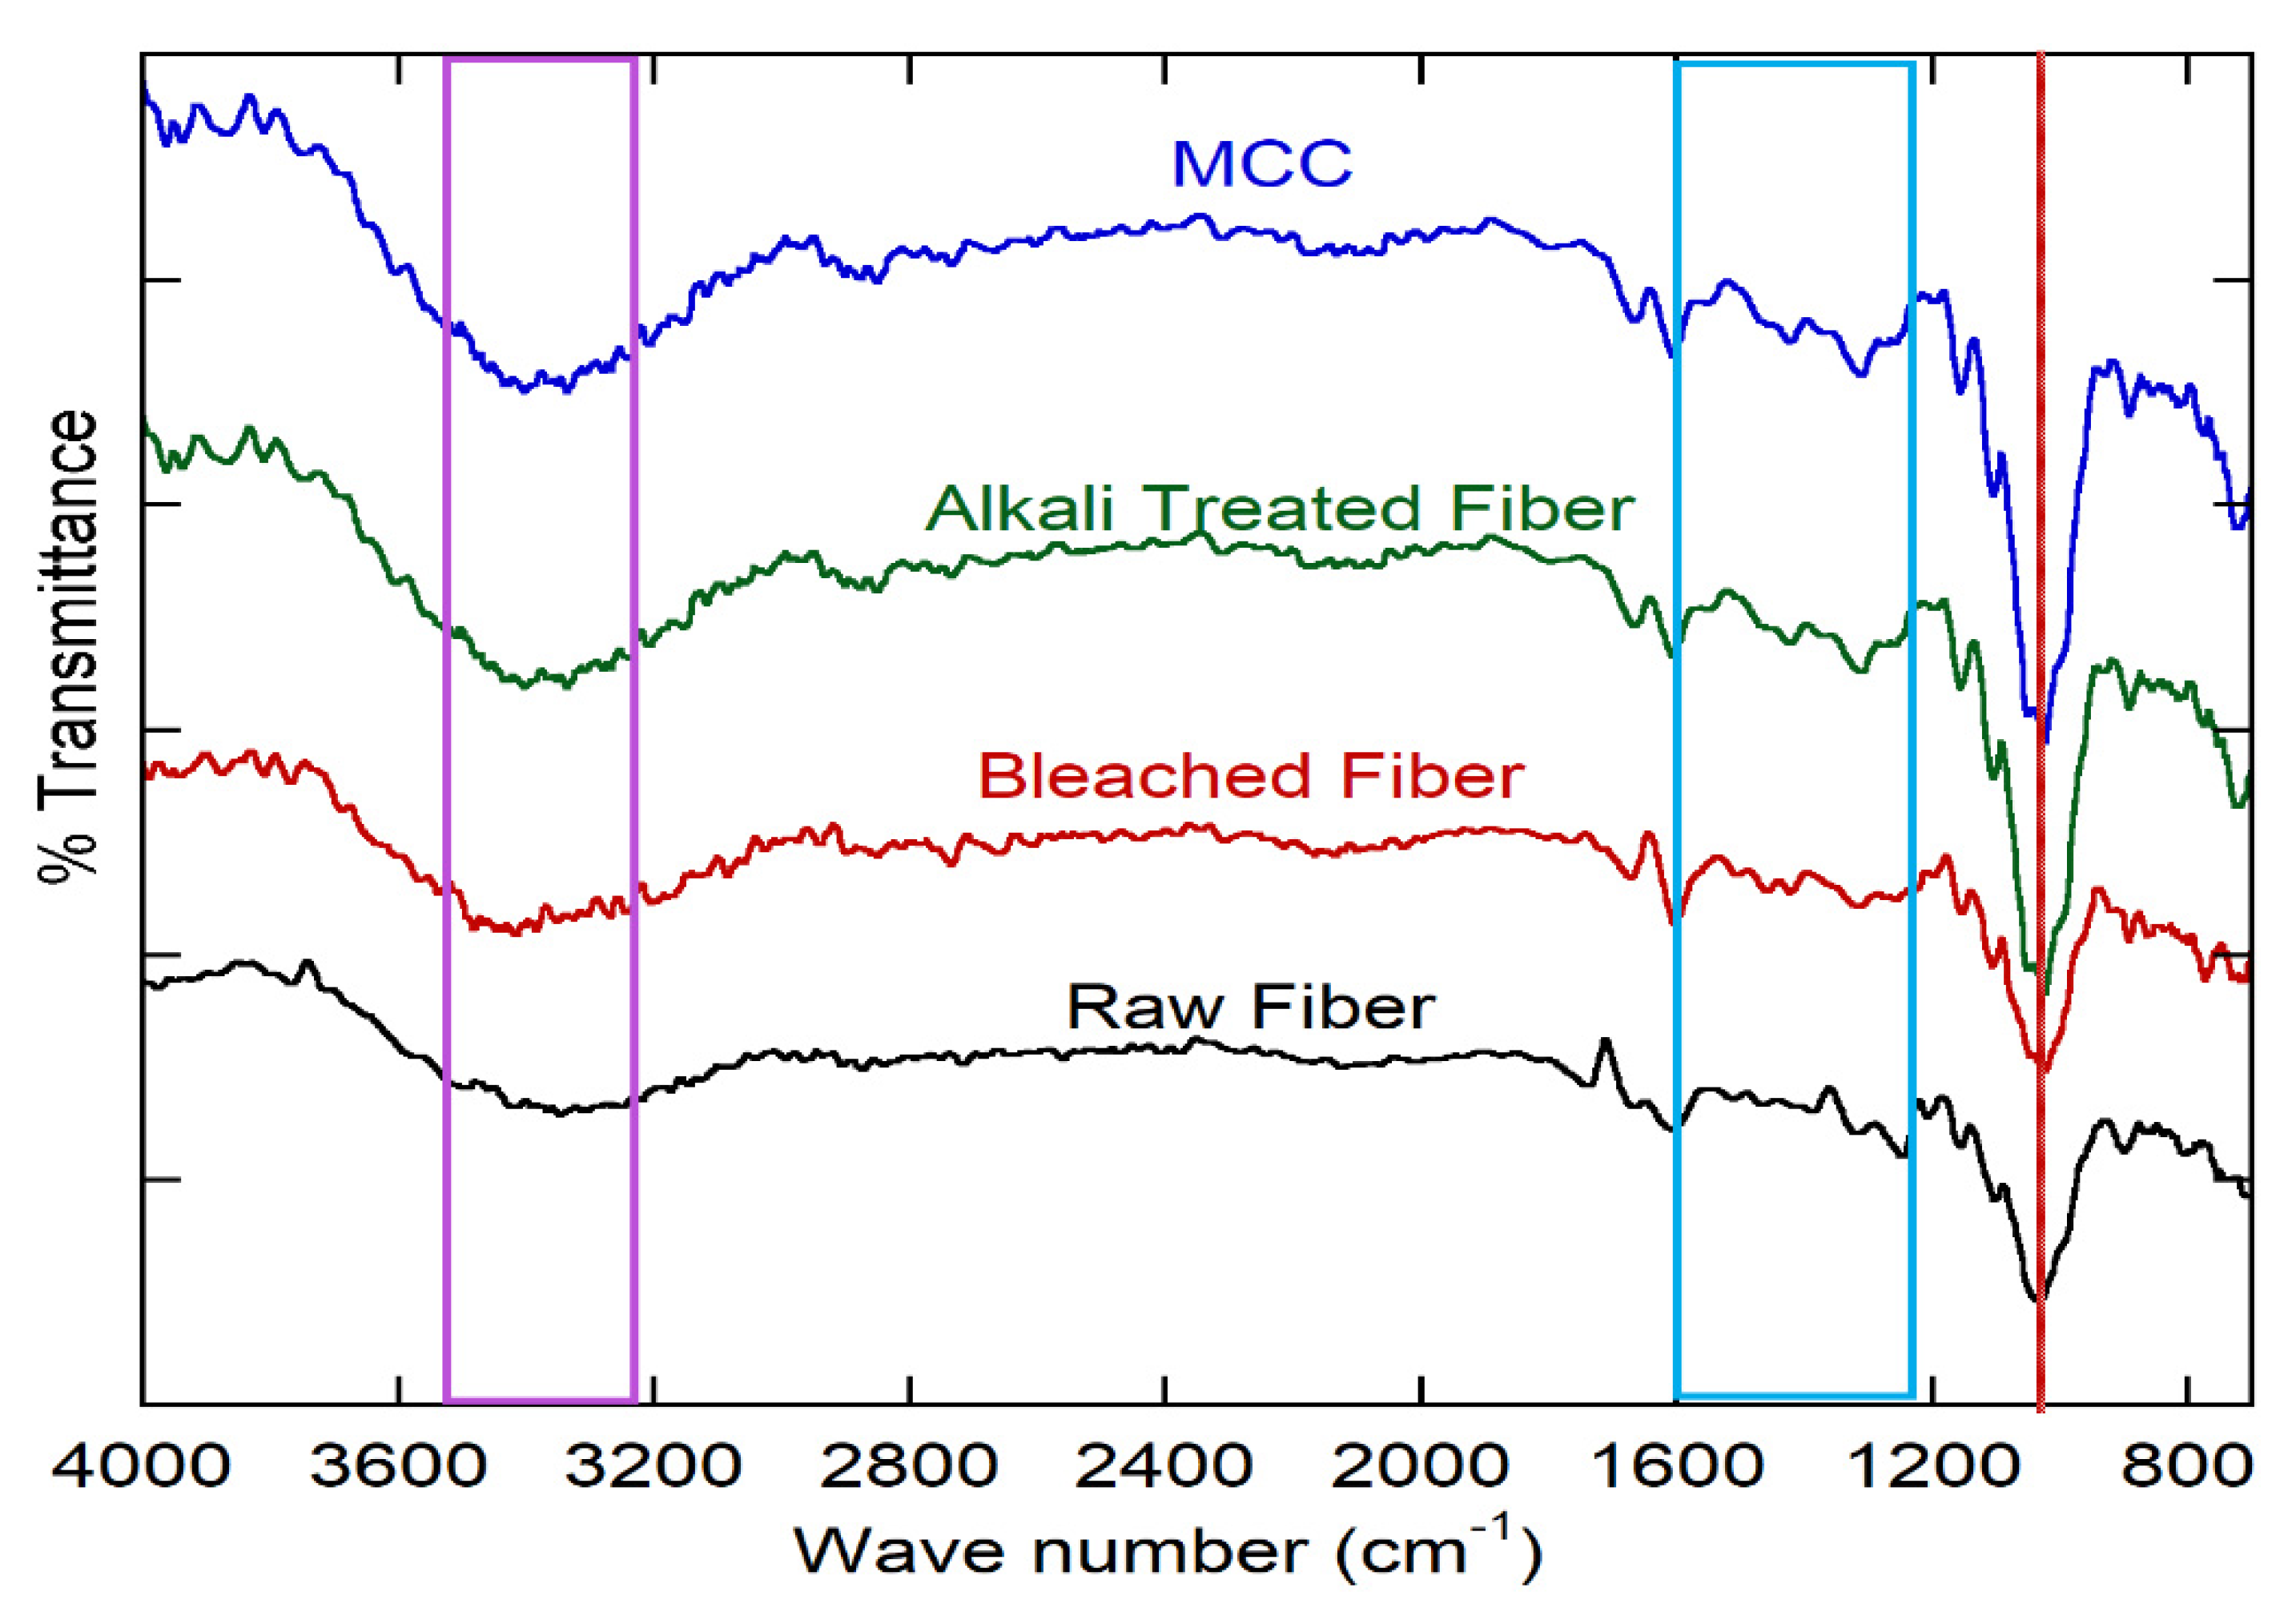
3.1.2. FTIR of Different Okra Fiber
3.1.3. XRD Analysis
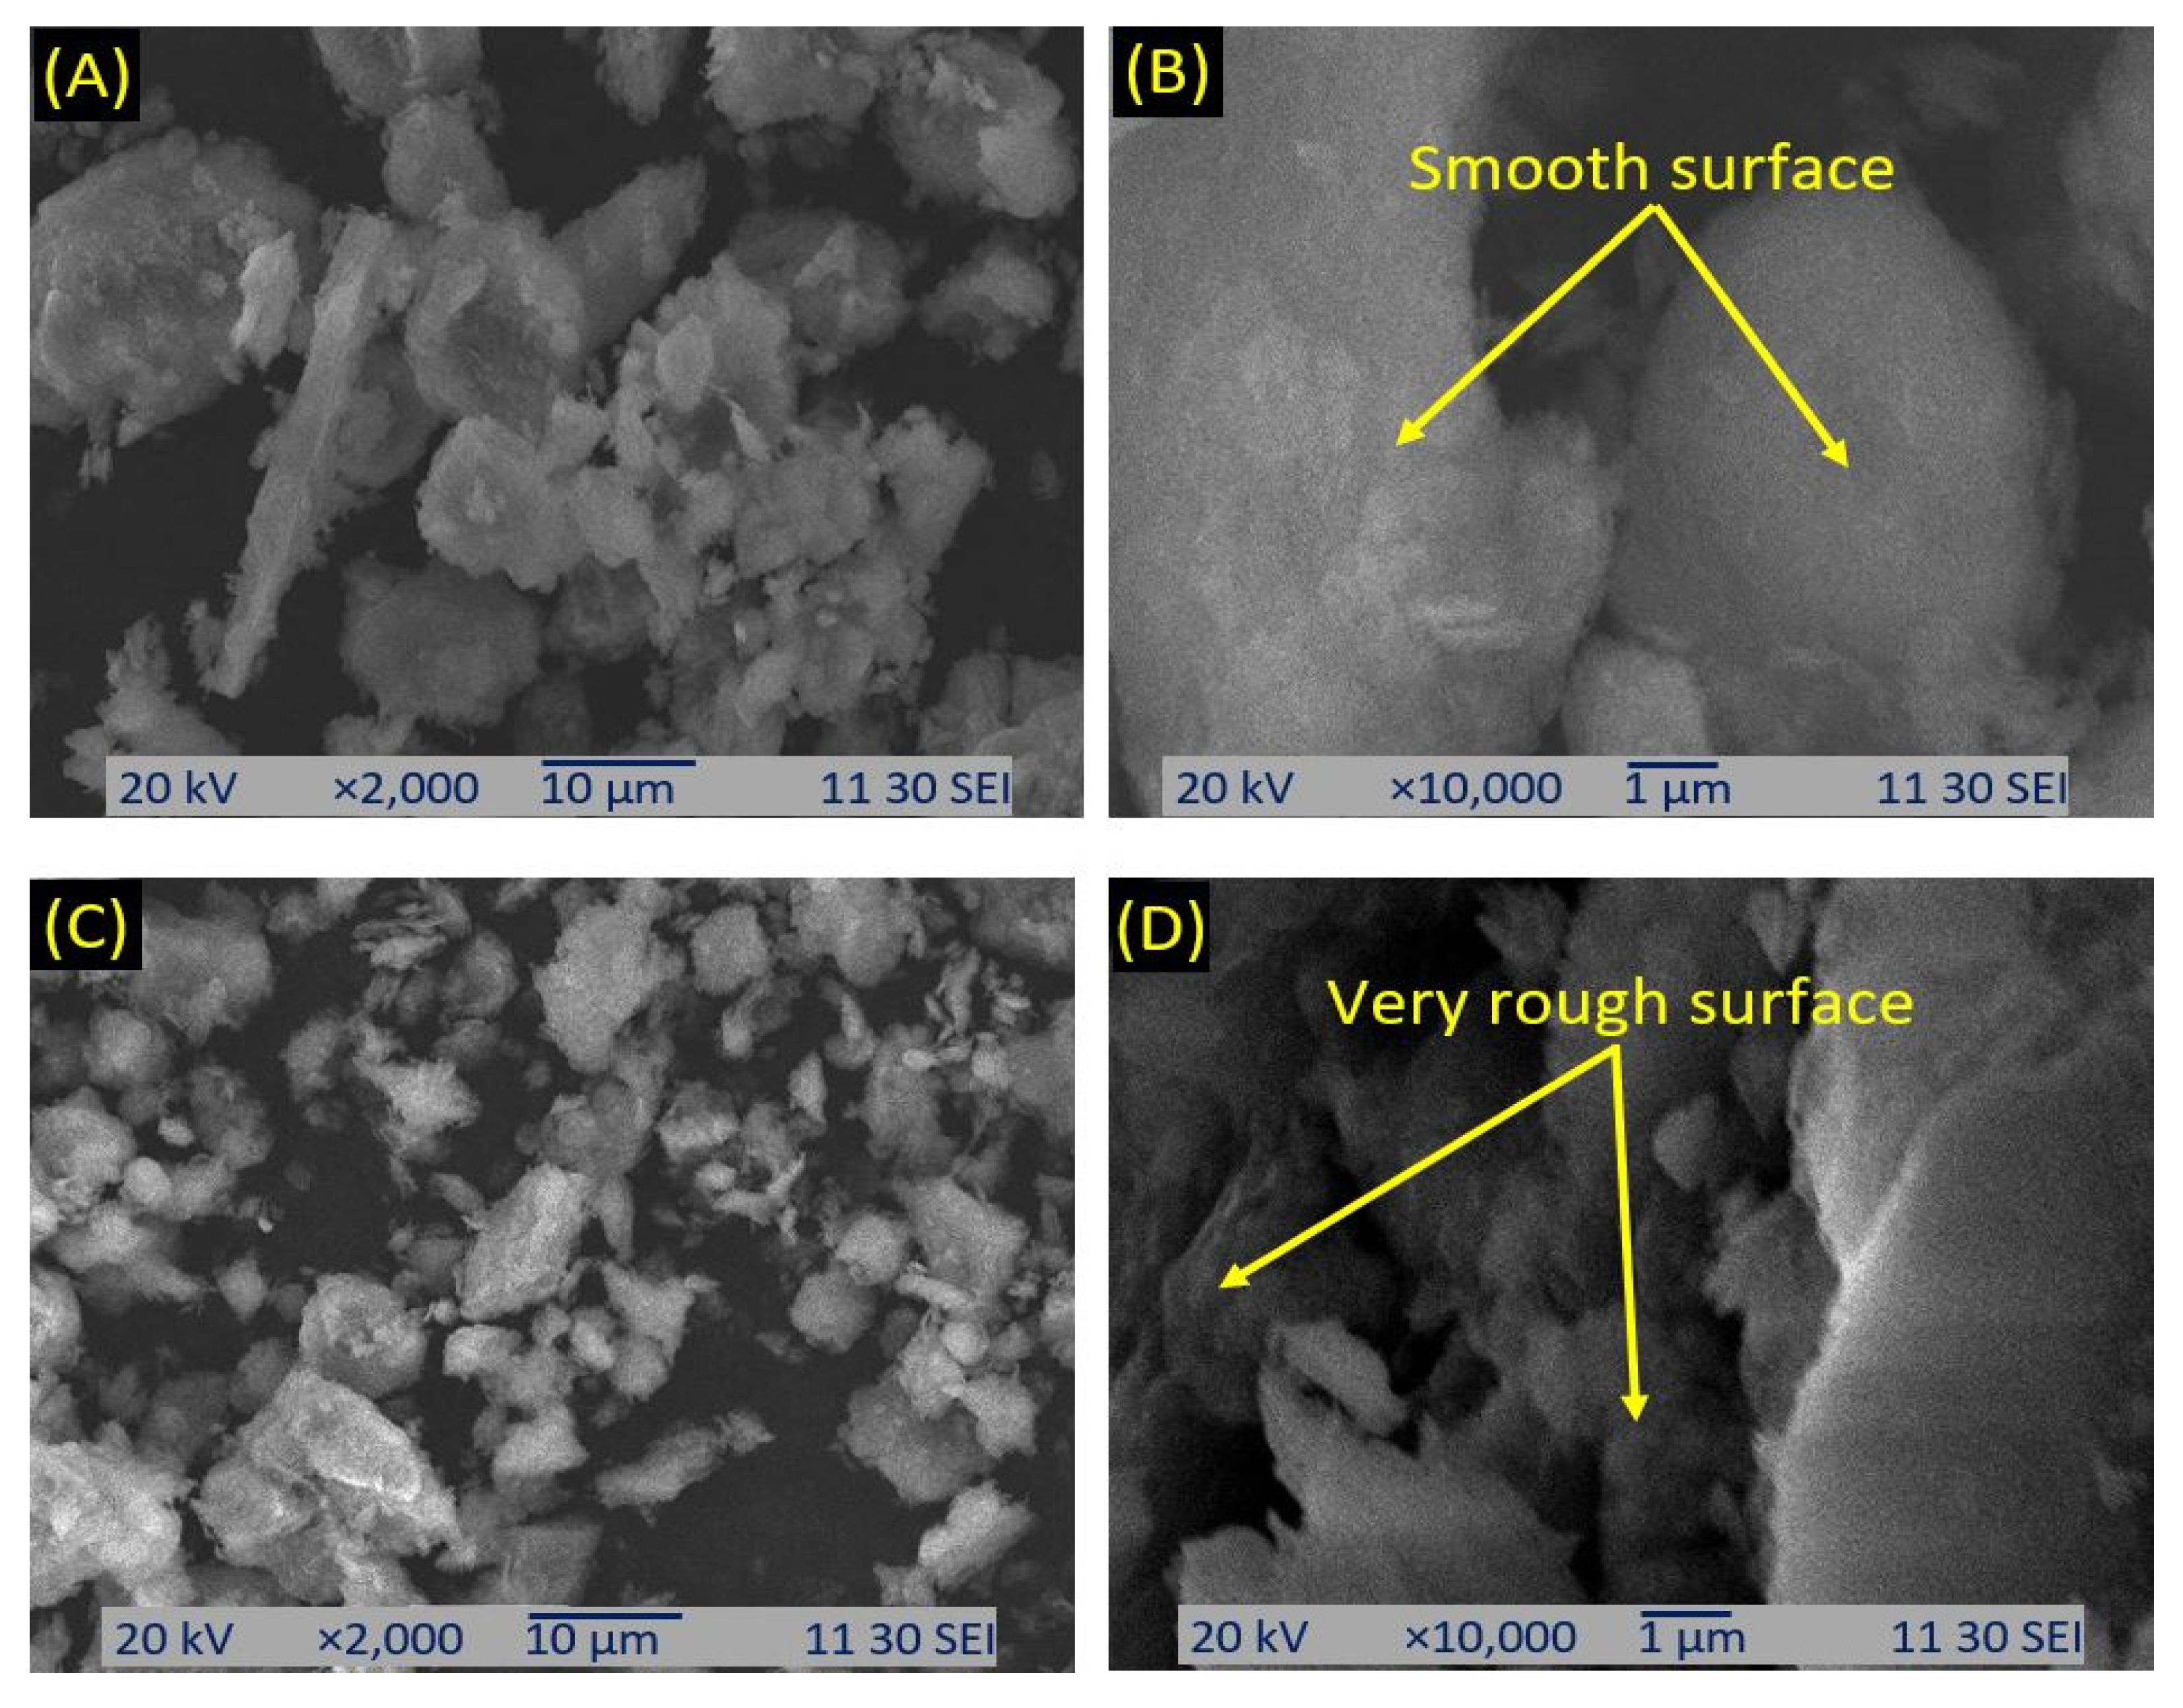
3.1.4. SEM Analysis
3.2. Characterization of Clay
3.2.1. SEM Analysis of Clay
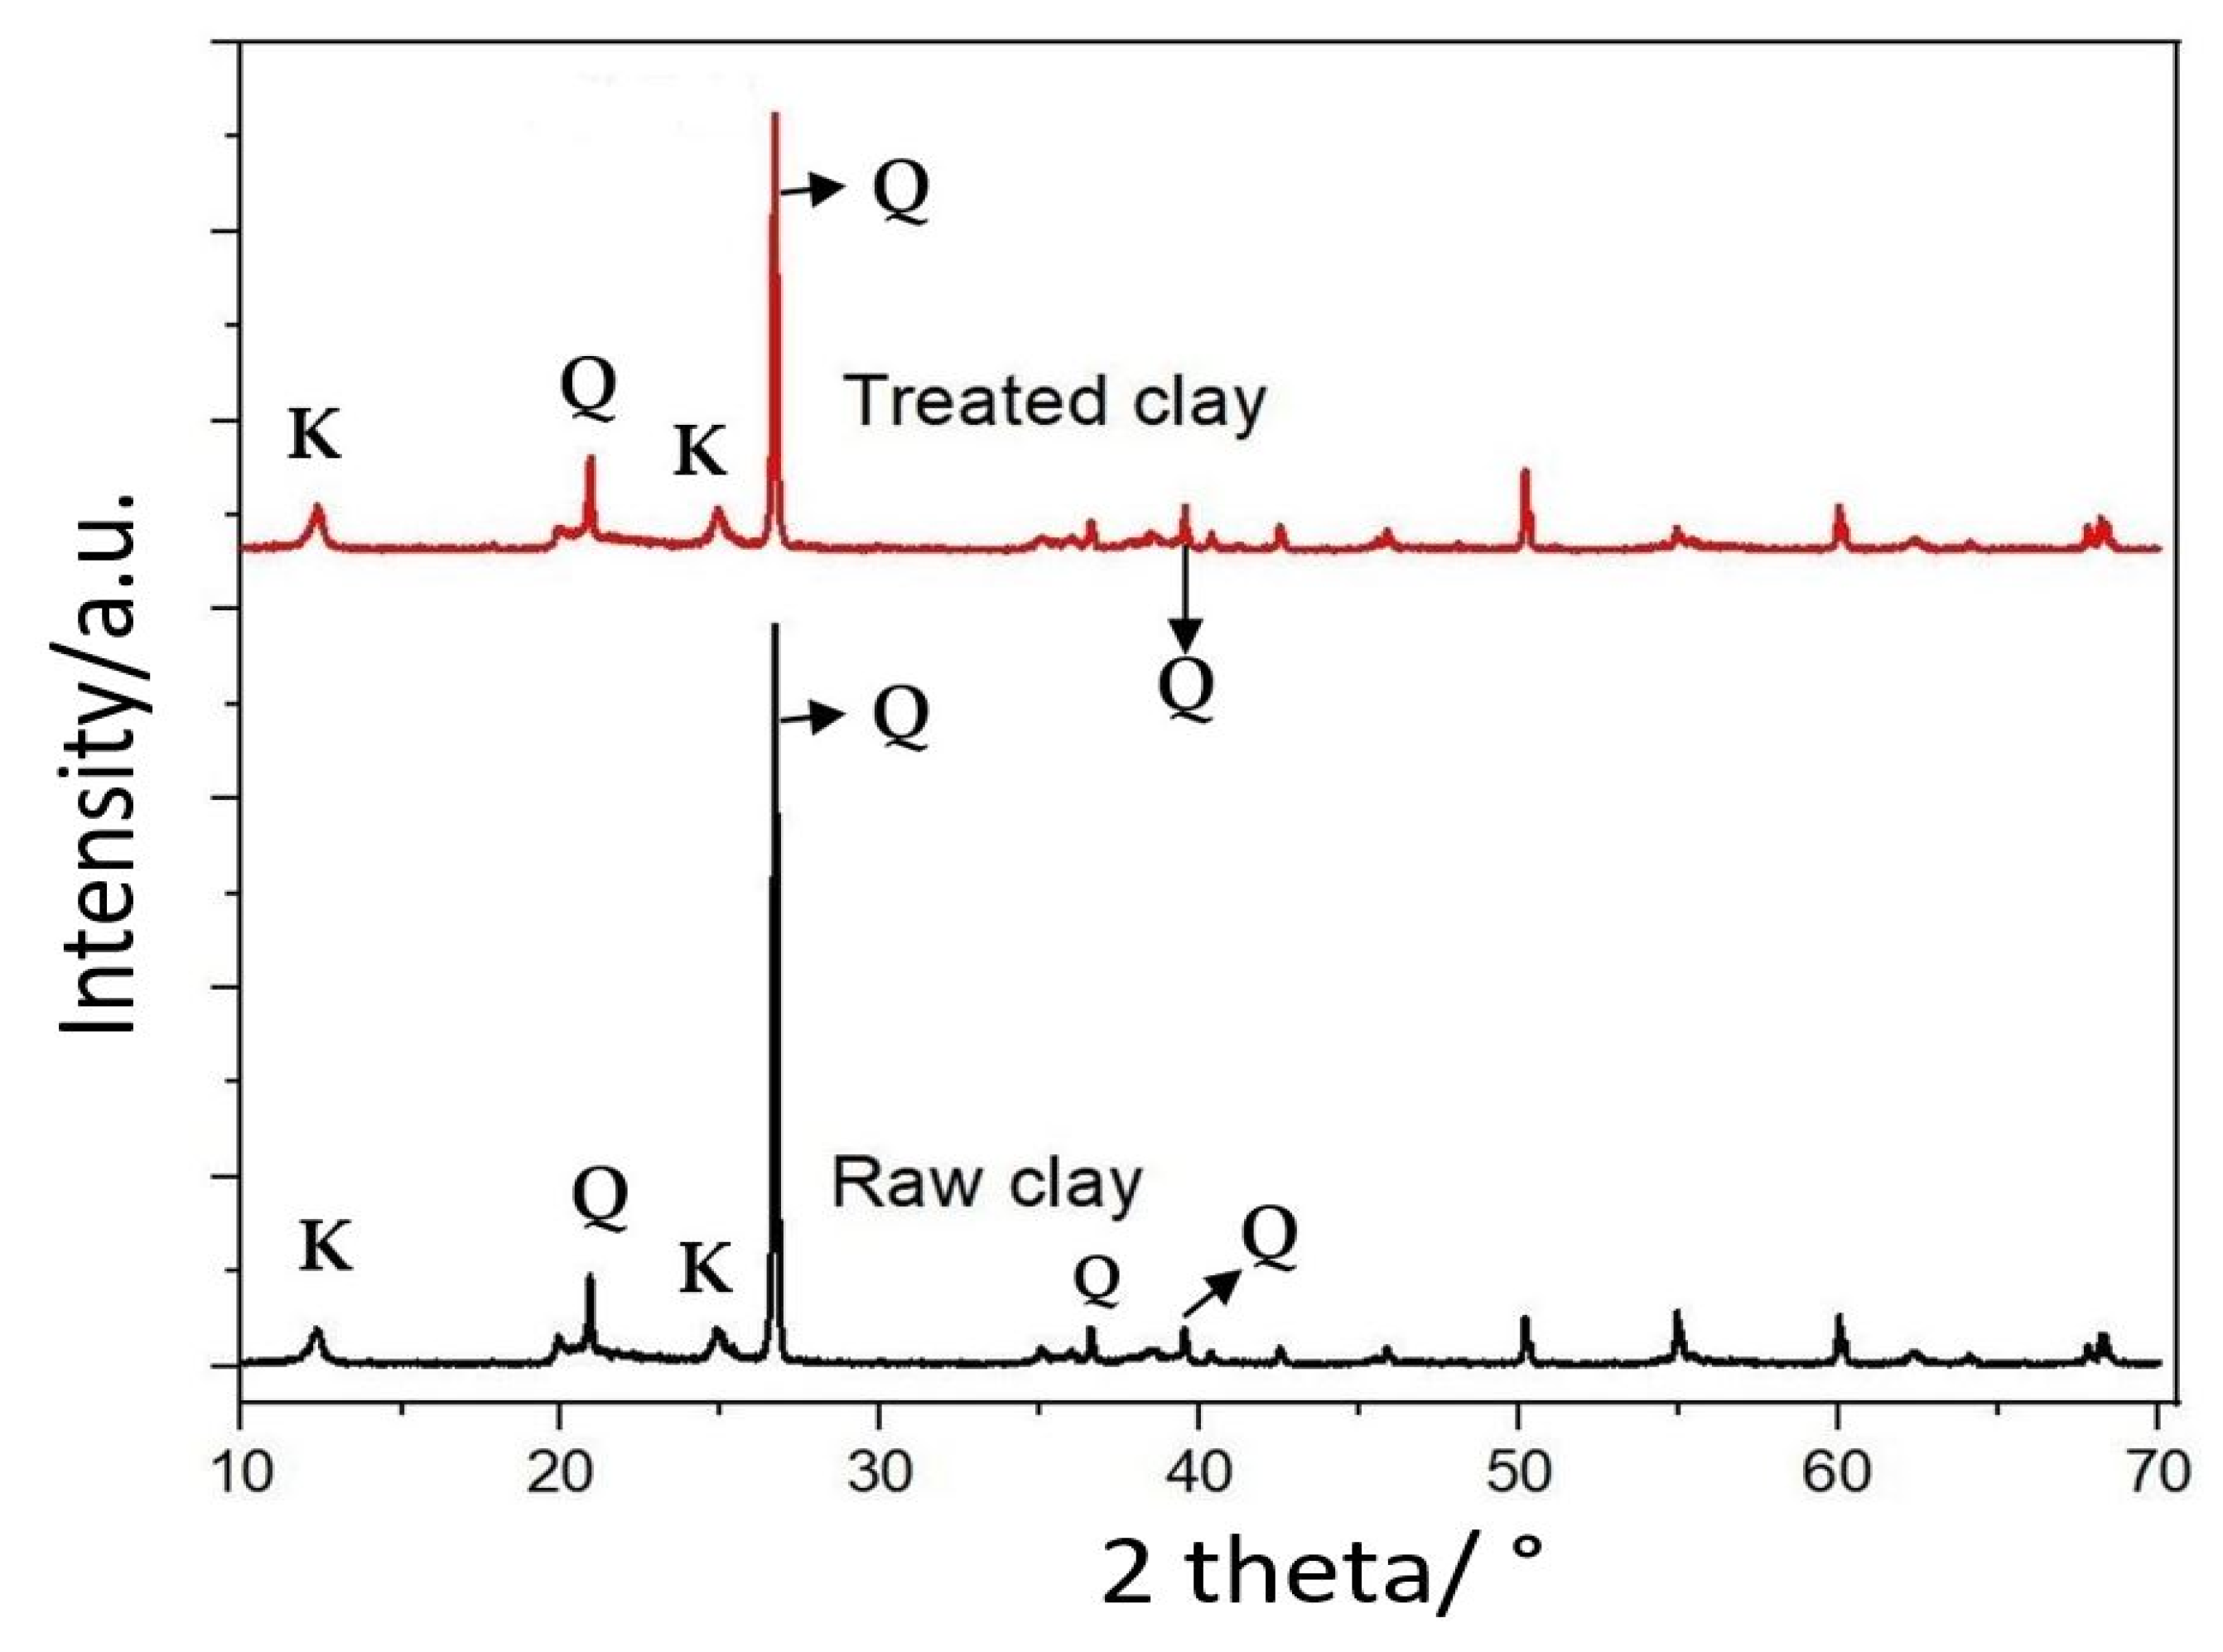
3.2.2. XRD Analysis of Clay
3.3. Characterization of Column
3.3.1. Metal Analysis by AAS
3.3.2. Dye Absorbance Analysis by UV–Vis Spectrophotometer
3.3.3. XRD Analysis of Packing Columns
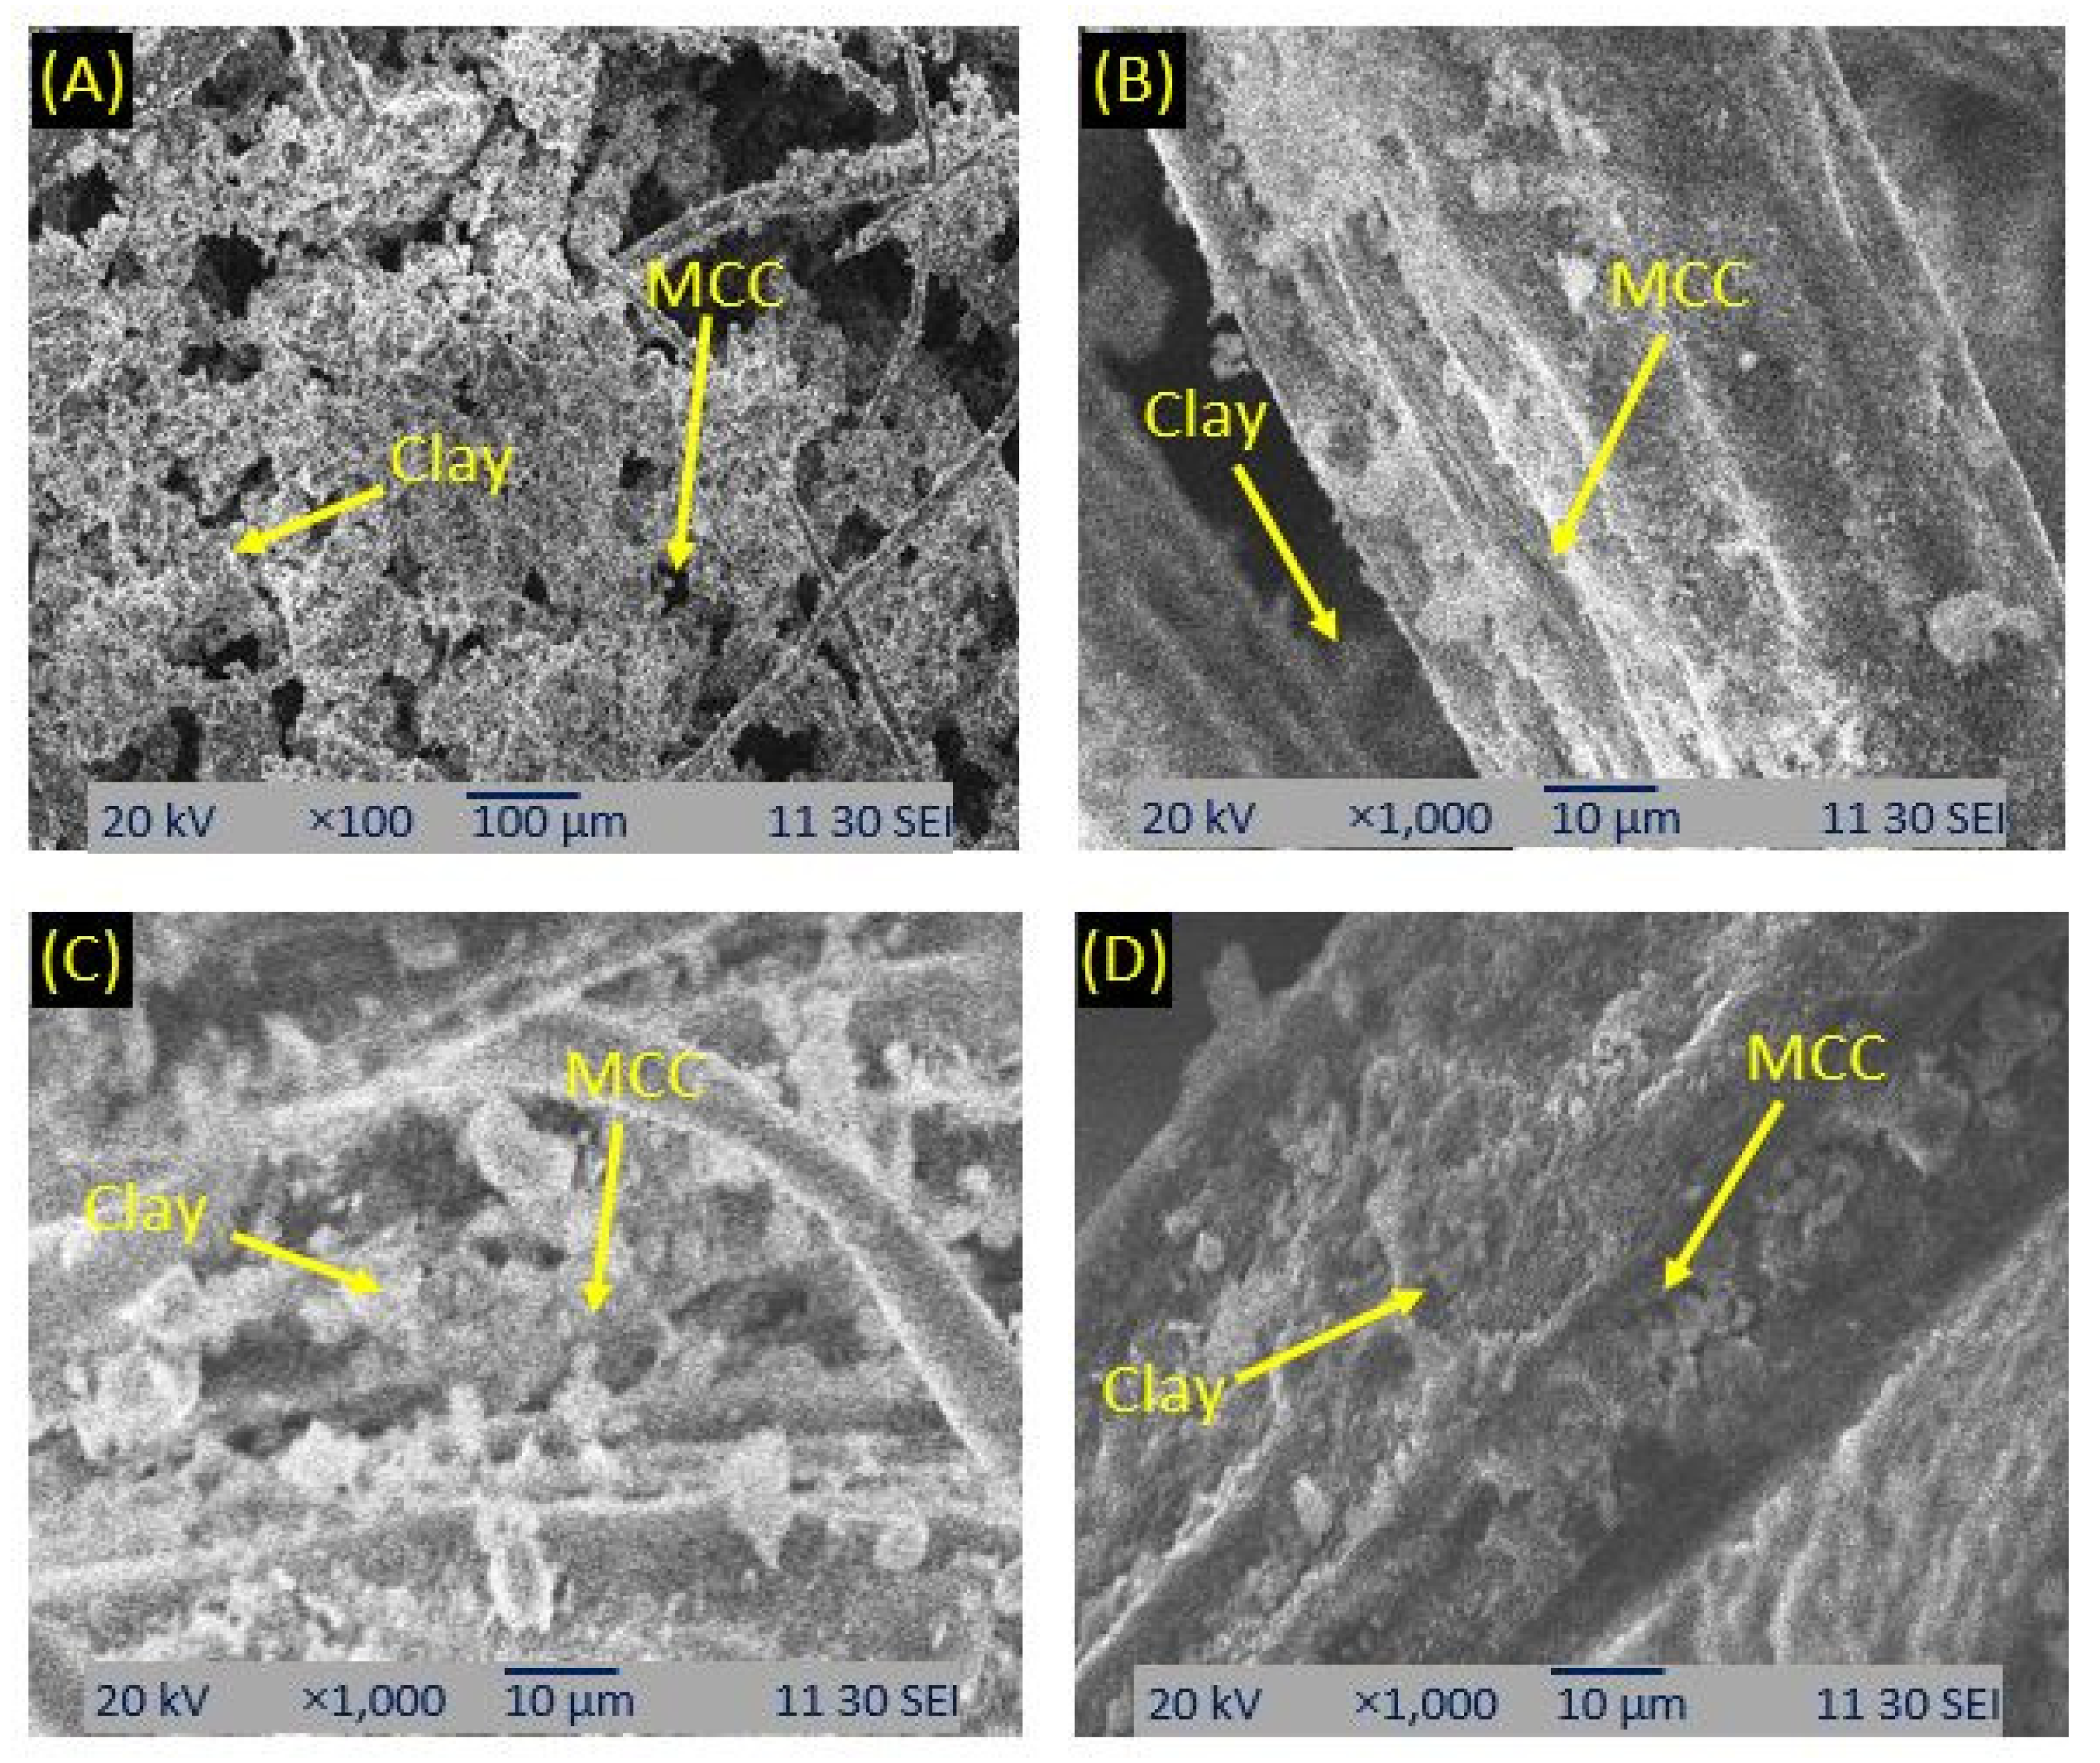
3.3.4. SEM Analysis
4. Conclusions
Supplementary Materials
Author Contributions
Funding
Data Availability Statement
Conflicts of Interest
References
- Grey, D.; Garrick, D.; Blackmore, D.; Kelman, J.; Muller, M.; Sadoff, C. Water security in one blue planet: Twenty-first century policy challenges for science. Philos. Trans. R. Soc. A Math. Phys. Eng. Sci. 2013, 371, 20120406. [Google Scholar] [CrossRef] [Green Version]
- Vörösmarty, C.J.; McIntyre, P.B.; Gessner, M.O.; Dudgeon, D.; Prusevich, A.; Green, P.; Glidden, S.; Bunn, S.E.; Sullivan, C.A.; Liermann, C.R. Global threats to human water security and river biodiversity. Nature 2010, 467, 555–561. [Google Scholar] [CrossRef] [Green Version]
- Bakker, K. Water security: Research challenges and opportunities. Science 2012, 337, 914–915. [Google Scholar] [CrossRef] [PubMed]
- Peralta-Videa, J.R.; Lopez, M.L.; Narayan, M.; Saupe, G.; Gardea-Torresdey, J. The biochemistry of environmental heavy metal uptake by plants: Implications for the food chain. Int. J. Biochem. Cell Biol. 2009, 41, 1665–1677. [Google Scholar] [CrossRef] [PubMed]
- Sultana, M.; Rownok, M.H.; Sabrin, M.; Rahaman, M.H.; Alam, S.N. A review on experimental chemically modified activated carbon to enhance dye and heavy metals adsorption. Clean. Eng. Technol. 2022, 6, 100382. [Google Scholar] [CrossRef]
- Alloway, B.J. Sources of heavy metals and metalloids in soils. In Heavy Metals in Soils; Springer: Berlin/Heidelberg, Germany, 2013; pp. 11–50. [Google Scholar]
- Ali, I. New generation adsorbents for water treatment. Chem. Rev. 2012, 112, 5073–5091. [Google Scholar] [CrossRef] [PubMed]
- Sholl, D.S.; Lively, R.P. Seven chemical separations to change the world. Nature 2016, 532, 435–437. [Google Scholar] [CrossRef] [Green Version]
- Sujatha, S.; Rajamohan, N.; Anbazhagan, S.; Vanithasri, M.; Rajasimman, M. Extraction of nickel using a green emulsion liquid membrane–Process intensification, parameter optimization and artificial neural network modeling. Chem. Eng. Process-Process Intensif. 2021, 165, 108444. [Google Scholar] [CrossRef]
- Hashem, M.A.; Nur-A-Tomal, M.S.; Mondal, N.R.; Rahman, M.A. Hair burning and liming in tanneries is a source of pollution by arsenic, lead, zinc, manganese and iron. Environ. Chem. Lett. 2017, 15, 501–506. [Google Scholar] [CrossRef]
- Rahman, A.; Rahaman, H. Contamination of arsenic, manganese and coliform bacteria in groundwater at Kushtia District, Bangladesh: Human health vulnerabilities. J. Water Health 2018, 16, 782–795. [Google Scholar] [CrossRef] [Green Version]
- Talukdar, M.; Hasnine, M. Application of Chitosan-Based Filtration Technique for Removal of Heavy Metals from Surface Water. Int. Res. J. Environ. Sci. 2014, 3, 5–10. [Google Scholar]
- WHO. World Health Organization. Guidelines for Drinking-Water Quality, 4th ed.; World Health Organization: Geneva, Switzerland, 2011. [Google Scholar]
- ECR. Environment Conservation Rules; Department of Environment & Forest Ministry, Government of Bangladesh: Dhaka, Bangladesh, 1997; pp. 206–207.
- Hernández-Hernández, K.; Illescas, J.; Díaz-Nava, M.; Muro-Urista, C.; Martínez-Gallegos, S.; Ortega-Aguilar, R. Polymer-clay nanocomposites and composites: Structures, characteristics, and their applications in the removal of organic compounds of environmental interest. Med. Chem 2016, 6, 201–210. [Google Scholar] [CrossRef]
- Rahman, M.A.; Lamb, D.; Rahman, M.M.; Bahar, M.M.; Sanderson, P.; Abbasi, S.; Bari, A.F.; Naidu, R. Removal of arsenate from contaminated waters by novel zirconium and zirconium-iron modified biochar. J. Hazard. Mater. 2021, 409, 124488. [Google Scholar] [CrossRef] [PubMed]
- Rahman, M.A.; Lamb, D.; Rahman, M.M.; Bahar, M.M.; Sanderson, P. Adsorption–Desorption Behavior of Arsenate Using Single and Binary Iron-Modified Biochars: Thermodynamics and Redox Transformation. ACS Omega 2022, 7, 101–117. [Google Scholar] [CrossRef]
- Huang, N.; Zhai, L.; Xu, H.; Jiang, D. Stable covalent organic frameworks for exceptional mercury removal from aqueous solutions. J. Am. Chem. Soc. 2017, 139, 2428–2434. [Google Scholar] [CrossRef]
- Li, B.; Zhang, Y.; Ma, D.; Shi, Z.; Ma, S. Mercury nano-trap for effective and efficient removal of mercury (II) from aqueous solution. Nat. Commun. 2014, 5, 1–7. [Google Scholar] [CrossRef] [Green Version]
- Vilela, D.; Parmar, J.; Zeng, Y.; Zhao, Y.; Sánchez, S. Graphene-based microbots for toxic heavy metal removal and recovery from water. Nano Lett. 2016, 16, 2860–2866. [Google Scholar] [CrossRef] [Green Version]
- Rahaman, M.H.; Islam, M.A.; Islam, M.M.; Rahman, M.A.; Alam, S.N. Biodegradable composite adsorbent of modified cellulose and chitosan to remove heavy metal ions from aqueous solution. Curr. Res. Green Sustain. Chem. 2021, 4, 100119. [Google Scholar] [CrossRef]
- Berslin, D.; Reshmi, A.; Sivaprakash, B.; Rajamohan, N.; Kumar, P.S. Remediation of emerging metal pollutants using environment friendly biochar-Review on applications and mechanism. Chemosphere 2022, 290, 133384. [Google Scholar] [CrossRef]
- Kołodyńska, D.; Krukowska, J.; Thomas, P. Comparison of sorption and desorption studies of heavy metal ions from biochar and commercial active carbon. Chem. Eng. J. 2017, 307, 353–363. [Google Scholar] [CrossRef]
- Seliman, A.; Lasheen, Y.; Youssief, M.; Abo-Aly, M.; Shehata, F. Removal of some radionuclides from contaminated solution using natural clay: Bentonite. J. Radioanal. Nucl. Chem. 2014, 300, 969–979. [Google Scholar] [CrossRef]
- Lu, X.; Wang, F.; Li, X.-Y.; Shih, K.; Zeng, E.Y. Adsorption and thermal stabilization of Pb2+ and Cu2+ by zeolite. Ind. Eng. Chem. Res. 2016, 55, 8767–8773. [Google Scholar] [CrossRef]
- Mon, M.; Ferrando-Soria, J.; Grancha, T.; Fortea-Perez, F.R.; Gascon, J.; Leyva-Perez, A.; Armentano, D.; Pardo, E. Selective gold recovery and catalysis in a highly flexible methionine-decorated metal–organic framework. J. Am. Chem. Soc. 2016, 138, 7864–7867. [Google Scholar] [CrossRef]
- Sun, Q.; Aguila, B.; Perman, J.; Earl, L.D.; Abney, C.W.; Cheng, Y.; Wei, H.; Nguyen, N.; Wojtas, L.; Ma, S. Postsynthetically modified covalent organic frameworks for efficient and effective mercury removal. J. Am. Chem. Soc. 2017, 139, 2786–2793. [Google Scholar] [CrossRef] [PubMed]
- Chakraborty, A.; Bhattacharyya, S.; Hazra, A.; Ghosh, A.C.; Maji, T.K. Post-synthetic metalation in an anionic MOF for efficient catalytic activity and removal of heavy metal ions from aqueous solution. Chem. Commun. 2016, 52, 2831–2834. [Google Scholar] [CrossRef]
- Aguila, B.; Sun, Q.; Perman, J.A.; Earl, L.D.; Abney, C.W.; Elzein, R.; Schlaf, R.; Ma, S. Efficient mercury capture using functionalized porous organic polymer. Adv. Mater. 2017, 29, 1700665. [Google Scholar] [CrossRef] [PubMed]
- Fratzl, P. Biomimetic materials research: What can we really learn from nature’s structural materials? J. R. Soc. Interface 2007, 4, 637–642. [Google Scholar] [CrossRef] [Green Version]
- Wicklein, B.; Salazar-Alvarez, G. Functional hybrids based on biogenic nanofibrils and inorganic nanomaterials. J. Mater. Chem. A 2013, 1, 5469–5478. [Google Scholar] [CrossRef] [Green Version]
- Nechyporchuk, O.; Belgacem, M.N.; Bras, J. Production of cellulose nanofibrils: A review of recent advances. Ind. Crops Prod. 2016, 93, 2–25. [Google Scholar] [CrossRef]
- Sticklen, M.B. Plant genetic engineering for biofuel production: Towards affordable cellulosic ethanol. Nat. Rev. Genet. 2008, 9, 433–443. [Google Scholar] [CrossRef]
- Abe, K.; Iwamoto, S.; Yano, H. Obtaining cellulose nanofibers with a uniform width of 15 nm from wood. Biomacromolecules 2007, 8, 3276–3278. [Google Scholar] [CrossRef]
- Chen, Y.; Liu, C.; Chang, P.R.; Cao, X.; Anderson, D.P. Bionanocomposites based on pea starch and cellulose nanowhiskers hydrolyzed from pea hull fibre: Effect of hydrolysis time. Carbohydr. Polym. 2009, 76, 607–615. [Google Scholar] [CrossRef]
- Abe, K.; Yano, H. Comparison of the characteristics of cellulose microfibril aggregates isolated from fiber and parenchyma cells of Moso bamboo (Phyllostachys pubescens). Cellulose 2010, 17, 271–277. [Google Scholar] [CrossRef]
- Morán, J.I.; Alvarez, V.A.; Cyras, V.P.; Vázquez, A. Extraction of cellulose and preparation of nanocellulose from sisal fibers. Cellulose 2008, 15, 149–159. [Google Scholar] [CrossRef]
- Alemdar, A.; Sain, M. Isolation and characterization of nanofibers from agricultural residues–Wheat straw and soy hulls. Bioresour. Technol. 2008, 99, 1664–1671. [Google Scholar] [CrossRef]
- Li, R.; Fei, J.; Cai, Y.; Li, Y.; Feng, J.; Yao, J. Cellulose whiskers extracted from mulberry: A novel biomass production. Carbohydr. Polym. 2009, 76, 94–99. [Google Scholar] [CrossRef]
- de Morais Teixeira, E.; Corrêa, A.C.; Manzoli, A.; de Lima Leite, F.; de Oliveira, C.R.; Mattoso, L.H.C. Cellulose nanofibers from white and naturally colored cotton fibers. Cellulose 2010, 17, 595–606. [Google Scholar] [CrossRef]
- Wang, B.; Sain, M.; Oksman, K. Study of structural morphology of hemp fiber from the micro to the nanoscale. Appl. Compos. Mater. 2007, 14, 89–103. [Google Scholar] [CrossRef]
- Rosa, M.; Medeiros, E.; Malmonge, J.; Gregorski, K.; Wood, D.; Mattoso, L.; Glenn, G.; Orts, W.; Imam, S. Cellulose nanowhiskers from coconut husk fibers: Effect of preparation conditions on their thermal and morphological behavior. Carbohydr. Polym. 2010, 81, 83–92. [Google Scholar] [CrossRef]
- Zuluaga, R.; Putaux, J.L.; Cruz, J.; Vélez, J.; Mondragon, I.; Gañán, P. Cellulose microfibrils from banana rachis: Effect of alkaline treatments on structural and morphological features. Carbohydr. Polym. 2009, 76, 51–59. [Google Scholar] [CrossRef]
- De Rosa, I.M.; Kenny, J.M.; Puglia, D.; Santulli, C.; Sarasini, F. Morphological, thermal and mechanical characterization of okra (Abelmoschus esculentus) fibres as potential reinforcement in polymer composites. Compos. Sci. Technol. 2010, 70, 116–122. [Google Scholar] [CrossRef]
- Dinand, E.; Chanzy, H.; Vignon, R. Suspensions of cellulose microfibrils from sugar beet pulp. Food Hydrocoll. 1999, 13, 275–283. [Google Scholar] [CrossRef]
- Jiang, F.; Kondo, T.; Hsieh, Y.-L. Rice straw cellulose nanofibrils via aqueous counter collision and differential centrifugation and their self-assembled structures. ACS Sustain. Chem. Eng. 2016, 4, 1697–1706. [Google Scholar] [CrossRef] [Green Version]
- Kang, X.; Sun, P.; Kuga, S.; Wang, C.; Zhao, Y.; Wu, M.; Huang, Y. Thin cellulose nanofiber from corncob cellulose and its performance in transparent nanopaper. ACS Sustain. Chem. Eng. 2017, 5, 2529–2534. [Google Scholar] [CrossRef]
- Amiralian, N.; Annamalai, P.K.; Memmott, P.; Taran, E.; Schmidt, S.; Martin, D.J. Easily deconstructed, high aspect ratio cellulose nanofibres from Triodia pungens; an abundant grass of Australia’s arid zone. RSC Adv. 2015, 5, 32124–32132. [Google Scholar] [CrossRef] [Green Version]
- Voisin, H.; Bergström, L.; Liu, P.; Mathew, A.P. Nanocellulose-based materials for water purification. Nanomaterials 2017, 7, 57. [Google Scholar] [CrossRef] [Green Version]
- Sheltami, R.M.E.; Abdullah, I.; Ahmad, I. Structural Characterisation of Cellulose and Nanocellulose Extracted from Mengkuang Leaves. Adv. Mater. Res. 2012, 545, 119–123. [Google Scholar] [CrossRef]
- Wolfe, T.A.; Demirel, T.; Baumann, E.R. Adsorption of organic pollutants on montmorillonite treated with amines. J. Water Pollut. Control Fed. 1986, 58, 68–76. [Google Scholar]
- Luh, M.-D.; Baker, R.A. Vapor phase sorption of phenol on selected clays. J. Colloid Interface Sci. 1970, 33, 539–547. [Google Scholar] [CrossRef]
- Oliveira, L.C.; Rios, R.V.; Fabris, J.D.; Sapag, K.; Garg, V.K.; Lago, R.M. Clay–iron oxide magnetic composites for the adsorption of contaminants in water. Appl. Clay Sci. 2003, 22, 169–177. [Google Scholar] [CrossRef]
- Miran, M.; Mollah, M.; Hussain, A.; Rahman, M. A multi-technique characterization of Bijoypur clay. Bangladesh J. Sci. Res 2008, 21, 2. [Google Scholar]
- Varga, G. The structure of kaolinite and metakaolinite. Epitoanyag 2007, 59, 6–9. [Google Scholar] [CrossRef]
- Madejová, J. FTIR techniques in clay mineral studies. Vib. Spectrosc. 2003, 31, 1–10. [Google Scholar] [CrossRef]
- Ci, Z.; Yue, Y.; Xiao, J.; Huang, X.; Sun, Y. Spectroscopic and modeling investigation of U (VI) removal mechanism on nanoscale zero-valent iron/clay composites. J. Colloid Interface Sci. 2023, 630, 395–403. [Google Scholar] [CrossRef] [PubMed]
- Ghasemi, H.; Afshang, M.; Gilvari, T.; Aghabarari, B.; Mozaffari, S. Rapid and effective removal of heavy metal ions from aqueous solution using nanostructured clay particles. Results Surf. Interfaces 2023, 100097. [Google Scholar] [CrossRef]
- Sjöberg, M.; Bergström, L.; Larsson, A.; Sjöström, E. The effect of polymer and surfactant adsorption on the colloidal stability and rheology of kaolin dispersions. Colloids Surf. A Physicochem. Eng. Asp. 1999, 159, 197–208. [Google Scholar] [CrossRef]
- Lin, S.-H.; Juang, R.-S. Heavy metal removal from water by sorption using surfactant-modified montmorillonite. J. Hazard. Mater. 2002, 92, 315–326. [Google Scholar] [CrossRef]
- Mu, B.; Wang, A. One-pot fabrication of multifunctional superparamagnetic attapulgite/Fe 3 O 4/polyaniline nanocomposites served as an adsorbent and catalyst support. J. Mater. Chem. A 2015, 3, 281–289. [Google Scholar] [CrossRef]
- Yang, S.; Ren, X.; Zhao, G.; Shi, W.; Montavon, G.; Grambow, B.; Wang, X. RETRACTED: Competitive sorption and selective sequence of Cu (II) and Ni (II) on montmorillonite: Batch, modeling, EPR and XAS studies. Geochim. Cosmochim. Acta 2015, 166, 129–145. [Google Scholar] [CrossRef]
- Yang, S.; Okada, N.; Nagatsu, M. The highly effective removal of Cs+ by low turbidity chitosan-grafted magnetic bentonite. J. Hazard. Mater. 2016, 301, 8–16. [Google Scholar] [CrossRef]
- Maniruzzaman, M.; Rahman, M.; Zaman, M. Composition of agave atroverance fiber. Jahangirnagar Univ. J. Sci. 2005, 28, 23–30. [Google Scholar]
- Sarkar, P.; Mazumdar, A.; Pal, K. 4—The hemicelluloses of jute fibre. J. Text. Inst. Trans. 1948, 39, T44–T58. [Google Scholar] [CrossRef]
- Nascimento, D.M.; Nunes, Y.L.; Figueirêdo, M.C.; de Azeredo, H.M.; Aouada, F.A.; Feitosa, J.P.; Rosa, M.F.; Dufresne, A. Nanocellulose nanocomposite hydrogels: Technological and environmental issues. Green Chem. 2018, 20, 2428–2448. [Google Scholar] [CrossRef] [Green Version]
- Yang, J.; Han, C.-R.; Duan, J.-F.; Ma, M.-G.; Zhang, X.-M.; Xu, F.; Sun, R.-C.; Xie, X.-M. Studies on the properties and formation mechanism of flexible nanocomposite hydrogels from cellulose nanocrystals and poly (acrylic acid). J. Mater. Chem. 2012, 22, 22467–22480. [Google Scholar] [CrossRef]
- Rahaman, M.H.; Haque, M.A.; Rahman, M.A.; Rana, M.M.; Parvez, M.M.; Alam, S.N. Grafting of Cellulose and Microcrystalline Cellulose with Oligo (L-lactic acid) by Polycondensation Reaction. Reactions 2022, 3, 213–223. [Google Scholar] [CrossRef]
- Islam, M.M.; Khan, M.N.; Biswas, S.; Choudhury, T.R.; Haque, P.; Rashid, T.U.; Rahman, M.M. Preparation and characterization of bijoypur clay-crystalline cellulose composite for application as an adsorbent. Adv. Mater. Sci 2017, 2, 1–7. [Google Scholar] [CrossRef] [Green Version]
- Gabr, M.H.; Phong, N.T.; Abdelkareem, M.A.; Okubo, K.; Uzawa, K.; Kimpara, I.; Fujii, T. Mechanical, thermal, and moisture absorption properties of nano-clay reinforced nano-cellulose biocomposites. Cellulose 2013, 20, 819–826. [Google Scholar] [CrossRef]
- Rahaman, M.H.; Tsuji, H. Isothermal crystallization and spherulite growth behavior of stereo multiblock poly (lactic acid) s: Effects of block length. J. Appl. Polym. Sci. 2013, 129, 2502–2517. [Google Scholar] [CrossRef]
- American Public Health Association (APHA); American Water Works Association; Water Environment Federation. Standard Methods for the Examination of Water and Wastewater, 22nd ed.; American Public Health Association: Washington, DC, USA, 2012. [Google Scholar]
- Albano, C.; Gonzalez, J.; Ichazo, M.; Kaiser, D. Thermal stability of blends of polyolefins and sisal fiber. Polym. Degrad. Stab. 1999, 66, 179–190. [Google Scholar] [CrossRef]
- Liu, W.; Mohanty, A.; Drzal, L.; Askel, P.; Misra, M. Effects of alkali treatment on the structure, morphology and thermal properties of native grass fibers as reinforcements for polymer matrix composites. J. Mater. Sci. 2004, 39, 1051–1054. [Google Scholar] [CrossRef]
- Zhuo, X.; Liu, C.; Pan, R.; Dong, X.; Li, Y. Nanocellulose Mechanically Isolated from Amorpha fruticosa Linn. ACS Sustain. Chem. Eng. 2017, 5, 4414–4420. [Google Scholar] [CrossRef]
- Chen, W.; Yu, H.; Liu, Y.; Hai, Y.; Zhang, M.; Chen, P. Isolation and characterization of cellulose nanofibers from four plant cellulose fibers using a chemical-ultrasonic process. Cellulose 2011, 18, 433–442. [Google Scholar] [CrossRef]
- Corrales-Ureña, Y.R.; Villalobos-Bermúdez, C.; Pereira, R.; Camacho, M.; Estrada, E.; Argüello-Miranda, O.; Vega-Baudrit, J.R. Biogenic silica-based microparticles obtained as a sub-product of the nanocellulose extraction process from pineapple peels. Sci. Rep. 2018, 8, 10417. [Google Scholar] [CrossRef] [PubMed] [Green Version]
- Sun, X.; Xu, F.; Sun, R.; Fowler, P.; Baird, M. Characteristics of degraded cellulose obtained from steam-exploded wheat straw. Carbohydr. Res. 2005, 340, 97–106. [Google Scholar] [CrossRef] [PubMed]
- Chen, W.; Yu, H.; Liu, Y.; Chen, P.; Zhang, M.; Hai, Y. Individualization of cellulose nanofibers from wood using high-intensity ultrasonication combined with chemical pretreatments. Carbohydr. Polym. 2011, 83, 1804–1811. [Google Scholar] [CrossRef]
- Chen, W.; Abe, K.; Uetani, K.; Yu, H.; Liu, Y.; Yano, H. Individual cotton cellulose nanofibers: Pretreatment and fibrillation technique. Cellulose 2014, 21, 1517–1528. [Google Scholar] [CrossRef]
- Xiao, B.; Sun, X.; Sun, R. Chemical, structural, and thermal characterizations of alkali-soluble lignins and hemicelluloses, and cellulose from maize stems, rye straw, and rice straw. Polym. Degrad. Stab. 2001, 74, 307–319. [Google Scholar] [CrossRef]
- Nishiyama, Y.; Sugiyama, J.; Chanzy, H.; Langan, P. Crystal structure and hydrogen bonding system in cellulose Iα from synchrotron X-ray and neutron fiber diffraction. J. Am. Chem. Soc. 2003, 125, 14300–14306. [Google Scholar] [CrossRef]
- Lenka, S.P.; Shaikh, W.A.; Owens, G.; Padhye, L.P.; Chakraborty, S.; Bhattacharya, T. Removal of copper from water and wastewater using dolochar. Water Air Soil Pollut. 2021, 232, 1–15. [Google Scholar] [CrossRef]
- Ali, I.; Burakov, A.E.; Melezhik, A.V.; Babkin, A.V.; Burakova, I.V.; Neskomornaya, M.E.A.; Galunin, E.V.; Tkachev, A.G.; Kuznetsov, D.V. Removal of copper (II) and zinc (II) ions in water on a newly synthesized polyhydroquinone/graphene nanocomposite material: Kinetics, thermodynamics and mechanism. ChemistrySelect 2019, 4, 12708–12718. [Google Scholar] [CrossRef]
- Ghanavati, B.; Bozorgian, A.; Ghanavati, J. Removal of Copper (II) Ions from the Effluent by Carbon Nanotubes Modified with Tetrahydrofuran. Chem. Rev. Lett. 2022, 5, 68–75. [Google Scholar]
- Bartczak, P.; Norman, M.; Klapiszewski, Ł.; Karwańska, N.; Kawalec, M.; Baczyńska, M.; Wysokowski, M.; Zdarta, J.; Ciesielczyk, F.; Jesionowski, T. Removal of nickel (II) and lead (II) ions from aqueous solution using peat as a low-cost adsorbent: A kinetic and equilibrium study. Arab. J. Chem. 2018, 11, 1209–1222. [Google Scholar] [CrossRef] [Green Version]
- Al-Abbad, E.A.; Al Dwairi, R.A. Removal of nickel (II) ions from water by Jordan natural zeolite as sorbent material. J. Saudi Chem. Soc. 2021, 25, 101233. [Google Scholar] [CrossRef]
- Zaker, Y.; Hossain, M.; Islam, T. Adsorption kinetics of methylene blue onto clay fractionated from Bijoypur soil, Bangladesh. Res. J. Chem. Sci. 2013, 2231, 606X. [Google Scholar]


| No. of Column | % of Clay | % of Micro-Cellulose | Filtering Time (h) |
|---|---|---|---|
| Column 1 | 100 | 0 | 1 |
| Column 2 | 90 | 10 | 1.5 |
| Column 3 | 80 | 20 | 2 |
| Column 4 | 70 | 30 | 2.5 |
| Column 5 | 60 | 40 | 3 |
Disclaimer/Publisher’s Note: The statements, opinions and data contained in all publications are solely those of the individual author(s) and contributor(s) and not of MDPI and/or the editor(s). MDPI and/or the editor(s) disclaim responsibility for any injury to people or property resulting from any ideas, methods, instructions or products referred to in the content. |
© 2023 by the authors. Licensee MDPI, Basel, Switzerland. This article is an open access article distributed under the terms and conditions of the Creative Commons Attribution (CC BY) license (https://creativecommons.org/licenses/by/4.0/).
Share and Cite
Mohana, A.A.; Rahman, M.A.; Rahaman, M.H.; Maniruzzaman, M.; Farhad, S.M.; Islam, M.M.; Khan, M.S.I.; Parvez, M.Z. Okra Micro-Cellulose Crystal (MCC) and Micro-Clay Composites for the Remediation of Copper, Nickel, and Dye (Basic Yellow II) from Wastewater. Reactions 2023, 4, 342-358. https://doi.org/10.3390/reactions4030021
Mohana AA, Rahman MA, Rahaman MH, Maniruzzaman M, Farhad SM, Islam MM, Khan MSI, Parvez MZ. Okra Micro-Cellulose Crystal (MCC) and Micro-Clay Composites for the Remediation of Copper, Nickel, and Dye (Basic Yellow II) from Wastewater. Reactions. 2023; 4(3):342-358. https://doi.org/10.3390/reactions4030021
Chicago/Turabian StyleMohana, Anika Amir, Md. Aminur Rahman, Md. Hafezur Rahaman, Mohd. Maniruzzaman, S. M. Farhad, Md Meftaul Islam, Md. Sirajul Islam Khan, and Md. Zahid Parvez. 2023. "Okra Micro-Cellulose Crystal (MCC) and Micro-Clay Composites for the Remediation of Copper, Nickel, and Dye (Basic Yellow II) from Wastewater" Reactions 4, no. 3: 342-358. https://doi.org/10.3390/reactions4030021