Article

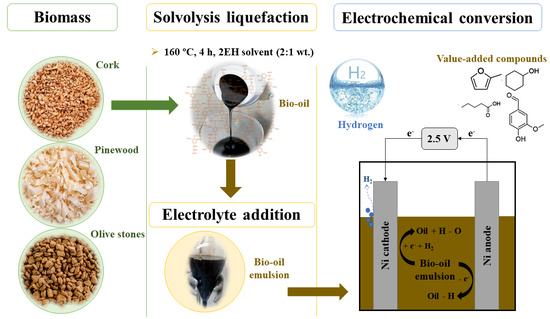
Preliminary Studies on the Electrochemical Conversion of Liquefied Forest Biomass

1
Center of Physics and Engineering of Advanced Materials (CeFEMA), Chemical Engineering Department, Instituto Superior Técnico, Universidade de Lisboa, 1049-001 Lisbon, Portugal
2
Center for Natural Resources and the Environment (CERENA), Instituto Superior Técnico, Universidade de Lisboa, 1049-001 Lisbon, Portugal
*
Author to whom correspondence should be addressed.
Reactions 2022, 3(4), 553-575; https://doi.org/10.3390/reactions3040037
Submission received: 28 August 2022 / Revised: 4 October 2022 / Accepted: 26 October 2022 / Published: 31 October 2022

Abstract

:
Bio-oils produced from three different biomass sources, namely cork, pinewood, and olive stones, are evaluated concerning their suitability and prospects of including their electrochemical transformations in a biorefinery scenario for the production of added-value compounds. Different types and concentrations of electrolytes (e.g., H2SO4, KOH) are added to the bio-oils to increase the samples’ initially low ionic conductivity. The samples prepared by mixing bio-oil with 2 M KOH aqueous solution (50 vol.%) lead to a stable and homogeneous bio-oil alkaline emulsion suitable for electrochemical studies. The bio-oil samples are characterized by physicochemical methods (e.g., density, viscosity, conductivity), followed by analyzing their electrochemical behavior by voltammetric and chronoamperometric studies. The organics electrooxidation and the hydrogen evolution reaction in the bio-oils are assessed using Pt electrodes. Single- and two-compartment cell laboratory bio-oil electrolyzers are assembled using nickel plate electrodes. Electrolysis is carried out at 2.5 V for 24 h. Attenuated Total Reflection-Fourier-Transform Infrared Spectroscopy and Mass Spectrometry are applied to identify possible changes in the bio-oil samples’ chemical structure during the electrolysis experiments. Comparing the analyses of the bio-oil samples subjected to electrolysis with the blank samples demonstrates that bulk electrolysis significantly changes the bio-oil composition. The bio-oil obtained from cork biomass shows the most promising results, but further studies are required to understand the nature of the actual changes.

Graphical Abstract

1. Introduction

Biomass refers to all organic materials combustible in nature, mainly of plant and animal origin. Lignocellulosic biomass, which encompasses residues of crop farming, forestry industry, and agro-industrial processing industries, such as straw, bark, fruits, and grains, is composed primarily of cellulose (40–45%), hemicellulose (25–35%), and lignin (15–30%) [1,2,3]. Cellulose is a linear polymer consisting of glucose monomers linked by 1,4-β glycosidic bonds. It is the lignocellulosic polymer with the highest degree of polymerization (10,000 or higher). The high molecular weight and low flexibility of cellulose chains contribute to its insolubility in water [1,2]. Hemicellulose is a polymer composed of C5 and C6 sugars, the most typical being xylose, arabinose, glucose, mannose, and galactose, with a degree of polymerization around 100–200. Hemicellulose acts as an amorphous matrix, holding the cellulose fibers in place [1,2]. Lignin is a highly cross-linked, three-dimensional aromatic polymer consisting of three monomers, coniferyl, sinapyl, and p-coumaryl alcohols, connected mainly by C–C cross-links or ether bonds. The subunits in the lignin polymer are identified by their aromatic ring structure and are called guaiacyl, syringyl, and p-hydroxyphenyl. Lignin composition differs between softwood, hardwood, and grasses, with softwood composed mainly of guaiacyl, while hardwood contains many syringyl groups [1,2].
Lignocellulosic biomass is an abundant resource commonly used as an energy source by direct combustion. However, some of its features, such as low heating value, poor grind ability, and high moisture content, are a disadvantage for its direct use as a fuel [4]. The efficient use of this renewable resource is possible by using options such as the sustainable production of liquid and solid fuels, hydrogen, synthetic gases, and valuable chemicals. The production of green chemicals and clean net-zero carbon emission biofuels from an easily accessible renewable resource has a high potential for development and is extremely important for society and the environment. Thermochemical conversion of biomass is an assuring route to exploiting this resource and producing valuable compounds. It consists of the chemical conversion of organic matter at high temperatures. Thermochemical conversions include processes like gasification, pyrolysis, and liquefaction [5,6].
Direct liquefaction thermally decomposes solid biomass mainly into liquid products, along with some char and gases, using a liquid solvent and an adequate catalyst. The process is operated at moderate temperatures and pressures, ranging from 150 to 400 °C and 20 to 200 bar. The operating pressure of liquefaction depends on the solvent’s vapor pressure, but such operating pressure is also affected by the vapor pressures of the products [7]. The literature indicates that the general reaction mechanism for the liquefaction process consists of the depolymerization of the biomass into monomer units, which decompose by cleavage, dehydration, decarboxylation, and deamination, forming unstable and reactive low-weight molecular fragments. These light fragments rearrange themselves by condensation, cyclization, and polymerization into more stable molecules, leading to new compounds [8]. Direct liquefaction is further divided into subcategories defined by the primary solvent used, such as hydrothermal liquefaction, in which water is the primary solvent, and solvent liquefaction, also known as solvolysis, in which other, usually organic, solvents are used instead.
Solvolysis liquefaction is a process where biomass is dissolved in an organic solvent at moderate temperatures, from 120 to 180 °C, and atmospheric pressure. The organic solvents are usually polyhydric alcohols, such as ethylene glycol, glycerol, ethanol, 2-ethylhexanol, or polyethylene glycol. The yield of the different chemical reactions occurring during the liquefaction process is affected by several variables, the most important being the concentration and chemical composition of the biomass, the solvent, the concentration and type of catalyst, temperature, and reaction time. Concerning biomass composition, the amount of cellulose and hemicellulose is not as important in the conversion as the amount of lignin due to their simpler structures and easy decomposition. Owing to its complex structure, higher amounts of lignin lead to lower conversion rates and, under thermal decomposition (above 252 °C), free radicals of phenol are formed via repolymerization and condensation reactions, even originating solid residues [5,9]. Regarding the type of solvent used, alcohols like methanol, ethanol, and propanol originate higher yields. In comparison, alcohols with longer chains and organic acids lead to lower liquefaction yields, thus, higher amounts of residues. Still, alcohols of small chain size have a lower boiling point, leading to their evaporation before the beginning of the liquefaction process. It is recommended that the chosen solvent strongly reacts with cellulose and, if possible, must be a product of the liquefaction itself. Examples of solvents in these conditions are phenol and its derivatives, simple alcohols, or polyalcohols [10].
Additionally, the ratio between the amount of solvent and biomass is critical since higher amounts of biomass in the reactor may increase viscosity, limiting the reaction rate [10,11,12]. The catalyst’s choice and concentration are other essential factors [10,11]. Low catalyst concentrations (ca. 3%) promote biomass degradation; however, concentrations above the optimal value may promote repolymerization and condensation reactions. Both strong and weak acids can be used as catalysts in solvolysis liquefaction. Examples of used acids are sulfuric acid, hydrochloric acid, oxalic acid, and p-toluenesulfonic acid. Mateus et al. reported that the latter acid led to the highest conversion, i.e., bio-oil yield, without favoring the secondary condensation and repolymerization reactions [13]. Thus, p-toluenesulfonic acid was chosen as the catalyst for the present study of solvolysis liquefaction reactions. The temperature is also an influential variable in the reaction’s yield, as the conversion increases with the temperature up to a certain optimal value. However, if the reaction is carried out at higher temperatures, the residue increases due to repolymerization and condensation reactions, which also affect other properties like viscosity and acidity [9,10,11].
According to Zou et al. [12], three stages occur during biomass liquefaction conducted with alcoholic solvents. These are biomass dehydration, volatilization of alcoholic solvents, and biomass alcoholysis. The degradation of cellulose and hemicellulose produces simple sugars like glucose and xylose that may produce aldehydes, ketones, or esters by further reaction steps. The depolymerization of lignin forms phenols that can react with the alcoholic solvent to form a wide range of chemical compounds. The use of polyalcohols promotes the formation of products of higher molecular weight, the formation of heavy oils, and a higher quantity of residues [13]. Bio-oils are liquid mixtures of oxygenated compounds containing carbonyl, carboxyl, and phenolic functional groups, obtained from depolymerization and fragmentation of cellulose, hemicellulose, and lignin. The bio-oils have a higher heating value (HHV) which is higher than that of their raw material biomass [14]. Still, the HHV values are lower than that of conventional diesel. Nevertheless, bio-oils can be used as fuel in boilers, diesel engines, or gas turbines for heat and electricity generation [15].
As such, bio-oils are also rich in polyols and can be used to produce phenolic resins as well as several other environmentally friendly polymers and derivate products [16,17,18,19]. Santos et al. [20] developed a novel formulation of a natural polymeric water-based adhesive designed to glue lignocellulosic surfaces, such as wood and cork, from cork liquefaction. Esteves et al. [21] demonstrated that it is possible to use bio-oil from cork biomass liquefaction to produce polyurethane foams.
An innovative process for syngas generation uses electrolysis with liquefied biomass as a carbon source, forming carbon monoxide and carbon dioxide [22]. Syngas finds application in the intermediate production of transport fuels, gas fuels, and various chemicals. Liquefied biomass can source other added-value chemicals, like levulinic acid. This compound is predominant in liquefied cork and has great significance as an intermediate in synthesizing many compounds. Nilges et al. [23] used electrochemistry to produce sustainable chemicals and fuels, following a two-step electrochemical conversion of levulinic acid to octane via valeric acid. Usually, the production of hydrocarbons from levulinic acid is achieved via a harsh multistep process (temperature of 250–400 °C and pressure of 10–35 bar of H2). Conversely, the electrochemical conversion is performed at room temperature and in an aqueous solution, with simple isolation of the hydrocarbon via phase separation. The selectivity for the reaction products formed in the electrochemical route depends on the electrolyte composition, the electrode material, and the applied potential [23,24].
The use of electrochemistry for the oxidation or reduction of organic species is not new. The electrocatalytic oxidation of glucose, a product of the depolymerization of cellulose, into compounds such as gluconolactone, a polyhydroxy acid (PHA) used in cosmetics, is a well-studied process [25,26,27,28,29]. Electrooxidation of D-mannose on platinum electrodes to produce mannonic acid, better known as gluconic acid and used as a food additive, is also a known process [30]. The electrochemical oxidation of phenol can be used for synthesizing hydroquinone and benzoquinone, as well as a means for wastewater treatment [31,32]. Both the reduction of xylose into xylitol, a natural sweetener accepted by medical science, and its oxidation into xylonic acid [33,34] are other examples of the use of electrochemical processes in the conversion of chemicals present in the bio-oil into valuable chemicals. Weinberg et al. [35] discuss the oxidation of many organic compounds in several electrolytes using different electrodes.
These studies are no surprise since the advantages of applying electrochemical processes at the industrial level are numerous. These advantages include (i) easier handling of the reaction media, as many cases only require the removal of the electrolyte (there are no chemical oxidants or its products to remove from the reactor), (ii) the low cost of the process as, neglecting the equipment cost, the power is relatively inexpensive compared to the chemicals, and (iii) the yields are often adequate [35]. Moreover, one of the most prominent features of electrochemical reactions is their significantly higher selectivity compared to traditional chemical processes. One can partially control the electrochemical reactions by appropriately selecting the applied electrode potential. Usually, the electrode reaction occurring at a lower standard electrode potential will be favored, while other processes will not. Particularly for the case of liquefied biomass, it can be selectively oxidized without spending energy in the concurrent oxygen evolution reaction, occurring at higher potentials, thus increasing the faradaic efficiency of the process.
In the last couple of years, some studies focused on the electrochemical upgrading of bio-oils [36,37,38,39,40], demonstrating its potential for development and as a green alternative for producing biofuels, synthetic gases, and many valuable chemicals. However, to the best of our knowledge, no significant studies have been reported on the bio-oil electrochemical characterization nor the effects of its direct electrolysis. This preliminary work focuses on the characterization of different bio-oils and their electrochemical behavior, with the intent of identifying the biomass under study (namely, cork, pinewood, and olive stones) with the highest potential to continue further studies regarding the electrochemical conversion to industrial relevant compounds and the electrocatalytic upgrading of biomass-derived intermediates. Thus, this approach intends to broaden the possibilities of including such electrochemical transformations in a biorefinery scenario. Some of the formed compounds may be used as intermediates for producing a panoply of added-value compounds.

2. Materials and Methods

2.1. Chemicals and Bio-Oils Source

All the bio-oil samples characterized in this study came from the liquefaction of ground plant biomass, specifically cork, pinewood, and olive stones. In the solvolysis liquefaction, the solvent used was 2-ethylhexanol (2-EH, 99%, Acros Organics, Geel, Belgium), and the catalyst was p-toluenesulfonic acid (p-TsOH, 99%, Acros Organics, Geel, Belgium). Acetone (99.7%) from Sigma-Aldrich (St. Louis (MO), USA) was used to treat the liquefaction solid residue. The reactants used in the electrochemical studies were sulfuric acid (H2SO4, 95 wt.%) and potassium hydroxide (KOH, 85 wt.%), both from Sigma-Aldrich (St. Louis (MO), USA).

2.2. Solvolysis Liquefaction

The solvolysis liquefaction was performed following a procedure similar to those reported in the literature [14]. The liquefactions were carried out in a glass reactor of 2 L equipped with mechanical stirring, a thermocouple connected to the heating mantle, and a Dean-Stark separator/condenser open to the atmosphere. The solvolysis was performed with a weight ratio of 1:2 biomass to solvent and 3 wt.% of catalyst. The reaction was run for 4 h at 160 °C, after which the reactor was left to cool down at room temperature. After cooling, the reaction mixture was subjected to centrifugation and sieving to take out the solid residues from the bio-oil. These residues were thoroughly washed with acetone, subjected to centrifugation and filtration, dried at 55 °C in the oven, and weighed. The bio-oil recovered from the solid residues was treated in a rotary evaporator at 40 °C and low pressure to remove the acetone. This bio-oil was stored in a separate container for other future uses, not for the present study. The reaction conversion, defined in terms of mass change, is given by Equation (1),
% C = (Wi − Wf)/Wi × 100
where Wi is the mass of initial biomass fed to the reactor and Wf is the mass of the dry solid residue.

2.3. Bio-Oils Characterization

The bio-oils obtained by liquefaction were characterized by their physicochemical properties: density, viscosity, and conductivity. Density was measured with a pycnometer, and dynamic viscosity was measured with a cone-and-plate viscometer (Research Equipment, London, UK). The ionic conductivity of the samples was measured with a conductivity meter from HANNA Instruments (HI8733, Woonsocket (RI), USA). The samples subjected to electrochemical experiments were also analyzed by attenuated total reflection-Fourier transform infrared spectroscopy (ATR-FTIR) and mass spectrometry (MS). The equipment used for ATR-FTIR was a PerkinElmer (Waltham (MA), USA) Spectrum Two mid-Infrared spectrometer (400 cm−1 to 4000 cm−1) equipped with a PIKE Technologies (Fitchburg (WI), USA) MIRacleTM Attenuated Total Reflectance (ATR) accessory. Each spectrum was obtained by an average of 32 scans with a resolution of 8 cm−1. The spectra were normalized according to the procedure that attributes zero value to the transmittance minimum and baseline corrected (automatic procedure). The mass spectrometry system was composed of a Micromass Triple Quadrupole Mass Spectrometer model Quattro Micro (Waters Corporation, Milford (MA), USA), with electron spray ionization (ESI), supported by a nitrogen generator.

2.4. Electrochemical Characterization

The electrochemical experiments were performed at room temperature using a potentiostat/galvanostat from Princeton Applied Research/EG&G (Oak Ridge (TN), USA), model PAR273A, controlled by the PowerSuite software package (PAR, Oak Ridge (TN), USA). A 1 cm2 platinum (Pt) electrode (Metrohm 60305100, Herisau, Switzerland) was used as the working electrode, a saturated calomel electrode (SCE, HANNA HI5412, Woonsocket (RI), USA) was used as a reference electrode, and the counter electrode was a Pt coil (A = 9.5 cm2). All potentials presented in the manuscript refer to the SCE reference.
Electrochemical impedance spectroscopy (EIS) measurements were carried out to determine the electrolyte resistance in the bio-oil samples to obtain the iR-compensated data. EIS data were obtained with the PAR potentiostat coupled to a Schlumberger SI 1255 frequency response analyzer (Solartron Analytical, Farnborough, UK) at the open circuit potential using frequencies in the 0.01–100 kHz range with an AC potential amplitude of 5 mV.
Cyclic voltammetry (CV) was used to assess the liquefied biomass electrooxidation processes and to evaluate the hydrogen evolution reaction (HER) in the bio-oils. The CV scans were performed using a Pt electrode (Metrohm 60305100, Herisau, Switzerland) in the potential window between −2 V and +2 V at a scan rate of 50 mV s−1. The CV studies were run using cork, pinewood, and olive stones bio-oil samples, both pure and with 3 M H2SO4. Linear scan voltammetry (LSV) was used to assess the samples’ cathodic processes, specifically the HER. The obtained polarization curves were used to extract the Tafel plots and calculate relevant kinetic parameters for the HER.
Chronoamperometric (CA) measurements were also carried out to assess the short-term (200 s) activity stability in the acidified bio-oil samples by applying four different potentials, from 0.7 V to 1.3 V in the anodic zone and from −0.7 V to −1.3 V in the cathodic zone.

2.5. Electrolysis Experiments

Small-scale laboratory electrolyzer cells made in acrylic were assembled using two identical Ni plate electrodes (A = 22.4 cm2) with an interelectrode spacing of 0.5 cm. Both single-compartment and two-compartment cell designs were used for the bio-oil electrolysis. The latter configuration used a CMI-7000 (Membranes International Inc., Ringwood, NJ, USA) cation-exchange membrane to separate the two compartments. Based on preliminary data, all electrolysis experiments were carried out with cork bio-oil samples.
The electrolysis was performed at room temperature using an applied cell voltage of 2.5 V, as suggested by preliminary studies [41]. The single-compartment cell had a volume of 150 mL, and the two-compartment acrylic cell had a volume of 80 mL in each compartment. The electrolysis experiments were performed for up to 24 h using a BK Precision power source (model 1621A). The samples subjected to electrolysis in the single-compartment cell included cork bio-oil with 2 M H2SO4 (Electrolysis I), an emulsion of cork bio-oil with a 2 M H2SO4 aqueous solution (50:50 vol.%), herein named cork bio-oil acidic emulsion (Electrolysis II), and an emulsion of cork bio-oil with a 2 M KOH aqueous solution (50:50 vol.%), named cork bio-oil alkaline emulsion (Electrolysis III). KOH aqueous solutions were preferred over sodium hydroxide due to the higher ionic conductivity of the former.
Different electrolytes were used in the anodic and cathodic compartments of the two-compartment cell. In one electrolysis experiment, an aqueous solution of 2 M H2SO4 was used as the catholyte, and a cork bio-oil acidic emulsion sample was used as the anolyte (Electrolysis IV). In a different experiment, cork bio-oil acidic emulsion samples were used as the electrolyte in both compartments to isolate the products of the various redox reactions occurring at each electrode (Electrolysis V). Another approach involved the simultaneous use of the cork bio-oil acidic emulsion as the catholyte and the cork bio-oil alkaline emulsion as the anolyte (Electrolysis VI). Table 1 summarizes the different electrolytes used in the single- and two-compartment bio-oil electrolysis experiments.
After contact with H2SO4 or KOH solutions, the cork bio-oil samples were subjected to ATR-FTIR and ESI-MS analysis. Both electrolyzed samples and identical composition samples not subjected to electrolysis (i.e., blank samples) were analyzed to study changes in the chemical nature of the electrolyzed samples versus the blank.

3. Results and Discussion

3.1. Solvolysis Liquefaction

The conditions used for three different batches of cork biomass liquefaction reactions and their conversion rates are presented in Table 2. The conversion degree is lower than that found in the literature [14], reaching values as high as 90%. The reason might be related to the ratio of biomass to solvent, as it is usually very low, typically 1:9, highly different from the ratio used in this work (1:2). The option of using low biomass to solvent ratio was not followed in the present work, since liquefactions with such low ratios are not economically viable. Moreover, the study aimed to assess the electrochemical behavior of the compounds resulting from liquefaction, without the effect of the solvent, which is evaporated under vacuum and heating.
Additionally, the lower conversion degree can relate to the fact that the ground cork granules used in this work are larger than the cork dust/powder used in previous studies. The smaller cork particles combined with the different ratio of biomass to solvent may also explain the previously reported higher conversion values. Overall, the herein obtained conversion values are consistent for all batch runs. The olive stones and pinewood bio-oils were obtained in liquefaction reactions with 60% conversion rate [42].

3.2. Bio-Oils Characterization

Physicochemical Properties

Table 3 presents the measured values for bio-oil density, viscosity, and conductivity. Viscosity values were consistently below 0.1 Poise (instrument’s detection limit). The expected low conductivity of all samples is also evident since the media is an organic mixture of smaller molecules resulting from the depolymerization of cellulose, hemicellulose, and lignin. Further characterization data, including elemental analysis and ash content, on the pinewood and olive stones biomass and respective bio-oils, can be found in the work by Condeço et al. [43]. Mateus et al. also provided relevant data on the cork bio-oil, namely on the estimation of its HHV [14].
To perform electrochemical studies, increasing the bio-oils initial low conductivity is essential. Different approaches were conducted, including acidification and basification of the bio-oil. As expected, the conductivity value increased by adding sulfuric acid (H2SO4) to the samples (Table 3). However, the viscosity of the samples also increased considerably with the H2SO4 addition. This viscosity increase might suggest the bio-oils repolymerization, which could hinder the electrochemical analysis [44]. Table 3 shows that the cork bio-oil was the sample most improved with the H2SO4 addition, with the highest conductivity increase and the lowest viscosity increase.
Another approach involved the addition of solid KOH to the bio-oil samples. In this case, although the conductivity slightly increased, the viscosity increased significantly more than when adding H2SO4. For example, in the case of a cork bio-oil sample, the viscosity reached a value of 9 P at 0.5 M KOH. This high viscosity does not allow the handling of bio-oil samples for further electrolysis experiments; thus, this approach was abandoned.
This initial screening pointed out the cork bio-oil as the one with the most promising properties. Additionally, as cork biomass is a subproduct of major interest for Portuguese industry, the subsequent studies were mostly focused on adding acid or basic aqueous solutions to the cork bio-oil samples in a 50:50 vol.% mix. The tested solutions consisted of 2 M H2SO4 and 2 M KOH. Both mixtures formed emulsions with different behavior (Figure 1). Following a rest period of 24 h, the cork bio-oil acidic emulsion led to three distinct phases (Figure 1A). On the other hand, the cork bio-oil alkaline emulsion did not originate any visible phase separation (Figure 1B). The lack of formation of visible distinct phases in the alkaline emulsion is possibly related to the formation of phenolates, which are hydrophilic. In opposition, neutralizing such phenolates in the acidic bio-oil emulsion leads to phase separation.

3.3. Electrochemical Studies

3.3.1. Cyclic Voltammetry Using a Pt Electrode

The CV experiments were performed at 50 mV s−1 in the cork, pinewood, and olive stones bio-oil samples with up to 3 M H2SO4 (Figure 2). Note that the samples with KOH addition had such a high viscosity that correct measurement of the CVs was prevented. The behavior of the three bio-oils was similar, with all samples showing an increase in current densities with the concentration of H2SO4, especially in the cathodic zone. The CVs show no visible redox peaks. A large increase of current density in the cathodic zone is expected, as the pH decrease promoted by the addition of acid enhances the HER, the only reaction visible in this zone.
Table 4 shows the maximum current density recorded for each sample in the anodic and cathodic zones. Comparing the current densities between all bio-oil samples, one can ascertain that the pinewood bio-oil samples show higher values across all acid concentrations. On the other hand, upon acid addition, the olive stones bio-oil samples show the lowest current densities for both anodic and cathodic zones. All recorded current densities are low compared to other works dealing with the electrochemical conversion of biomass, which often uses aqueous-based electrolyte solutions. The low ionic conductivity is due to the presence of the solvent used for the liquefaction process, 2-EH, which was not separated from the bio-oil. In fact, 2-EH significantly increases the resistance of the solution, leading to low currents even at relatively high applied potentials. This high resistivity caused by the 2-EH presence makes sure that even bio-oil solutions containing 1 M and 3 M H2SO4 still show significantly large resistances, ca. 4.0 kΩ and 1.7 kΩ, respectively, as determined by EIS data. Nevertheless, the current approach seems more realistic if one wants to follow a more applied perspective, with minor costs of large-scale implementation.
Based on the CVs shown in Figure 2, the pinewood bio-oil would seem the best choice for application in a bio-oil electrolyzer. However, the acidified cork bio-oil samples had the highest conductivity and the lowest viscosity, making this bio-oil the right choice for future studies.

3.3.2. Linear Scan Voltammetry and Tafel Analysis

To study the HER in the acidified bio-oil samples, LSVs were run in the cathodic zone. The LSVs carried out with a Pt electrode at 50 mV s−1 for the cork, pinewood, and olive stones bio-oils with 3 M H2SO4 are shown in Figure 3A. Tafel analysis was done with the corresponding Tafel plots shown in Figure 3B.
The charge transfer coefficient, α, can be related to the Tafel slope, b, by Equation (2),
b = 2.3RT/(αF)
where R is the universal gas constant, T is the temperature, and F is Faraday’s constant. The exchange current density, j0, can be calculated from the y-intercept, a, of the Tafel plot according to Equation (3).
a = b × log(−j0)
The calculated α and j0 values are presented in Table 5. No reduction peak is visible in any of the three bio-oil samples LSVs (Figure 3A), suggesting that HER is the only reduction reaction occurring. The pinewood bio-oil sample leads to the highest current densities and the olive stones bio-oil to the lowest. Additionally, the pinewood bio-oil has the smallest onset overpotential for HER, whereas the olive stones bio-oil has the highest (Figure 3A).
The b value corresponds to the slope of the Tafel plots (Figure 3B) and relates the current response with a change in the applied potential. The b values should be low, meaning a low overpotential is enough to lead to a large current increase. In this case, the b values were remarkably high, specifically 0.59 V dec−1 for pinewood and cork bio-oil samples and 0.98 V dec−1 for the olive stones. These high b values owe to the low ionic conductivity of the samples, which is typical of these complex organic solutions. The values may hint at a complex multistep reaction with multiple electron transfers. Moreover, the highest b value of the olive stones indicates very little applicability of this bio-oil.
The obtained α values show similar behavior for the three different acidic bio-oil samples (Table 5). It is known that the α parameter is related to the fraction of overpotential that affects the current density. On the other hand, the j0 values reflect the intrinsic rates of electron transfer between the analyte and the electrode. Herein, they suggest the pinewood bio-oil sample as the one with better intrinsic rates, followed by the cork bio-oil (Table 5). Notwithstanding, from an industrial perspective, the right choice for feeding a bio-oil electrolyzer should be the cork bio-oil, as the cork biomass used is deemed a subproduct of interest for the Portuguese industry [45].

3.3.3. Chronoamperometry

A chronoamperometric (CA) study was performed at room temperature for each bio-oil sample using a Pt working electrode. CA studies follow the current response with time for a specific potential applied. The applied potentials ranged between 0.7 V and 1.3 V for the anodic zone and −0.7 V to −1.3 V for the cathodic zone. Figure 4 presents the CAs of the bio-oil samples with 3 M H2SO4 obtained for anodic potentials ranging from 0.7 V to 1.3 V. The CAs exhibit the expected behavior, with the current densities gradually decreasing with time, reaching stability in ca. 200 s.
Figure 4A presents the CAs of the acidified cork bio-oil sample (3 M H2SO4). After 200 s, the lowest current density was 0.024 mA cm−2, and the highest was 0.20 mA cm−2, for 0.7 V and 1.3 V, respectively. The olive stones bio-oil sample with 3 M H2SO4 shows slightly lower current densities after 200 s, ranging between 0.022 mA cm−2 and 0.17 mA cm−2 for the applied potentials (Figure 4B). Figure 4C shows that the CAs for the acidified pinewood bio-oil sample exhibit the highest current densities after 200 s, ranging between 0.041 mA cm−2 and 0.26 mA cm−2, for the lowest and highest applied potentials, respectively. Figure 4D directly compares the cork, pinewood, and olive stones bio-oil samples at 0.9 V, with the current densities following the same trend as the CV data.
Figure 5 shows the CAs of the bio-oil samples with 3 M H2SO4 at applied cathodic potentials ranging from −0.7 V to −1.3 V. In the diffusion-controlled region, the CAs of the cork bio-oil sample with 3 M H2SO4 (Figure 5A) present the lowest current density of −0.48 mA cm−2 and the highest of −1.13 mA cm−2, for −0.7 V and −1.3 V, respectively. Figure 5B shows the acidified olive stones bio-oil sample (3 M H2SO4), with the stabilized current densities ranging between −0.27 mA cm−2 and −0.63 mA cm−2. The pinewood bio-oil sample with 3 M H2SO4 (Figure 5C) shows stable current densities between 100 and 200 s, between −0.7 mA cm−2 and −1.5 mA cm−2 for the lowest and highest applied potentials. Figure 5D directly compares the CAs at −0.9 V of the three acidified bio-oils. The results confirm the similarity in the current response of the samples, as it does not change significantly with the biomass used in bio-oil production. It is also evident that the olives stones bio-oil has the lowest current densities (−0.4 mA cm−2), while the pinewood bio-oil shows more than double that value.
Further characterization studies are required to determine the diffusion coefficient value of the species being oxidized/reduced. This would allow using CV and CA data to obtain valuable information on the mechanism of the redox reactions occurring in the electrode-electrolyte interface and determine kinetic data, such as the number of exchanged electrons.

3.3.4. Electrolysis Experiments

The bulk electrolysis experiments (Table 1) were carried out by applying a cell voltage of 2.5 V, as suggested by preliminary studies carried out in the group [41]. Current densities attained at 2.5 V were considered reasonable, but insignificant for lower voltages. Previous studies on the oxidation of solutions containing organic matter used similar cell voltages, or even higher (ca. 3–5 V). However, high cell voltages are not suitable for the present work, as they can lead to nickel anode corrosion. The electrolysis tests were run for up to 24 h in both single-compartment and two-compartment cells. Both cells contained two identical Ni plate electrodes of 22.4 cm2 surface area. Electrolysis I was carried out in the single-compartment cell using a cork bio-oil sample with 2 M H2SO4. The current values presented a sharp drop in the first few minutes, stabilizing at ca. 1.5 mA cm−2 and keeping those values until about 90 min of electrolysis, after which the current falls below the minimum value detected by the power source (10 mA). In the case of Electrolysis II, utilizing a cork bio-oil acidic emulsion, the recorded currents were consistently below the detection limit. This was probably related to the bio-oil dilution effect, which limits the anodic process.
Electrolysis III involved the electrolysis of cork bio-oil alkaline emulsion with continuous mechanical agitation in a single-compartment cell. The current densities stabilized after 25 min and maintained a value of ca. 0.9 mA cm−2 for the whole 24-h electrolysis experiment.
Two-compartment cell electrolysis experiments were also performed for 24 h using a CMI-7000 cation-exchange membrane to separate the anodic and cathodic compartments. Electrolysis IV used a 2 M H2SO4 cork bio-oil sample on both cell compartments. As for Electrolysis V, the catholyte was replaced by a 2 M H2SO4 aqueous solution. In both cases, the currents produced were below the detection range of the power source (10 mA).
Electrolysis VI used a cork bio-oil acidic emulsion as the catholyte and a cork bio-oil alkaline emulsion as the anolyte. The experiment was performed for 24 h with continuous mechanical agitation in both compartments. The currents stabilized at ca. 2.2 mA cm−2 in the first 10 min of electrolysis and maintained those values for the entire duration of the experiment.
All samples subjected to bulk electrolysis were then analyzed by ATR-FTIR and ESI-MS analysis to determine any possible changes in their composition compared to the blank samples not subjected to electrolysis.

3.4. Electrochemical Characterization of the Bio-Oil Emulsion Samples after Electrolysis

The cork bio-oil acidic and alkaline emulsions were analyzed before (i.e., blank) and after electrolysis experiments (Electrolysis II and Electrolysis III, respectively). The objective was to observe any potential differences in the emulsion electrochemical behavior resulting from the bulk electrolysis.
The cork bio-oil acidic emulsion showed a well-defined top organic phase and a lower aqueous phase (Figure 1A), with a middle phase being a foam-like interface mixture of the previous two phases. The CVs of the organic phase of the blank acidic emulsion sample (Figure 6A) show a purely resistive behavior with very low current densities. After the Electrolysis II experiment, this organic phase shows a similar behavior, with a minor current increase related to a slight increase in the phases’ miscibility (Figure 6A). The CV of the aqueous phase of the blank acidic emulsion sample (Figure 6B) shows low current densities in the anodic zone and large current densities on the cathodic side. This behavior is expected considering the high H2SO4 concentration in this aqueous phase. After Electrolysis II, there is a minor decrease in the cathodic currents (Figure 6B) related to H+ consumption during the hydrogen evolution reaction. Additionally, the possible formation of micelles leads to a reduction of the solution’s ionic conductivity. Nevertheless, the absence of significant changes in the CVs may be partly related to the low current densities recorded during Electrolysis II, which conveys no conclusion concerning a substantial alteration of the composition upon electrolysis.
On the other hand, the CVs recorded for the cork bio-oil alkaline emulsion show outstanding differences before (blank) and after electrolysis (Figure 7). The CV of the as-prepared cork bio-oil alkaline emulsion shows very low current densities with minor anodic/cathodic peaks (Figure 7A). However, after Electrolysis III, a bulk electrolysis experiment the current densities increase by almost three orders of magnitude, especially in the cathodic region (Figure 7B). In fact, by applying Tafel analysis to the voltammograms in Figure 7, one can see that the kinetic parameters calculated for the cork bio-oil alkaline emulsion after electrolysis are particularly favorable for the HER. Namely, the b value was 0.12 V dec−1, with a corresponding α of 0.49 and j0 of 0.16 mA cm−2.
As for the anodic region, one can see three anodic peaks. Two on the direct scan and a smaller one in the backscan, probably related to the oxidation of adsorbed intermediate species formed during the second oxidation peak (Figure 7B). Specifically, the first two anodic peaks are typically observed during the oxidation in alkaline media of biopolymers like lignin, as reported by Oliveira et al. [46]. This process leads to the adsorption on the Pt electrode of lower molecular weight intermediates that are further oxidized in the backscan (at ca. 1.3 V vs. SCE) when Pt–O formed on the electrode surface at high potentials (close to 2 V vs. SCE) is reduced back to pristine Pt, and the surface is reactivated.
Comparing Figure 7A,B, it is clear that bulk electrolysis of a cork bio-oil alkaline emulsion leads to a large enhancement of both the anodic and cathodic processes in the resulting solution. This effect demonstrates that the composition of the bio-oil alkaline emulsion is significantly changed during the electrolysis process. Compared to all other approaches, the considerably higher currents recorded in the cork bio-oil alkaline emulsion may be justified by the low electrolyte resistance value determined by EIS data (6.3 Ω). This value was ca. three orders of magnitude lower than those obtained for the bio-oil containing 1 M and 3 M H2SO4, suggesting this approach based on forming a bio-oil alkaline emulsion is the most promising for future studies involving bio-oil electrolysis.

3.5. Attenuated Total Reflection-Fourier-Transform Infrared Spectroscopy (ATR-FTIR)

The ATR-FTIR spectra were made to identify the samples’ functional groups and the possible conversions occurring during the electrolysis process. However, some conditions must be met to achieve proper identification of functional groups conversion: (i) the electrolysis should be extensive enough so that the concentration of generated species overcomes the initial ones; (ii) the wavenumbers of the radiation influencing the new functional groups (e.g., originating stretching vibrations) cannot overlap those responsible for the fingerprint of the initial functional groups.
Figure 8, Figure 9, Figure 10 and Figure 11 represent the ATR-FTIR spectra of several samples, with the wavenumber of the main peak being assigned to different functional groups (Table 6).
The ATR-FTIR spectra of the cork bio-oil sample change upon the addition of acid, as can be seen by comparing spectra (a) and (b) in Figure 8. The main difference is the attenuation of the signal in acidic conditions (presence of H+ ions), where a change in the bands is noticed in the 2850–3000 cm−1 region, corresponding to a C–H stretching vibration, which indicates a decrease in the number of aliphatic hydrocarbons, as well as at 1375 cm−1 and 1032 cm−1, corresponding to –O–H and –C–O vibrations [17,51]. These large peaks may be associated with the bio-oil solvent used, 2-EH. On the other hand, the appearance of peaks is visible at 1236 cm−1, corresponding to –C–O stretching vibration in aromatic compounds [51], at 1185 cm−1, also representing –C–O vibrations, and between 1000–955 cm−1, which may relate to –C–H bending vibrations in aromatic structures [17]. As the addition of acid to the bio-oil has been reported to promote the repolymerization of lignin, cellulose, and hemicellulose fractions [44], this might justify the differences observed in the FTIR signals.
Concerning the acidified bio-oil after Electrolysis I, since the reaction of interest is an oxidation process, it was expected that vibrations corresponding to functional groups with oxygen would appear in this region of the spectra. Nonetheless, spectra (b) and (c) are very similar, indicating that the electrolysis was not extensive enough for the newly formed species to be visible. On the other hand, their signal may overlap with the previous ones.
From the different experiments with electrolysis at longer times, it is essential to focus on the results of three experimental conditions: (i) acidified organic phase of the cork bio-oil emulsion used as catholyte on Electrolysis VI (Figure 9); (ii) acidified aqueous phase of the cork bio-oil emulsion from Electrolysis II (Figure 10); and (iii) bio-oil alkaline emulsion from Electrolysis III (Figure 11).
Figure 9 presents the spectra of (a) the organic phase of the blank cork bio-oil acidic emulsion, as well as (b) the equivalent organic phase extracted from the cork bio-oil acidic emulsion after Electrolysis VI, an experiment in a two-compartment cell where the cork bio-oil acidic emulsion was used as the catholyte, and the cork bio-oil alkaline emulsion was used as the anolyte. As this organic phase was separated from the cork bio-oil acidic emulsion, it would be expected that the several compounds present have larger hydrocarbon chains, both linear and cyclic, and less hydrophilic species. Spectrum (b) shows an apparent decrease in the intensity of the three following peaks:
  • 1750–1735 cm−1, related to the –C=O stretching vibration in esters;
  • 1420–1310 cm−1, assigned to –O–H bending vibrations in alcohols;
  • 1234–1230 cm−1, the –C–O–C stretching vibration in alkyl aromatics.
The visible decrease of these three peaks suggests the reduction of species in solution during electrolysis (e.g., esters, alcohols). This may indicate the hydrogenation of compounds like furans, such as the hydrogenation of furfuryl alcohol into 2-methylfuran. The hydrogenation of furans is supported by the reduction of the peak at 1234–1230 cm−1, as one of the possible reaction pathways may involve breaking the cyclic ring [53,54,55,56]. One can also observe that the spectra in Figure 9 are very similar to the spectrum of the original bio-oil sample (spectrum (a) in Figure 8), suggesting loss of H+ ions due to migration through the polymeric membrane.
Figure 10 shows the ATR-FTIR spectra of the aqueous phase of the blank cork bio-oil acidic emulsion, not subjected to electrolysis, and the same aqueous phase extracted after Electrolysis II, a bulk electrolysis experiment in a single-compartment cell. In general, organic compounds are relatively non-polar; however, the derivatives from the breakdown of plant biomass that compose these bio-oils are highly oxygenated compounds, which increases their solubility, especially those derived from cellulose, whose hydrocarbon chains are shorter [53]. Thus, this aqueous phase was expected to be composed of light oxygenates and oxygenated aromatics. This is supported by the lack of peaks between 2949–2850 cm−1, related to the vibration of aliphatic hydrocarbon chains, and the presence of peaks at 1725–1705 cm−1 and between 1250 and 1000 cm−1, related to strongly oxygenated radicals (spectrum (a) of Figure 10). After Electrolysis II (spectrum (b)), it is visible the appearance of a peak at 1750–1735 cm−1 related to the –C=O stretching vibration and an increase in the intensity of the three following peaks:
  • 1420–1310 cm−1, assigned to –O–H bending vibration in alcohols;
  • 1205–1020 cm−1, related to –C–O stretching vibration;
  • 900–860 cm−1, –C–H bending vibrations.
The increase of the intensity of the peaks at 1420–1310 cm−1 and 1205–1020 cm−1, related to –O–H and –C–O vibrations, suggests further oxidation of the compounds into alcohols and carboxylic acids. The peaks at 1750–1735 cm−1 hint at an esterification reaction of the alcohols and acids [57,58,59,60,61]. In its turn, the peak at 980–730 cm−1, associated with –C=C bending vibrations, hints at the formation of alkenes by alkyl radicals, a typical product of decarboxylation reactions [57].
These changes in the ATR-FTIR spectra suggest that modifications in the organic compounds dissolved in the aqueous phase occur during the single-compartment electrolysis experiment. It can also be related to the solubilization of compounds from the organic phase due to the oxidation of more complex and less soluble compounds.
Figure 11 shows the spectra of (a) the blank alkaline emulsion, not subjected to electrolysis, and (b) the alkaline emulsion after Electrolysis III, a bulk electrolysis in a single-compartment cell. After the electrolysis, the spectrum (b) shows an increase in the intensity of several peaks, namely in the peak at 1750–1735 cm−1, related to –C=O stretching vibration in esters. It is also visible a slight increase in the following peaks:
  • 1465–1462 cm−1, related with –C–H deformation;
  • 1420–1310 cm−1, –O–H bending vibration;
  • 1234–1230 cm−1, –C–O–C stretching vibration.
The increase of the peak at 1420–1310 cm−1 may indicate the oxidation of the compounds into alcohols and carboxyl acids. The rise in intensity of the first and the last peaks suggests the esterification of the compounds in the solution. This is in agreement with the literature, where the esterification process of alcohol and carboxylic acid compounds is known to occur favorably in alkaline media [57,58,59,60,61]. At 1465–1462 cm−1 can be seen the increase of a characteristic peak related to alkyl C–H bending vibrations connected to strong oxygen adsorption [50,58]. These results suggest changes in the organic compounds present in the cork bio-oil alkaline emulsion during the single-compartment electrolysis experiment.

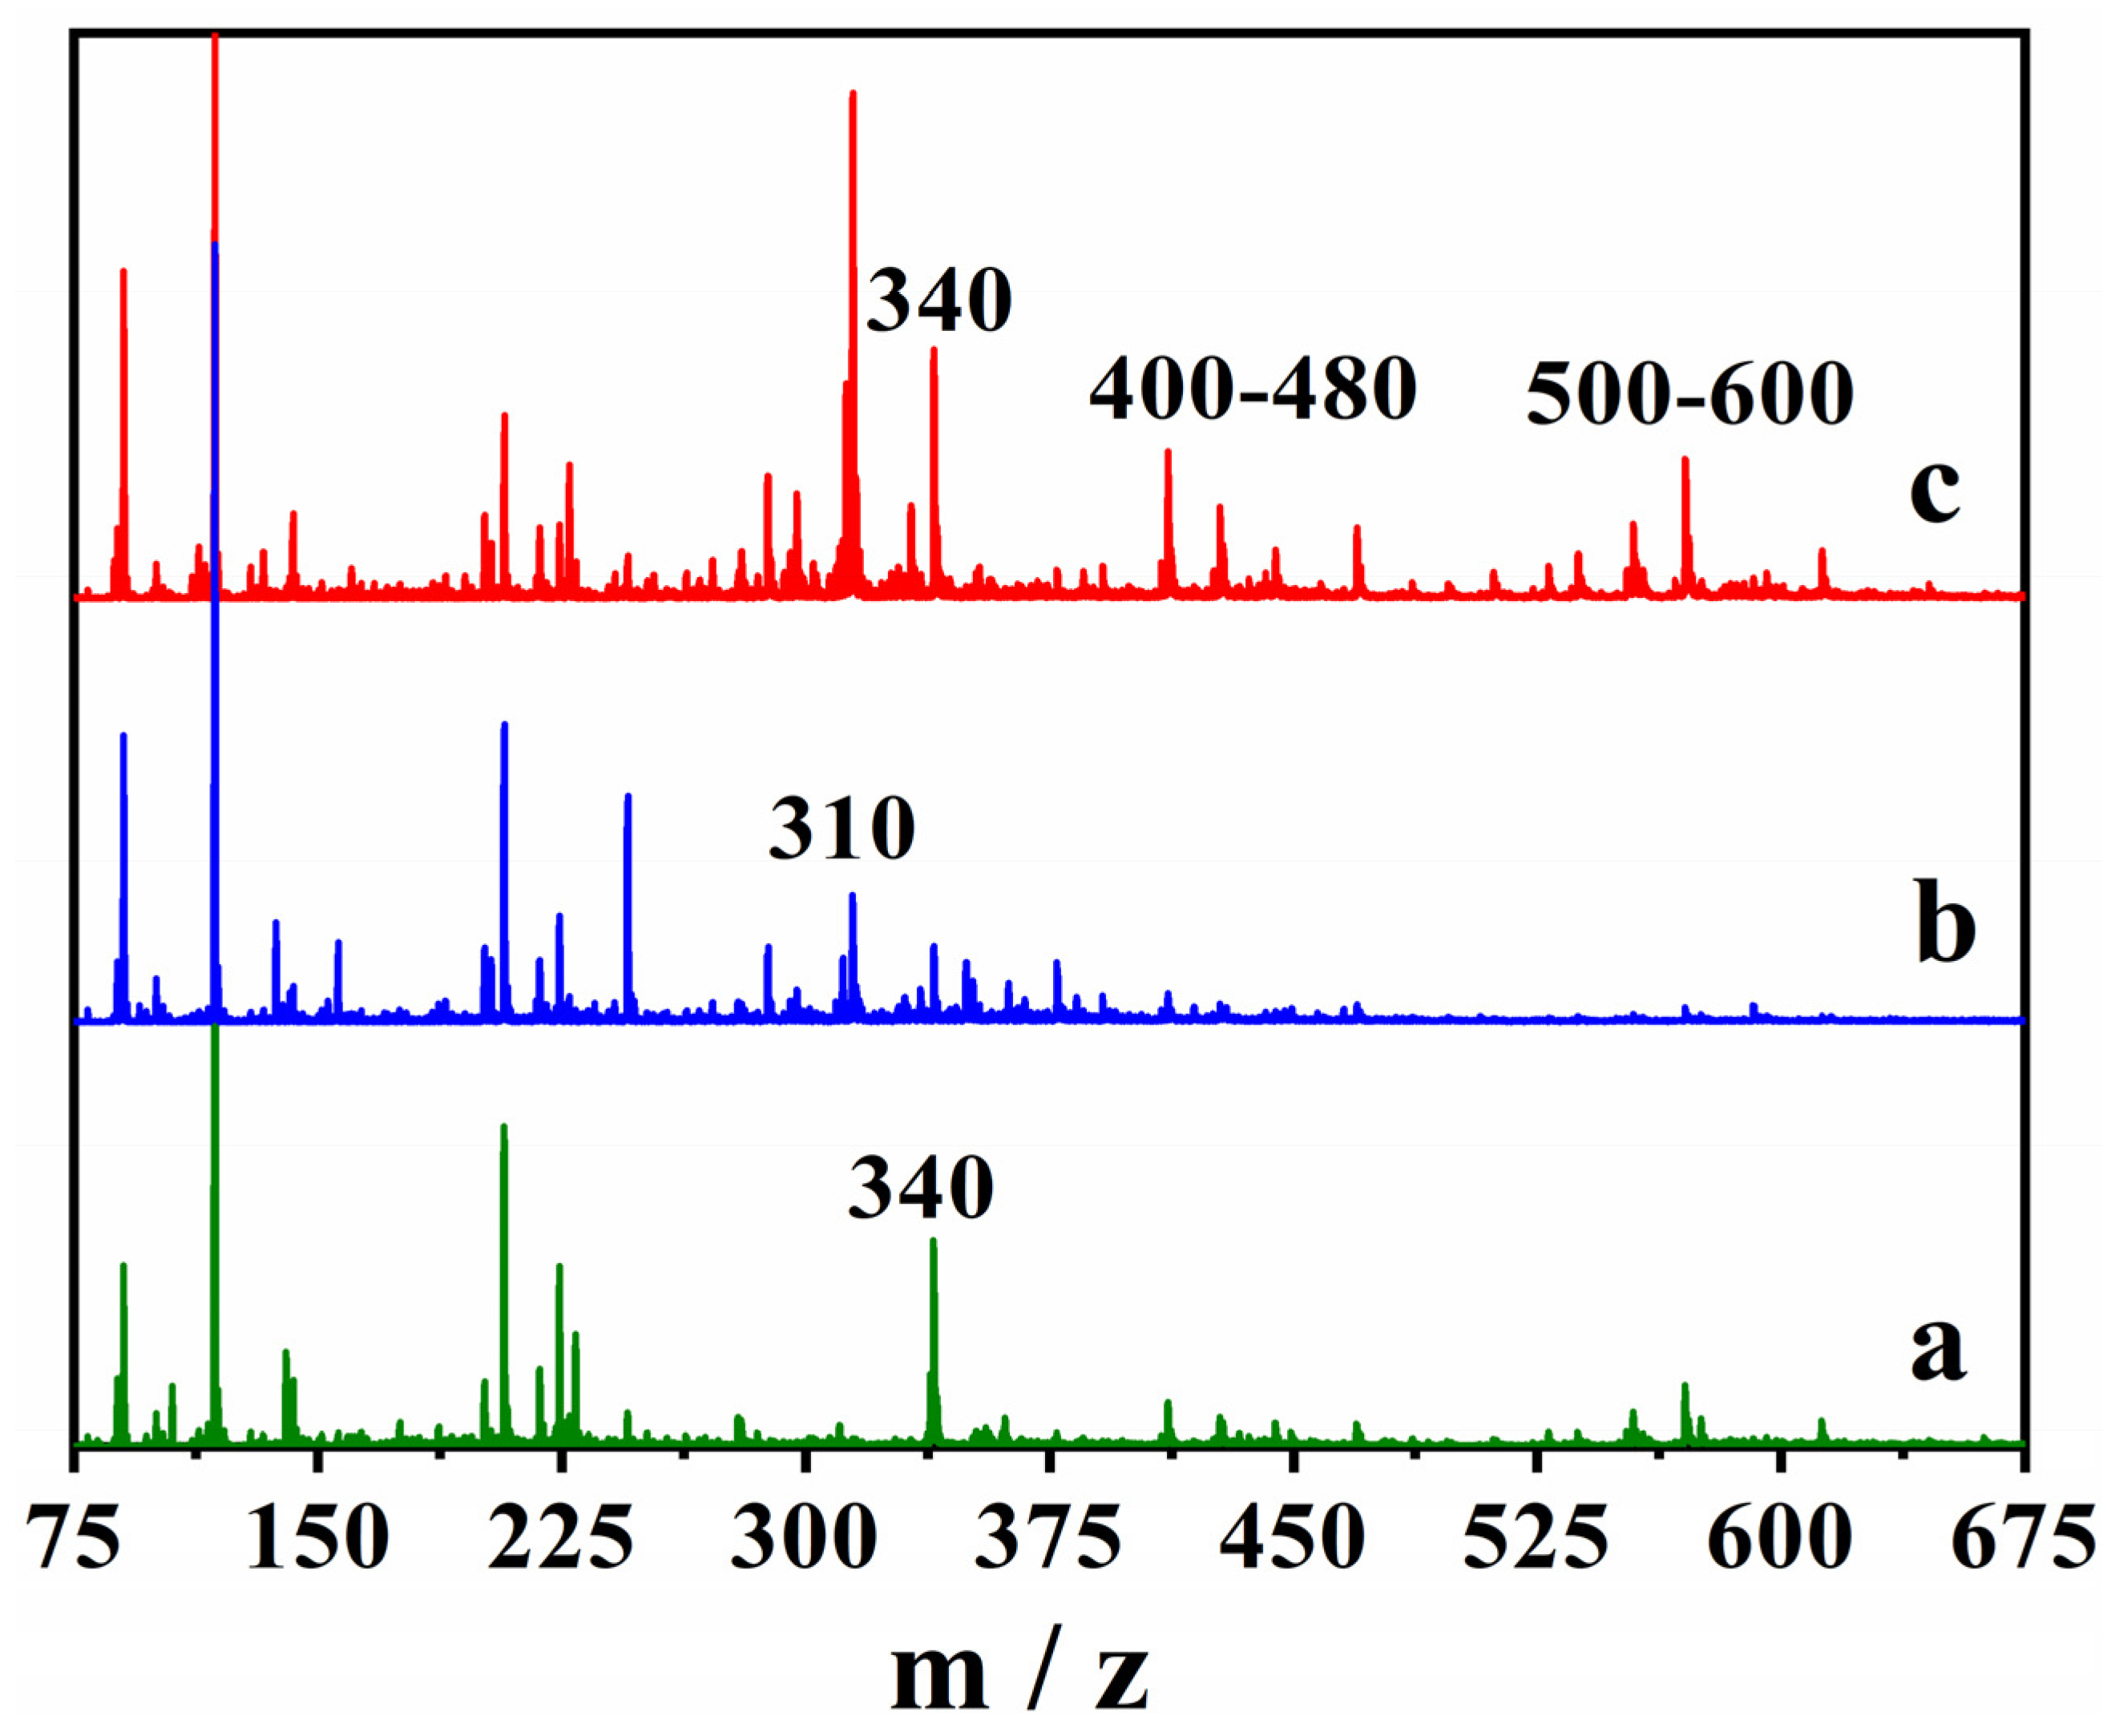
3.6. Mass Spectrometry Analysis

The cork bio-oil alkaline emulsion subjected to Electrolysis III, a bulk electrolysis in a single-compartment cell, was also analyzed using mass spectrometry (MS). The MS spectra of the blank samples, not subjected to electrolysis, and upon Electrolysis III were directly compared to assess the formation of new compounds (Figure 12).
The cork bio-oil spectrum (a) contains a well-defined peak at 340 m/z, which is not present in the alkaline emulsion (b), whereas a new peak appears between 310 and 320 m/z. After the bulk electrolysis test, three new peaks (or groups of peaks) appear in the MS spectrum of the cork bio-oil emulsion (c). The peaks at 340 m/z, between 400 and 480 m/z, and at 500–600 m/z, which were not previously visible in the spectrum (b), demonstrate the existence of chemical modifications during electrolysis. Although further studies are required, MS seems a critical tool to identify the products formed during bulk electrolysis of bio-oil samples. Several possibilities might then be considered for the mechanisms of the reactions occurring during the bio-oil electrolysis, such as oxidative esterification [61], or hydrogenation of polyols, alcohols, aldehydes, ketones, and carboxyls [62].

4. Conclusions

The present work intended to assess the suitability of electrochemical transformations in three different bio-oils (produced from cork, pinewood, and olive stones biomass) in the context of a biorefinery scenario to produce added-value compounds. A major drawback to this approach is the low conductivity of the bio-oils. Thus, acid and alkaline electrolytes were added to the bio-oils to increase their ionic conductivity. Upon H2SO4 addition, the cork bio-oil exhibited the highest increase in conductivity, whereas olive stones bio-oil showed the smallest. However, the direct addition of strong acid or alkaline electrolytes led to an undesirable increase in the viscosity of the bio-oil, possibly due to the repolymerization of the unstable polymer fragments. Inversely to the conductivity increase, the olive stones bio-oil showed the highest viscosity increase with the acid addition, while the cork bio-oil showed the smallest. The addition of solid KOH electrolyte was shown to have an even larger effect on the bio-oil viscosity when compared to the acid addition, and thus this approach was abandoned.
The CVs of the unmodified bio-oil samples did not show redox peaks for potentials ranging between −2 V and +2 V, although a significant increase in the current densities was observed upon H2SO4 addition. The hydrogen evolution reaction (HER) kinetics were also enhanced with the acid addition, as shown in the CVs and determined from the Tafel analysis of the cathodic LSVs. The CA studies exhibited good stability of the currents recorded in the three bio-oils, with the expected transient current increase for higher overpotentials.
Concerning the cork bio-oil emulsions, two different results were observed. The unstable cork bio-oil acidic emulsion (with 2 M H2SO4 aqueous solution) shows a significant phase separation, potentially triggered by the neutralization of hydrophilic phenolates, and led to poor electrochemical results. The cork bio-oil alkaline emulsion (with 2 M KOH aqueous solution) showed much higher stability, presenting a single homogeneous phase possibly due to the formation of said phenolates. This alkaline emulsion showed remarkable differences in electrochemical behavior after bulk electrolysis, giving much higher kinetic currents for the HER. There was also a visible enhancement of the redox processes in the solution, suggesting considerable changes in the cork bio-oil alkaline emulsion composition upon electrolysis.
The ATR-FTIR and ESI-MS analyses of the samples subjected to electrolysis versus the blank samples confirmed the formation of new species during bulk electrolysis. ATR-FTIR analysis showed an increase in the peak signals, corresponding to the vibration of functional groups with oxygen, suggesting the occurrence of a wide variety of oxidation reactions. Namely, the appearance of functional groups related to esters, alcohols, and carboxylic acids was visible. The reduction of some peaks related to aliphatic hydrocarbons and cyclic rings was also observed, hinting at the cleavage of molecules of higher molecular weight. Additionally, the ESI-MS spectra demonstrate the formation of new compounds during electrolysis, corroborating the results from the ATR-FTIR analysis.
These data are exciting but show that further studies are required to understand the processes and mechanisms that rule bio-oil electrolysis as a key point to enable this resource to produce industrially relevant compounds.

Author Contributions

Conceptualization, D.M.F.S. and J.C.; methodology, D.M.F.S. and J.C.; investigation, T.S.; writing—original draft preparation, T.S.; writing—review and editing, D.M.F.S. and J.C.; supervision, D.M.F.S. and J.C. All authors have read and agreed to the published version of the manuscript.

Funding

This research was funded by the Foundation for Science and Technology (FCT, Portugal) within strategic projects FCT-UID/CTM/04540/2013 (CeFEMA) and FCT-UID/ECI/04028/2013 (CERENA) and a contract in the scope of programmatic funding UIDP/04540/2020 (D.M.F.S.).

Data Availability Statement

The data presented in this study are available on request from the corresponding author.

Acknowledgments

This publication is based upon work from COST Action Waste biorefinery technologies for accelerating sustainable energy processes (WIRE), CA20127, supported by COST (European Cooperation in Science and Technology); www.cost.eu (accessed on 6 September 2022). Special thanks to TORBEL S.A. (Ílhavo, Portugal, https://torbel.pt/, accessed on 20 July 2022) for supplying the biomass samples and to Sriram Hariharakrishnan for producing olive stones and pinewood bio-oils.

Conflicts of Interest

The authors declare no conflict of interest. The funders had no role in the design of the study; in the collection, analyses, or interpretation of data; in the writing of the manuscript; or in the decision to publish the results.

References

  1. Brandt, A.; Gräsvik, J.; Hallett, J.P.; Welton, T. Deconstruction of lignocellulosic biomass with ionic liquids. Green Chem. 2013, 15, 550–583. [Google Scholar] [CrossRef] [Green Version]
  2. Alonso, D.M.; Bond, J.Q.; Dumesic, J.A. Catalytic conversion of biomass to biofuels. Green Chem. 2010, 12, 1493–1513. [Google Scholar] [CrossRef]
  3. Jørgensen, H.; Kristensen, J.B.; Felby, C. Enzymatic conversion of lignocellulose into fermentable sugars: Challenges and opportunities. Biofuels Bioprod. Bioref. 2007, 1, 119–134. [Google Scholar] [CrossRef]
  4. Wannapeera, J.; Worasuwannarak, N. Upgrading of woody biomass by torrefaction under pressure. J. Anal. Appl. Pyrol. 2012, 96, 173–180. [Google Scholar] [CrossRef]
  5. Balat, M. Mechanisms of thermochemical biomass conversion processes. Part 3: Reactions of liquefaction. Energ. Source. Part A 2008, 30, 649–659. [Google Scholar] [CrossRef]
  6. Panwar, N.L.; Kothari, R.; Tyagi, V.V. Thermo chemical conversion of biomass—Eco friendly energy routes. Renew. Sustain. Energy Rev. 2012, 16, 1801–1816. [Google Scholar] [CrossRef]
  7. Haverly, M.R.; Schulz, T.C.; Whitmer, L.E.; Friend, A.J.; Funkhouser, J.M.; Smith, R.G.; Young, M.K.; Brown, R.C. Continuous solvent liquefaction of biomass in a hydrocarbon solvent. Fuel 2018, 211, 291–300. [Google Scholar] [CrossRef]
  8. Huang, H.J.; Yuan, X.Z. Recent progress in the direct liquefaction of typical biomass. Prog. Energy Combust. Sci. 2015, 49, 59–80. [Google Scholar] [CrossRef]
  9. Zhong, C.; Wei, X. A comparative experimental study on the liquefaction of wood. Energy 2004, 29, 1731–1741. [Google Scholar] [CrossRef]
  10. Behrendt, F.; Neubauer, Y.; Oevermann, M.; Wilmes, B.; Zobel, N. Direct liquefaction of biomass. Chem. Eng. Technol. 2008, 31, 667–677. [Google Scholar] [CrossRef]
  11. Hu, S.; Wan, C.; Li, Y. Production and characterization of biopolyols and polyurethane foams from crude glycerol based liquefaction of soybean straw. Bioresour. Technol. 2012, 103, 227–233. [Google Scholar] [CrossRef] [PubMed]
  12. Zou, X.; Qin, T.; Huang, L.; Zhang, X.; Yang, Z.; Wang, Y. Mechanisms and main regularities of biomass liquefaction with alcoholic solvents. Energy Fuels 2009, 23, 5213–5218. [Google Scholar] [CrossRef]
  13. Mateus, M.M.; Carvalho, R.; Bordado, J.C.; dos Santos, R.G. Biomass acid-catalyzed liquefaction—Catalysts performance and polyhydric alcohol influence. Data Brief 2015, 5, 736–738. [Google Scholar] [CrossRef] [PubMed] [Green Version]
  14. Mateus, M.M.; Bordado, J.C.; dos Santos, R.G. Potential biofuel from liquefied cork—Higher heating value comparison. Fuel 2016, 174, 114–117. [Google Scholar] [CrossRef]
  15. Speight, J.G. The Biofuels Handbook; RSC Publishing: Cambridge, UK, 2011. [Google Scholar] [CrossRef] [Green Version]
  16. Pan, H. Synthesis of polymers from organic solvent liquefied biomass: A review. Renew Sustain. Energy Rev. 2011, 15, 3454–3463. [Google Scholar] [CrossRef]
  17. Wang, Y.; Wu, J.; Wan, Y.; Lei, H.; Yu, F.; Chen, P.; Lin, X.; Liu, Y.; Ruan, R. Liquefaction of corn stover using industrial biodiesel glycerol. Int. J. Agric. Biol. Eng. 2009, 2, 32–40. [Google Scholar]
  18. Yu, F.; Liu, Y.; Pan, X.; Lin, X.; Liu, C.; Chen, P.; Ruan, R. Liquefaction of corn stover and preparation of polyester from the liquefied polyol. Appl. Biochem. Biotechnol. 2006, 130, 574–585. [Google Scholar] [CrossRef]
  19. Lee, S.H.; Teramoto, Y.; Shiraishi, N. Biodegradable polyurethane foam from liquefied waste paper and its thermal stability, biodegradability, and genotoxicity. J. Appl. Polym. Sci. 2002, 83, 1482–1489. [Google Scholar] [CrossRef]
  20. Dos Santos, R.G.; Carvalho, R.; Silva, E.R.; Bordado, J.C.; Cardoso, A.C.; Costa, M.R.; Mateus, M.M. Natural polymeric water-based adhesive from cork liquefaction. Ind. Crops Prod. 2016, 84, 314–319. [Google Scholar] [CrossRef]
  21. Esteves, B.; Dulyanska, Y.; Costa, C.; Vicente, J.; Domingos, I.; Pereira, H.; de Lemos, L.T.; Cruz-Lopes, L. Cork liquefaction for Polyurethane foam production. BioResources 2017, 12, 2339–2353. [Google Scholar] [CrossRef]
  22. Guerra, L.; Moura, K.; Rodrigues, J.; Gomes, J.; Puna, J.; Bordado, J.; Santos, T. Synthesis gas production from water electrolysis, using the Electrocracking concept. J. Environ. Chem. Eng. 2018, 6, 604–609. [Google Scholar] [CrossRef]
  23. Nilges, P.; dos Santos, T.R.; Harnisch, F.; Schröder, U. Electrochemistry for biofuel generation: Electrochemical conversion of levulinic acid to octane. Energy Environ. Sci. 2012, 5, 5231–5235. [Google Scholar] [CrossRef]
  24. Dos Santos, T.R.; Nilges, P.; Sauter, W.; Harnisch, F.; Schröder, U. Electrochemistry for the generation of renewable chemicals: Electrochemical conversion of levulinic acid. RSC Adv. 2015, 5, 26634–26643. [Google Scholar] [CrossRef]
  25. Larew, L.A.; Johnson, D.C. Concentration dependence of the mechanism of glucose oxidation at gold electrodes in alkaline media. J. Electroanal. Chem. 1989, 262, 167–182. [Google Scholar] [CrossRef]
  26. Adzic, R.R.; Hsiao, M.W.; Yeager, E.B. Electrochemical oxidation of glucose on single crystal gold surfaces. J. Electroanal. Chem. 1989, 260, 475–485. [Google Scholar] [CrossRef]
  27. Tominaga, M.; Shimazoe, T.; Nagashima, M.; Kusuda, H.; Kubo, A.; Kuwahara, Y.; Taniguchi, I. Electrocatalytic oxidation of glucose at gold-silver alloy, silver and gold nanoparticles in an alkaline solution. J. Electroanal. Chem. 2006, 590, 37–46. [Google Scholar] [CrossRef] [Green Version]
  28. Aoun, S.B. Electrocatalytic oxidation of glucose at gold nanoparticle-modified pfc electrodes in an alkaline solution. J. Mater. Environ. Sci. 2013, 4, 887–892. [Google Scholar]
  29. Aoun, S.B.; Taniguchi, I. Effective electrocatalytic oxidation of glucose at platinum nanoparticle-based carbon electrodes. Chem. Lett. 2008, 37, 936–937. [Google Scholar] [CrossRef]
  30. Parpot, P.; Santos, P.R.B.; Bettencourt, A.P. Electro-oxidation of d-mannose on platinum, gold and nickel electrodes in aqueous medium. J. Electroanal. Chem. 2007, 610, 154–162. [Google Scholar] [CrossRef]
  31. De Sucre, V.S.; Watkinson, A.P. Anodic oxidation of phenol for waste water treatment. Can. J. Chem. Eng. 1980, 59, 52–59. [Google Scholar] [CrossRef]
  32. Comninellis, C.; Nerini, A. Anodic oxidation of phenol in the presence of NaCl for wastewater treatment. J. Appl. Electrochem. 1995, 25, 23–28. [Google Scholar] [CrossRef]
  33. Jokic, A.; Ristic, N.; Jaksic, M.M.; Spasojevic, M.; Krstajic, N. Simultaneous electrolytic production of xylitol and xylonic acid from xylose. J. Appl. Electrochem. 1991, 21, 321–326. [Google Scholar] [CrossRef]
  34. Governo, A.T.; Proença, L.; Parpot, P.; Lopes, M.I.S.; Fonseca, I.T.E. Electro-oxidation of d-xylose on platinum and gold electrodes in alkaline medium. Electrochim. Acta 2004, 49, 1535–1545. [Google Scholar]
  35. Weinberg, N.L.; Weinberg, H.R. Electrochemical oxidation of organic compounds. Chem. Rev. 1968, 68, 449–523. [Google Scholar] [CrossRef]
  36. Andrews, E.M.; Egbert, J.D.; Sanyal, U.; Holladay, J.D.; Weber, R.S. Anode-boosted electrolysis in electrochemical upgrading of bio-oils and in the production of H2. Energy Fuels 2020, 34, 1162–1165. [Google Scholar] [CrossRef]
  37. Hansen, S.; Mirkouei, A.; Diaz, L.A. A comprehensive state-of-technology review for upgrading bio-oil to renewable or blended hydrocarbon fuels. Renew. Sustain. Energy Rev. 2020, 118, 109548. [Google Scholar] [CrossRef]
  38. Deng, W.; Xu, K.; Xiong, Z.; Chaiwat, W.; Wang, X.; Su, S.; Hu, S.; Qiu, J.; Wang, Y.; Xiang, J. Evolution of aromatic structures during the low-temperature electrochemical upgrading of bio-oil. Energy Fuels 2019, 33, 11292–11301. [Google Scholar] [CrossRef]
  39. Lister, T.E.; Diaz, L.A.; Lilga, M.A.; Padmaperuma, A.B.; Lin, Y.; Palakkal, V.M.; Arges, C.G. Low-temperature electrochemical upgrading of bio-oils using polymer electrolyte membranes. Energy Fuels 2018, 32, 5944–5950. [Google Scholar] [CrossRef]
  40. Dang, Q.; Wright, M.M.; Li, W. Technoeconomic analysis of a hybrid biomass thermochemical and electrochemical conversion system. Energy Technol. 2018, 6, 178–187. [Google Scholar] [CrossRef]
  41. Silva, T.A.R. Electrochemical conversion of liquefied forest biomass: Preliminary studies. In Thesis to Obtain the Master of Science Degree in Chemical Engineering; Instituto Superior Técnico: Lisboa, Portugal, 2018. [Google Scholar]
  42. Hariharakrishnan, S. Minimization of fine particles emission from biomass combustion liquefaction, combustion additives and cyclone separators. In Thesis to Obtain the Master of Science Degree in Energy Engineering and Management; Instituto Superior Técnico: Lisboa, Portugal, 2017. [Google Scholar]
  43. Condeço, J.A.D.; Hariharakrishnan, S.; Ofili, O.M.; Mateus, M.M.; Bordado, J.M.; Correia, J.M.N. Energetic valorisation of agricultural residues by solvent-based liquefaction. Biomass Bioenergy 2021, 147, 106003. [Google Scholar] [CrossRef]
  44. Chen, W.; Zhang, Q.; Lin, X.; Jiang, K.; Han, D. The degradation and repolymerization analysis on solvolysis liquefaction of corn stalk. Polymers 2020, 12, 2337. [Google Scholar] [CrossRef] [PubMed]
  45. Marques, I.P.; Gil, L.; La Cara, F. Energetic and biochemical valorization of cork boiling wastewater by anaerobic digestion. Biotechnol. Biofuels 2014, 7, 67. [Google Scholar] [CrossRef] [PubMed]
  46. Oliveira, R.C.P.; Mateus, M.M.; Santos, D.M.F. On the oxidation of kraft black liquor for lignin recovery: A voltammetric study. J. Electrochem. Soc. 2019, 166, E547–E553. [Google Scholar] [CrossRef]
  47. Zou, S.; Wu, Y.; Yang, M.; Li, C.; Tong, J. Bio-oil production from sub- and supercritical water liquefaction of microalgae Dunaliella tertiolecta and related properties. Energy Environ. Sci. 2010, 3, 1073–1078. [Google Scholar] [CrossRef]
  48. Soares, B.; Gama, N.; Freire, C.; Barros-Timmons, A.; Brandão, I.; Silva, R.; Neto, C.P.; Ferreira, A. Ecopolyol production from industrial cork powder via acid liquefaction using polyhydric alcohols. ACS Sustain. Chem. Eng. 2014, 2, 846–854. [Google Scholar] [CrossRef]
  49. Kanaujia, P.K.; Sharma, Y.K.; Garg, M.O.; Tripathi, D.; Singh, R. Review of analytical strategies in the production and upgrading of bio-oils derived from lignocellulosic biomass. J. Anal. Appl. Pyrol. 2014, 105, 55–74. [Google Scholar] [CrossRef]
  50. Xu, F.; Yu, J.; Tesso, T.; Dowell, F.; Wang, D. Qualitative and quantitative analysis of lignocellulosic biomass using infrared techniques: A mini-review. Appl. Energy 2013, 104, 801–809. [Google Scholar] [CrossRef] [Green Version]
  51. Asadieraghi, M.; Daud, W.M.A.W. Characterization of lignocellulosic biomass thermal degradation and physiochemical structure: Effects of demineralization by diverse acid solutions. Energy Convers. Manag. 2014, 82, 71–80. [Google Scholar] [CrossRef]
  52. Grilc, M.; Likozar, B.; Levec, J. Hydrotreatment of solvolytically liquefied lignocellulosic biomass over NiMo/Al2O3 catalyst: Reaction mechanism, hydrodeoxygenation kinetics and mass transfer model based on FTIR. Biomass Bioenergy 2014, 63, 300–312. [Google Scholar] [CrossRef]
  53. Akhade, S.A.; Singh, N.; Gutiérrez, O.Y.; Lopez-Ruiz, J.; Wang, H.; Holladay, J.D.; Liu, Y.; Karkamkar, A.; Weber, R.S.; Padmaperuma, A.B.; et al. Electrocatalytic hydrogenation of biomass-derived organics: A review. Chem. Rev. 2020, 120, 11370–11419. [Google Scholar] [CrossRef]
  54. Carneiro, J.; Nikolla, E. Electrochemical conversion of biomass-based oxygenated compounds. Annu. Rev. Chem. Biomol. Eng. 2019, 10, 85–104. [Google Scholar] [CrossRef] [PubMed]
  55. Lam, C.H.; Deng, W.; Lang, L.; Jin, X.; Hu, X.; Wang, Y. Minireview on bio-oil upgrading via electrocatalytic hydrogenation: Connecting biofuel production with renewable power. Energy Fuels 2020, 34, 7915–7928. [Google Scholar] [CrossRef]
  56. Sanyal, U.; Koh, K.; Meyer, L.C.; Karkamkar, A.; Gutierrez, O.Y. Simultaneous electrocatalytic hydrogenation of aldehydes and phenol over carbon-supported metals. J. Appl. Electrochem. 2021, 51, 27–36. [Google Scholar] [CrossRef]
  57. Qiu, Y.; Lopez-Ruiz, J.A.; Sanyal, U.; Andrews, E.; Gutierrez, O.Y.; Holladay, J.D. Anodic electrocatalytic conversion of carboxylic acids on thin films of RuO2, IrO2, and Pt. Appl. Catal. B 2020, 277, 119277. [Google Scholar] [CrossRef]
  58. Fereidooni, L.; Tahvildari, K.; Mehrpooya, M. Trans-esterification of waste cooking oil with methanol by electrolysis process using KOH. Renew. Energy 2018, 116, 183–193. [Google Scholar] [CrossRef]
  59. Moradi, P.; Saidi, M.; Najafabadi, A.T. Biodiesel production via esterification of oleic acid as a representative of free fatty acid using electrolysis technique as a novel approach: Non-catalytic and catalytic conversion. Process Saf. Environ. 2021, 147, 684–692. [Google Scholar] [CrossRef]
  60. Yuan, G.; Zhang, J.; Zeng, G.; Niu, X.; Wang, L.; Zhang, X.; Wang, Q. Electrocatalytic methyl esterification of fatty acid using boron-doped diamond electrodes. Algal. Res. 2020, 46, 101816. [Google Scholar] [CrossRef]
  61. Manzoli, M.; Menegazzo, F.; Signoretto, M.; Marchese, D. Biomass derived chemicals: Furfural oxidative esterification to methyl-2-furoate over gold catalysts. Catalysts 2016, 6, 107. [Google Scholar] [CrossRef] [Green Version]
  62. Du, L.; Shao, Y.; Sun, J.; Yin, G.; Du, C.; Wang, Y. Electrocatalytic valorisation of biomass derived chemicals. Catal. Sci. Technol. 2018, 8, 3216–3232. [Google Scholar] [CrossRef]
Figure 1. Cork bio-oil emulsions (after a 12 h rest period) from a 50:50 vol.% mix of the bio-oil with (A) a 2 M H2SO4 aqueous solution (phase separation) and (B) a 2 M KOH aqueous solution.
Reactions 03 00037 g001
Figure 2. The CVs of the (A) cork bio-oil, (B) pinewood bio-oil, and (C) olive stones bio-oil samples, performed with a Pt electrode at 50 mV s−1.
Reactions 03 00037 g002
Figure 3. (A) Cathodic polarization curves run at 50 mV s−1 in the cork, pinewood, and olive stones bio-oil samples with 3 M H2SO4 and (B) the corresponding Tafel plots.
Reactions 03 00037 g003
Figure 4. CAs of the samples of (A) cork, (B) pinewood, and (C) olive stones bio-oil with 3 M H2SO4 for applied potentials ranging from 0.7 V to 1.3 V at room temperature and (D) direct comparison between the three different samples at 0.9 V.
Reactions 03 00037 g004
Figure 5. CAs of the samples of (A) cork, (B) pinewood, and (C) olive stones bio-oil, with 3 M H2SO4 for applied potentials of −0.7 V to −1.3 V at room temperature and (D) direct comparison between the three different samples at −0.9 V.
Reactions 03 00037 g005
Figure 6. CVs run with a Pt electrode at 50 mV s−1 of (A) the organic phase and (B) of the aqueous phase of the cork bio-oil acidic emulsion blank and subjected to 24 h bulk electrolysis (Electrolysis II).
Reactions 03 00037 g006
Figure 7. CVs run with a Pt electrode at 50 mV s−1 of (A) a blank cork bio-oil alkaline emulsion, not subjected to electrolysis, and (B) after bulk electrolysis for 24 h (Electrolysis III).
Reactions 03 00037 g007
Figure 8. ATR-FTIR spectra of (a) a blank cork bio-oil sample, (b) an acidified (2 M H2SO4) cork bio-oil sample, not subjected to electrolysis, and (c) the same acidified cork bio-oil sample after Electrolysis I, a bulk electrolysis in a single-compartment cell for a duration of 8 h.
Reactions 03 00037 g008
Figure 9. The ATR-FTIR spectra of (a) the organic phase of the blank cork bio-oil acidic emulsion, not subjected to electrolysis, and (b) the organic phase of the acidic emulsion after Electrolysis VI. (Catholyte: acidic emulsion; Anolyte: alkaline emulsion).
Reactions 03 00037 g009
Figure 10. The ATR-FTIR spectra of (a) the aqueous phase of the blank cork bio-oil acidic emulsion, not subjected to electrolysis, and (b) the aqueous phase of the acidic emulsion after Electrolysis II, a bulk electrolysis in a single-compartment cell.
Reactions 03 00037 g010
Figure 11. The ATR-FTIR spectra of (a) the blank cork bio-oil alkaline emulsion, not subjected to electrolysis, and (b) the cork bio-oil alkaline emulsion after Electrolysis III, a bulk electrolysis in a single-compartment cell.
Reactions 03 00037 g011
Figure 12. The positive ESI-MS spectra of (a) the blank cork bio-oil, (b) the cork bio-oil alkaline emulsion, not subjected to electrolysis, and (c) after Electrolysis III, a bulk electrolysis in a single-compartment cell.
Reactions 03 00037 g012
Table 1. Cell design and electrolyte compositions used in the cork bio-oil electrolysis experiments.
Electrolysis #Cell DesignAnolyteCatholyte
ISingle-compartmentcork bio-oil with 2 M H2SO4
IIbio-oil acidic emulsion
(50:50 vol.% with 2 M H2SO4 aqueous solution)
IIIbio-oil alkaline emulsion
(50:50 vol.% with 2 M KOH aqueous solution)
IVTwo-compartmentbio-oil acidic emulsion2 M H2SO4
Vbio-oil acidic emulsion
VIbio-oil alkaline emulsionbio-oil acidic emulsion
Table 2. Experimental conditions and degree of conversion of the solvolysis liquefaction of ground cork granules biomass.
Liquefaction #123
Biomass/g100200300
Solvent/g200400600
Catalyst/g61218
Time/h444
Temperature/°C160160160
Solid residue/g336498
Conversion/%676867
Table 3. Physicochemical properties of the bio-oil samples produced from the different biomasses before and after adding 3 M H2SO4.
Bio-OilsDensity/g cm−3Viscosity/PConductivity/mS cm−1
Cork0.88<0.10.5 × 10−3
Pinewood0.89<0.11.0 × 10−3
Olive stones0.930.10.8 × 10−3
Cork + 3 M H2SO41.041.55.34
Pinewood + 3 M H2SO41.052.64.80
Olive stones + 3 M H2SO41.0919.11.85
Table 4. Current densities recorded at potentials of 2 V and −2 V in the CVs of the bio-oil samples with different H2SO4 concentrations.
Bio-OilsH2SO4/Mj2V/mA cm−2j−2V/mA cm−2
Cork00.24 × 10−3−0.27 × 10⁻³
10.33−0.58
31.10−2.23
Pinewood01.09 × 10−3−1.45 × 10⁻³
10.52−0.79
31.74−4.87
Olive stones00.99 × 10−3−1.23 × 10⁻³
10.23−0.34
30.64−1.15
Table 5. Tafel slope, b, charge transfer coefficient, α, and exchange current density, j0, parameters obtained from Tafel analysis for each bio-oil sample with 3 M H2SO4.
Bio-Oilsb/V dec−1αj0/mA cm−2
Cork0.590.100.14
Pinewood0.590.100.31
Olive stones0.980.060.10
Table 6. ATR-FTIR wavenumber range for each assigned functional group.
Wavenumber/cm−1Functional Group
3600–3100–O–H stretching vibration [14,17,47,48,49]
2949–2850–C–H stretching vibration [14,17,47,48]
1750–1735–C=O stretching vibration in esters [14,47,48]
1725–1705–C=O stretching vibration in ketones [47]
1648–1638–C=C stretching vibration in alkenes [47]
1650–1561–C=C stretching vibration in cyclic alkenes [47]
1465–1462–C–H deformation [50]
1420–1310–O–H bending vibration in alcohols [51]
1275–1200–C–O stretching vibration in alkyl aryl ethers [17]
1234–1230–C–O–C stretching vibration in alkyl aromatics [51]
1225–1200–C–O stretching vibration in ethers [17]
1205–1020–C–O stretching vibration [17,48,49]
980–730–C=C bending vibration in alkenes [52]
900–860–C–H bending vibration [14]
720–680–C–H bending vibration [47]
Publisher’s Note: MDPI stays neutral with regard to jurisdictional claims in published maps and institutional affiliations.

