
Interfacial Mass Transfer in Trichloroethylene/Surfactants/ Water Systems: Implications for Remediation Strategies

 , , ,
, , ,  and
and
Abstract
:1. Introduction
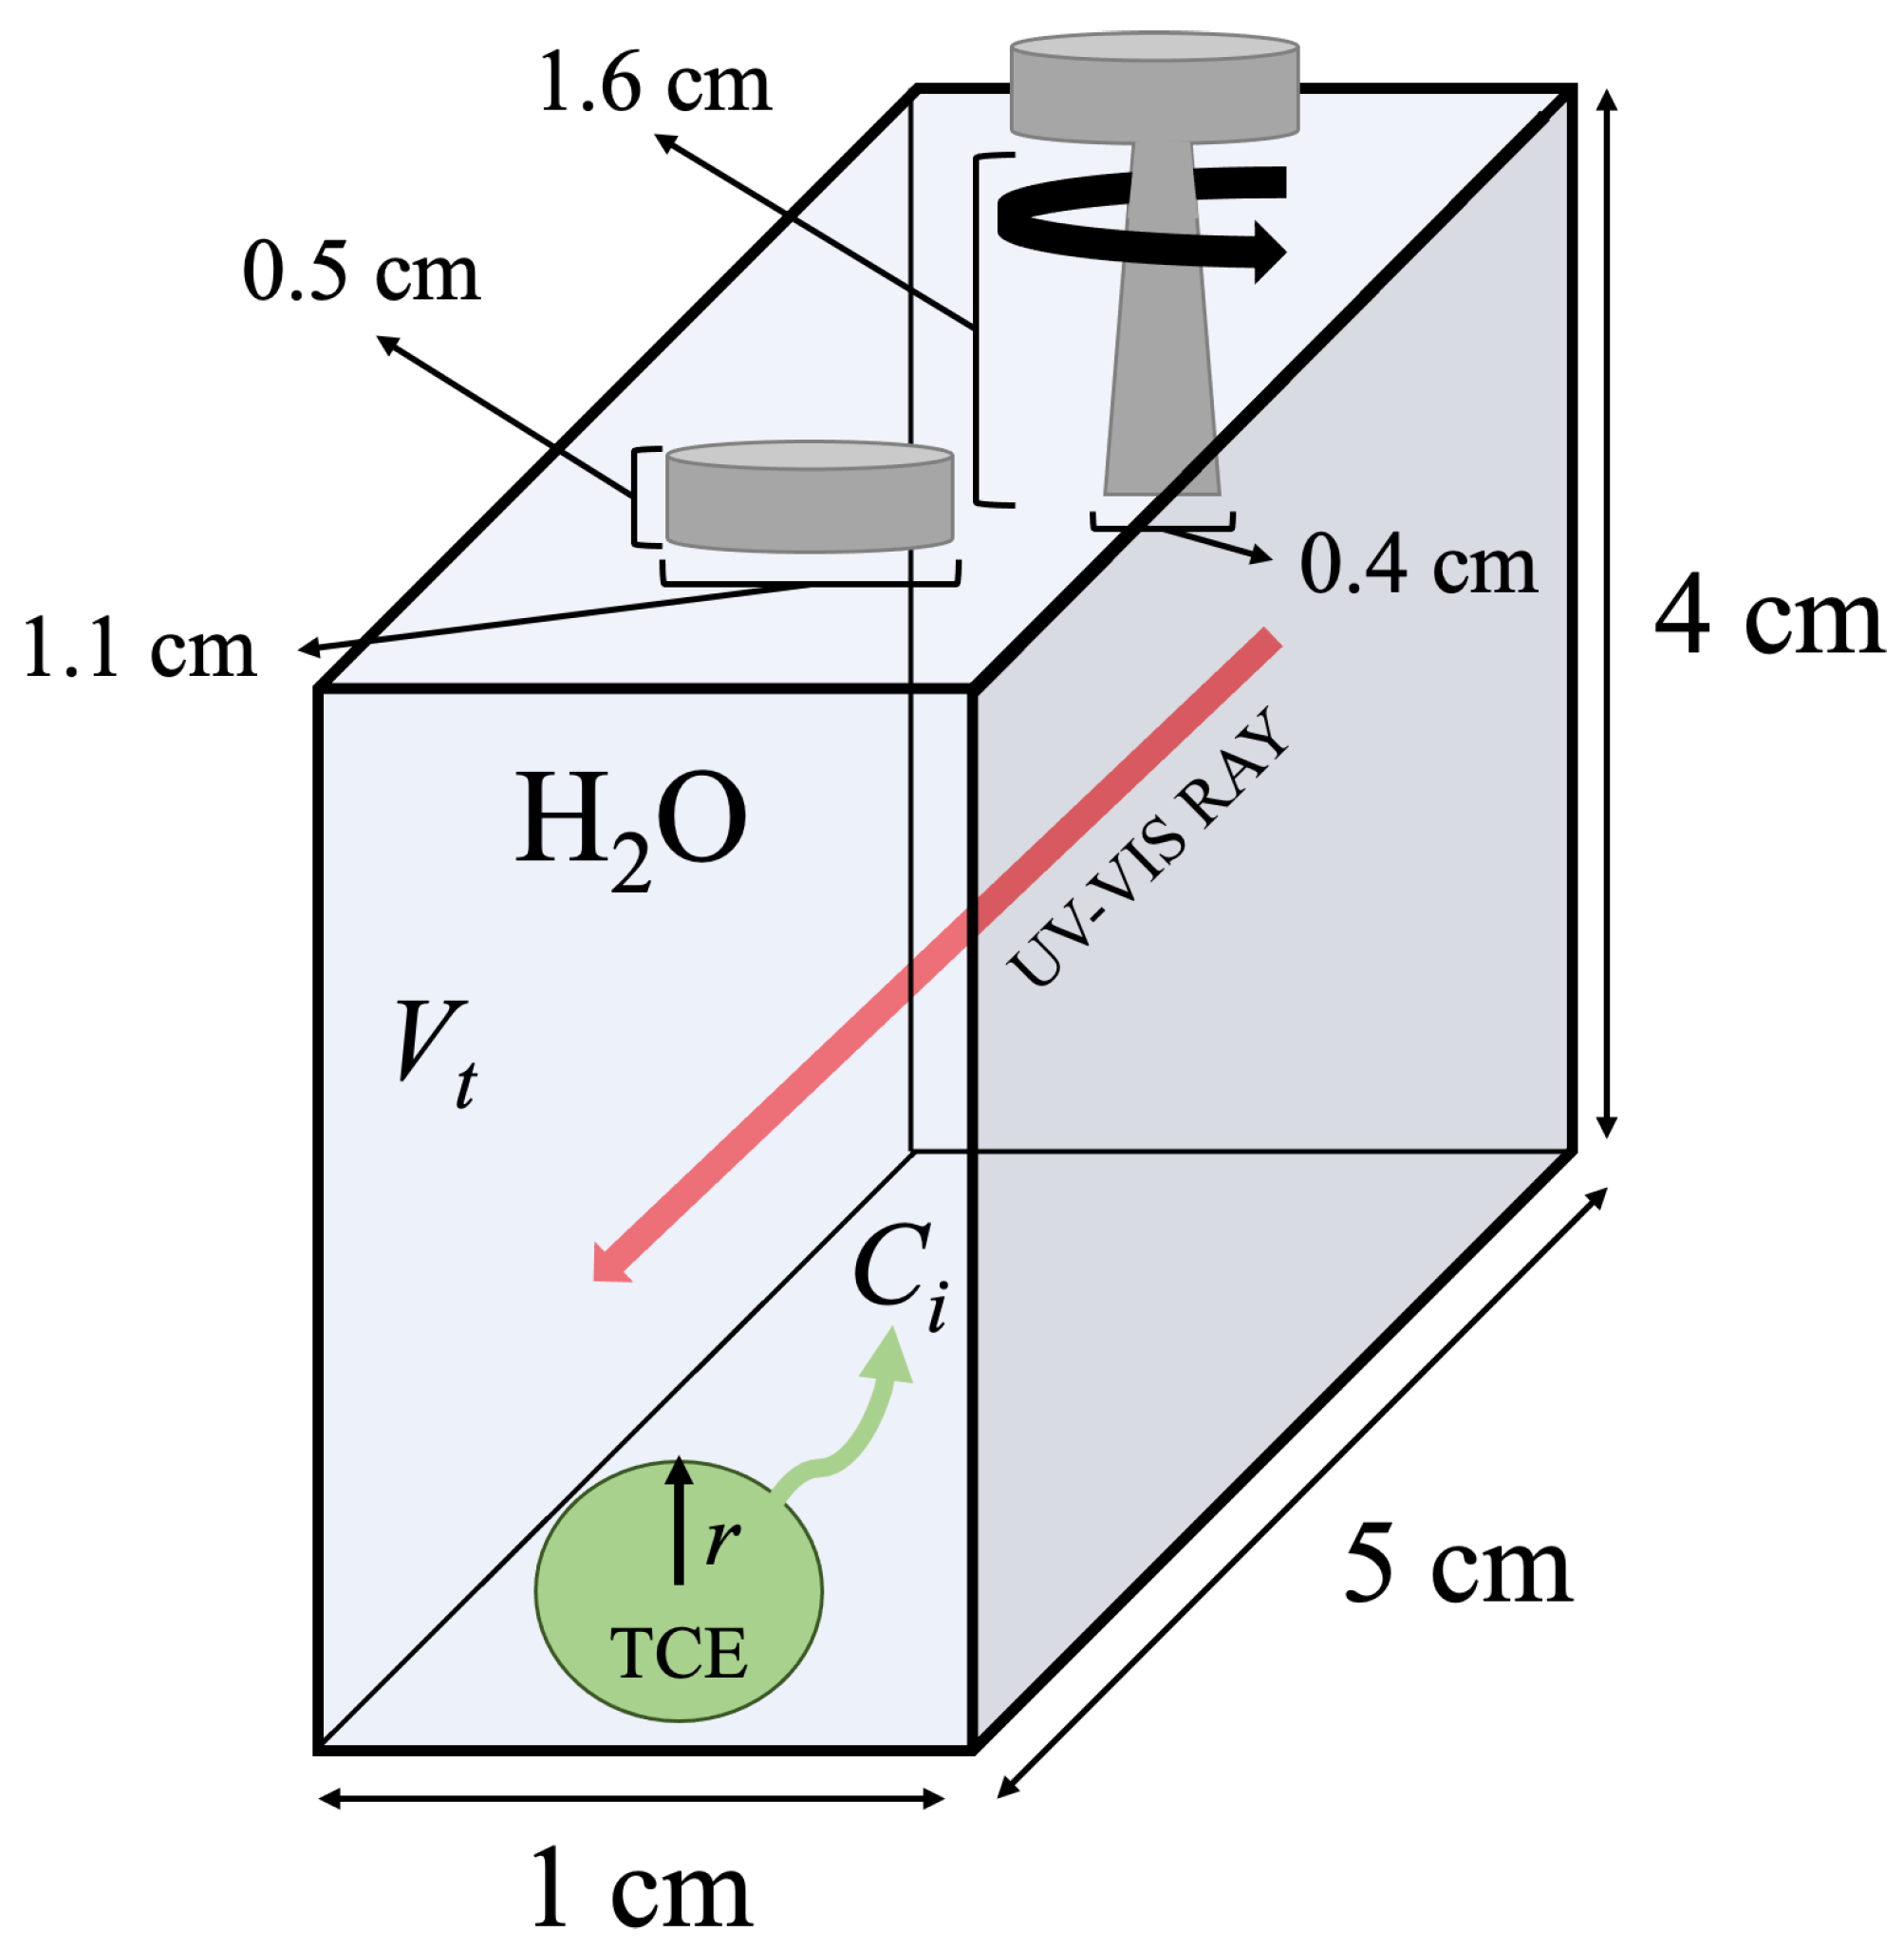
2. Theoretical Approach
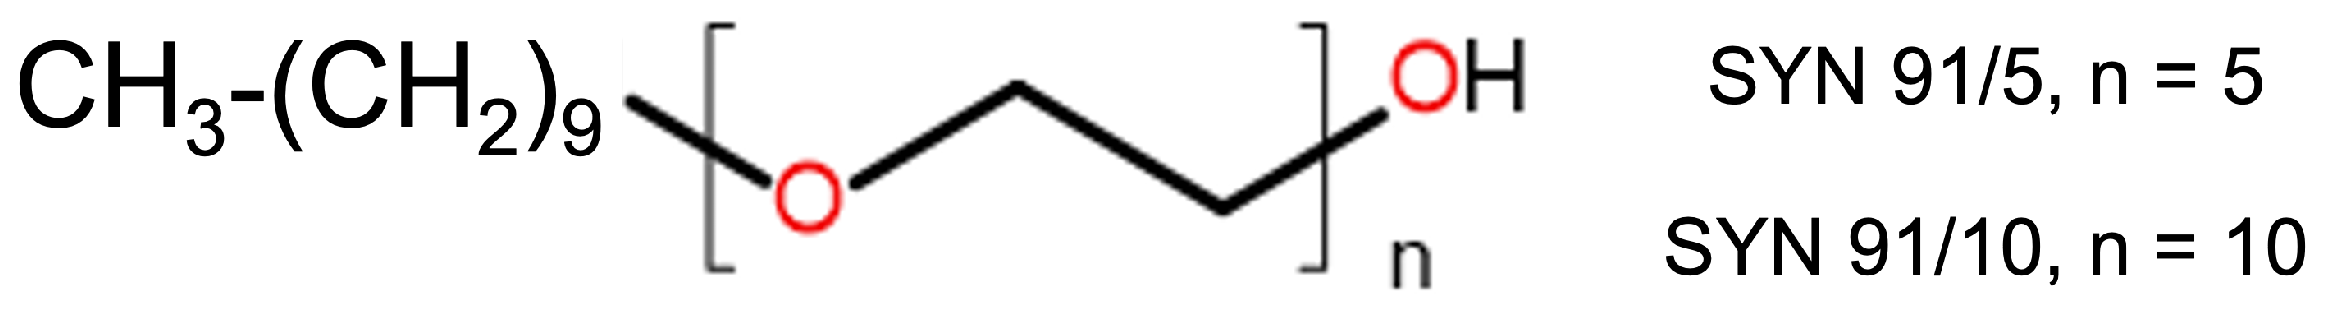
3. Materials and Methods
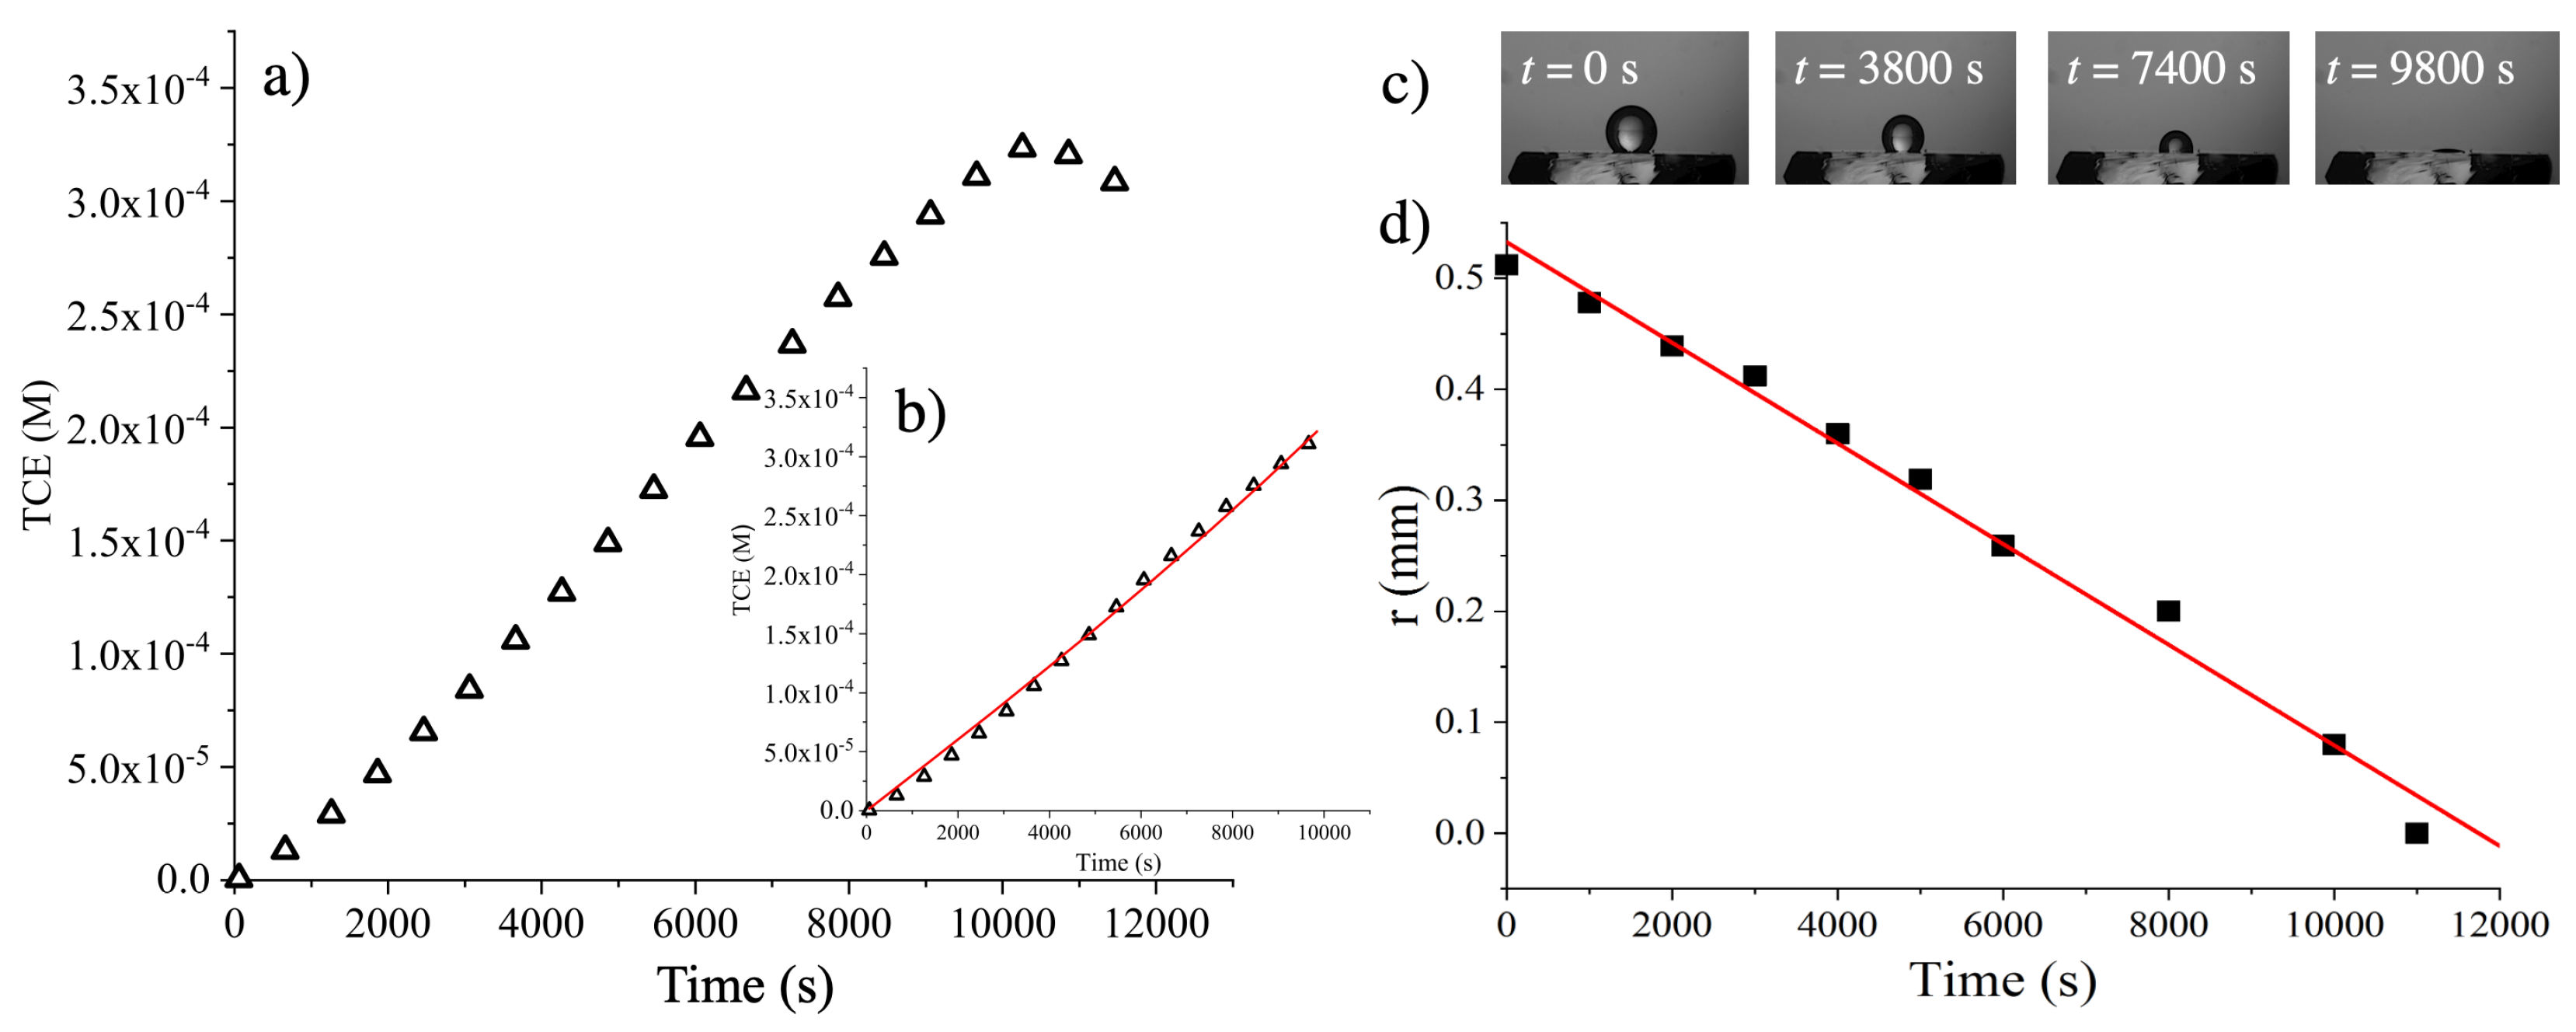
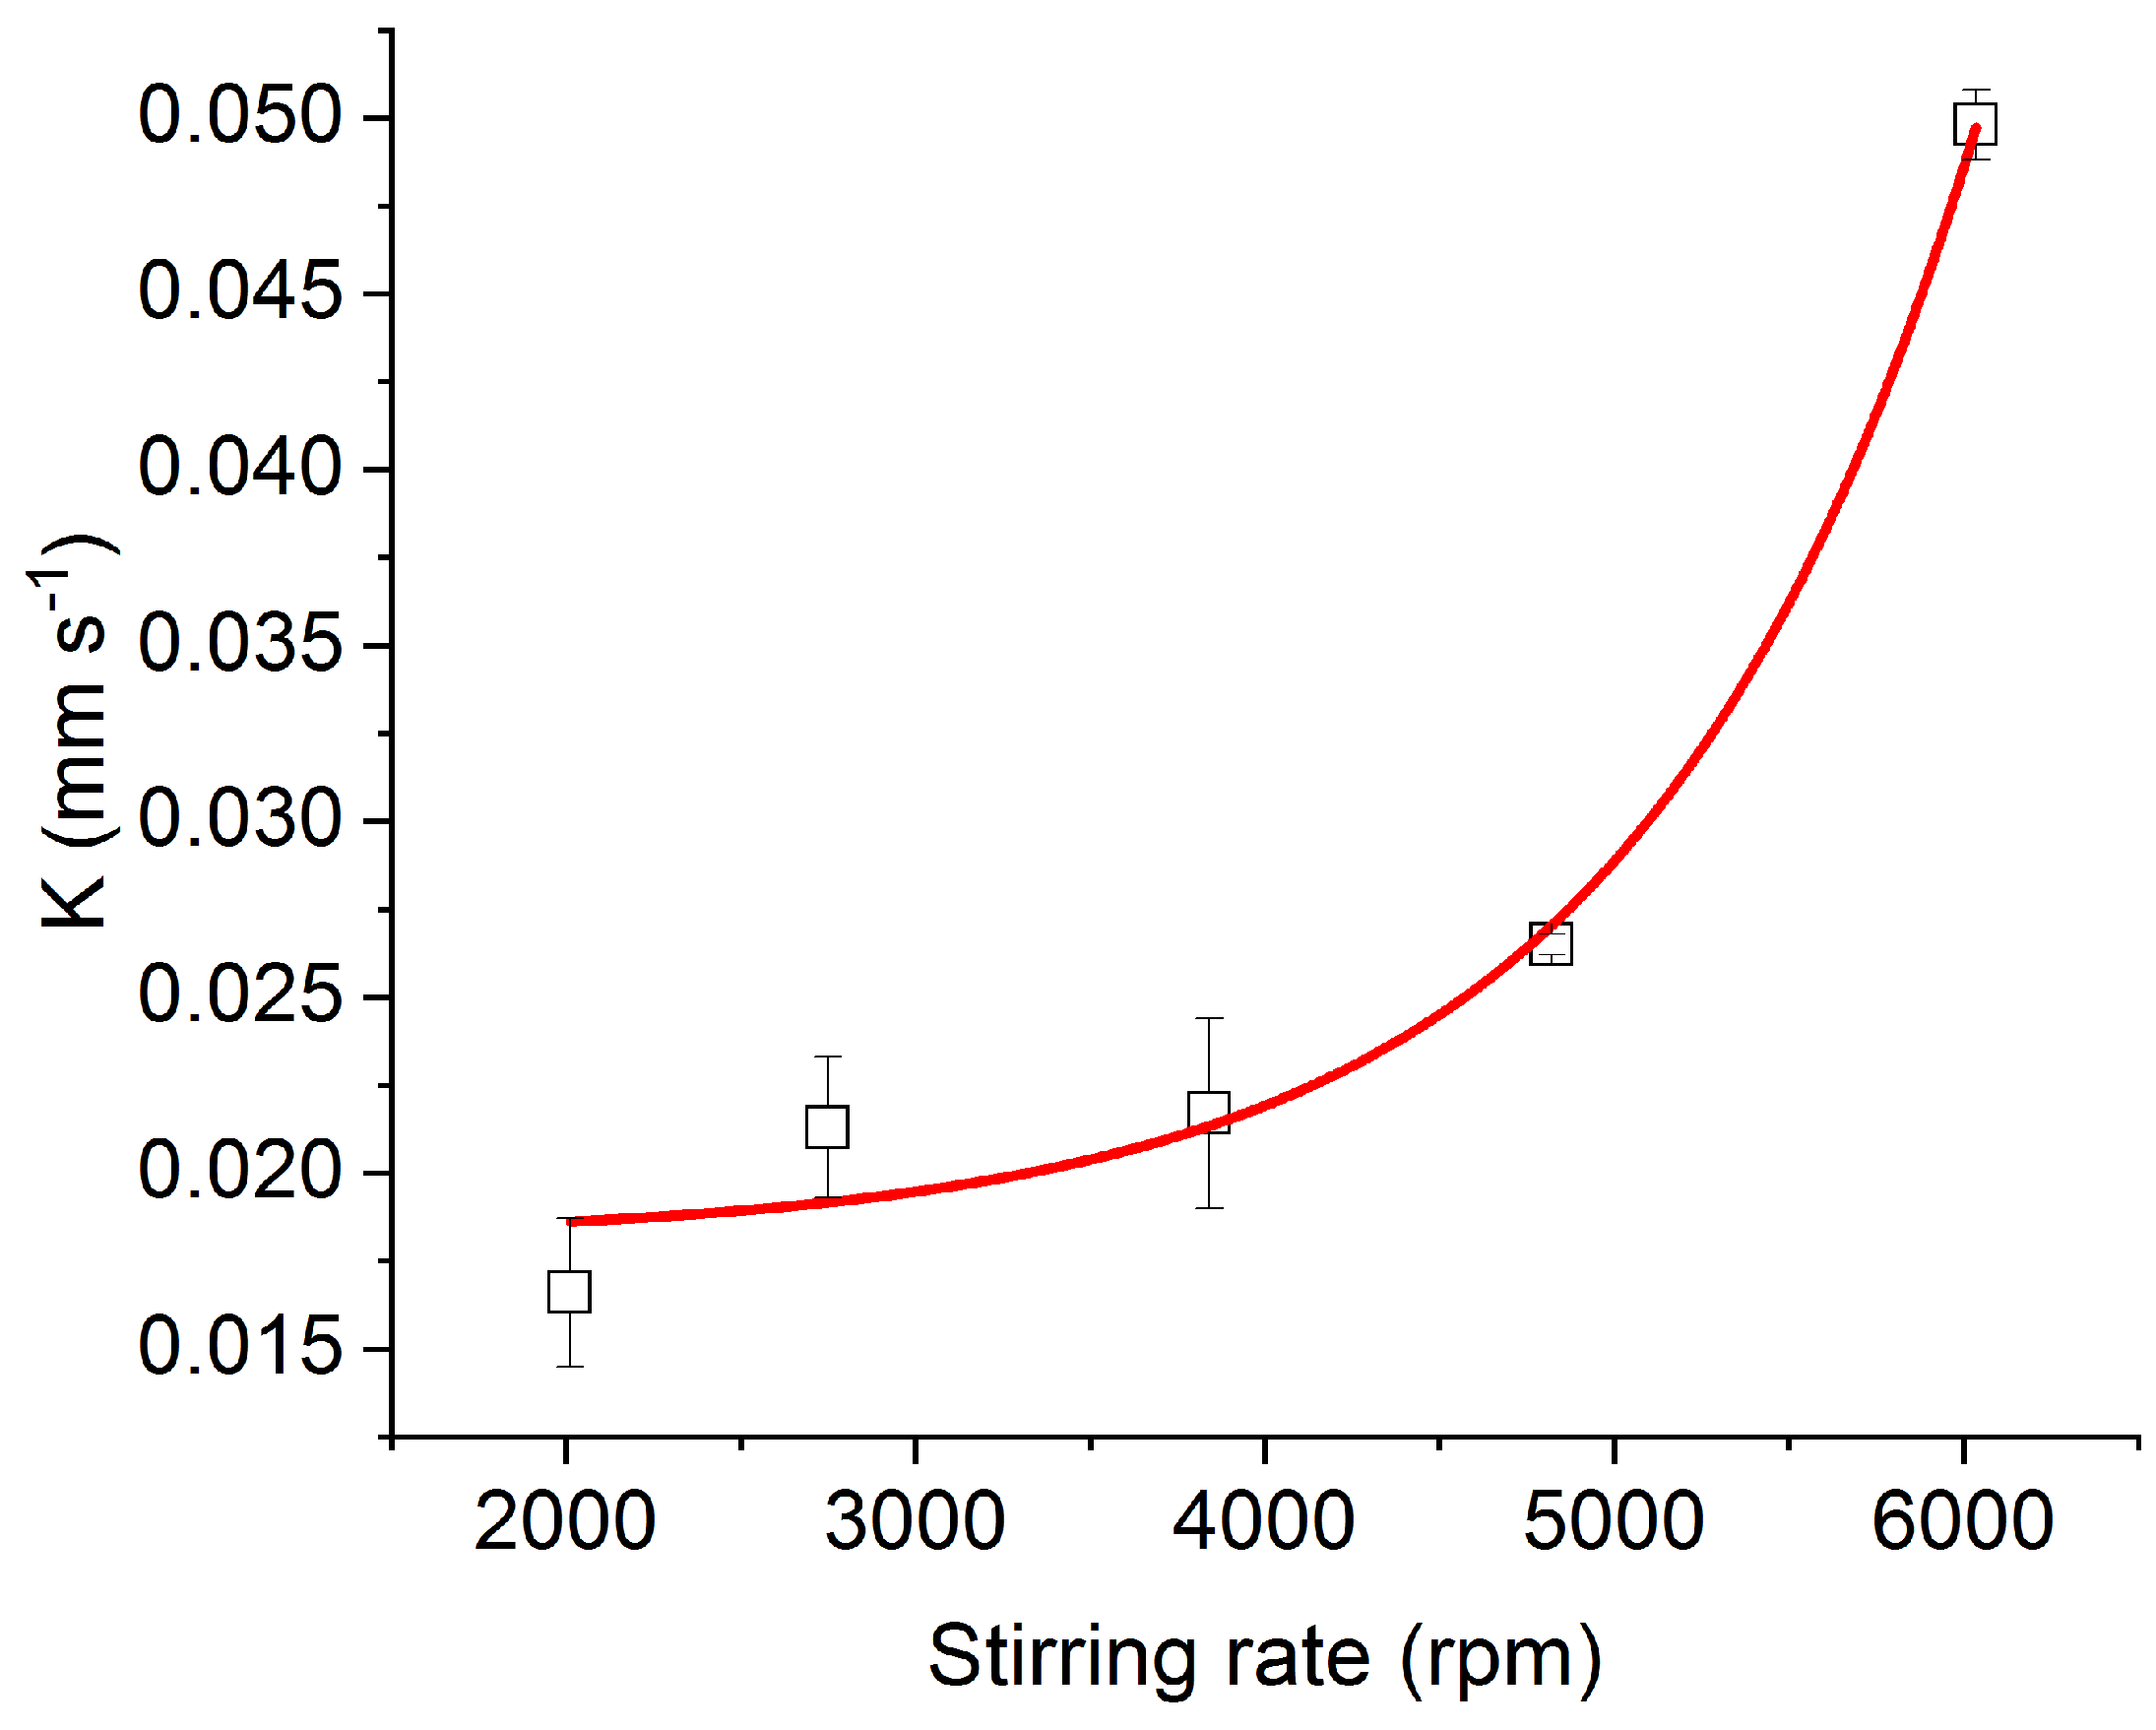
4. Results
5. Conclusions
Author Contributions
Funding
Data Availability Statement
Acknowledgments
Conflicts of Interest
Appendix A. Tables

| Stirring | K | 95% | 95% | ||
|---|---|---|---|---|---|
| (rpm) | (mm s) | CI | (s) | CI | CC |
| 2010 | (1.7 ± 0.2) × 10−2 | 2.06 × 10⁻³ | (6.0 ± 0.2) × 10−5 | 2.12 × 10⁻⁵ | 0.956 |
| 2750 | (2.1 ± 0.2) × 10−2 | 1.96 × 10⁻³ | (6.0 ± 0.1) × 10−5 | 1.56 × 10⁻⁵ | 0.767 |
| 3840 | (2.1 ± 0.2) × 10−2 | 2.68 × 10⁻³ | (9.3 ± 0.1) × 10−5 | 1.02 × 10⁻⁶ | 0.888 |
| 4820 | (2.65 ± 0.03) × 10−2 | 2.94 × 10⁻⁴ | (9.7 ± 0.1) × 10−5 | 1.42 × 10⁻⁶ | 0.922 |
| 6034 | (4.9 ± 0.1) × 10−2 | 9.26 × 10⁻⁴ | (1.1 ± 0.1) × 10−4 | 1.48 × 10⁻⁵ | 0.899 |
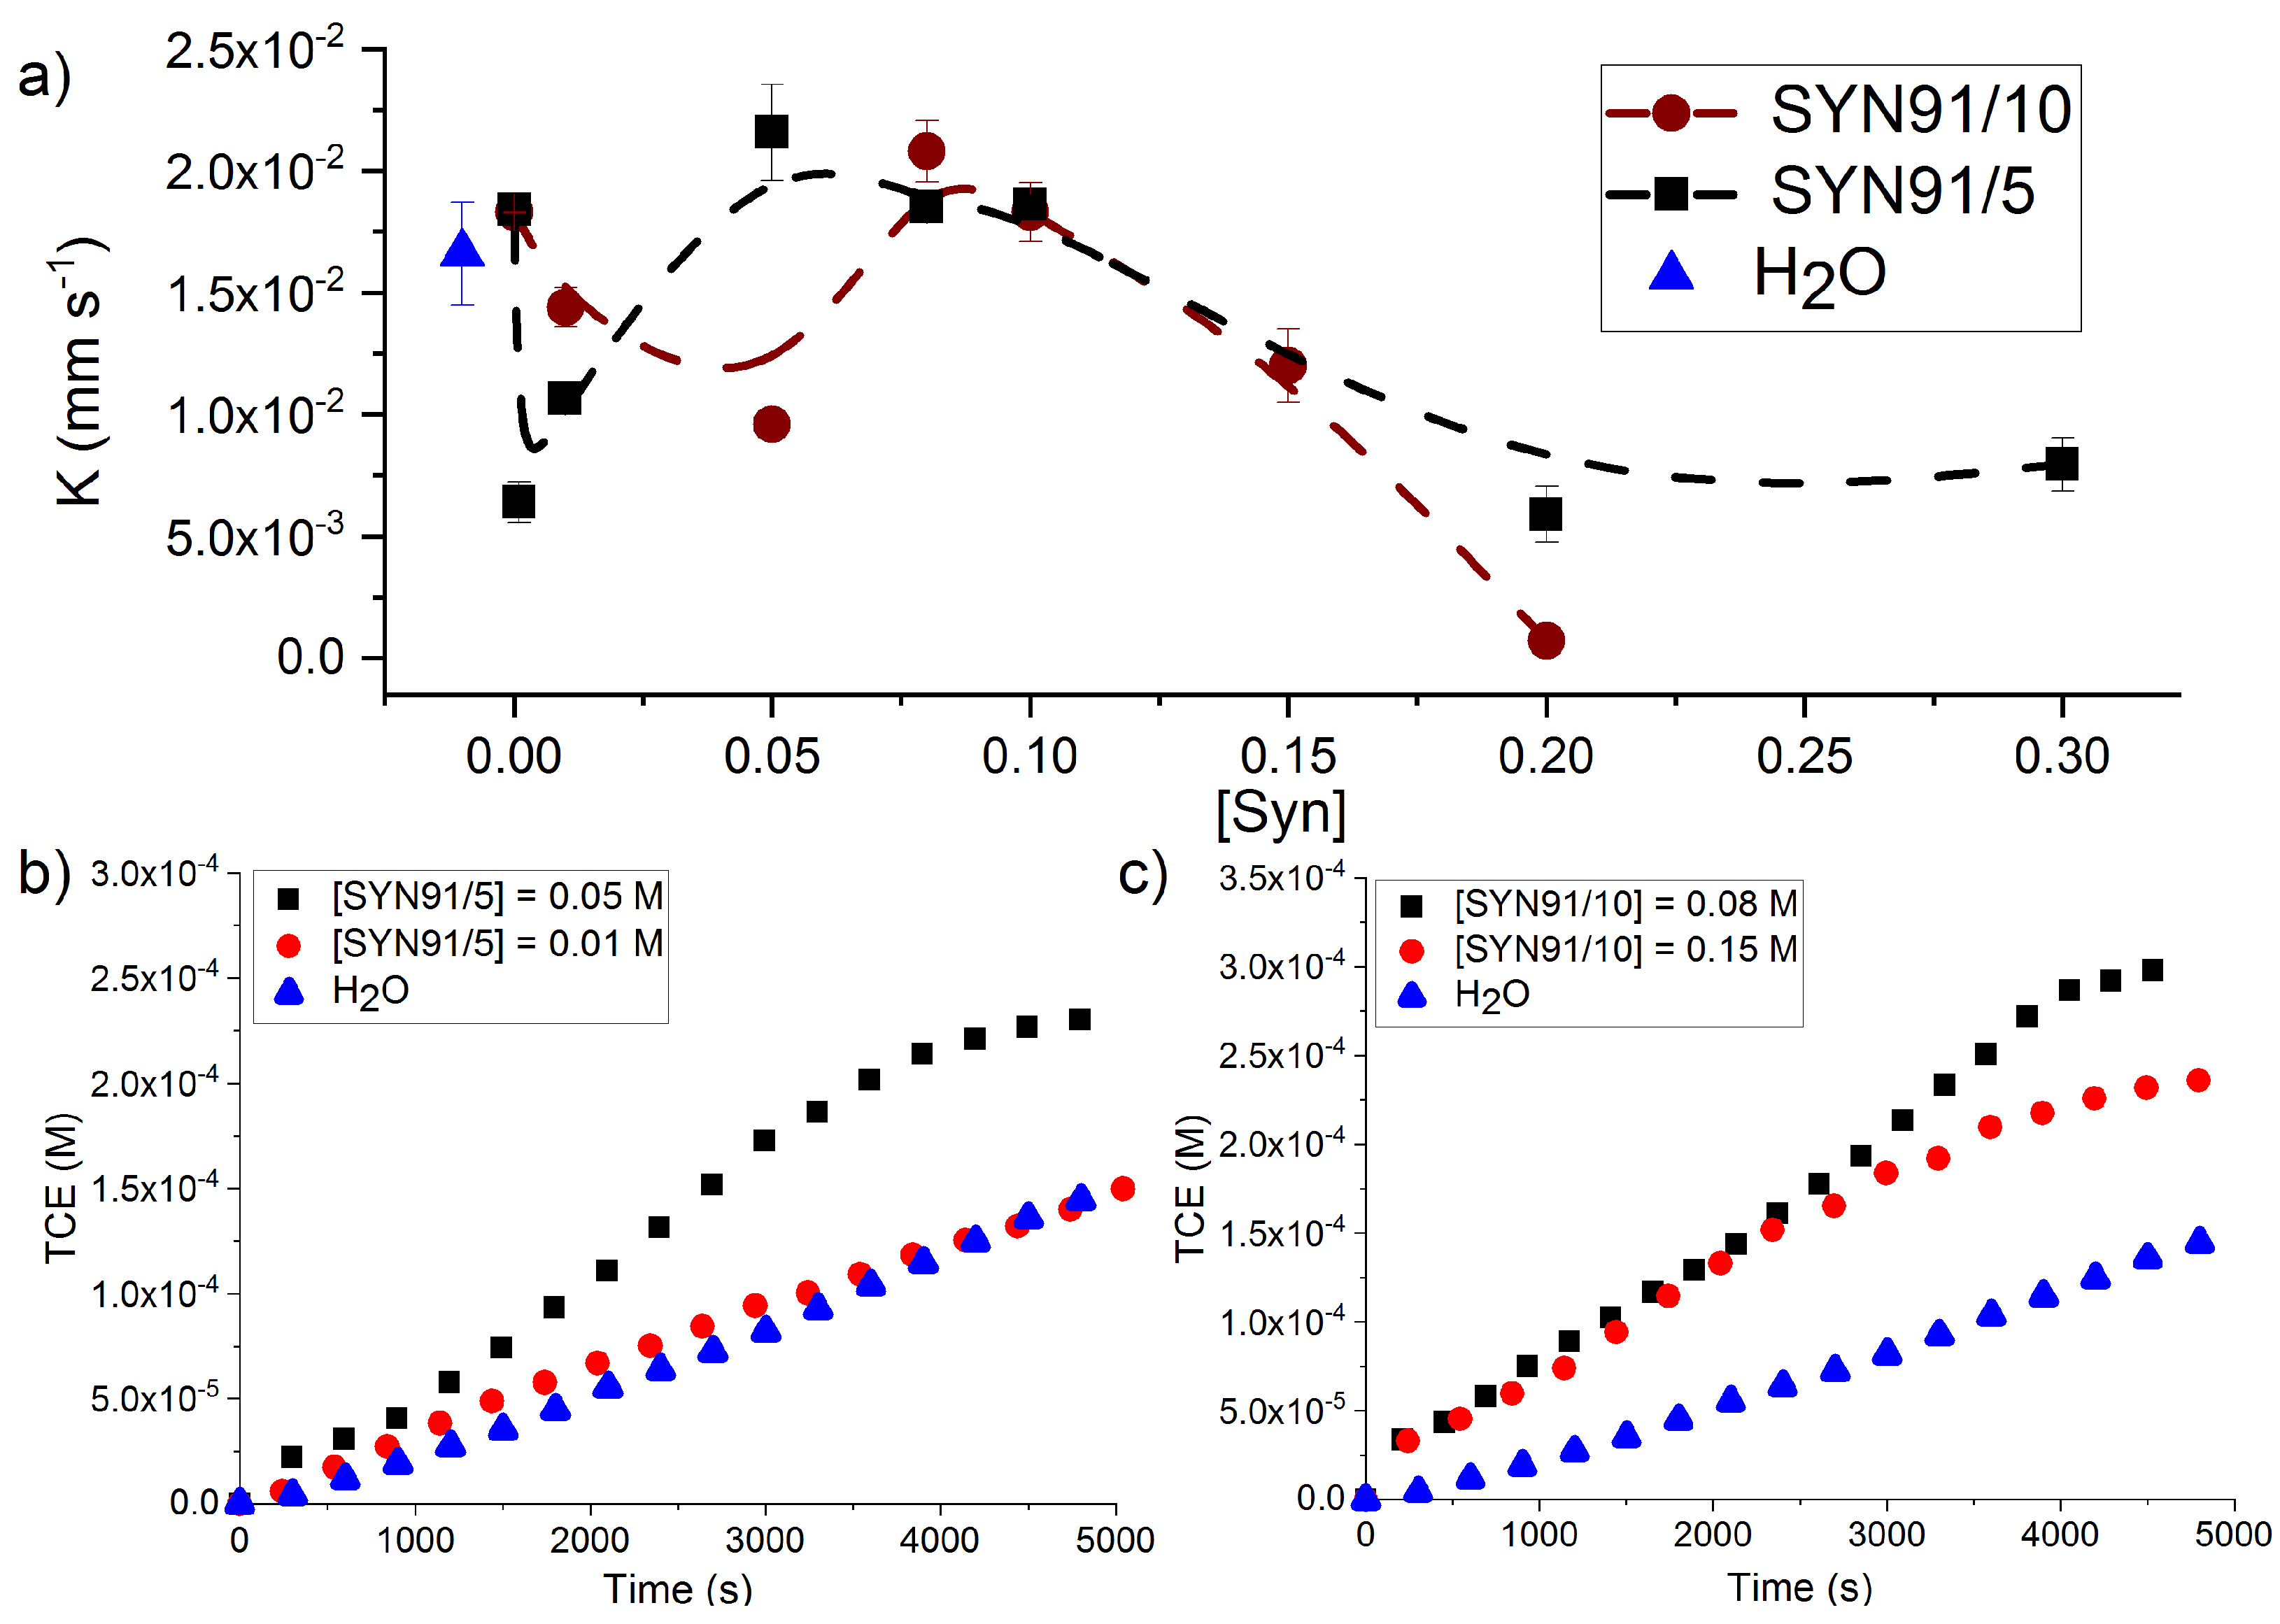
| System | SYN | K | ||||
|---|---|---|---|---|---|---|
| (M) | (mm s) | CI | (s) | CI | CC | |
| H2O | - | (1.7 ± 0.2) × 10−2 | 2.06 × 10⁻³ | (6.0 ± 0.2) × 10−5 | 2.12 × 10⁻⁵ | 0.956 |
| SYN91/5 | 1 × 10⁻⁴ | (1.84 ± 0.03) × 10−2 | 2.99 × 10⁻⁴ | - | - | - |
| 1 × 10⁻³ | (6.4 ± 0.8) × 10−3 | 8.42 × 10⁻⁴ | (2.3 ± 0.1) × 10−4 | 9.8 × 10⁻⁵ | 0.886 | |
| 0.01 | (1.06 ± 0.01) × 10−2 | 8.83 × 10⁻⁵ | (2.9 ± 0.2) × 10−5 | 2.02 × 10⁻⁶ | 0.802 | |
| 0.05 | (2.1 ± 0.1) × 10−2 | 1.98 × 10⁻³ | (7.1 ± 0.8) × 10−5 | 1.37 × 10⁻⁵ | 0.758 | |
| 0.08 | (1.85 ± 0.02) × 10−2 | 2 × 10⁻⁴ | (3.4 ± 0.5) × 10−5 | 8.54 × 10⁻⁶ | 0.952 | |
| 0.10 | (1.86 ± 0.01) × 10−2 | 1.01 × 10⁻⁴ | (2.8 ± 0.2) × 10−4 | 1.96 × 10⁻⁵ | 0.793 | |
| 0.20 | (5.9 ± 0.1) × 10−3 | 1.15 × 10⁻³ | (4.2 ± 0.1) × 10−5 | 1.26 × 10⁻⁵ | 0.897 | |
| 0.30 | (7.9 ± 0.6) × 10−3 | 1.09 × 10⁻³ | (2.4 ± 0.2) × 10−4 | 1.96 × 10⁻⁴ | 0.945 | |
| SYN91/10 | 1 × 10⁻⁴ | (1.83 ± 0.01) × 10−2 | 1.15 × 10⁻⁵ | (4.2 ± 0.1) × 10−5 | 1.25 × 10⁻⁶ | 0.930 |
| 0.01 | (1.44 ± 0.08) × 10−2 | 8.00 × 10⁻⁴ | - | - | - | |
| 0.05 | (9.59 ± 0.02) × 10−3 | 2.00 × 10⁻⁵ | - | - | - | |
| 0.08 | (2.0 ± 0.1) × 10−2 | 1.25 × 10⁻³ | (5.0 ± 0.5) × 10−5 | 5.59 × 10⁻⁶ | 0.717 | |
| 0.10 | (1.8 ± 0.1) × 10−2 | 1.21 × 10⁻³ | - | - | - | |
| 0.15 | (1.20 ± 0.01) × 10−2 | 1.15 × 10⁻³ | (2.5 ± 0.1) × 10−5 | 1.68 × 10⁻⁶ | 0.861 | |
| 0.20 | (7.1 ± 0.2) × 10−4 | 1.75 × 10⁻⁵ | (9.5 ± 0.5) × 10−5 | 3.48 × 10⁻⁶ | 0.916 |
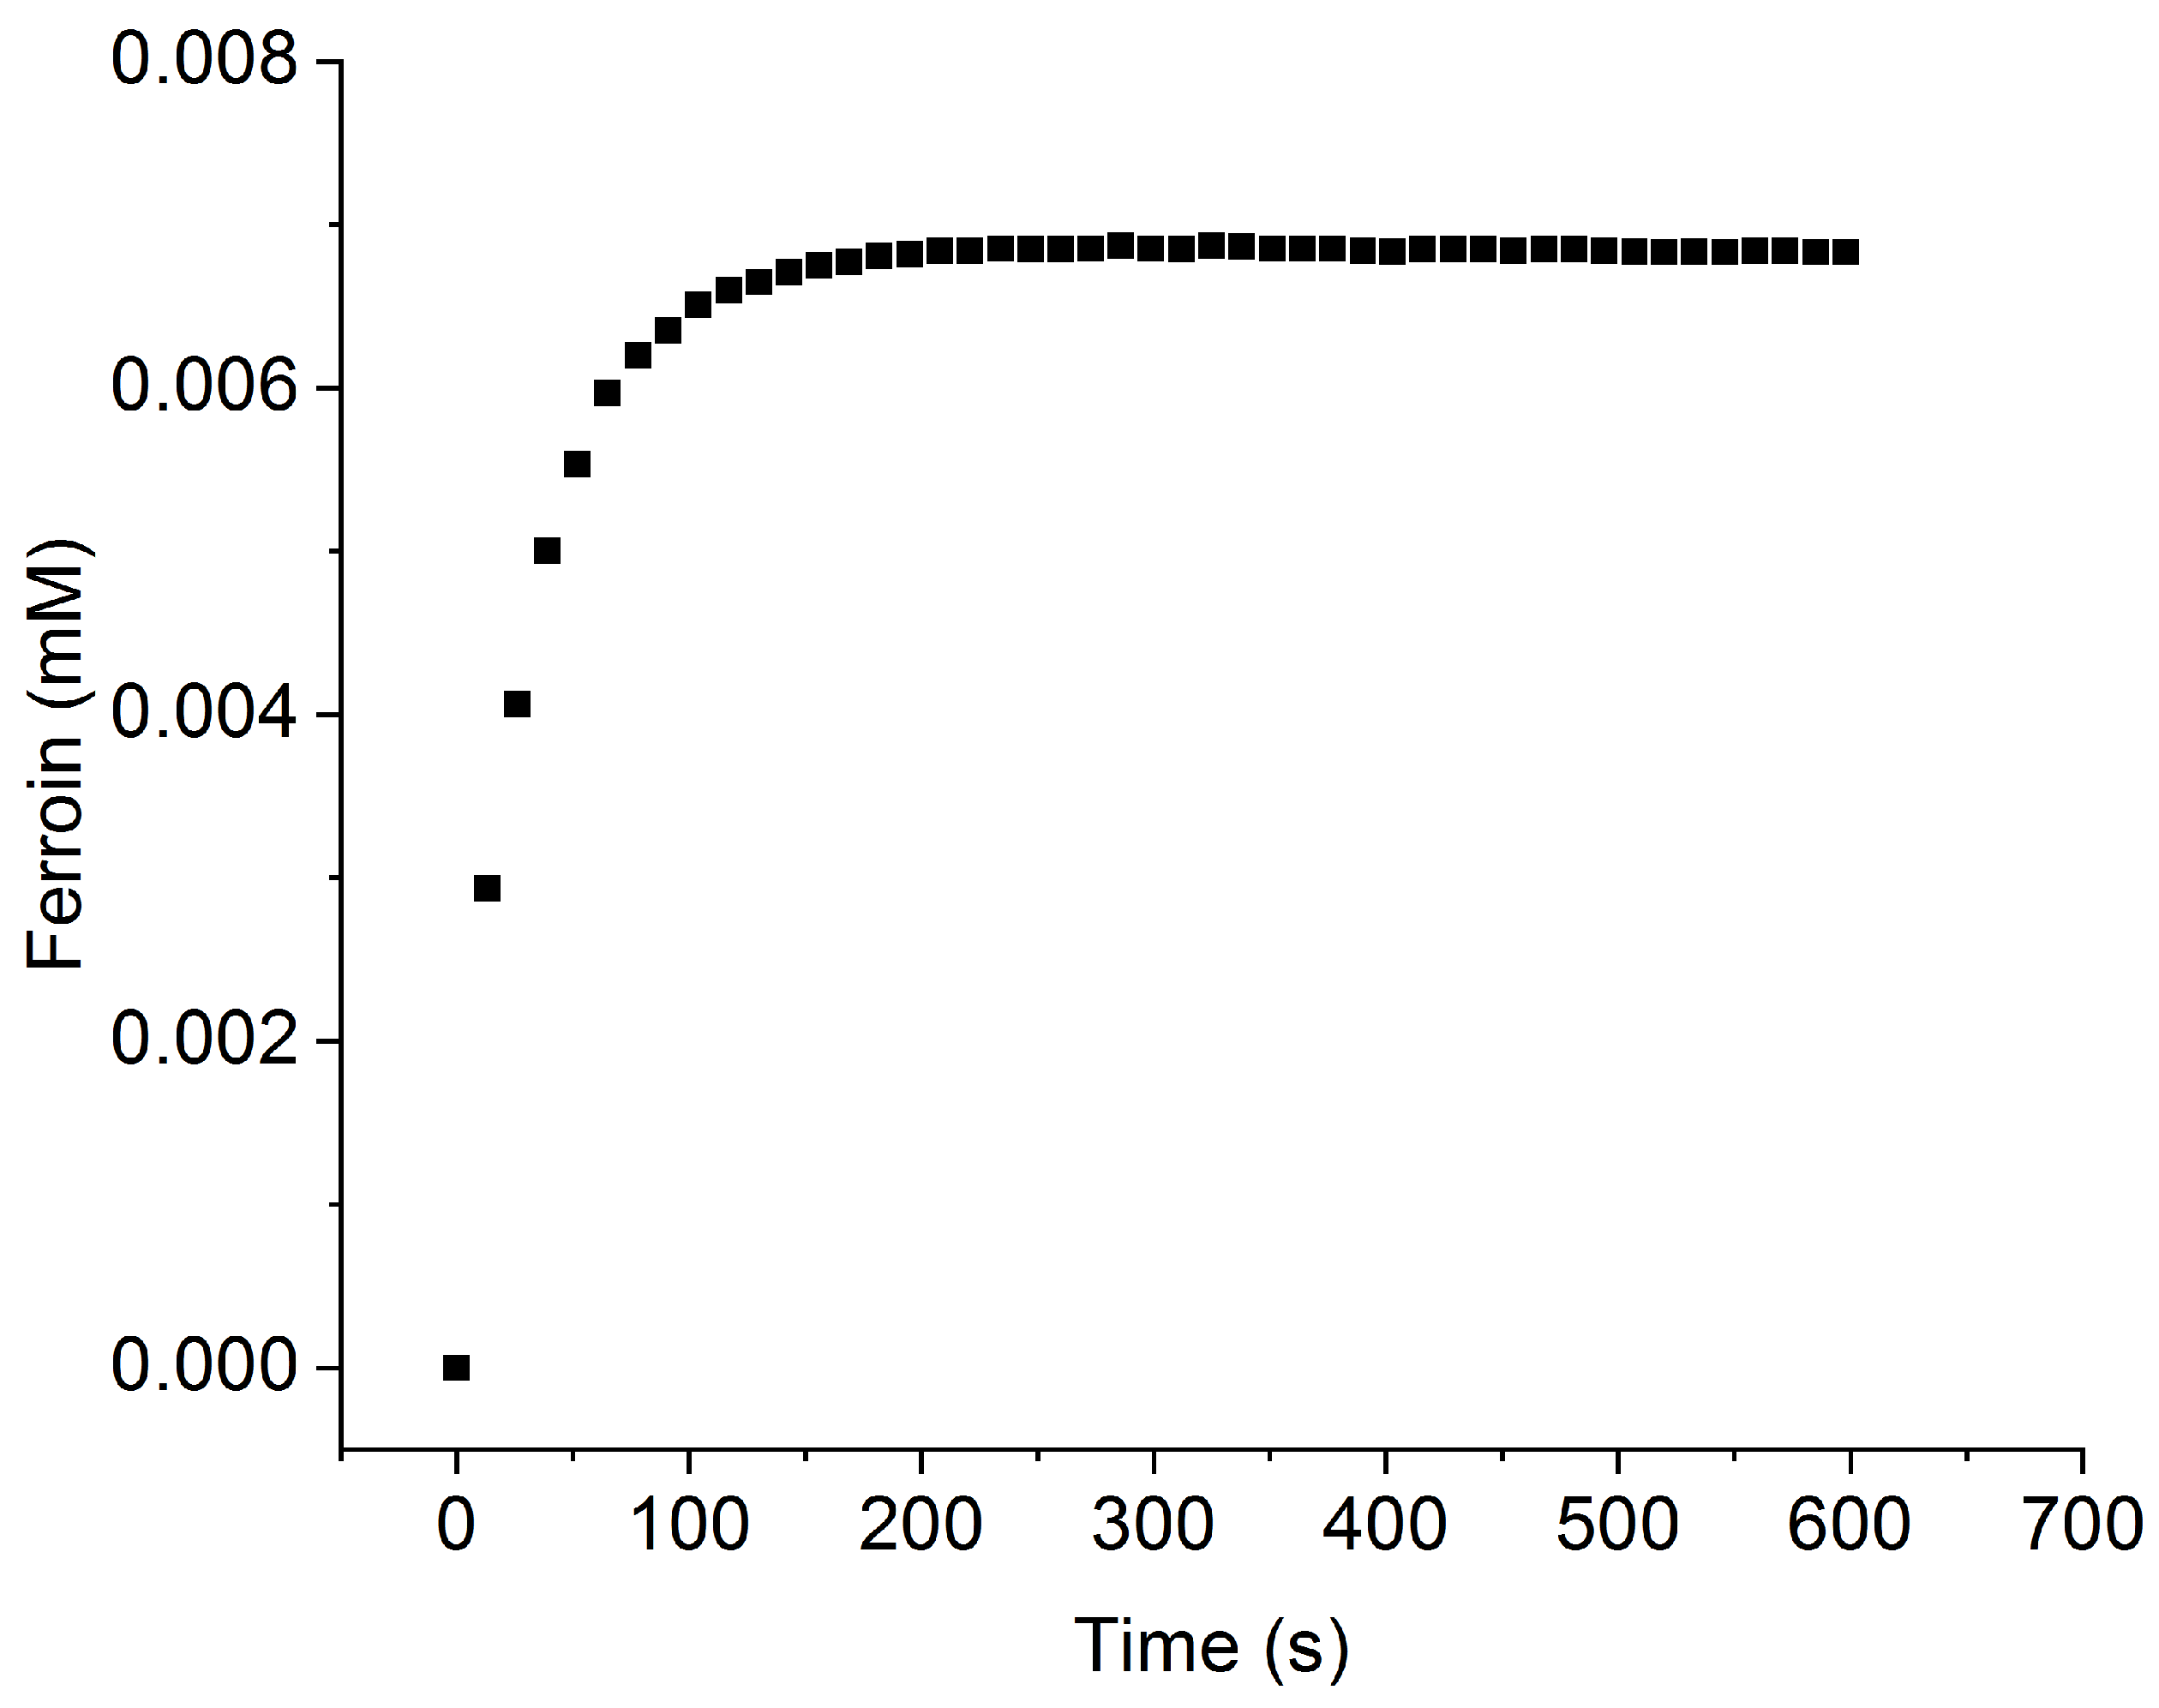
Appendix B. Ferroin Dissolution

References
- Cichocki, J.A.; Guyton, K.Z.; Guha, N.; Chiu, W.A.; Rusyn, I.; Lash, L.H. Target Organ Metabolism, Toxicity, and Mechanisms of Trichloroethylene and Perchloroethylene: Key Similarities, Differences, and Data Gaps. J. Pharmacol. Exp. Ther. 2016, 359, 110–123. [Google Scholar] [CrossRef] [Green Version]
- Schaerlaekens, J.; Vanderborght, J.; Merckx, R.; Feyen, J. Surfactant enhanced solubilization of residual trichloroethene: An experimental and numerical analysis. J. Contam. Hydrol. 2000, 46, 1–16. [Google Scholar] [CrossRef]
- Schwille, F. Dense Chlorinated Solvents in Porous and Fractured Media: Model Experiments; Lewis Publishers: Chelsea, MI, USA, 1988. [Google Scholar]
- Pennell, K.D.; Adinolfi, A.M.; Abriola, L.M.; Diallo, M.S. Solubilization of dodecane, tetrachloroethylene, and 1, 2-dichlorobenzene in micellar solutions of ethoxylated nonionic surfactants. Environ. Sci. Technol. 1997, 31, 1382–1389. [Google Scholar] [CrossRef]
- Rossi, F.; Cucciniello, R.; Intiso, A.; Proto, A.; Motta, O.; Marchettini, N. Determination of the trichloroethylene diffusion coefficient in water. AIChE J. 2015, 61, 3511–3515. [Google Scholar] [CrossRef]
- Mulligan, C.; Yong, R.; Gibbs, B. Surfactant-enhanced remediation of contaminated soil: A review. Eng. Geol. 2001, 60, 371–380. [Google Scholar] [CrossRef]
- Intiso, A.; Miele, Y.; Marchettini, N.; Proto, A.; Sánchez-Domínguez, M.; Rossi, F. Enhanced solubility of trichloroethylene (TCE) by a poly-oxyethylene alcohol as green surfactant. Environ. Technol. Innov. 2018, 12, 72–79. [Google Scholar] [CrossRef]
- Garza-Arévalo, J.I.; Intiso, A.; Proto, A.; Rossi, F.; Sanchez-Dominguez, M. Trichloroethylene solubilization using a series of commercial biodegradable ethoxylated fatty alcohol surfactants. J. Chem. Technol. Biotechnol. 2019, 94, 3523–3529. [Google Scholar] [CrossRef]
- EPA Development Office of Research. In-Situ Chemical Oxidation–Engineering Issue. 2011. Available online: https://cfpub.epa.gov/si/si_public_record_report.cfm?Lab=NRMRL&dirEntryId=156513 (accessed on 7 July 2021).
- Farrell, J.; Kason, M.; Melitas, N.; Li, T. Investigation of the Long-Term Performance of Zero-Valent Iron for Reductive Dechlorination of Trichloroethylene. Environ. Sci. Technol. 2000, 34, 514–521. [Google Scholar] [CrossRef]
- Cucciniello, R.; Intiso, A.; Castiglione, S.; Genga, A.; Proto, A.; Rossi, F. Total oxidation of trichloroethylene over mayenite (Ca12Al14O33) catalyst. Appl. Catal. B Environ. 2017, 204, 167–172. [Google Scholar] [CrossRef]
- Intiso, A.; Martinez-Triguero, J.; Cucciniello, R.; Rossi, F.; Palomares, A.E. Influence of the synthesis method on the catalytic activity of mayenite for the oxidation of gas-phase trichloroethylene. Sci. Rep. 2019, 9, 425. [Google Scholar] [CrossRef] [PubMed] [Green Version]
- Intiso, A.; Martinez-Triguero, J.; Cucciniello, R.; Proto, A.; Palomares, A.E.; Rossi, F. A Novel Synthetic Route to Prepare High Surface Area Mayenite Catalyst for TCE Oxidation. Catalysts 2019, 9, 27. [Google Scholar] [CrossRef] [Green Version]
- Cucciniello, R.; Intiso, A.; Siciliano, T.; Palomares, A.E.; Martínez-Triguero, J.; Cerrillo, J.L.; Proto, A.; Rossi, F. Oxidative Degradation of Trichloroethylene over Fe2O3-doped Mayenite: Chlorine Poisoning Mitigation and Improved Catalytic Performance. Catalysts 2019, 9, 747. [Google Scholar] [CrossRef] [Green Version]
- Paria, S. Surfactant-enhanced remediation of organic contaminated soil and water. Adv. Colloid Interface Sci. 2008, 138, 24–58. [Google Scholar] [CrossRef] [PubMed]
- Lominchar, M.A.; Lorenzo, D.; Romero, A.; Santos, A. Remediation of soil contaminated by PAHs and TPH using alkaline activated persulfate enhanced by surfactant addition at flow conditions. J. Chem. Technol. Biotechnol. 2018, 93, 1270–1278. [Google Scholar] [CrossRef]
- Besha, A.T.; Bekele, D.N.; Naidu, R.; Chadalavada, S. Recent advances in surfactant-enhanced In-Situ Chemical Oxidation for the remediation of non-aqueous phase liquid contaminated soils and aquifers. Environ. Technol. Innov. 2018, 9, 303–322. [Google Scholar] [CrossRef]
- Huo, L.; Liu, G.; Yang, X.; Ahmad, Z.; Zhong, H. Surfactant-enhanced aquifer remediation: Mechanisms, influences, limitations and the countermeasures. Chemosphere 2020, 252, 126620. [Google Scholar] [CrossRef]
- Sun, Y.; Li, M.; Gu, X.; Danish, M.; Shan, A.; Ali, M.; Qiu, Z.; Sui, Q.; Lyu, S. Mechanism of surfactant in trichloroethene degradation in aqueous solution by sodium persulfate activated with chelated-Fe(II). J. Hazard. Mater. 2021, 407, 124814. [Google Scholar] [CrossRef]
- Rossi, F.; Liveri, M.L.T. Chemical self-organization in self-assembling biomimetic systems. Ecol. Model. 2009, 220, 1857–1864. [Google Scholar] [CrossRef]
- Budroni, M.A.; Riolfo, L.A.; Lemaigre, L.; Rossi, F.; Rustici, M.; De Wit, A. Chemical Control of Hydrodynamic Instabilities in Partially Miscible Two-Layer Systems. J. Phys. Chem. Lett. 2014, 5, 875–881. [Google Scholar] [CrossRef] [Green Version]
- Griffiths, R.W. Layered double-diffusive convection in porous media. J. Fluid Mech. 1981, 102, 221–248. [Google Scholar] [CrossRef]
- Budroni, M.; Carballido-Landeira, J.; Intiso, A.; De Wit, A.; Rossi, F. Interfacial hydrodynamic instabilities driven by cross-diffusion in reverse microemulsions. Chaos Interdiscip. J. Nonlinear Sci. 2015, 25, 064502. [Google Scholar] [CrossRef] [PubMed] [Green Version]
- Budroni, M.A.; Lemaigre, L.; De Wit, A.; Rossi, F. Cross-diffusion-induced convective patterns in microemulsion systems. Phys. Chem. Chem. Phys. 2015, 17, 1593–1600. [Google Scholar] [CrossRef] [PubMed] [Green Version]
- Budroni, M.A. Cross-diffusion-driven hydrodynamic instabilities in a double-layer system: General classification and nonlinear simulations. Phys. Rev. E 2015, 92, 063007. [Google Scholar] [CrossRef] [PubMed]
- D’Hernoncourt, J.; Zebib, A.; De Wit, A. On the classification of buoyancy-driven chemo-hydrodynamic instabilities of chemical fronts. Chaos 2007, 17, 013109. [Google Scholar] [CrossRef] [PubMed] [Green Version]
- Budroni, M.A.; De Wit, A. Dissipative structures: From reaction-diffusion to chemo-hydrodynamic patterns. Chaos Interdiscip. J. Nonlinear Sci. 2017, 27, 104617. [Google Scholar] [CrossRef] [PubMed]
- Epstein, P.S.; Plesset, M.S. On the stability of gas bubbles in liquid-gas solutions. J. Chem. Phys. 1950, 18, 1505–1509. [Google Scholar] [CrossRef] [Green Version]
- Duncan, P.B.; Needham, D. Microdroplet Dissolution into a Second-Phase Solvent Using a Micropipet Technique: Test of the Epstein-Plesset Model for an Aniline-Water System. Langmuir 2006, 22, 4190–4197. [Google Scholar] [CrossRef] [PubMed]
- Su, J.T.; Needham, D. Mass Transfer in the Dissolution of a Multicomponent Liquid Droplet in an Immiscible Liquid Environment. Langmuir 2013, 29, 13339–13345. [Google Scholar] [CrossRef] [Green Version]
- Lohse, D.; Zhang, X. Surface nanobubbles and nanodroplets. Rev. Mod. Phys. 2015, 87, 981–1035. [Google Scholar] [CrossRef] [Green Version]
- Zhang, J.M.; Chen, Y.; Lohse, D.; Marin, A. Dissolution of microdroplets in a sparsely miscible liquid confined by leaky walls. J. Fluid Mech. 2021, 912. [Google Scholar] [CrossRef]
- Cussler, E.L. Diffusion: Mass Transfer in Fluid Systems; Cambridge University Press: Cambridge, UK, 2009. [Google Scholar]
- Pant, P.; Allen, M.; Cai, Y.; Jayachandran, K.; Chen, Y. Influence of physical factors on trichloroethylene evaporation from surface water. Water Air Soil Pollut. 2007, 183, 153–163. [Google Scholar] [CrossRef]
- Teng, H.; Yamasaki, A. Dissolution of CO2 droplets in the ocean. Energy 1997, 22, 751–761. [Google Scholar] [CrossRef]
- Collins, T.J. ImageJ for microscopy. Biotechniques 2007, 43, S25–S30. [Google Scholar] [CrossRef] [PubMed]
- Levenberg, K. A method for the solution of certain nonlinear problems in least squares. Q. Appl. Math. 1944, 2, 164–168. [Google Scholar] [CrossRef] [Green Version]
- Marquardt, D.W. An algorithm for least-squares estimation of nonlinear parameters. J. Soc. Ind. Appl. Math. 1963, 11, 431–441. [Google Scholar] [CrossRef]
- Hoops, S.; Sahle, S.; Gauges, R.; Lee, C.; Pahle, J.; Simus, N.; Singhal, M.; Xu, L.; Mendes, P.; Kummer, U. COPASI—A COmplex PAthway SImulator. Bioinformatics 2006, 22, 3067–3074. [Google Scholar] [CrossRef] [Green Version]
- Tomasi, R.; Noel, J.M.; Zenati, A.; Ristori, S.; Rossi, F.; Cabuil, V.; Kanoufi, F.; Abou-Hassan, A. Chemical communication between liposomes encapsulating a chemical oscillatory reaction. Chem. Sci. 2014, 5, 1854–1859. [Google Scholar] [CrossRef]
- Pennell, K.D.; Abriola, L.M.; Weber, W.J., Jr. Surfactant-enhanced solubilization of residual dodecane in soil columns. 1. Experimental investigation. Environ. Sci. Technol. 1993, 27, 2332–2340. [Google Scholar] [CrossRef]
- Grimberg, S.J.; Nagel, J.; Aitken, M.D. Kinetics of phenanthrene dissolution into water in the presence of nonionic surfactants. Environ. Sci. Technol. 1995, 29, 1480–1487. [Google Scholar] [CrossRef]
- Johnson, J.C. Mass Transfer in Porous Media: The Effect of Surfactants on the Mass Transfer Rate Coefficient. Ph.D. Thesis, Princeton University, Princeton, NJ, USA, 1998. [Google Scholar]
- Bolsman, T.; Veltmaat, F.; Van Os, N. The effect of surfactant structure on the rate of oil solubilization into aqueous surfactant solutions. J. Am. Oil Chem. Soc. 1988, 65, 280–283. [Google Scholar] [CrossRef]
- Falsini, S.; Intiso, A.; Spinozzi, F.; Ristori, S.; Marchettini, N.; Garza-Arévalo, J.I.; Sanchez-Dominguez, M.; Rossi, F. Poly-Oxyethylene Alcohol as Green Surfactant for VOCs Remediation: Physico-Chemical Characterization. 2020; submitted. [Google Scholar]
- Urynowicz, M.A.; Siegrist, R.L. Interphase mass transfer during chemical oxidation of TCE DNAPL in an aqueous system. J. Contam. Hydrol. 2005, 80, 93–106. [Google Scholar] [CrossRef] [PubMed]
- Cohen, Y.; Ryan, P.A. Multimedia modeling of environmental transport: Trichloroethylene test case. Environ. Sci. Technol. 1985, 19, 412–417. [Google Scholar] [CrossRef] [PubMed]


| System | SYN (M) | (M) |
|---|---|---|
| H2O | - | (9.74 ± 0.03) × 10−3 |
| SYN91/5 [7,8] | 1 × 10⁻⁴ | (9.74 ± 0.05) × 10−3 |
| 1 × 10⁻³ | 0.020 ± 0.001 | |
| 0.01 | 0.022 ± 0.002 | |
| 0.05 | 0.022 ± 0.001 | |
| 0.08 | 0.022 ± 0.003 | |
| 0.10 | 0.022 ± 0.003 | |
| 0.20 | 0.047 ± 0.002 | |
| 0.30 | 0.067 ± 0.002 | |
| SYN91/10 [8] | 1 × 10⁻⁴ | (9.74 ± 0.04) × 10−3 |
| 0.01 | 0.04 ± 0.03 | |
| 0.05 | 0.15 ± 0.01 | |
| 0.08 | 0.26 ± 0.01 | |
| 0.10 | 0.33 ± 0.02 | |
| 0.15 | 0.45 ± 0.01 | |
| 0.20 | 0.64 ± 0.04 |
Publisher’s Note: MDPI stays neutral with regard to jurisdictional claims in published maps and institutional affiliations. |
© 2021 by the authors. Licensee MDPI, Basel, Switzerland. This article is an open access article distributed under the terms and conditions of the Creative Commons Attribution (CC BY) license (https://creativecommons.org/licenses/by/4.0/).
Share and Cite
Valletti, N.; Budroni, M.A.; Lagzi, I.; Marchettini, N.; Sanchez-Dominguez, M.; Rossi, F. Interfacial Mass Transfer in Trichloroethylene/Surfactants/ Water Systems: Implications for Remediation Strategies. Reactions 2021, 2, 312-322. https://doi.org/10.3390/reactions2030020
Valletti N, Budroni MA, Lagzi I, Marchettini N, Sanchez-Dominguez M, Rossi F. Interfacial Mass Transfer in Trichloroethylene/Surfactants/ Water Systems: Implications for Remediation Strategies. Reactions. 2021; 2(3):312-322. https://doi.org/10.3390/reactions2030020
Chicago/Turabian StyleValletti, Nadia, Marcello A. Budroni, Istvan Lagzi, Nadia Marchettini, Margarita Sanchez-Dominguez, and Federico Rossi. 2021. "Interfacial Mass Transfer in Trichloroethylene/Surfactants/ Water Systems: Implications for Remediation Strategies" Reactions 2, no. 3: 312-322. https://doi.org/10.3390/reactions2030020