Article

Modern Floating Greenhouses: Planting Gray Oyster Mushrooms with Advanced Management Technology Including Mobile Phone Algorithms and Arduino Remote Control

by
Grianggai Samseemoung
1,*,
Phongsuk Ampha
2,
Niti Witthayawiroj
3,
Supakit Sayasoonthorn
4 and
Theerapat Juey
1
1
Department of Agricultural Engineering, Faculty of Engineering, Rajamangala University of Technology Thanyaburi, Thanyabur 12110, Thailand
2
Department of Electronics and Telecommunication Engineering, Faculty of Engineering, Rajamangala University of Technology Thanyaburi, Thanyabur 12110, Thailand
3
Department of Mathematics and Computer Science, Faculty of Science and Technology, Rajamangala University of Technology Thanyaburi, Thanyabur 12110, Thailand
4
Department of Farm Mechanics, Faculty of Agriculture, Kasetsart University, Bangkok 10900, Thailand
*
Author to whom correspondence should be addressed.
AgriEngineering 2024, 6(2), 1055-1077; https://doi.org/10.3390/agriengineering6020061
Submission received: 12 March 2024 / Revised: 11 April 2024 / Accepted: 11 April 2024 / Published: 19 April 2024
(This article belongs to the Section Sensors Technology and Precision Agriculture)

Abstract

:
A floating greenhouse for growing oyster mushrooms can be operated remotely via a mobile phone. This innovative system can enhance mushroom production and quality while saving time. By using the Android OS operating system on a mobile phone (Internet Mobile Device with Android OS, MGT Model: T10), users can adjust the humidity and temperature within the greenhouse. This approach is particularly beneficial for older adults. Create a smart floating greenhouse that can be controlled remotely to cultivate oyster mushrooms. It would help to enhance the quality of the mushrooms, reduce the time required for cultivation, and increase the yield per planting area. We carefully examined the specifications and proceeded to create a greenhouse that could float. In addition, we have developed a unit that could control temperature and humidity, a solar cell unit, and a rack for growing mushrooms. Our greenhouses were operated remotely. To determine the best conditions for growing plants in a floating greenhouse, we conducted a test to measure temperature and humidity. We then compared our findings to those of a traditional greenhouse test and determined the optimal parameters for floating greenhouse growth. These parameters include growth time, temperature, humidity, and weight. A mushroom nursery that can be controlled remotely and floats on water consists of four main components: a structure to regulate temperature and humidity, solar cells, and mushroom racks. Research shows that mushrooms grown under this automated control system grow better than those grown through traditional methods. The harvest period is shorter, and the yield is higher than the typical yield of 1.81–1.22. When considering the construction and use of remote-controlled floating mushroom nurseries, the daily weight of mushrooms accounted for 20.22%. The company’s investment return rates were found to be 3.47 years, or 580.21 h per year, which is higher than the yield of traditional methods. This mobile phone remote control system, created by Arduino, is tailor-made for cutting-edge floating greenhouses that grow grey oyster mushrooms. It can be operated with ease via mobile devices and is especially user-friendly for elderly individuals. This system enables farmers to produce a high volume of quality breeds. Furthermore, those with fish ponds can utilize the system to increase their profits.

1. Introduction

Oyster mushrooms are a type of mushroom that only grows during certain times of the year when demand for them is high. Thailand has the potential to increase its mushroom production every year. Although most of the mushrooms are consumed domestically, a few are exported to foreign markets. The Thai Mushroom Research and Cultivation Association predicts that 20 million bottles of mushrooms will be produced, resulting in approximately 150,000 tons, or USD 257.78 worth of fresh mushrooms. Thailand is one of the countries in the world with the potential to produce mushrooms [1]. This has led to the development of commercial mushroom cultivation, including floating mushroom greenhouses. To successfully grow oyster mushrooms, it is important to understand the ideal conditions for their growth, including air temperature, humidity, and lighting [2,3]. Providing these conditions is crucial for achieving high yields and quality mushrooms. As oyster mushrooms are in high demand and command a high price, many growers are interested in maximizing their yields by cultivating them into flowers.
Nowadays, there are still problems for people who want to grow mushrooms, but there is a lack of land for mushroom cultivation, such as ponds, fishponds, etc., to increase income for farmers and use the land to their benefit [4,5]. Therefore, the research group has come up with a design for a remote-controlled floating mushroom greenhouse [6,7,8]. It can help increase the efficiency of controlling the temperature and humidity to be most suitable for growth. Growing mushrooms in a floating greenhouse offers numerous advantages, including a consistent and high yield and the use of low-cost materials. These materials are often surplus from agriculture and industry, such as soybean and peanut soil, cotton wax, soft fillers, and water hyacinth. Furthermore, this technique allows for year-round growth and can be implemented in a limited space. After harvesting crops and removing old fertilizers, mushrooms can be re-planted in the same spot. It is feasible to plant twice a month, but there are some drawbacks. The initial investment is substantial, as a floating house and steam generator are required, along with other equipment. Additionally, there are several planting steps, and new agricultural knowledge may be necessary to address diseases and ensure proper growth [9,10,11]. The food used for growing mushrooms must meet the specific demands of straw mushrooms. Those interested in cultivating this sort of mushroom should be prepared for these challenges.
A smart greenhouse is a concept that helps modify and reorient agricultural systems to support their growth and ensure food security in a changing climate. It is a method that guides the activities that need to be done to alter and sustain the environment [12,13]. The policy aims to achieve three key goals: a sustainable increase in agricultural production, building resilience to climate change, and reducing and eliminating greenhouse gas emissions wherever possible. Nowadays, one of the most important uses of the Internet of Things is in the field of intelligent agriculture [14,15]. IoT agriculture systems are used in various fields, including precision agriculture, and intelligent farming. The use of precision agriculture and smart farming techniques can make agriculture more efficient and promote intelligent crop production [16,17]. The parameters monitored by intelligent agricultural systems vary among studies, but most efforts involve the use of sensors to monitor temperature, humidity, soil moisture, and light intensity. Soil temperature significantly affects crop yield [18,19].
This research aims to investigate the fundamentals of cultivating oyster mushrooms in floating greenhouses. Following this, we will design and construct a floating greenhouse with a remote-control system that can be operated using a mobile phone and an Arduino. Finally, we will conduct tests to determine the ideal temperature and humidity levels for the growth of oyster mushrooms in comparison to traditional mushroom cultivation methods. The floating greenhouse tests will analyze variables such as growth time, temperature, humidity, and weight to determine ideal growing conditions for produce.

2. Materials and Methods

After studying important information related to greenhouse design, a floating grey oyster mushroom greenhouse was designed to test and evaluate the appropriate temperature and humidity for the growth of grey oyster mushrooms, the growth period, and mushroom weight. The design criteria and specifications are as follows: (1) The sensor control system should exhibit a high degree of user-friendliness while minimizing complexity. It should facilitate sensor-based control and allow remote operation via mobile devices; (2) The greenhouse should be easy to maintain, ensuring straightforward service and upkeep; (3) It should offer operational convenience and safety. (4) The greenhouse should be operable by a single operator and be primarily constructed from domestically available materials; and (5) The design should incorporate various standardized equipment components. In the event of damage or component malfunction, these parts must be readily removable and replaceable, with wide availability within the market.

2.1. Method for Designing and Constructing a Modern Floating Grey Oyster Mushroom Greenhouse

A floating grey oyster mushroom greenhouse is designed to have 6 main components: a base structure, a control cabinet set, a fan, a sprinkler system, mushroom shelves, and a solar cell system set, as presented in Figure 1. The design methodology involves the collection of information according to sections, which includes the integration of knowledge and engineering principles into the design of a floating grey oyster mushroom greenhouse. The design details are as follows:
  • The structure is made from 2 × 2-inch square steel pipe, which is bent and welded to create dimensions of 200 cm in width, 560 cm in length, and a height of 230 cm. Its purpose is to serve as a mounting frame for use with canvas, a shading net, and a smart board to attach to the floor, as depicted in the figure below.
  • The mushroom shelves are crafted from 1-inch square steel pipe, which is cut and welded to achieve dimensions of 150 cm in width, 197 cm in length, and 150 cm in height. Its purpose is to provide support for the placement of mushroom spawn.
  • The control cabinet measures 11 cm in width, 20 cm in length, and 30 cm in height. Its primary function is to control operations and process values received from sensors. It operates within a relay set that serves as a switch for turning water pumps and fans on and off.
  • The ventilation fan is 8 inches in size. Its role is to lower the temperature inside the greenhouse by circulating the air. Installing fans also aids in the movement of carbon dioxide within the greenhouse, thus promoting better nutrient synthesis.
When analyzing the buoyant force, it becomes apparent that the most crucial aspect of designing a floating greenhouse is determining the number of tanks required to support the total weight of the greenhouse and all its equipment. The total number of tanks needed can be calculated by considering factors that affect the buoyant force, such as the density of the fluid (), the volume of the object submerged in the fluid (Vfloating greenhouse), and gravity (g). Therefore, the equation for the buoyant force acting on a floating greenhouse can be expressed as follows:
F B = ρ w a t e r · V f l o a t i n g   g r e e n h o u s e · g
In the figure provided below, it is focused solely on the floating greenhouse when it remains in a stationary position without any movement. Consequently, the net vertical force acting on the floating greenhouse should equal to zero, aligning with Newton’s 1st law of motion.
Σ F = 0
F B m g = 0
From Equation (1),
ρ w a t e r · V f l o a t i n g   g r e e n h o u s e · g = m f l o a t i n g   g r e e n h o u s e · g
where m = ρ V
ρ w a t e r · V s i n k = ρ f l o a t i n g   g r e e n h o u s e · V f l o a t i n g   g r e e n h o u s e
Substitute the variable from the figure below,
ρ w a t e r · Y = ρ f l o a t i n g   g r e e n h o u s e · ( X + Y )
where FB is Buoyant force (N), is water density (kg/m3), is total volume of the greenhouse (m3), X is floating volume of the greenhouse (m3), and Y is submerged volume of the greenhouse (m3), as presented in Figure 2.

2.2. Method for Designing and Acquiring Image Data of a Remote-Control Mobile Phone

The research involved data collection from a greenhouse imaging system controlled by 2 wireless webcams (Vimicro USB 2.0 UVC PC Camera, Swift-Tech Electronics Co., Ltd., Shenzhen, China). Following this, a precise water spraying system was constructed. The spraying rate is adjusted in direct proportion to the growth rate of the mushrooms, a parameter that is analyzed through the utilization of an image processing algorithm. This algorithm is designed based on the ratio of mushroom density in terms of pixel area (pixel by pixel). The Digital Number (DN) values that are being obtained will be used to calibrate the delay setting for the solenoid valve device (Green Water Atlantis Technology (Thailand) Co., Ltd., Bangkok, Thailand), electric pump (Lee Sae Import (1975) Ltd., series, Bangkok, Thailand), and microcontroller board (Shenzhen Shanhai Technology Ltd. and Arduitronics Co., Ltd., Bangkok, Thailand), respectively. The pump motor’s operations are connected to a remote-control mobile phone, enabling remote control of its function. This allows for monitoring the growth rate from anywhere.

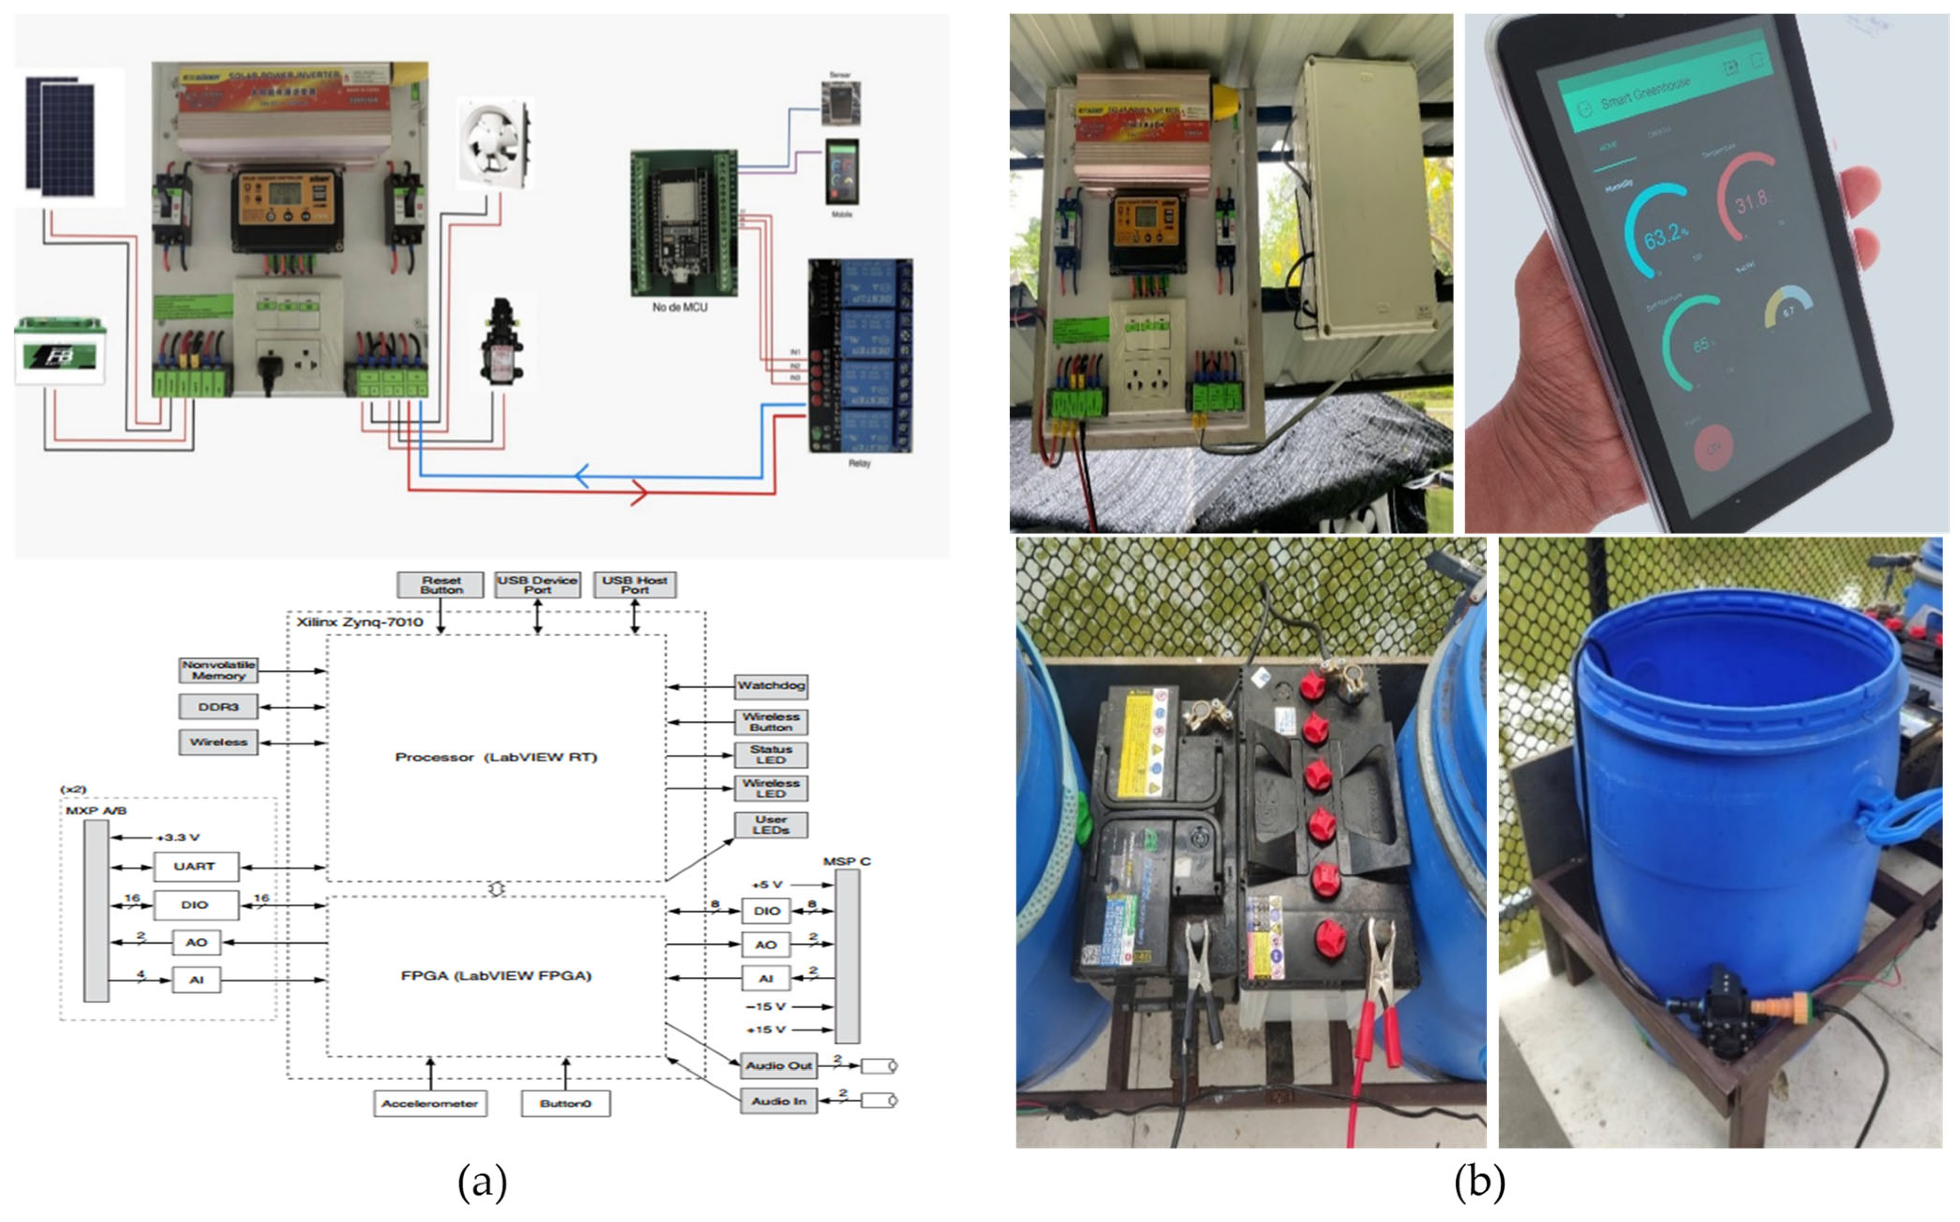
2.3. Method for Designing and Acquiring of Temperature and Humidity Control System

Design and construct a temperature control system with automatic humidification powered by solar energy. It activates when the temperature reaches 30 °C. The sensor device reports the temperature to the Module Development Board, which, in turn, triggers the Relay Module device to activate the water pump and the ventilation fan installed at the rear of the greenhouse. This action aimed to reduce the temperature and increase the humidity inside the greenhouse. When the temperature drops to 27 °C, the Relay Module will instruct the water pump to deactivate and the fan to provide immediate ventilation. Installation details and device specifications refer to the following information: 2 sets of solar panels CanadianSolar (295 Watt, Thaisolarsystem, www.thaisolarsystem.com, Nonthaburi, Thailand), inverter set (SEOUR 24 V 3000 W; Green Water Atlantis Technology (Thailand) Co., Ltd., Bangkok, Thailand), solar charger (PWM 30 A SUOER (ST-S1230), Thaisolarsystem, www.thaisolarsystem.com, Nonthaburi, Thailand), 2 batteries (12 V 80 A, Global House Public Co. Ltd., Roy-ed, Thailand), 2 sets of 6-slot 25 A terminal blocks (Green Water Atlantis Technology (Thailand) Co., Ltd., Pathum Wan, Bangkok, Thailand), WiFi Bluetooth Module Development Board for HW-463 ESP32 (Swift-Tech Electronics Co., Ltd., Shenzhen, China), switch equipment (Green Water Atlantis Technology (Thailand) Co., Ltd., Bangkok, Thailand), Relay Module 5 V 4 Channel (Green Water Atlantis Technology (Thailand) Co., Ltd., Bangkok, Thailand), humidity sensor (SparkFun Humidity Sensor, HIH-4030, analog output, power supply: 4.0 VDC–5.5 VDC, SparkFun Electronics, Niwot, CO, USA), temperature sensor (the Maxim Waterproof DS18B20 Sensor, Mouser Electronics, Inc., Bangkok, Thailand), two 8-inch fans (B BOSS; Green Water Atlantis Technology (Thailand) Co., Ltd., Bangkok, Thailand), and a mist spraying set (10 bar pump; Green Water Atlantis Technology (Thailand) Co., Ltd., Bangkok, Thailand).

2.4. An Image Processing Algorithm Created

Through research and information collection regarding the algorithm for processing grey oyster mushroom images, the system-specific command set, and the programming language employed in this algorithm for code writing, it has become evident that this algorithm is well-suited for the technique used to separate objects from the background. The command set was created by downloading image data from 2 wireless webcams installed along the length of the mushroom table, with a 5 m distance between the cameras. Users have the capability to select image data on a remote-control mobile phone for detecting the density and growth rate of the mushrooms. The image was divided into 4 parts (4 sub-images) and then processed by detecting the size of the surrounding borders of the grey oyster mushroom. This analysis aims to calculate the percentage of mushroom density within the planting area. The program will display the information regarding the detected border area in real-time through a window, allowing the system to stay updated with the ongoing process. Subsequently, research was conducted by modifying the color images into black and white images and adjusting the time spent in the spraying area to match the target location, corresponding to the percentage of mushroom density per unit area. The developed system utilizes a solenoid valve for controlling the opening and closing of the nozzle. The final image, which records the processed actions, is stored in the hard disk memory in both grayscale and bimodal formats.

2.5. Temperature Sensor Assemble

In the process of selecting temperature sensor equipment, one highly favored option is the Maxim Waterproof DS18B20 Sensor, Mouser Electronics, Inc., Bangkok, Thailand. This sensor operates as an analog device, producing an output voltage ranging from 3.0 V to 5.5 V. This voltage output is then interpreted to obtain temperature values in Celsius. This sensor device is known for its affordability and versatility. It offers a wide temperature detection range, spanning from −55 to 125 °C. Moreover, the Maxim Waterproof DS18B20 Sensor, Thief River Falls, MN, USA, is not limited to greenhouse applications alone; it is also employed to monitor temperature within drying chambers. The sensor’s primary function is to regulate room temperature by providing heating at night and controlling the fan during the daytime. Here are the specifications of the temperature sensor device: Waterproof Digital Temperature Sensor, model Maxim Waterproof DS18B20 Sensor, Thief River Falls, MN, USA, Usable with 3.0 V to 5.5 V power/data, ±0.5-degrees Accuracy from −10 degrees to +85-degrees, Usable temperature range: −55 to 125 degrees; uses a 1-wire interface that requires only one digital pin for communication. Unique 64-bit ID burned into chip, and Stainless-steel tube 6 mm in diameter by 50 mm long.

2.6. Humidity Sensor Assemble

Several sensor devices are available for measuring temperature and humidity, including the DHT11 and DHT22. These sensors provide digital output values, allowing for immediate use in temperature and humidity detection. These sensors boast anti-interference capabilities, ease of integration, high accuracy, low power consumption, and compact size. The DHT22 sensor has been applied to create a wireless moisture meter, delivering highly accurate results with an average data retrieval error rate of just 2%. Here are the specifications for the humidity sensor device: Input Range: 0 to 100% RH, Working Range: 5 to 95% RH, Response Time: 60 s typical (90% of Range), Accuracy: ±2% RH, Output type: Current (2 Wire), Output range: 4 to 20 mA, Loop powered: 12 to 35 VDC, Output Impedance: Max. 600 Ω @ 24 VDC, and Operating Humidity: 5 to 95% RH.

2.7. Soil Moisture Sensor

In the process of choosing a soil moisture sensor, researchers must gather both yield and moisture data simultaneously to ensure an accurate yield estimate. To achieve this, a conductive sensor device (SparkFun Humidity Sensor, HIH-4030, analog output, power supply: 4.0 VDC–5.5 VDC, SparkFun Electronics, Niwot, CO, USA) was installed in the floating greenhouse. This sensor estimates humidity by analyzing the dielectric properties of the air circulating within the greenhouse. It is particularly beneficial for monitoring and optimizing grey oyster mushroom production.

2.8. Wireless Connection

When it comes to selecting a wireless connection, the Internet of Things (IoT) commonly relies on wireless technologies for various applications. Among the technologies employed in the IoT, Bluetooth and Wi-Fi stand out, with Wi-Fi often being preferred for long-distance applications. These technologies exhibit variations in terms of power consumption, transmission range, and susceptibility to interference from other signals. All of these wireless technologies are viable options for use in floating greenhouses, with due consideration for the specific field conditions.

2.9. Monitoring Using Arduino UNO

In order to select an Arduino board, these boards are designed with open-source licenses, making them accessible for individuals seeking to create electronic devices even with limited technical knowledge. Arduino board devices are programmable using the Arduino IDE, and the program can be easily uploaded to Arduino via USB cable. This simplicity and openness make Arduino a valuable choice for a wide range of electronic projects. Following this setup, Arduino operates independently. Arduino board devices find extensive application in agricultural activities, encompassing tasks such as monitoring plant growth, controlling irrigation, inspecting areas, measuring water quality, and monitoring pest populations. Furthermore, the data collected by Arduino can be stored in a database for reference in subsequent growing seasons. The specifications of the Arduino board are as follows: an NI myRIO Board (NI, Austin, TX, USA), built on the technology of the NI CompactRIO platform. The NI myRIO board is equipped with the latest Zynq fully programmable System on Chip (SoC) technology from Xilinx, San Jose, CA, USA which incorporates an ARM Cortex processor with a dual-core A9, along with an FPGA boasting 28,000 programmable logic cells. Leveraging the capacities of the NI LabVIEW graphical programming environment, the NI myRIO-Xilinx Zynq-7010 was chosen as the central processing unit (CPU) for the data collection module within the mushroom greenhouse’s water spraying monitoring and control system. This module predominantly comprises a power conversion circuit, a sensor signals receiving circuit, an analog-to-digital conversion circuit, and a bus communication circuit.

2.10. Statistical Analysis

All measurements were performed in triplicates. The experiment data were analyzed using SPSS 10.0 software. The experiments were accomplished using a randomized complete block design (RCBD). An analysis of variance (ANOVA) was used to determine the significance between treatments, and Duncan’s Multiple Range test (DMRT) was used to compare of the mean at 95% confidence level.

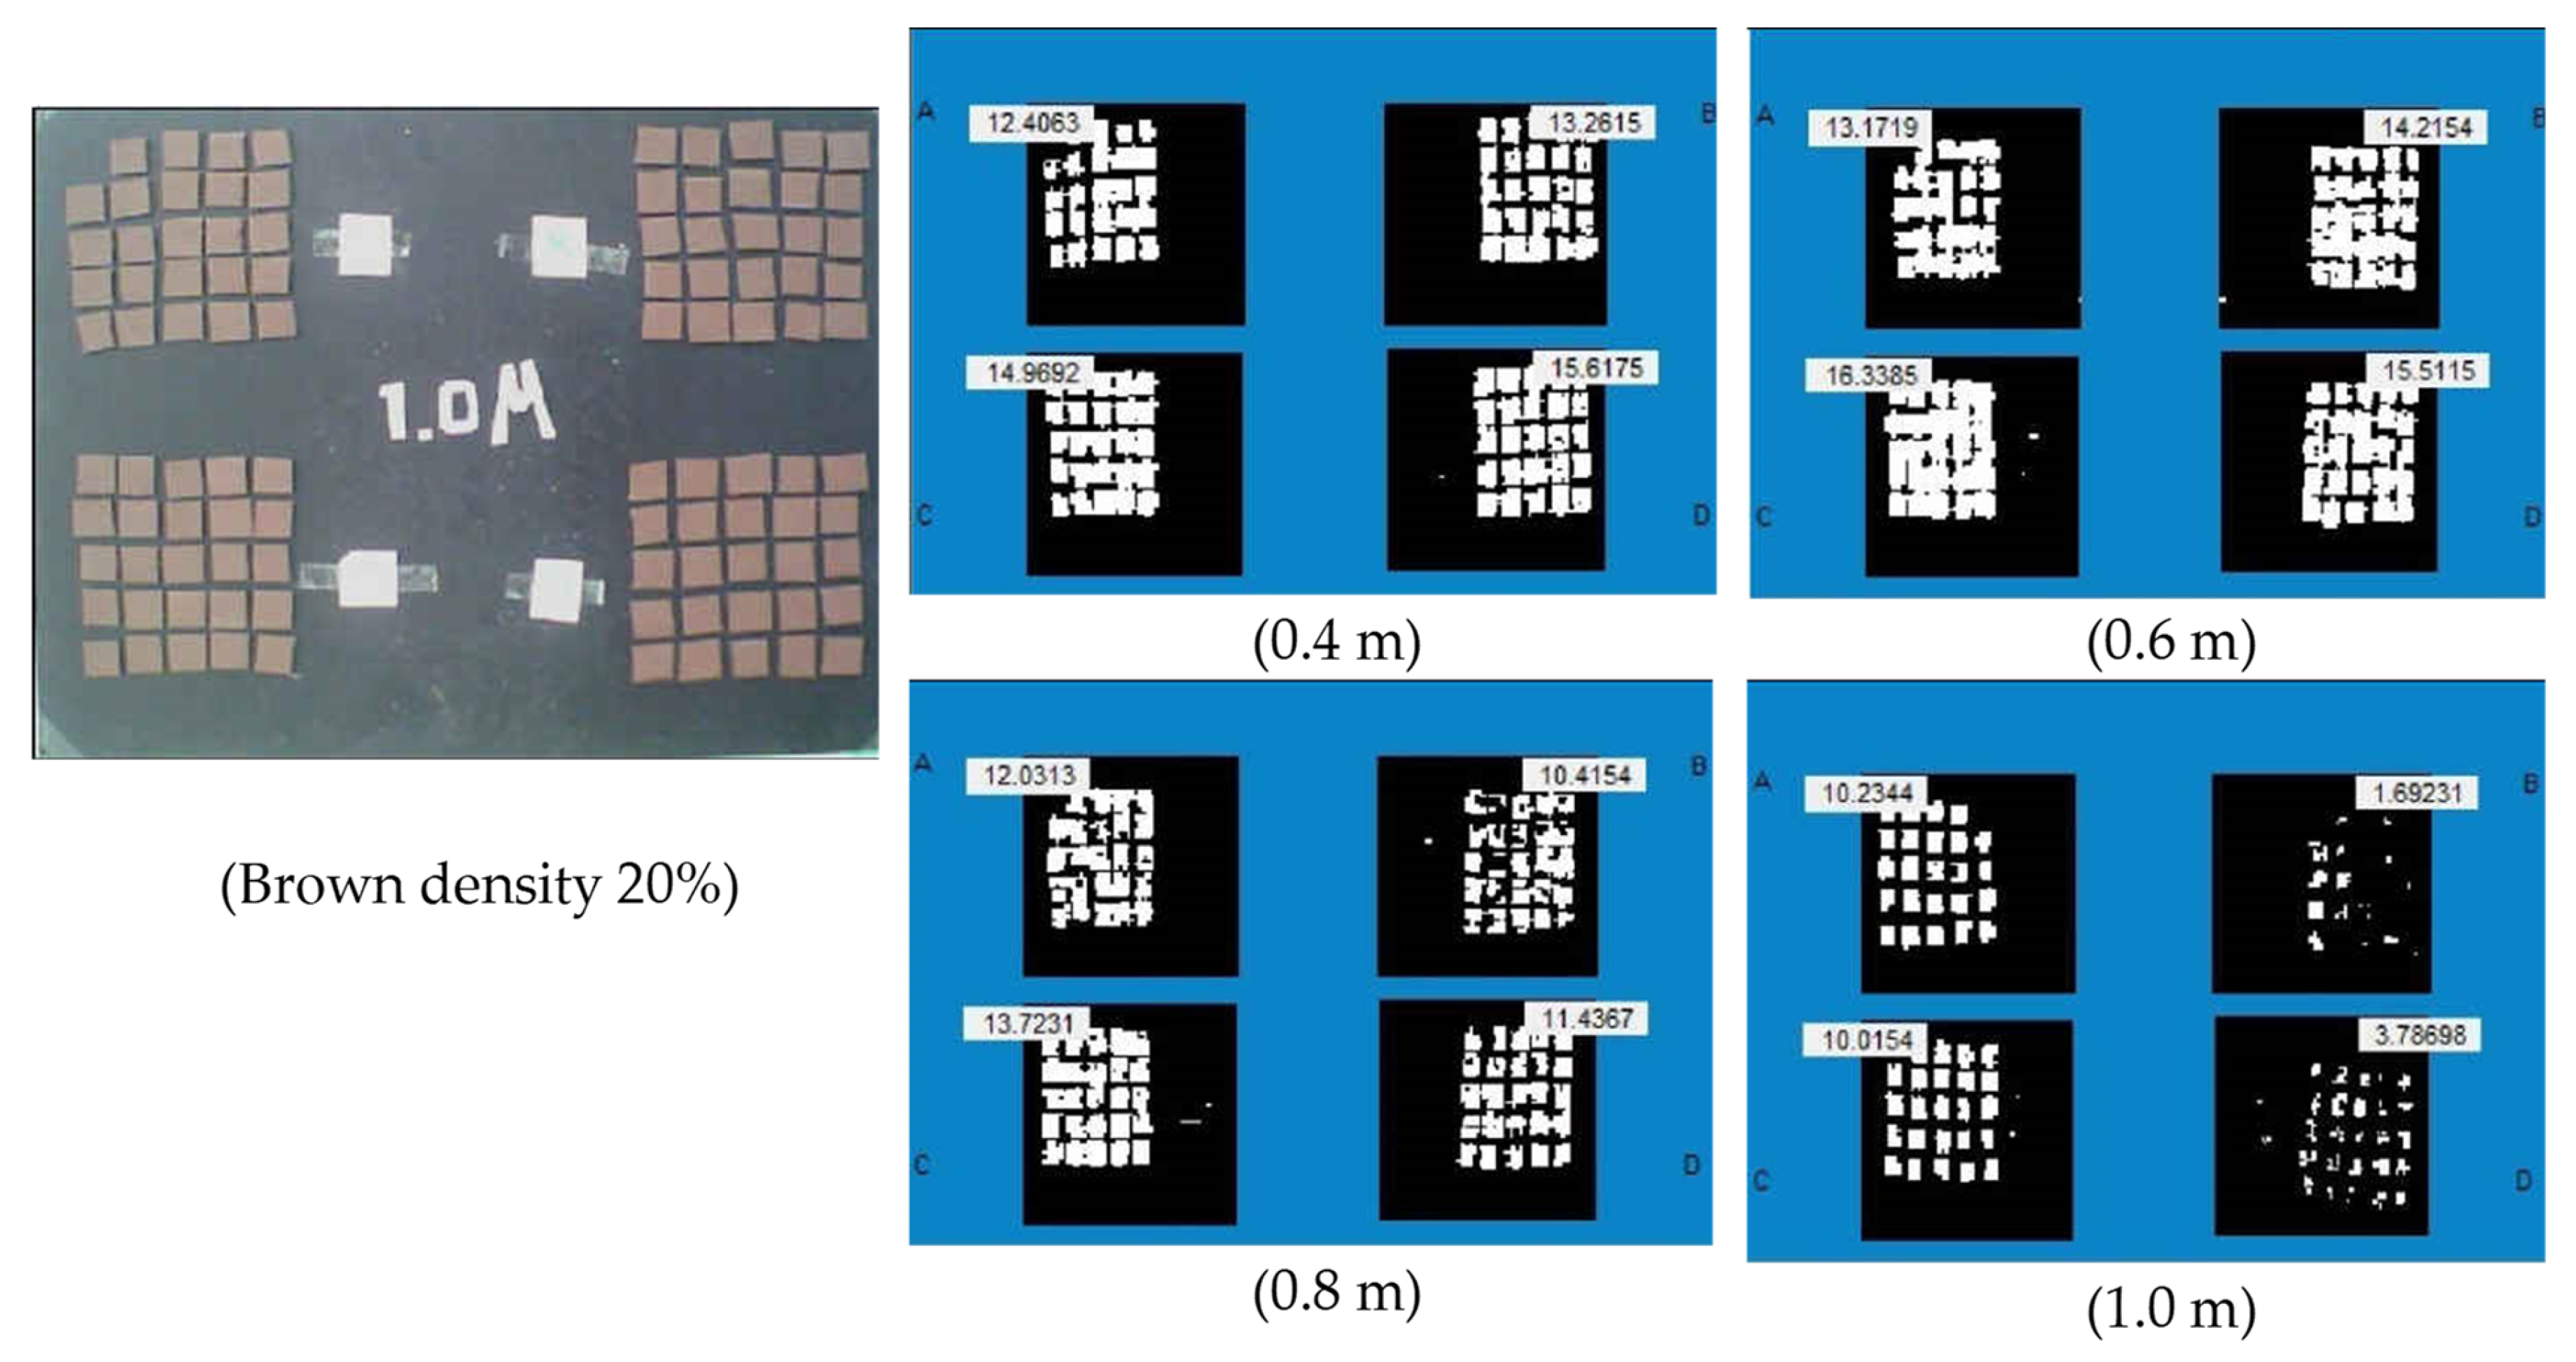
2.11. System Calibration in Floating Greenhouse

Calibration data from the developed system designed for both the camera accuracy calibration process and the precision of the specific algorithm used in photo processing were developed to perform aerial calibration for 2 wireless webcams by establishing a standard reference frame with dimensions of 65 cm in width and 50 cm in length. Subsequently, the color values of sample sheets were determined to serve as a reference for assessing the growth rate of oyster mushrooms, specifically within the yellow and green groups. These color sample sheets have dimensions of 2.54 cm × 2.54 cm. The color sample sheet group was established in the experiment at various percentages: 5% (24 pieces), 10% (48 pieces), 15% (72 pieces), and 20% (97 pieces), and they were positioned at different heights: 0.4 m, 0.6 m, 0.8 m, and 1.0 m, respectively. This calibration process involves 2 aspects: firstly, the calibration data from the base system for visual inspection, and secondly, testing the relationship between brightness, which varies with the time of the day.

2.12. Engineering Economy Analysis and Evaluation

Operating costs: The operation costs are calculated by considering both fixed costs and variable costs.

2.12.1. Fixed Cost

Depreciation of floating greenhouse refers to the diminishing value of a remote-controlled floating greenhouse over time, whether it is in active use or not. It involves estimating the value of the remote-controlled floating greenhouse at the end of the year, which can then be compared to its initial value at the beginning of the year as described in Equation (3):
D P = P S L
where DP is depreciation (USD), P is price of the floating greenhouse (USD), S is selling price (USD), and L is useful life of the floating greenhouse (year).

2.12.2. Interest

Interest expenses arise as a result of the investment made in a remote-controlled floating greenhouse used for business purposes. Even if the investment amount is not borrowed from external sources, it is imperative to account for this expense. This is because the funds used here could have otherwise been deployed in other business ventures. The initial investment cost for the remote-controlled floating greenhouse is notably high, particularly during the initial years. A significant portion of this cost is attributed to the depreciation of the greenhouse. By calculating the depreciation of the greenhouse, the corresponding interest value can be determined, as illustrated in Equation (4):
I = ( P + S ) 2 × i 100
where P is price of the floating greenhouse (USD), S is selling price (USD), and I is interest rate (%).
Variable cost: The variable costs are associated with the usage of the remote-controlled floating greenhouse, including maintenance costs.

2.12.3. Break-Even Point

In order to compare the costs of owning a remote-controlled floating greenhouse versus renting one, the contractor must carefully evaluate the required greenhouse space or the break-even point, which is calculated as depicted in Equation (5):
B E P = F c W r C w
where BEP is the Break-Even point, Fc is fixed cost, Wr is wage, and Cw is operating costs.

2.12.4. Payback Period of Remote-Controlled Floating Greenhouse

The specifics of the variables employed in the calculation of the payback period are as follows: Variable costs encompass the combined expenses associated with repairs and maintenance. Total costs, depicted in Equation (6), constitute the sum of variable costs and interest:
PBP = P/R
where P is price of the floating greenhouse (USD) and S is net price per year (USD).

3. Results

This section was divided by subheadings, as well as the experimental conclusions that can be drawn.

3.1. Calibration Data from Systems Designed to Collected Data from the Manual Monitoring

The quality of the calibration can be acceptable to process images from two wireless webcams that look at different altitude levels of 0.4 m, 0.6 m, 0.8 m, and 1.0 m, respectively, as presented in Figure 3, Figure 4 and Figure 5. The density of the sample sheets of the green color, yellow color, and brown color is 5% (24 pieces), 10% (48 pieces), 15% (72 pieces), and 20% (97 pieces), respectively. The data are shown below.
Statistical analysis collectively indicates that the calibration accuracy of image data processing is evaluated by using digital image processing commands designed to process a sample sheet in green, yellow, and brown shades. These shades of color are representatives of the surface area at the top of the mushrooms that grow in a floating greenhouse. The calibration data were studied at a specified height (0.4 m, 0.6 m, 0.8 m, and 1.0 m) with different densities of sample at 5%, 10%, 15%, and 20%, respectively. The table below shows the effect of height on image processing data from wireless webcams. It was found that the image processing data showed a significant difference at a 95% confidence level. The best accuracy in image processing data was at 0.4 m [15,17].
However, at the lower height of 0.4 m, there is no discernible interaction between altitude and color density. The effect of the wireless webcams height (height, m) and the percentage of green sample density (% mushroom growth) were evaluated. The results showed that the height level at 0.4–0.6 m is suitable for wireless webcams with 5% and 10% density of mushroom. At 15% and 20% density of mushroom, the height level of 0.4 m is suitable. The correlation between the difference in image data acquisition and height levels is detailed in Table 1.

3.2. Results of Designing and Constructing Floating Greenhouse

When analyzing the buoyant force, it becomes evident that the crucial aspect of designing and constructing a floating greenhouse lies in determining the total number of tanks required to uphold the complete weight of the greenhouse and its equipment. Once the precise number of tanks required for the system is confirmed, the next step involves assembling these tanks into a floating buoy. During this process, it is crucial to exercise caution when sealing the tanks with silicone. It is necessary to allow adequate drying time and perform a leak test before proceeding with the assembly, as presented in Figure 6 [6,14].

3.3. Results of Designing and Building a Control System

Design and construct an automated temperature and humidity control system powered by solar energy. This system activates when the temperature reaches 30 °C. The sensor will relay the temperature value to the Module Development Board, instructing the Relay Module to activate the water pump and fan. This action is aimed at lowering the temperature and increasing humidity levels within the greenhouse. In case that the temperature drops to 27 °C, the Relay Module will deactivate both the water pump and the fan. To determine the optimal settings, experiments were conducted to measure temperature and humidity levels inside and outside the greenhouse, as presented in Figure 7. The experiments involved passing water through a water pump and sprinkler to achieve humidity levels of approximately 70%, 75%, and 80% [2,11]. Temperature data was collected at these humidity levels over a period of 3 days in order to establish the values for the temperature and humidity control unit, as detailed in Table 2.
Analyzing the data recorded in the table from the experiment, it is evident that the suitable conditions for mushroom growth in the greenhouse were as follows: The actual humidity levels in the greenhouse across the 3 days were approximately 69.91%, 75.08%, and 79.75%, respectively. The average temperature within the greenhouse for the same 3 days was approximately 30 °C, 28.95 °C, and 27.45 °C, respectively. Considering the average outside conditions for all 3 days, which stood at 34.25 °C and 49.33% humidity, it was observed that elevated humidity levels correlated with a decrease in temperature, as presented in Figure 8. Based on these findings, the recommended settings for the temperature control unit have been established at a range of 27–30 °C and a humidity level between 70–80% [5,18].

3.4. Design and Develop an Algorithm for Processing and Spraying

The results of the testing for a remote-controlled floating greenhouse involved dividing the greenhouse into two sections: the sensor-controlled side and the conventional side. Each side housed 200 mushroom spawns. The testing compared various aspects, including temperature and humidity levels, the flowering period of mushrooms, energy consumption rates, as well as the yield and weight of the mushrooms. The test details are presented below.
To determine the water scatterable distance (mean dia.), the sprayer is filled with a solution of dye, and the lance is passed over a series of collecting papers. As representative figures, mean and surface diameter are calculated as follows:
M e a n   d i a . = Σ n d Σ n
where n is the number of droplets in each size group and d is the average diameter of each size group.
Figure 9 and Figure 10 illustrate a comparison of temperature and humidity levels in automated and conventional greenhouses.
Based on the graph of the test results and a comparison of temperature and humidity in both automated and conventional control systems, the water temperature used during the test was maintained at 30 °C. The average actual temperature inside the greenhouse reached 33.5 °C, while the average humidity level within the greenhouse was measured at 62.8%. The analysis revealed that during the testing with the automatic control unit, the average temperature and humidity levels were observed to be 28.55 °C and 77%, as presented in Figure 11, respectively. In contrast, the average temperature and humidity in the conventional control system were recorded at 30.2 °C and 70.8%, respectively. In conventional setups, the temperature tends to rise and humidity levels decline within 1–2 h of regular watering. This is in contrast to automatic control units, which exhibit a higher level of consistency in maintaining temperature and humidity [15,19].

3.5. Size of Mushroom Ready to Be Harvested

Based on the data presented in the table below, the test results and comparison of oyster mushroom growth during the flowering period between the automated temperature and humidity control unit and the conventional greenhouse indicated that the oyster mushroom cultivated using the automated temperature and humidity control unit, where the temperature was maintained at 27–30 °C and the humidity ranged from 70–80%, exhibited superior growth compared to general oyster mushroom cultivation. Oyster mushrooms, when grown using the automated temperature and humidity control unit, typically reach an appropriate size for consumption on the 11th day of cultivation, with growth commencing on the 4th day. In contrast, oyster mushrooms grown conventionally take longer, starting growth on the 5th day and reaching the desired size for consumption on the 12th day, which amounts to an additional day compared to the oyster mushrooms cultivated in the automated temperature and humidity control setup [2,12].

4. Discussion

We analyze our findings by considering the insights gained from prior research and the hypotheses we developed during our work.

4.1. Comparison of Mushroom Yields in Floating Greenhouse

Figure 12 depicts the test results and a comparative analysis of mushroom yields harvested from floating greenhouses, employing both automated and conventional temperature and humidity control systems. Out of a total of 10 mushroom harvests, it was observed that the floating greenhouse equipped with an automatic and conventional temperature and humidity control system yielded 1.81 and 1.22 kg from mushrooms per planting area, respectively. Notably, the automated temperature and humidity control system produced a higher quantity of mushrooms, accounting for 48.3% more than the conventional system, as presented in Figure 13 [5,18].

4.2. The Effect of the Height (m) and the Distribution of Spraying (Distance, m) Were Evaluated

Table 3 demonstrates that both the height levels (in meters) and the water scatterable distance of spraying had significant differences at a 95% confidence level. The spraying distance for water was higher for higher height levels. The most accurate injection was observed at a height of 0.4 m, which can help prevent water loss [10,11].

4.3. Comparison of Mushroom Yields in Floating Greenhouse

In this analysis, the relationship between the amount of temperature, moisture content, mushroom yields, and the altitude of the camera was investigated, distinguishing between automatic and traditional control systems, as detailed in Table 4.
The findings revealed that a cross-comparison of the readings obtained from both control systems (Figure 14) and the height of the webcam for automatic and traditional control systems revealed a robust correlation, with an R2 value of 0.7486–0.8971.
Remarkably, an automatic control system displayed an even more pronounced correlation, with an R2 value of 0.7551–0.8971, as compared to the R2 value of 0.7486–0.8663 for the traditional control system [3,13].

4.4. Energy Consumption

The results of calculating the electrical energy consumption can be determined as follows: Electrical load calculation = Watt × h
  • Fan 30 Watt × 2 units × 6 working hours = 360 Watt per day
  • Pump 36 Watt × 1 unit × 6 working hours = 216 Watt per day
  • Control panel 20 Watt × 1 unit × 12 working hours = 240 Watt per day
  • Total energy consumption 360 + 216 + 240 = 816 Watt per day

4.4.1. Engineering Economy

  • Operating costs: The operating costs are calculated by considering both fixed costs and variable costs.
(1)
Fixed cost: Depreciation (DP) is calculate using the straight-line method.
D P = P S L
where P is price of the floating greenhouse (USD), S is selling price or residual value of the floating greenhouse (USD), and L is useful life of the floating greenhouse (year) [16].
The cost of the remote-controlled floating greenhouse is 1480.58 USD, with a residual value estimated to be 10% of the initial greenhouse cost at the end of the 10th year, as detailed in Table 5. Hence,
Scrap   value ;   S = 10 100   ×   1480.58 = 148.05   US   Dollars
Depreciation ;   DP = 1480.58 148.05 10 = 133.25   U S   D o l l a r s

4.4.2. Interest on Investment

I = p + S 2   ×   i 100
Annual interest rate is set to be 10%. Therefore, annual interest equals to
1480.58 + 148.05 2   ×   10 100 = 81.43   U S   D o l l a r s / y e a r
Total Fixed costs = 133.25 + 81.43 = 214.68 USD/year
(2)
Variable cost
1.
Repair and maintenance: Repair and maintenance cost average 0.14 USD/day for 100 working days
Repair and maintenance cost = 0.14 × 100 = 14.18 USD/year
2.
Water cost: Usage average 0.06 m3 water cost 0.56 USD/unit for 100 working days
Water cost = 0.06 × 0.56 × 100 = 3.40 USD/year
3.
Labor cost: Wage 7.09 USD/day/worker for 100 working days
Labor cost = 7.09 × 100 × 1 = 709.09 USD/year
Total variable costs = 56.72 + 3.40 + 709.09 = 769.22 USD/year
Calculate the operating cost of the remote-controlled floating greenhouse for 1 year [1,7,8], considering it operates for 800 h and has a working capacity of 0.375 kg per hour,
O p e r a t i n g   c o s t   f o r   1   y e a r = 769.22 + 214.68 800 × 0.375 = 3.28   U S   D o l l a r s / k g
4.
Payback period of the remote-controlled floating greenhouse
The details of the variables used to calculate the payback period are indicated as follows: Variable costs consist of the sum of repair and maintenance costs, electricity costs, and labor costs. Total costs encompass variable costs and interest. Benefits received are computed by multiplying the hourly wage by the number of hours worked per year. The net benefit is the difference between the benefits and the total costs. The payback period is the quotient of the purchase price of the machinery and the net benefit.
Working hour 800 h/year
Interest 81.43 USD/year
Variable cost 769.22 USD/year or 0.96 USD/h
Total cost 769.22 + 81.43 = 850.65 USD/year
Received benefit 800 × 1.59 = 1276.36 USD/year
Net benefit 1276.36 − 850.65 = 425.71 USD/year
P a y b a c k   p e r i o d 1480.58 425.71 × 12 = 41.73   m o n t h s
Hence, with 800 h worked in one year, the payback period will be 41.73 months or approximately 3.47 years.
5.
Break-Even point
Break-Even   point = Fixed   cost ( Daily   wage O p e r a t i n g   c o s t )  
Fixed costs = 214.68 USD
Labor cost = 4.25 USD/kg
Working capacity = 0.375 kg/h
Daily wage = 1.59 USD/h
Operating cost of the floating greenhouse = 3.27 USD/kg
Working capacity 7 kg/h = 0.375 kg/h
Operating cost = 3.27 × 0.375 = 1.22 USD/year
T h e r e f o r e , Break-Even   P o i n t = 214.68 ( 1.59 1.22 ) = 580.21   h / y e a r

5. Conclusions

Observing the challenges faced in greenhouse cultivation, it becomes evident that growers invest a significant amount of time and effort, leading to work-related fatigue. Moreover, mushroom production volumes and the quality of the mushrooms often lack consistency. In response to these issues, researchers have devised a solution by designing and constructing a modern floating gray mushroom greenhouse equipped with remote control capabilities through mobile phones and Arduino technology. The study encompasses a thorough examination of various characteristics associated with a remote-controlled floating greenhouse, along with the investigation of suitable methods for temperature and humidity control that facilitate optimal oyster mushroom growth. The ultimate goal is to develop a functioning prototype of a remote-controlled floating greenhouse, with its central components featuring an automatic temperature and humidity control system, the structural design of the floating greenhouse, an integrated solar cell system, etc.
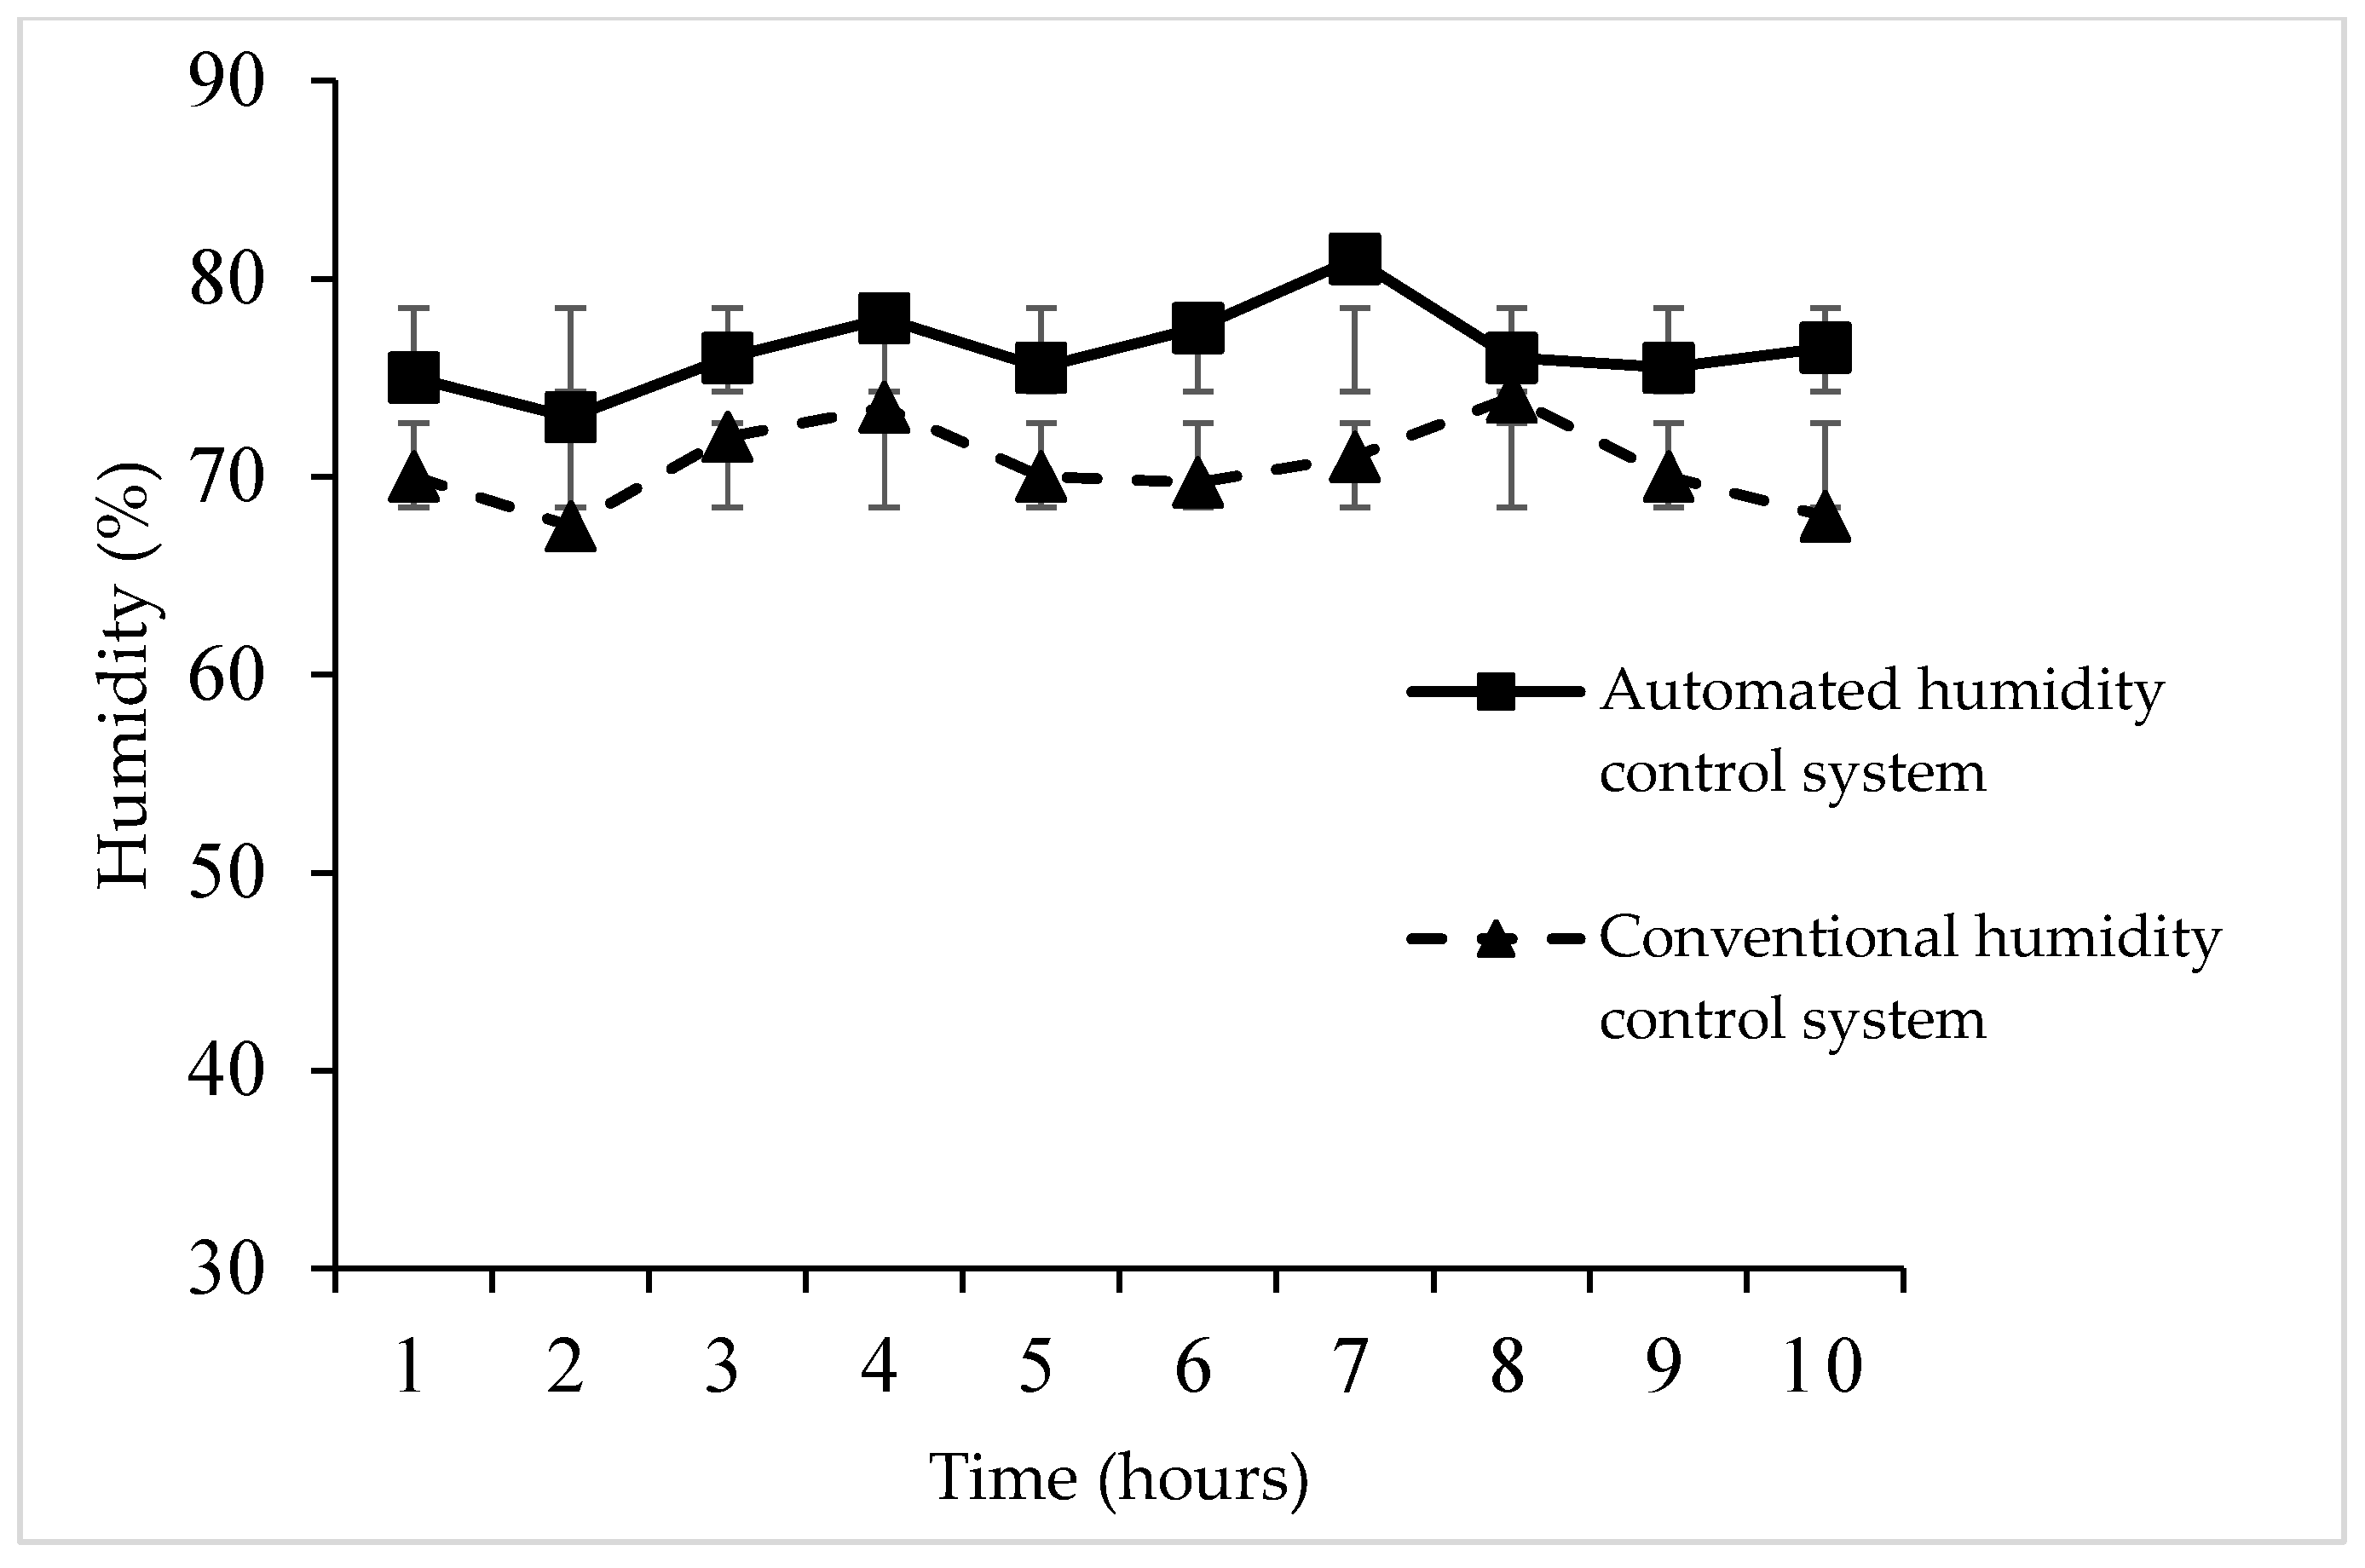
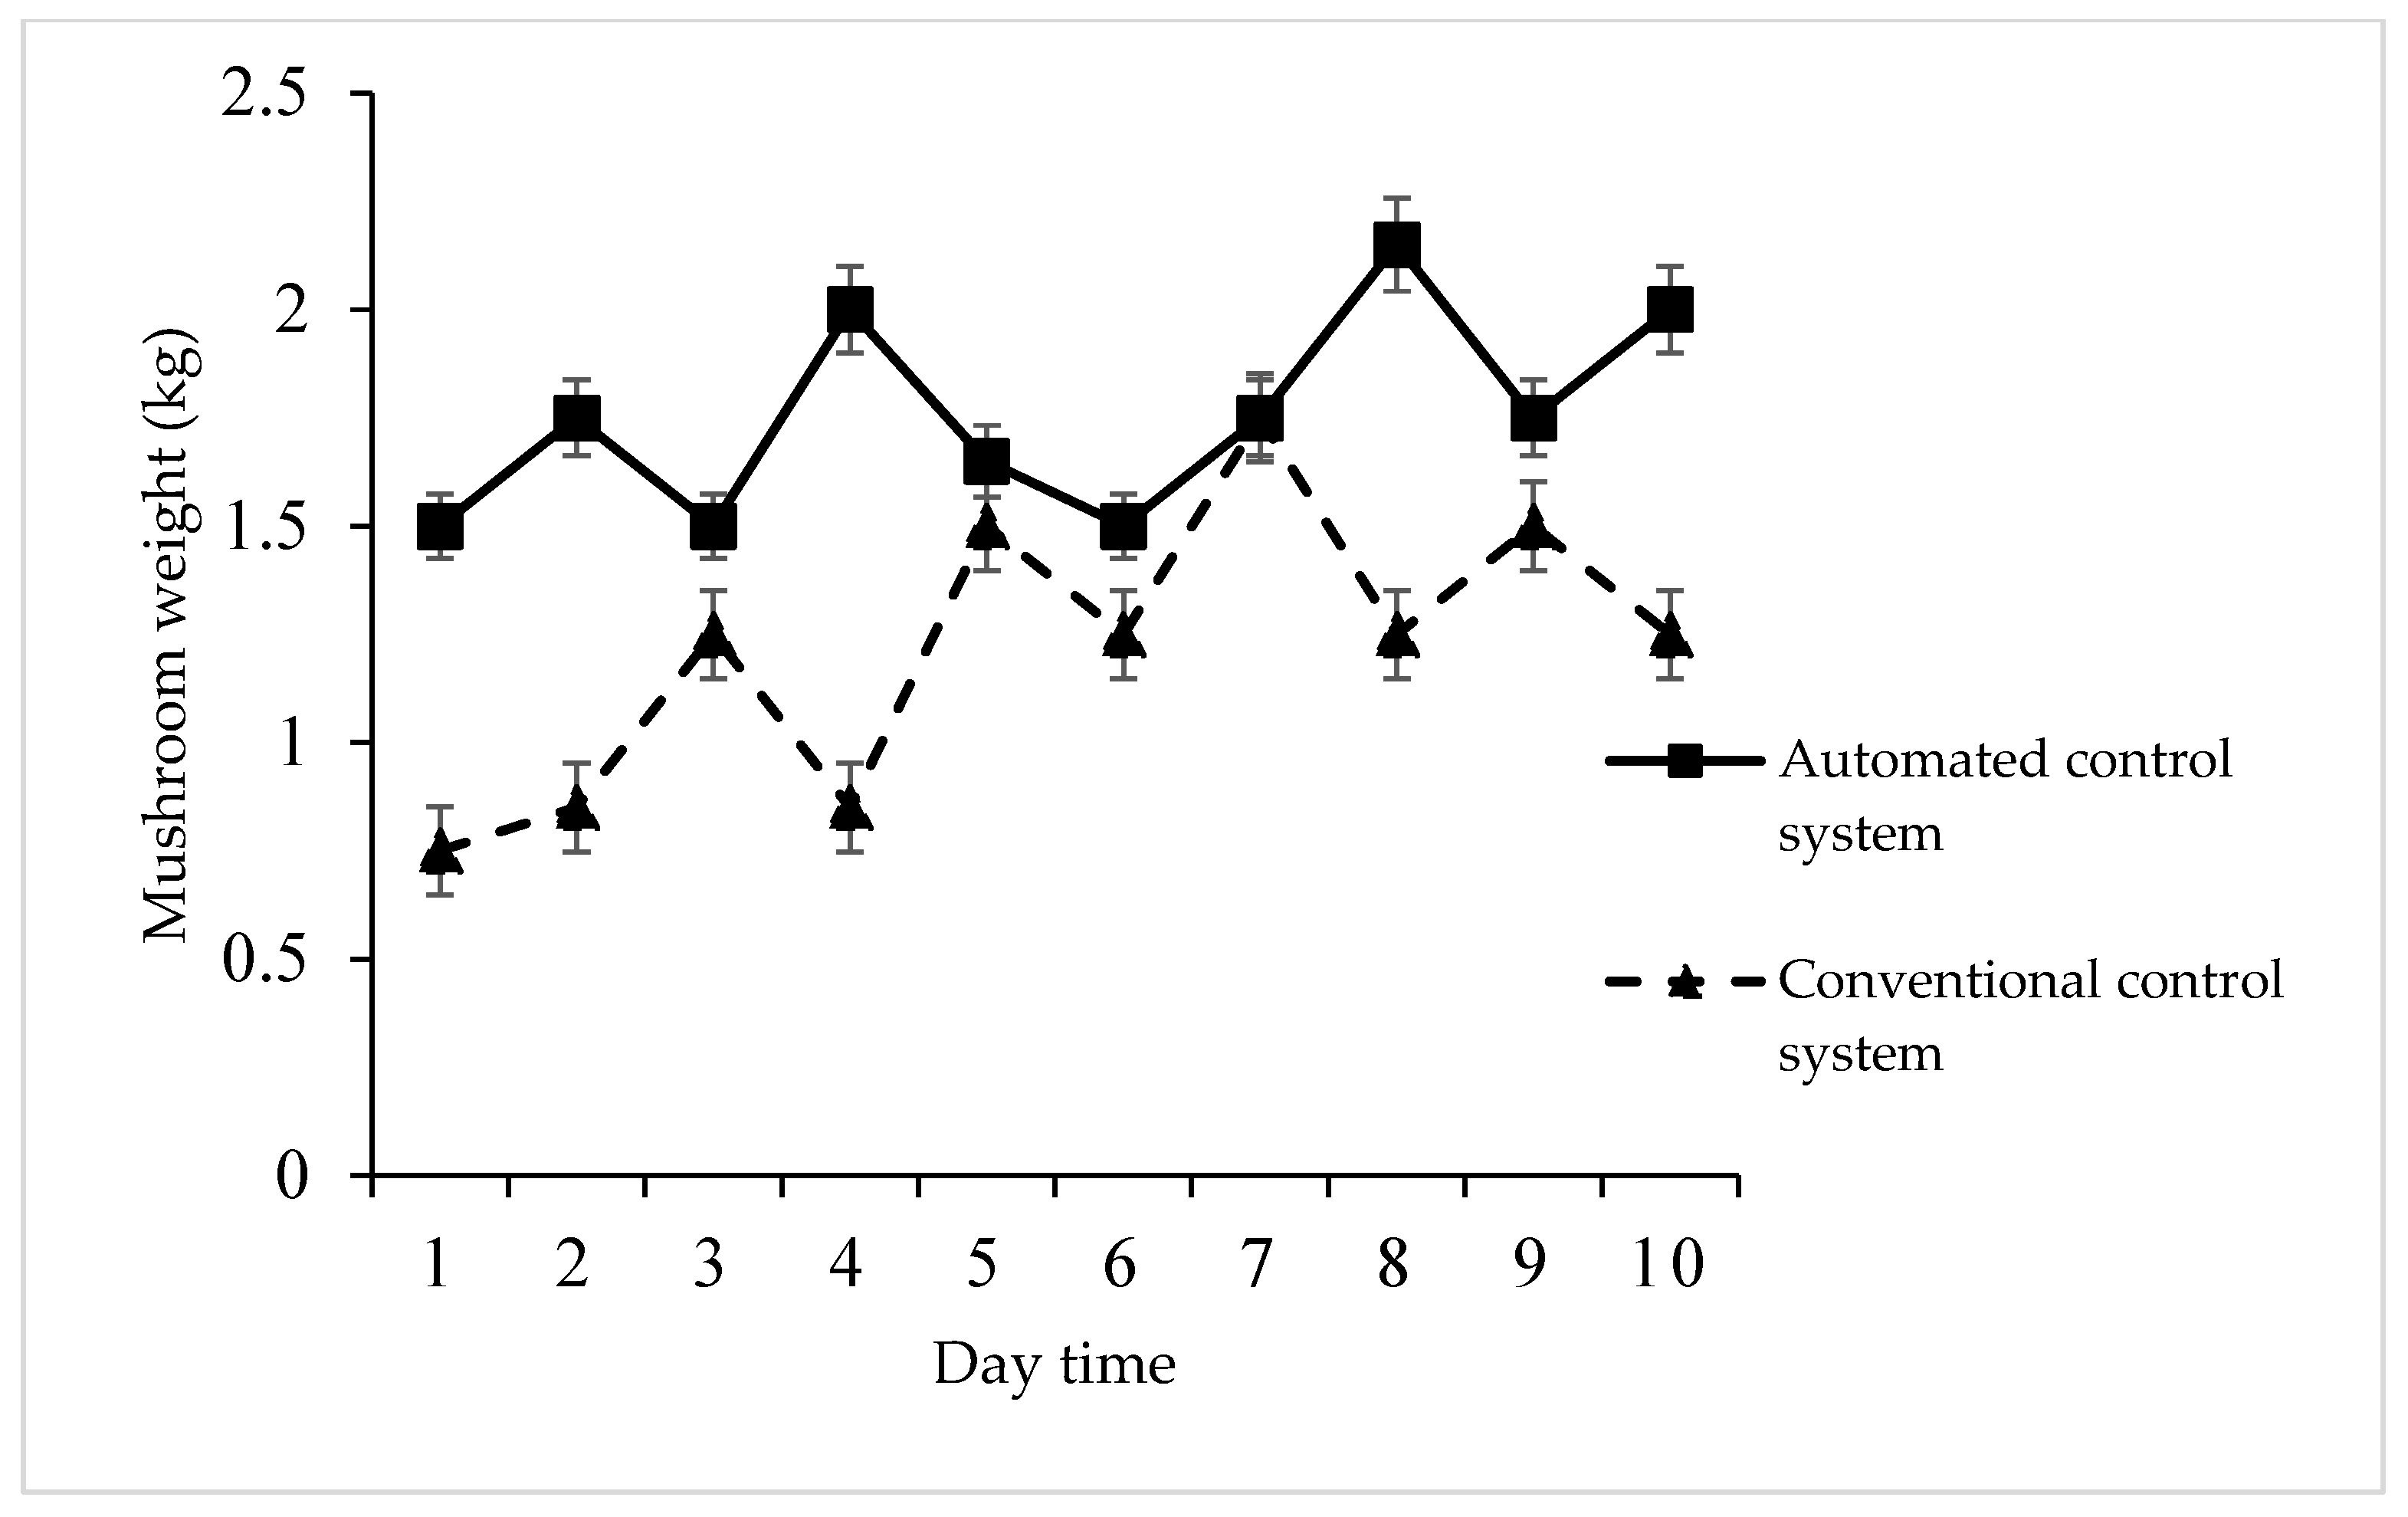
Through the process of testing and comparing floating greenhouses equipped with automatic control systems with the conventional greenhouses and their influence on the growth of oyster mushrooms, the study aims to determine the most suitable temperature and humidity values. This data will then be employed to configure an automatic temperature and humidity control unit, which will maintain the temperature within the range of 27–30 °C and humidity within the range of 70–80%. The advantage of using automated systems is that they allow for consistent control of temperature and humidity levels within the greenhouse. This contrasts with the traditional method of manually watering the greenhouse, which can lead to fluctuations in temperature and humidity, potentially resulting in undesirable conditions. The test results of the automatic temperature and humidity control system demonstrated enhanced growth compared to traditional cultivation methods. This resulted in a faster time to harvest, with mushrooms ready for harvesting one day earlier than the conventional approach. The accuracy of the mushroom weight percentage prediction and the precision of the image processing algorithm may be impacted by the height of the webcam. It was discovered that the most accurate weight percentage for mushrooms was 0.74 kg when the webcam was positioned at a height of 0.8 m. Moreover, the yield of mushrooms in the automatic system was notably higher, reaching 1.81 kg per day, in contrast to 1.22 kg per day in the conventional method, accounting for 48.3% more than the conventional system. Subsequently, the viability of cultivation in remote-controlled floating greenhouses was thoroughly examined, revealing a cost of USD 2.88 per kilogram. The financial analysis indicates a relatively short payback period of 41.73 months, or approximately 3.47 years, with a break-even point of 580.21 h per year when compared to conventional standard greenhouses.
This research has uncovered several potential suggestions for further development and enhancement to elevate the system’s accuracy and efficiency. For those seeking higher income and a quick payback period, consider increasing the number of oyster mushroom spawns. Additionally, when it comes to harvesting oyster mushrooms, it is advisable to collect them in the morning rather than later in the day. Morning harvesting ensures that the oyster mushrooms are fully formed, allowing for a higher market value. Lastly, consider raising the roof height of the greenhouse to mitigate heat buildup within the structure.

Author Contributions

Conceptualization, G.S. and P.A.; methodology, G.S. and N.W. writing—original draft preparation, G.S. and S.S.; writing—review and editing, G.S. and T.J. All authors have read and agreed to the published version of the manuscript.

Funding

This project is funded by RMUTT (Rajamangala University of Technology Thanyaburi).

Data Availability Statement

Data are contained within the article.

Acknowledgments

The authors thank the local farmer in Pathum Thani, Bueng Bon, Nong Suea district who donated the experimental infrastructure. Financial support for this work was provided by Rajamangala University of Technology Thanyaburi (RMUTT), Faculty of Engineering, Agricultural Engineering, Klong 6, Thanyaburi, Pathumthani, Thailand.

Conflicts of Interest

The authors declare no conflicts of interests.

References

  1. Chanprapai, P.; Wichai, T.; Sooksai, S.; Noitang, S.; Sukaead, W.; Sakdasri, W.; Sawangkeaw, R. Aqueous extracts of lemon basil straw as chemical stimulator for gray oyster mushroom cultivation. Foods 2022, 11, 1370. [Google Scholar] [CrossRef] [PubMed]
  2. Islam, M.T.; Zakaria, Z.; Hamidin, N.; Ishak, M.A.B.M. Characteristics of indoor mushroom cultivation of grey oyster (Pleurotus pulmonarius) by different stages of humidifying treatment. World Appl. Sci. J. 2016, 34, 1066–1075. [Google Scholar]
  3. Rashidi, A.M.; Yang, T.A. Nutritional and antioxidant values of oyster mushroom (P. sajor-caju) cultivated on rubber sawdust. Int. J. Adv. Sci. Eng. Inf. Technol. 2016, 6, 161–164. [Google Scholar] [CrossRef]
  4. Sun, S.; Liu, J.; Zhang, M.; He, S. Simultaneous improving nitrogen removal and decreasing greenhouse gas emission with biofilm carrier’s addition in ecological floating bed. Bioresour. Technol. 2019, 292, 121944. [Google Scholar] [CrossRef] [PubMed]
  5. Fan, X.; Du, Y.; Luo, B.; Han, W.; Niu, S.; Gu, W.; Liu, D.; Chang, J.; Chang, S.X.; Ge, Y. Increasing plant diversity to mitigate net greenhouse effect of wastewater treatment in floating constructed wetlands. J. Clean. Prod. 2021, 314, 127955. [Google Scholar] [CrossRef]
  6. Qarallah, B.; Shoji, K.; Kawamura, T. Development of a yield sensor for measuring individual weights of onion bulbs. Biosyst. Eng. 2008, 100, 511–515. [Google Scholar] [CrossRef]
  7. Samseemoung, G.; Thongindam, P.; Soni, P. Drone application with low-cost remote-controlled earth-drilling machine for modern agriculture. Agric. Nat. Resour. 2023, 57, 173–180. [Google Scholar] [CrossRef]
  8. Samseemoung, G.; Bhucksasri, J.; Parnsakhorn, S.; Kalsirisilp, R.; Samseemung, M.; Jayasuriya, H.P. Comparison of drone with remote-controlled sprayer arm and variable rate sprayer for monitoring coconut rhinoceros beetle infestations. Agric. Nat. Resour. 2023, 57, 249–260. [Google Scholar]
  9. Jacobs, A.E.; Harrison, J.A. Effects of floating vegetation on denitrification, nitrogen retention, and greenhouse gas production in wetland microcosms. Biogeochemistry 2014, 119, 51–66. [Google Scholar] [CrossRef]
  10. Gu, C.; Wang, X.; Wang, X.; Yang, F.; Zhai, C. Research progress on variable-rate spraying technology in orchards. Appl. Eng. Agric. 2020, 36, 927–942. [Google Scholar] [CrossRef]
  11. Hussain, N.; Farooque, A.A.; Schumann, A.W.; McKenzie-Gopsill, A.; Esau, T.; Abbas, F.; Acharya, B.; Zaman, Q. Design and development of a smart variable rate sprayer using deep learning. Remote Sens. 2020, 12, 4091. [Google Scholar] [CrossRef]
  12. Cuce, E.; Harjunowibowo, D.; Cuce, P.M. Renewable and sustainable energy saving strategies for greenhouse systems: A comprehensive review. Renew. Sustain. Energy Rev. 2016, 64, 34–59. [Google Scholar] [CrossRef]
  13. Owaid, M.N.; Al-Saeedi, S.S.S.; Al-Assaffii, I.A.A. Antifungal activity of cultivated oyster mushrooms on various agro-wastes. Summa Phytopathol. 2017, 43, 9–13. [Google Scholar] [CrossRef]
  14. Tawfeek, M.A.; Alanazi, S.; El-Aziz, A.A. Smart greenhouse based on ann and iot. Processes 2022, 10, 2402. [Google Scholar] [CrossRef]
  15. Aiello, G.; Giovino, I.; Vallone, M.; Catania, P.; Argento, A. A decision support system based on multisensor data fusion for sustainable greenhouse management. J. Clean. Prod. 2018, 172, 4057–4065. [Google Scholar] [CrossRef]
  16. Lin, F.; Weng, Y.; Chen, H.; Zhuang, P. Intelligent greenhouse system based on remote sensing images and machine learning promotes the efficiency of agricultural economic growth. Environ. Technol. Innov. 2021, 24, 101758. [Google Scholar] [CrossRef]
  17. Zhou, Y.; Xia, Q.; Zhang, Z.; Quan, M.; Li, H. Artificial intelligence and machine learning for the green development of agriculture in the emerging manufacturing industry in the IoT platform. Acta Agric. Scand. Sect. B—Soil Plant Sci. 2022, 72, 284–299. [Google Scholar] [CrossRef]
  18. Stone, P.J.; Sorensen, I.B.; Jamieson, P.D. Effect of soil temperature on phenology, canopy development, biomass and yield of maize in a cool-temperate climate. Field Crops Res. 1999, 63, 169–178. [Google Scholar] [CrossRef]
  19. Behnke, G.D.; Villamil, M.B. Cover crop rotations affect greenhouse gas emissions and crop production in Illinois, USA. Field Crops Res. 2019, 241, 107580. [Google Scholar] [CrossRef]
Figure 1. Design and fabrication of remote-control mobile phone and using Arduino for modern floating grey oyster mushroom greenhouse.
Agriengineering 06 00061 g001aAgriengineering 06 00061 g001b
Figure 2. Shows a free-body diagram of a floating greenhouse with buoyant force and total weight values.
Agriengineering 06 00061 g002
Figure 3. Image processing calibration from wireless webcams, green color density 20% image segmented that the caption (AD) contains subfigures showing the percentage values obtained by processing photographs of color sample sheets at different placement positions with heights ranging from 0.4 m to 1.0 m.
Agriengineering 06 00061 g003
Figure 4. Image processing calibration from wireless Webcams cameras, yellow color density 20% image segmented that the caption (AD) contains subfigures showing the percentage values obtained by processing photographs of color sample sheets at different placement positions with heights ranging from 0.4 m to 1.0 m.
Agriengineering 06 00061 g004
Figure 5. Image processing calibration from wireless Webcams cameras, brown color density 20% image segmented that the caption (AD) contains subfigures showing the percentage values obtained by processing photographs of color sample sheets at different placement positions with heights ranging from 0.4 m to 1.0 m.
Agriengineering 06 00061 g005
Figure 6. Designing and fabricating floating greenhouse steps; (a) 3D assembly prototype and (b) Manual assembling.
Agriengineering 06 00061 g006
Figure 7. Designing and building a structural system by 3D CAD software (SolidWorks EDU Edition 2012; Serial Number: 9710026468614256M497NDG9).
Agriengineering 06 00061 g007
Figure 8. Designing and building a control system; (a) Design and fabricate an automated temperature and (b) Humidity control system.
Agriengineering 06 00061 g008
Figure 9. Testing results and comparison between automated and conventional temperature control system.
Agriengineering 06 00061 g009
Figure 10. Testing results and comparison between automated and conventional humidity control system.
Agriengineering 06 00061 g010
Figure 11. Develop an algorithm for processing and spraying; (a) Flow simulation and nozzle spray calibration in floating greenhouse and (b) Image processing algorithm.
Agriengineering 06 00061 g011
Figure 12. Results and comparison of mushroom yields in floating greenhouse.
Agriengineering 06 00061 g012
Figure 13. An automated temperature and humidity control system produced a higher quantity of mushroom; (a) The mushroom harvested with the standard size and (b) Manual mushroom harvested.
Agriengineering 06 00061 g013
Figure 14. Discrimination analysis of the amount of temperature, moisture, and mushroom weight using an automatic and traditional control systems.
Agriengineering 06 00061 g014
Table 1. Correlation between the difference of image data acquisition and height levels (m) with percent of green sample density (%).
Percent of Green Sample Density (%)No. of Image Acquisition SystemAltitude Levels
(m)
0.40.60.81.0
5Labor force5555
Wireless Webcams4.333 c3.990 bc3.756 ab3.410 a
10Labor force10101010
Wireless Webcams8.363 c7.813 c6.604 b4.525 a
15Labor force15151515
Wireless Webcams12.400 b11.284 b9.015 a8.219 a
20Labor force20202020
Wireless Webcams16.084 c14.869 c12.178 b8.918 a
Means in a column followed by the same character are not significantly different at 0.05 significant levels according to Duncan’s Multiple Range Test.
Table 2. The temperature and humidity values that affect the weight of mushrooms are displayed for both automatic control and traditional mushroom cultivation.
TypeAverage Temperature,
(°C)
Moisture Content,
(% db.)
Average Yield,
(kg)
Working Cost, (USD/kg)Working Capacity, (kg/h)Water Consumption, (L/day)
Automatic control mushroom cultivation30.0069.911.503.130.3860
28.9575.081.803.760.4672
27.4579.752.104.390.5485
Traditional mushroom cultivation34.2570.000.804.060.26100
31.2575.000.904.570.29112
30.3880.001.206.090.39130
Table 3. Correlation between height levels (m) and chemicals and pesticides scatter able distance (m) at pressure 1 bar and differences volume flow rate (L/min).
Volume Flow Rate
(L/min)
Height Levels,
(m)
Water Scatter Able Distance,
(m)
0.020.40.220 a
0.60.235 a
0.80.255 b
1.00.280 c
0.060.40.325 a
0.60.360 b
0.80.375 b
1.00.467 c
0.110.40.530 a
0.60.635 b
0.80.722 c
1.00.817 d
Means in a column followed by the same character are not significantly different at 0.05 significant levels according to Duncan’s Multiple Range Test.
Table 4. The accuracy of the prediction of the weight percentage of mushrooms and the precision value of the image processing algorithm can be affected by the height of the webcam.
Height of Webcam,
(m)
Weight of Grey Oyster Mushroom from Manual,
(kg)
Weight from an Image Processing Algorithm,
(kg)
Fairy Mushroom
Diameter,
(mm)
0.400.800.6553
0.600.900.6756
0.801.200.7460
1.001.500.6756
Table 5. Cost of constructing remote-controlled floating greenhouse.
No.Part ListUnitPrice
(USD/unit)
QuantityTotal
(USD)
1Smart boardpiece11.34556.72
2Black shading net 80%piece8.50542.54
31-inch square pipepipe8.5014119.12
4Mushroom spawnspawn0.1440056.72
5Fanunit8.50217.01
6Pumpunit14.18114.18
7295-Watt solar call panespanel80.832161.67
8Inverter setpanel85.09185.09
9Battery (12 V 80 A)unit36.87273.74
10Electric wiremeter0.852017.01
113-inch square pipepipe17.0120340.36
12Water tanktank14.1815212.72
13Construction costunit283.631283.63
Total (USD)1480.58
Disclaimer/Publisher’s Note: The statements, opinions and data contained in all publications are solely those of the individual author(s) and contributor(s) and not of MDPI and/or the editor(s). MDPI and/or the editor(s) disclaim responsibility for any injury to people or property resulting from any ideas, methods, instructions or products referred to in the content.

