Article

AI-Based Prediction of Carrot Yield and Quality on Tropical Agriculture

by
Yara Karine de Lima Silva
,
Carlos Eduardo Angeli Furlani
and
Tatiana Fernanda Canata
*
Department of Engineering and Mathematical Sciences, Faculty of Agrarian and Veterinary Sciences, São Paulo State University (UNESP), Jaboticabal 14884-900, São Paulo, Brazil
*
Author to whom correspondence should be addressed.
AgriEngineering 2024, 6(1), 361-374; https://doi.org/10.3390/agriengineering6010022
Submission received: 25 November 2023 / Revised: 30 January 2024 / Accepted: 31 January 2024 / Published: 9 February 2024
(This article belongs to the Special Issue Implementation of Artificial Intelligence in Agriculture)

Abstract

:
The adoption of artificial intelligence tools can improve production efficiency in the agroindustry. Our objective was to perform the predictive modeling of carrot yield and quality. The crop was grown in two commercial areas during the summer season in Brazil. The root samples were taken at 200 points with a 30 × 30 m sampling grid at 82 and 116 days after sowing in both areas. The total fresh biomass, aerial part, and root biometry were quantified for previous crop harvesting to measure yield. The quality of the roots was assessed by sub-sampling three carrots by the concentration of total soluble solids (°Brix) and firmness in the laboratory. Vegetation indices were extracted from satellite imagery. The most important variables for the predictive models were selected by principal component analysis and submitted to the Artificial Neural Network (ANN), Random Forest (RF), and Multiple Linear Regression (MLR) algorithms. SAVI and NDVI indices stood out as predictors of crop yield, and the results from the ANN (R2 = 0.68) were superior to the RF (R2 = 0.67) and MLR (R2 = 0.61) models. Carrot quality cannot be modeled by the predictive models in this study; however, it should be explored in future research, including other crop variables.

1. Introduction

Carrot (Daucus carota L.) is an important vegetable among the top 10 vegetables grown worldwide [1]. It is a geocarpic vegetable crop established underground and is abundant in biologically active substances, such as vitamins, anthocyanins, and carotenoids. Such compounds have antioxidant, antitumor, and antihypertensive capabilities and other beneficial characteristics for human health [2]. In addition to these components, carrots contain fermentable sugars to produce bioethanol and can contribute to energy security.
The genetic factors of the cultivars, growing season, environmental conditions, and management practices in the field affect the quality of the roots [3]. Among the factors associated with crop quality, in decreasing order of importance, are cultivar, environmental conditions, and practices of cultivation [4]. These factors interact with each other to optimize crop yield and root quality. The quality of the table carrots (in natura), the focus of this study, is a characteristic that is even more required for food consumption. The visual aspects of uniformity, such as size, shape, and flavor, define the market value and consumer preference. There are numerous alternatives to evaluate the general quality of the roots, such as the flavor and texture for consumption, the size of the classes, and the lack of defects on the final product to the market. The morphology of carrots is influenced by its genetic components, which impact the relationship between shoot biomass and storage root biomass [5]. Over the period of cultivation, there is a deformation of the roots, associated with the accumulation of biomass, according to the environmental and soil conditions of the agricultural area. The carrot has a pivoting root system, with a main, long, and conical primary root, generally orange in color. The aerial part of the plant is composed of leaves that are compound and pinnate, with lanceolate or ovate segments, serrated margins, and a dark green color. During the second year of cultivation, the plant produces an umbel-type inflorescence, with numerous small white or slightly pink flowers.
The content of total soluble solids (sweetness or °Brix) and firmness are directly related to the quality of the carrots for the food sector. The °Brix is commonly evaluated in the laboratory by quantifying the amount of free sugars in its composition. Firmness is measured by the resistance of the food to the penetration of an equipment, inferring the crispness of the food when consumed fresh. These characteristics make up essential appearance, flavor, and texture factors that indicate the freshness and ripeness of the product.
Flavor, sweetness, and texture are organoleptic variables of appreciation during consumption. Mpemba et al. [6] evaluated the soluble solid content of fresh carrots with a refractometer, obtaining values of 9.33 °Brix and a firmness of 23.58 N. This is in accordance with the average of 7.82 °Brix and a firmness of 31.81 N obtained in this study. Temperature affects the sweetness of carrot roots. Colder temperatures (about 9 °C) increase the glucose and fructose contents of the root, while normal temperatures (21 °C) favor the accumulation of sucrose and carotene in the product [7]. Carrots under climatic conditions in this study, around 25 °C, favored greater color despite their sweetness. Small changes in the biochemical composition of plants, closely linked to the plant’s physiology, make it possible to evaluate the crop quickly and non-destructively in relation to its physiological stage. In carrot germplasm, total sugar varies more than ten-fold [8], and terpenoids are genetically controlled by 30 quantitative trait loci (QTLs) [9]. The sugar content also affects the level of sweetness, and volatile terpenoids affect the product’s flavor [10].
Some contributions of this study to agricultural engineering include innovative tools for monitoring carrot yield and quality characteristics, essential for agronomical decision-making processes in the field. Investigating locally the variation in the yield and quality of the carrots would enable us to define management zones and even define locations with higher yield potential for the crop. Agricultural areas with a greater potential for production can increase the efficient use of resources such as fertilization, pesticides, seed population, and sowing period. Areas of carrots with higher sugar contents can be directed towards energy production or greater value in the consumer market.
Different predictive approaches to crop parameters leveraging remote sensing (RS) and artificial intelligence (AI) are being explored in the literature [11,12,13]. RS involves collecting data on the Earth’s surface using sensors installed on satellites or remotely piloted aircraft to monitor large areas at low costs [14], control in-season weeds, identify the health of the crop, and predict crop yield in a non-destructive way.
Vegetation indices (VIs) are calculated by equations from the spectral bands [15], which makes it possible to map the dynamics of the crop to better understand the field conditions and practices that interfere with the yield and its desired qualitative attributes. Wei et al. [11] did not observe a linear relationship between 88 spectral bands and carrot yield. Therefore, the application of machine learning methods is favorable for modeling this variable (non-linear behavior). The authors identified that the reflectance of the NIR (near-infrared) spectral band increased during crop growth, and the RGB bands decreased at 40 days after sowing (DAS) due to the root phenological stage. The accuracy of crop yield prediction varies depending on the climatic conditions during the development of the plants. The correlation between VIs and yield changes throughout the crop cycle, so it would not be ideal to only use a fixed period to model crop yield through remote sensing [12,13,14]. Monitoring geocarpic crops, such as carrots, is more complex because the organ of interest is established underground [15,16], and its extraction is necessary for sampling [17].
Agricultural systems based on machine learning (ML) methods can become more efficient and sustainable in the different scenarios of production [18,19]. ML is fundamental for improving the growth of crop yield in a sustainable manner, helping to interpret and correlate field data with computational techniques that can contribute to supporting decision making in agriculture [20,21]. Yield and quality modeling for underground crops, such as carrots, is limited, as the product of interest is evaluated indirectly through its aerial part, which reduces the accuracy of predicting its parameters [22,23]. There are still no studies that have jointly explored the yield and quality of the carrots in commercial conditions. This study aims to establish a relationship between the variables of total fresh mass, aerial part, and roots, as well as the variables of length, diameter, °Brix, and firmness of the roots, together with crop reflectance data on a large scale.

2. Materials and Methods

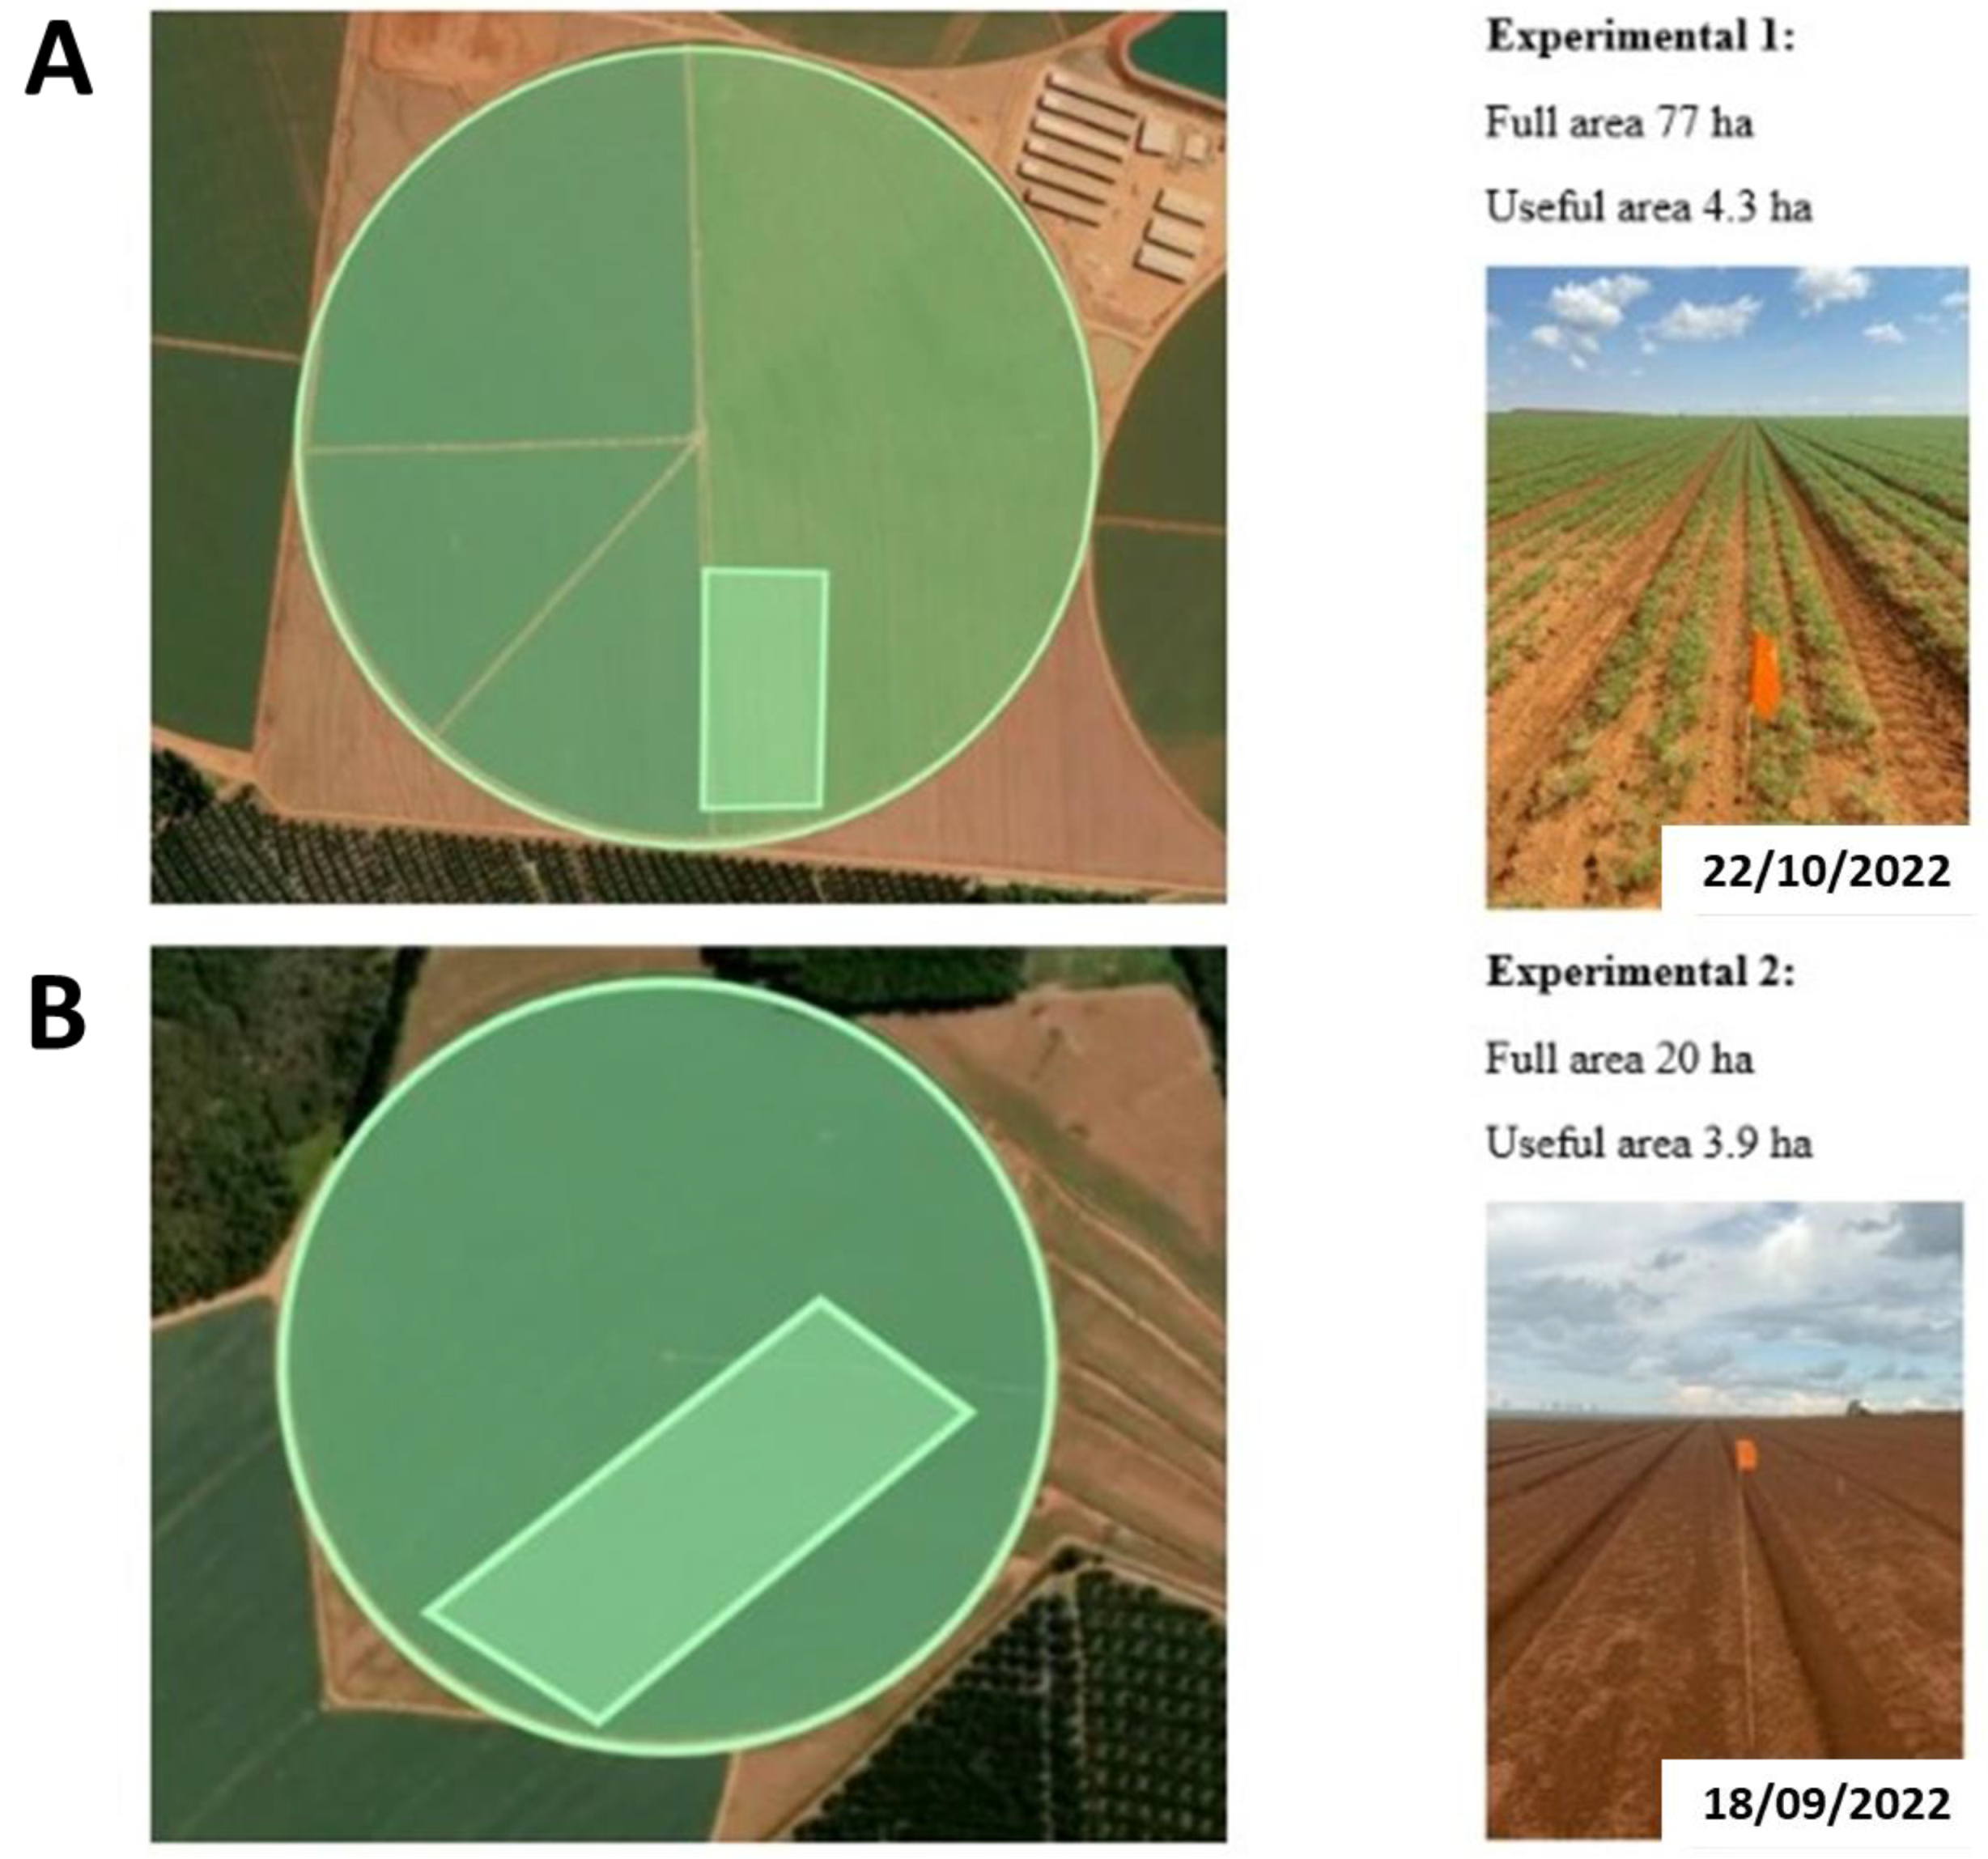
2.1. Experimental Areas

This work was carried out in two irrigated commercial areas in São Gotardo, Minas Gerais, Brazil. Encrusted seeds of the carrot hybrid EX 4098 (Tropical Nantes Group) were sown in the summer season (2022/2023) at two different periods: 29 August (Site 1, coordinates 19°24′33.3″ S 46°15′58.0″ W, UTM23S), and October 24 (Site 2, coordinates 19°25′45.7″ S 46°16′46.6″ W, UTM23S), with a final population of 466,700 plants per hectare after thinning (Figure 1).
The soil condition of the pivots is a red-yellow Oxisol with a smooth wavy relief (LVd4). The soils at the experimental sites have a history of agricultural cultivation spanning over 30 years with annual crops and are destined most of the time for vegetable crops. The soil profile was prepared with a subsoiler (0.06 m deep) and a rotary hoe with a tiller (0.015 m deep) for sowing hybrid encrustations. The choice of the areas followed the criteria of accessibility to the cultivation site and logistics of transporting the carrot samples to the laboratory.

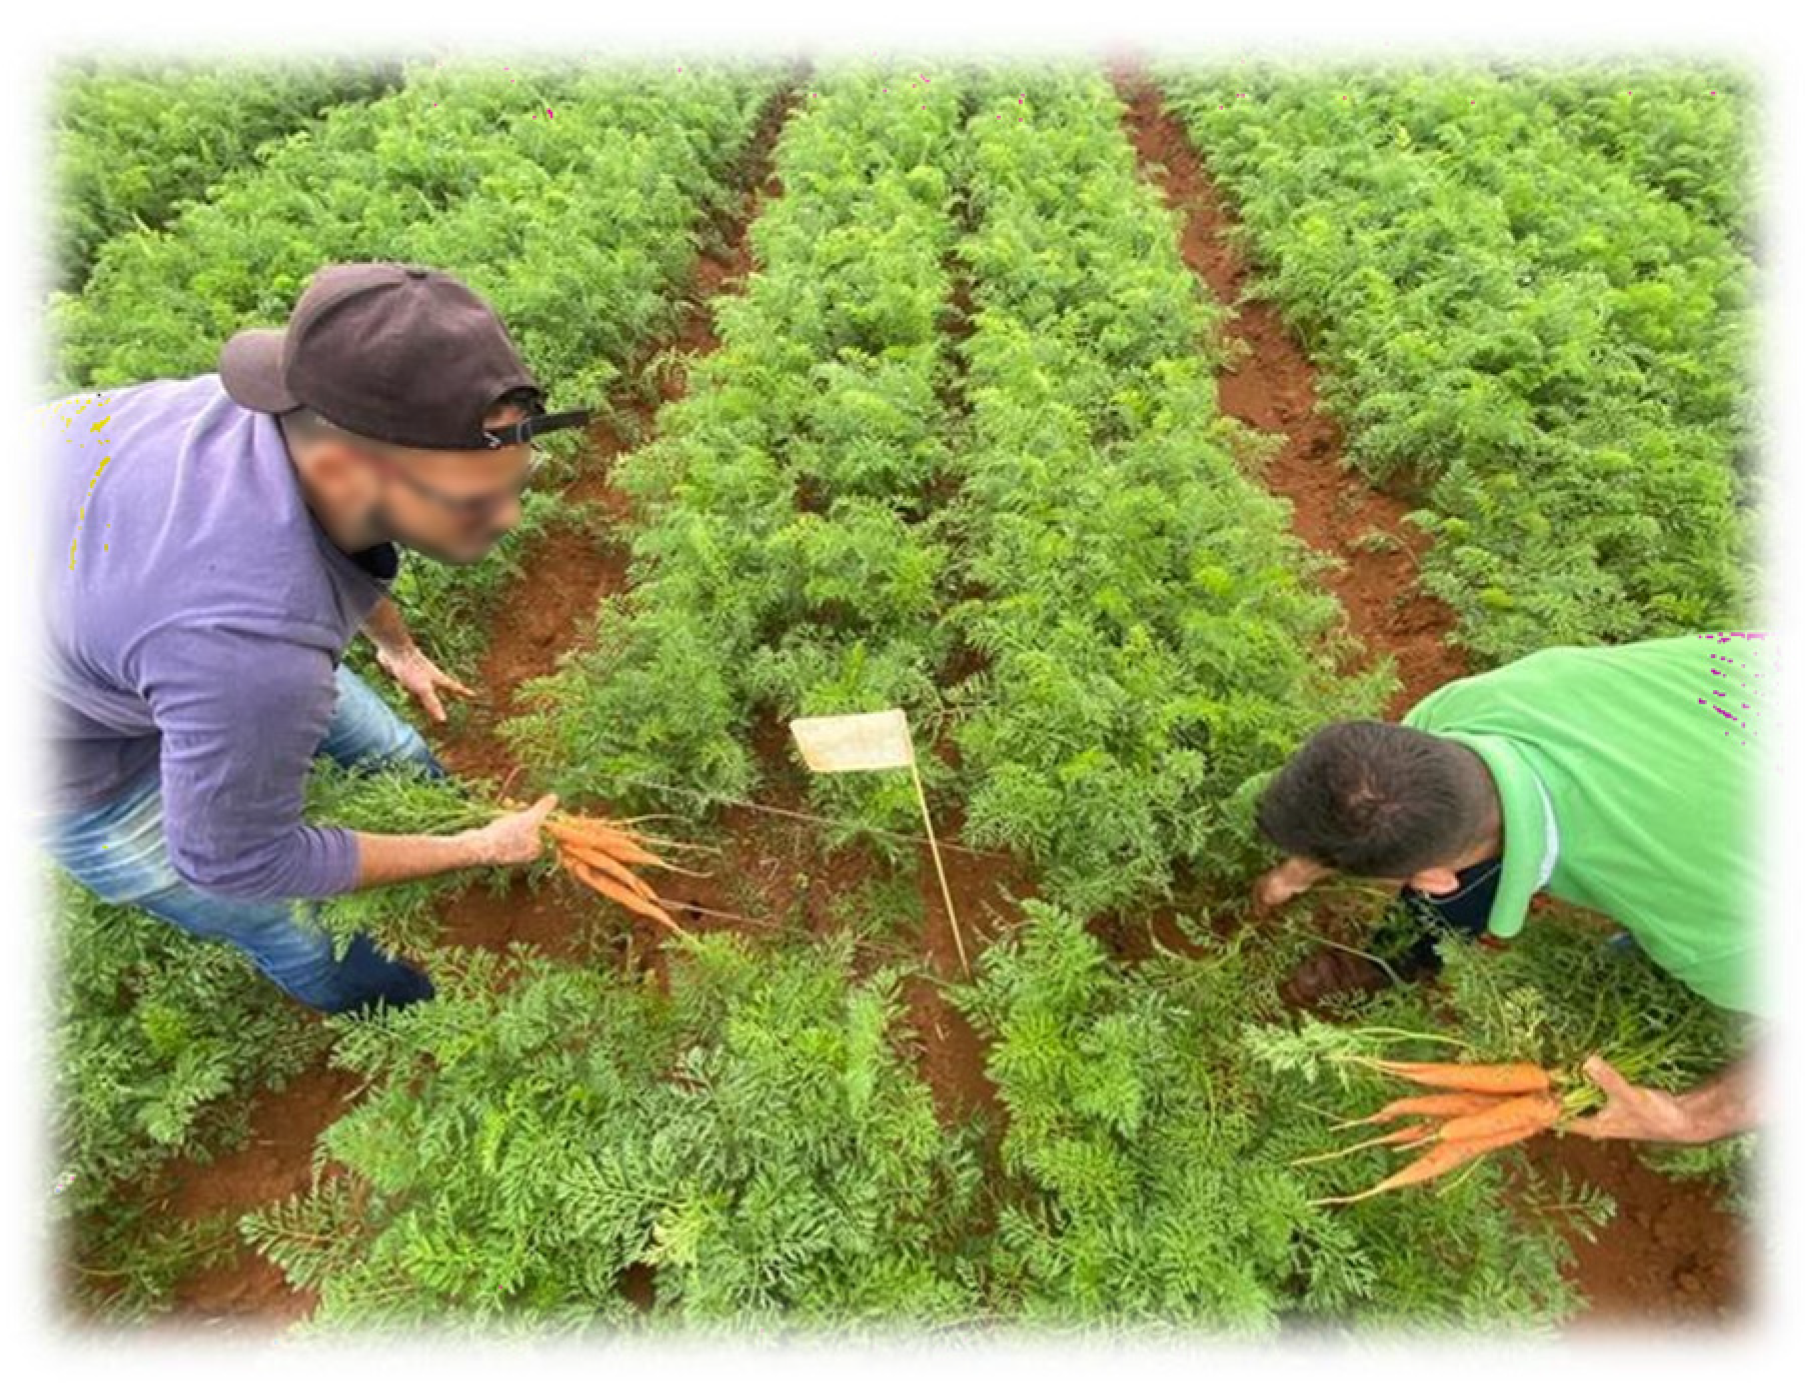
2.2. Root Sampling and Biometric Assessment

Root sampling consisted of two data collection periods: 82 and 116 DAS, with 50 points at each data collection in both experimental areas (total: 200 sampling points). These periods were chosen according to the best time for crop modeling according to Suarez et al. [13], corresponding to the full radial filling (82 DAS) and the date before crop harvesting (116 DAS). The climatic conditions were 1600 degree-days and 2260 degree-days (base temperature of 3 °C) for 82 and 116 DAS, respectively (Figure 2).
Irrigation and cultural treatments were carried out according to the needs of the crop, which were monitored daily by a regional station. A hailstorm event occurred in Site 1 between 82 and 116 DAS, momentarily interfering with the aerial part of the plants. One week after rainfall, with a nutritional management strategy, the plants were recovered.
All sampling points were georeferenced with a GNSS (Global Navigation Satellite System) receiver. The sampling points were spaced using a grid of 30 m × 30 m, which was defined to reduce the interference between the sampling points and satellite imagery for obtaining the VIs. The collection of carrot roots was carried out manually within the beds containing four double-sowing lines. A metal template of 1.60 m × 0.155 m was used to delimit the sampling area of 0.25 m2. This sampling area was chosen by observing the mass of the carrots and to facilitate the data collection in the field (Figure 3).
Based on the carrots collected in the delimited area, the total fresh biomass and the biomass of the aerial part and roots were determined separately. The aerial part and roots were detached close to the base of the root using a knife at the field. A semi-analytical balance was used with an accuracy of 0.01 g (grams) to measure crop biomass. The crop yield was extrapolated from the mass in grams over the area of 0.25 m2 determined for boxes per hectare (29 kg box, commercial standardization of the carrots before washing process). Then, three carrots were subsampled per sampling point for the biometric analysis of the root length and diameter. These roots were sent to the laboratory for qualitative analysis.

2.3. Qualitative Analysis of the Roots

The subsampled carrots were sanitized and placed in identified plastic bags and stored under refrigeration at 2 °C to prevent the loss of their characteristics. Total soluble solids (°Brix) and firmness readings for quality analysis were taken two days after collecting the three carrots per sampling point to obtain an average °Brix per sampling point. For the analysis of total soluble solids (SST or °Brix), the refractive index method was used [24]. °Brix determination was carried out using the VX0-90 portable digital refractometer model (accuracy of 0.2%) with automatic temperature compensation to 20 °C. The pure and undiluted carrot liquid was measured after maceration and expressed in the form of a percentage [25]. The assessment of root firmness also used a direct method with a portable MOD model penetrometer PTR-300 (accuracy of 0.5%) equipped with an 8 mm diameter tip [26]. Three readings were taken near the base of the roots to calculate the average firmness per sample point, and the results were expressed in Newton (N).

2.4. The Acquisition and Processing of Satellite Imagery

Satellite images were required to establish the relationship between biometric and qualitative variables of the plant roots and vegetation indices during the data collection period. The satellite images were acquired using the PlanetScope CubeSat platform, which consists of 148 different types of nanosatellites in orbit with high spatial and temporal resolutions that capture images at wavelengths of spectrum: 618 to 780 nm (red), 497 to 570 nm (green), 427 to 476 nm (blue), and above 700 nm (NIR) with a spatial resolution of 3.0 m and a spectral resolution equal to four [27]. The images from the experimental areas were requested and subsequently downloaded for the calculation of the selected vegetation indices based on the spectral bands available.
An interval of a maximum of three to five days was recommended before collecting samples in the field to extract vegetation indices due to the occurrence of clouds. The VIs that were calculated and analyzed were the NDVI (normalized difference vegetation index [28]), SAVI (soil adjusted vegetation index [29]), EVI (enhanced vegetation index [30]), and RDVI (re-normalized difference vegetation index [31]). These VIs were chosen because they are widely used in agronomic studies, mainly for underground crops. The VI values were extracted from each georeferenced sampling point for each experimental area and processed in QGIS 3.4. The constants in each equation from the VIs were determined as L = 1.0; G = 2.5; C1 = 6; and C2 = 7.5.

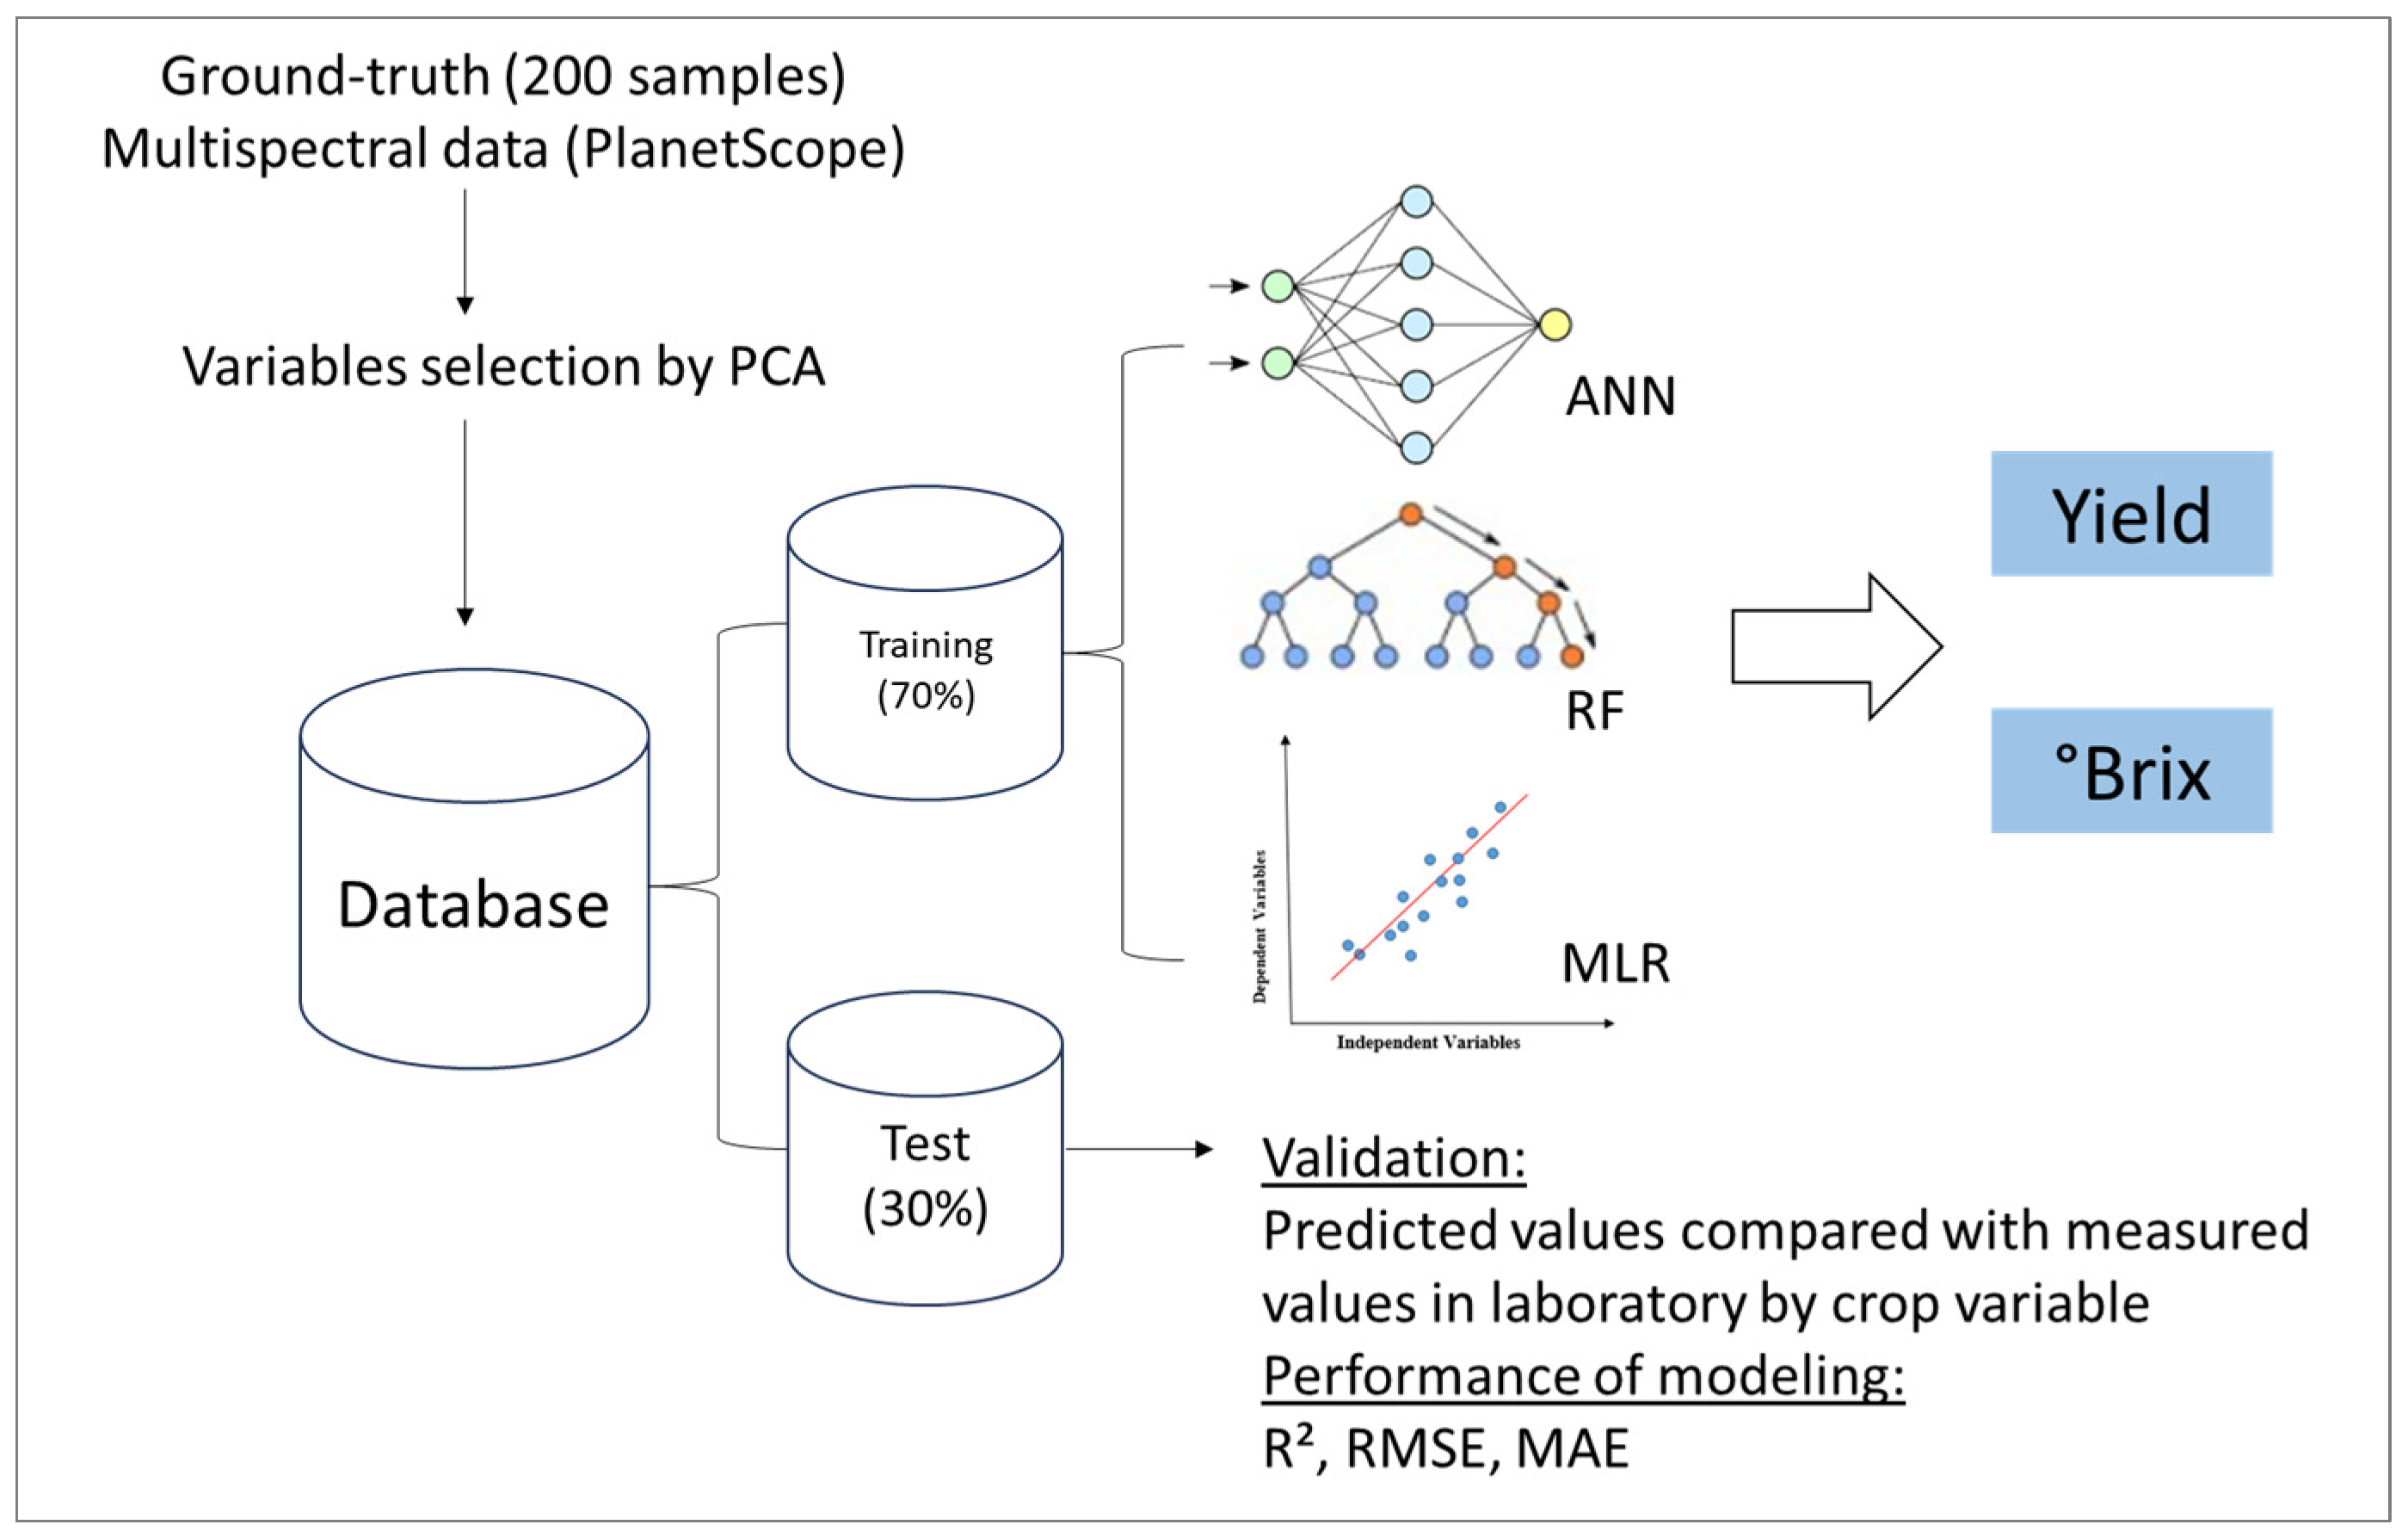
2.5. Development of Predictive Models

Principal component analysis (PCA) is based on multivariate statistics to analyze and interpret the interrelationships between variables according to their dimensions. Each variable considered in the analysis becomes a component. The components can be extracted using a covariance matrix or correlation matrix. PCA is a non-parametric linear statistic most used to understand and orthogonalize the dataset [32,33]. This analysis was carried out to filter the most important variables, aiming to find the smallest set of these with a minimal loss of information. PCA was performed in R 4.3.2 and selected the variables that were used in the multiple output regression algorithms to predict carrot yield and quality individually.
Before submitting the dataset to the predictive models, the outliers were removed and scattered in data points observed on the PCA for the subsequent analyzes of correlation between the variables. The dataset was normalized for training and testing in modeling. To predict the carrot yield and quality by vegetation indices, three regression methods were used: an Artificial Neural Network (ANN), Random Forest (RF), and Multiple Linear Regression (MLR). For the training and testing of the predictive models, the data were split by sampling period (82 and 116 DAS), which were subsequently randomly divided into 70% and 30% of the dataset, respectively, as a manner of reducing bias and overfitting the models. This procedure was carried out to have points of calibration on modeling for both periods of sampling. A cross-validation was carried out to test and verify the performance of prediction in the training process of all regression methods.
An ANN is a supervised machine learning technique that uses artificial neurons that are capable of learning patterns in a dataset from examples by adjusting the weights between connections of neurons according to the training data [34]. The RF algorithm is also a supervised model commonly used to improve the accuracy of the predictive models by joining other simpler models. In this model, the number of trees and prediction variables at each node are defined according to the minor error observed [35]. MLR is considered a technique that considers the relationship of predictor variables with a single criterion variable, being successful in modeling biological processes. Its structure is described by equating a regression in the estimation of regression coefficients, measures of overall model fit, and the contribution of individual predictor variables [36,37]. The performance of the predictive models was evaluated by means of accuracy (R2), root-mean-squared error (RMSE), and mean absolute error (MAE). All processes of modeling were performed on Python 3.12.0 (JupyterLab interface) using the Numpy, Pandas, Scipy Stats, and Scikit-learn libraries.
A synthesis of the proposed methodology is depicted in Figure 4. It includes the (i) manual data collection of 200 sampling points in the field (ground-truth); (ii) acquisition of orbital images with multispectral data; (iii) statistical correlation among the sampling points and calculated VIs and the selection of variables by the PCA; (iv) splitting the database into the training and test datasets; (v) developing predictive models for carrot yield and quality; and (vi) comparing the performance of each modeling by the selected metrics (R2, MAE, and RMSE).

3. Results and Discussion

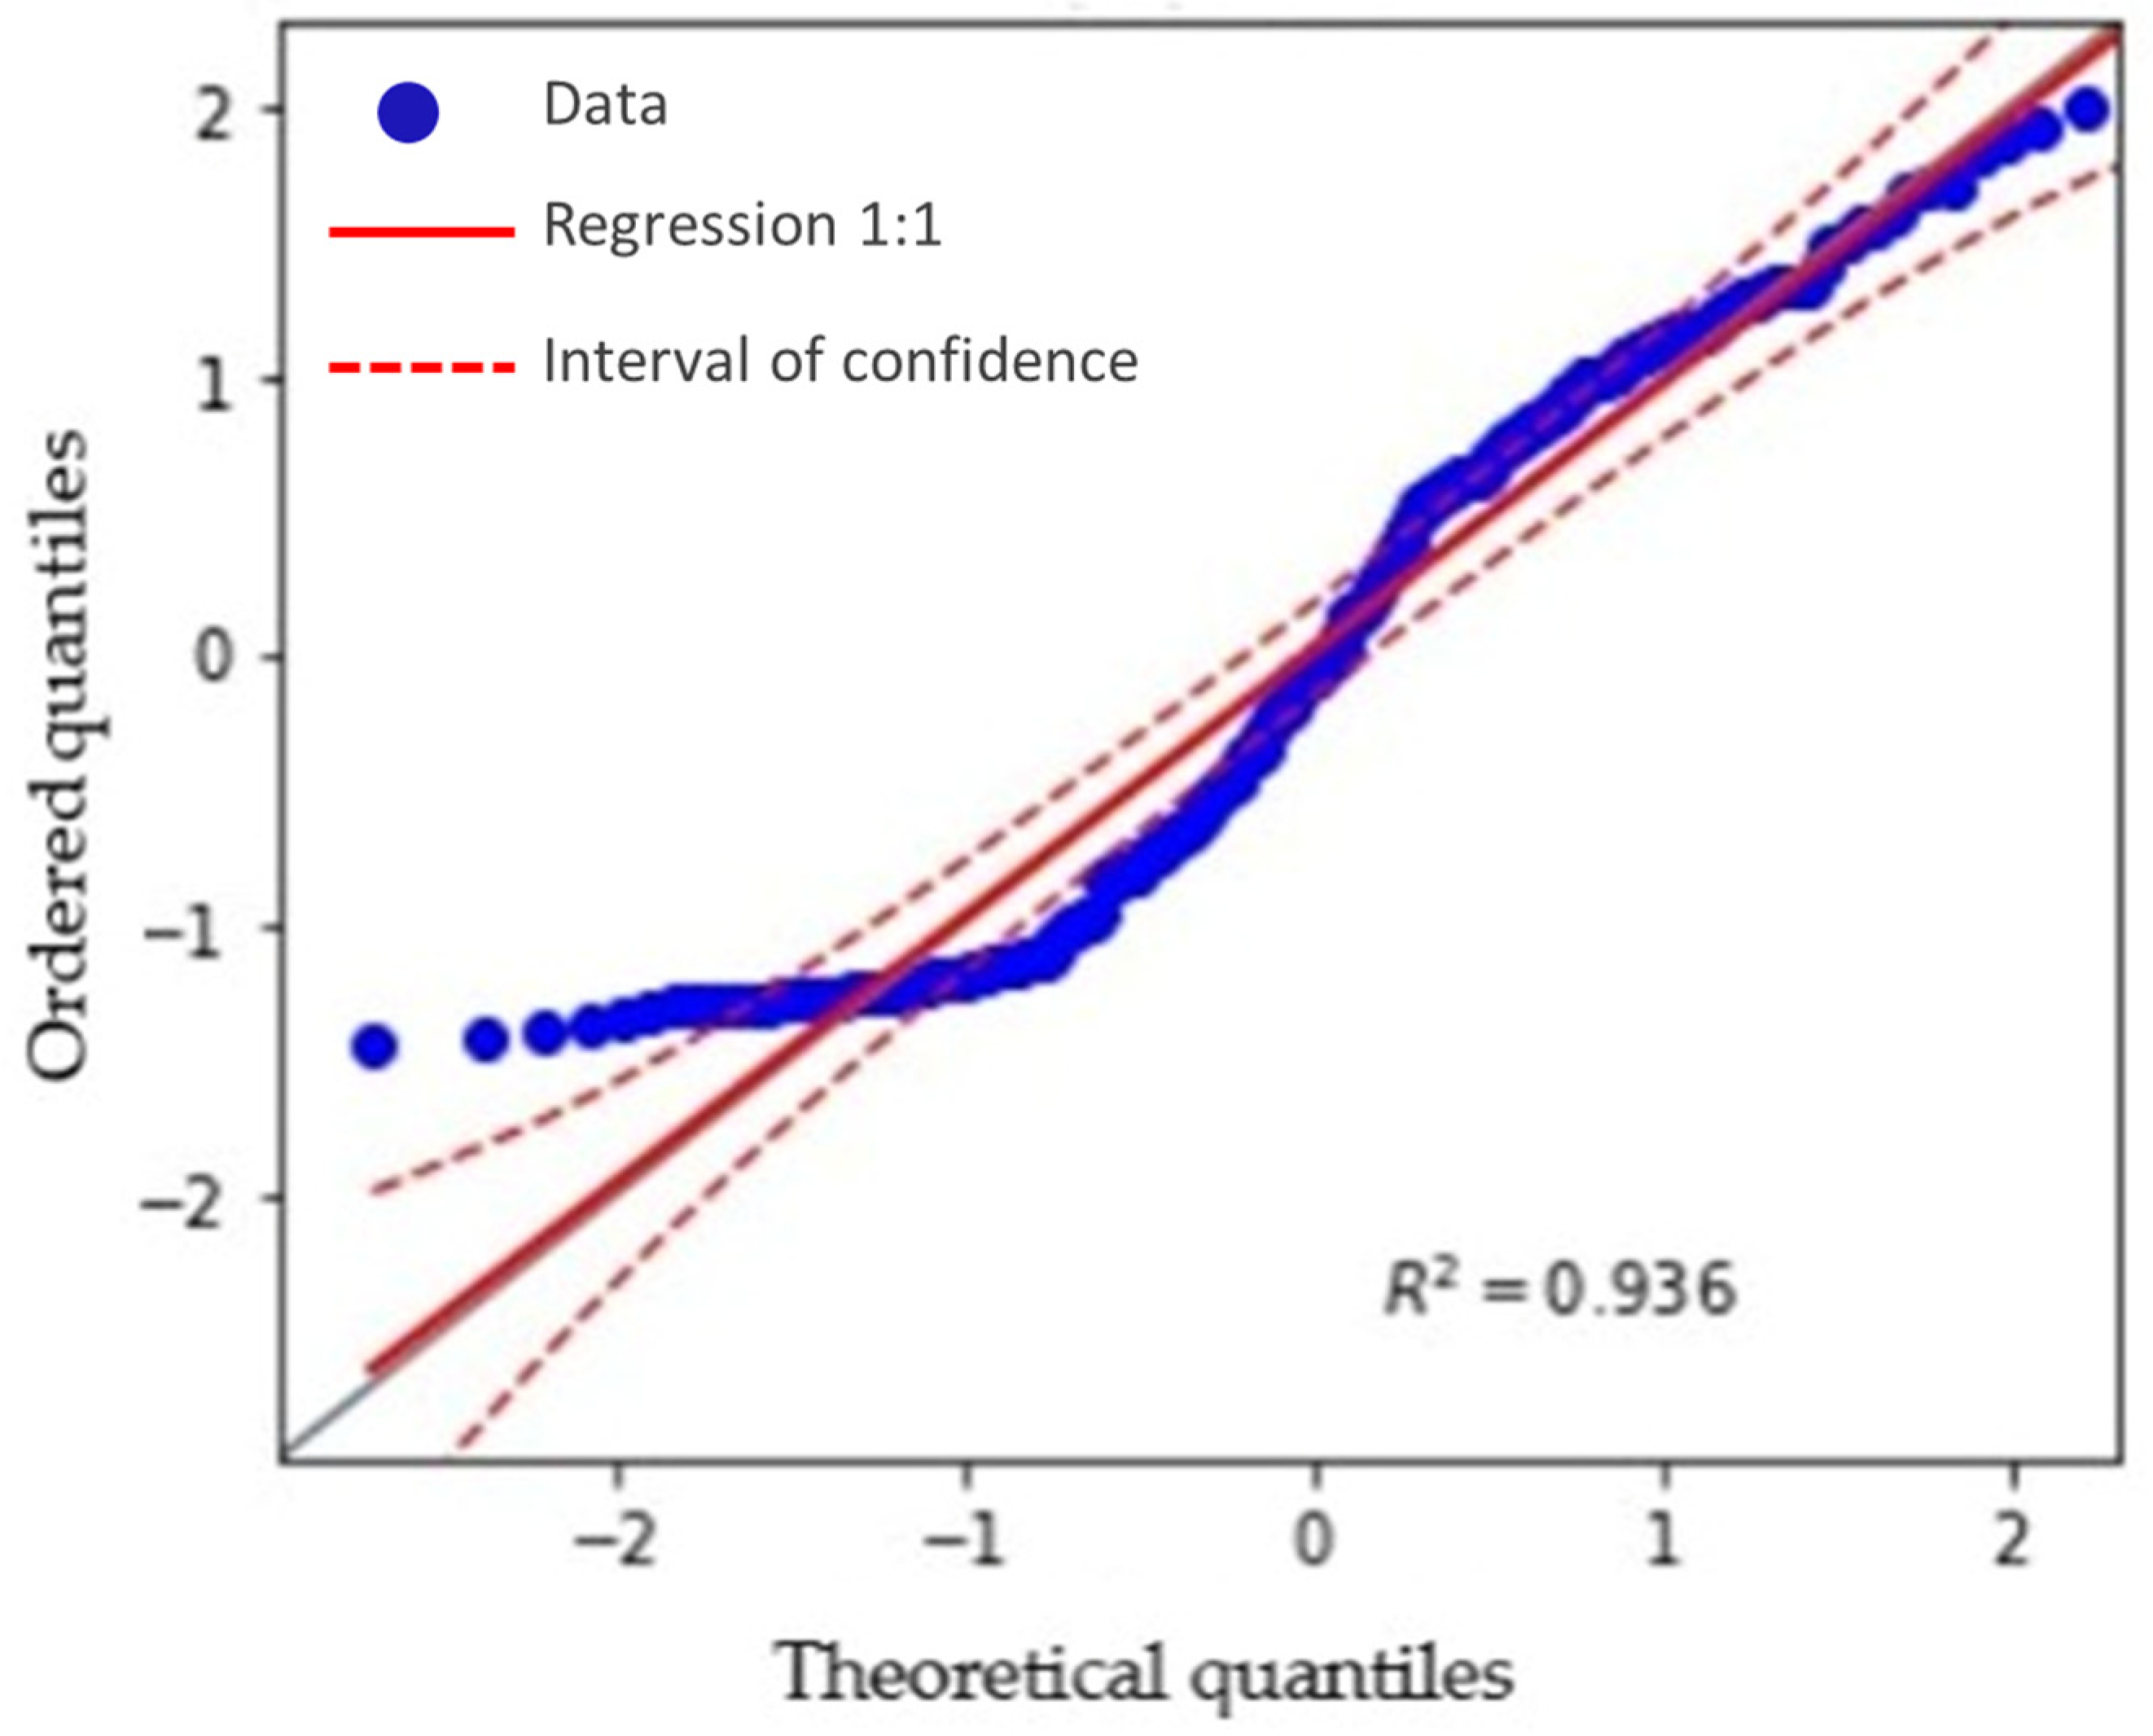
3.1. Normality of the Dataset

The total fresh mass of the carrot plants was within the normal curve, with an R2 value of 0.94 (Figure 5). The PCA showed that the data collected in the experimental areas for the qualitative and quantitative variables on the different dates explained 89.4% of the carrot variation in the field, being above the critical limit of 80% for PCAs [38] (Figure 6).
The variables that are correlated with CP1 and CP2 are the most important in explaining the variability in the dataset. The PCA also highlighted the temporal influence on the arrangement and structuring of eigenvalues and eigenvectors according to the period of data collection. For component 1, there was a strong correlation for the NDVI at 116 DAS in Site 2, where it contributed more effectively to the characterization of the root mass. The SAVI obtained the best results at 116 DAS for Site 2 for the quantitative variables, such as the total mass and root length of the crop.
In component 2, the EVI had a strong positive correlation at 82 DAS for Site 2. The RDVI, root diameter, °Brix, and firmness had little explanatory power, regardless of the period of data collection.
The better performance of the variables in Site 2 can be explained by the fact that in Site 1, there was a hailstorm between 82 and 116 DAS, which may have compromised the modeling of the quality of the roots. Concerning the °Brix and firmness variables in the results generated by the PCA, none of the machine learning models were able to accurately predict root quality in this study. Future studies can be developed, including the collection of samples at the end of the crop cycle and the assessment of the root mass with automated solutions, such as data sampling using multispectral sensors on robotic platforms over the field.
The descriptive statistics of all the measured data by experimental area is shown in Table 1. The numerical values of the VIs were obtained from orbital images by image processing, and the crop variables were measured in the laboratory prior to harvesting. It was observed that there was a higher variation in the values of SAVI compared to other VIs that could be attributed to the influence of soil reflectance and low vegetation cover at the initial stages of crop development, which implicated a high coefficient of variation on Site 1 (CV = 32%). The variable air mass had a higher CV compared to the other crop variables, indicating that the aerial part of the vegetable was not uniform over the experimental site. It can occur due to the different levels of solar radiation over the field and the maturation processes of the crop.

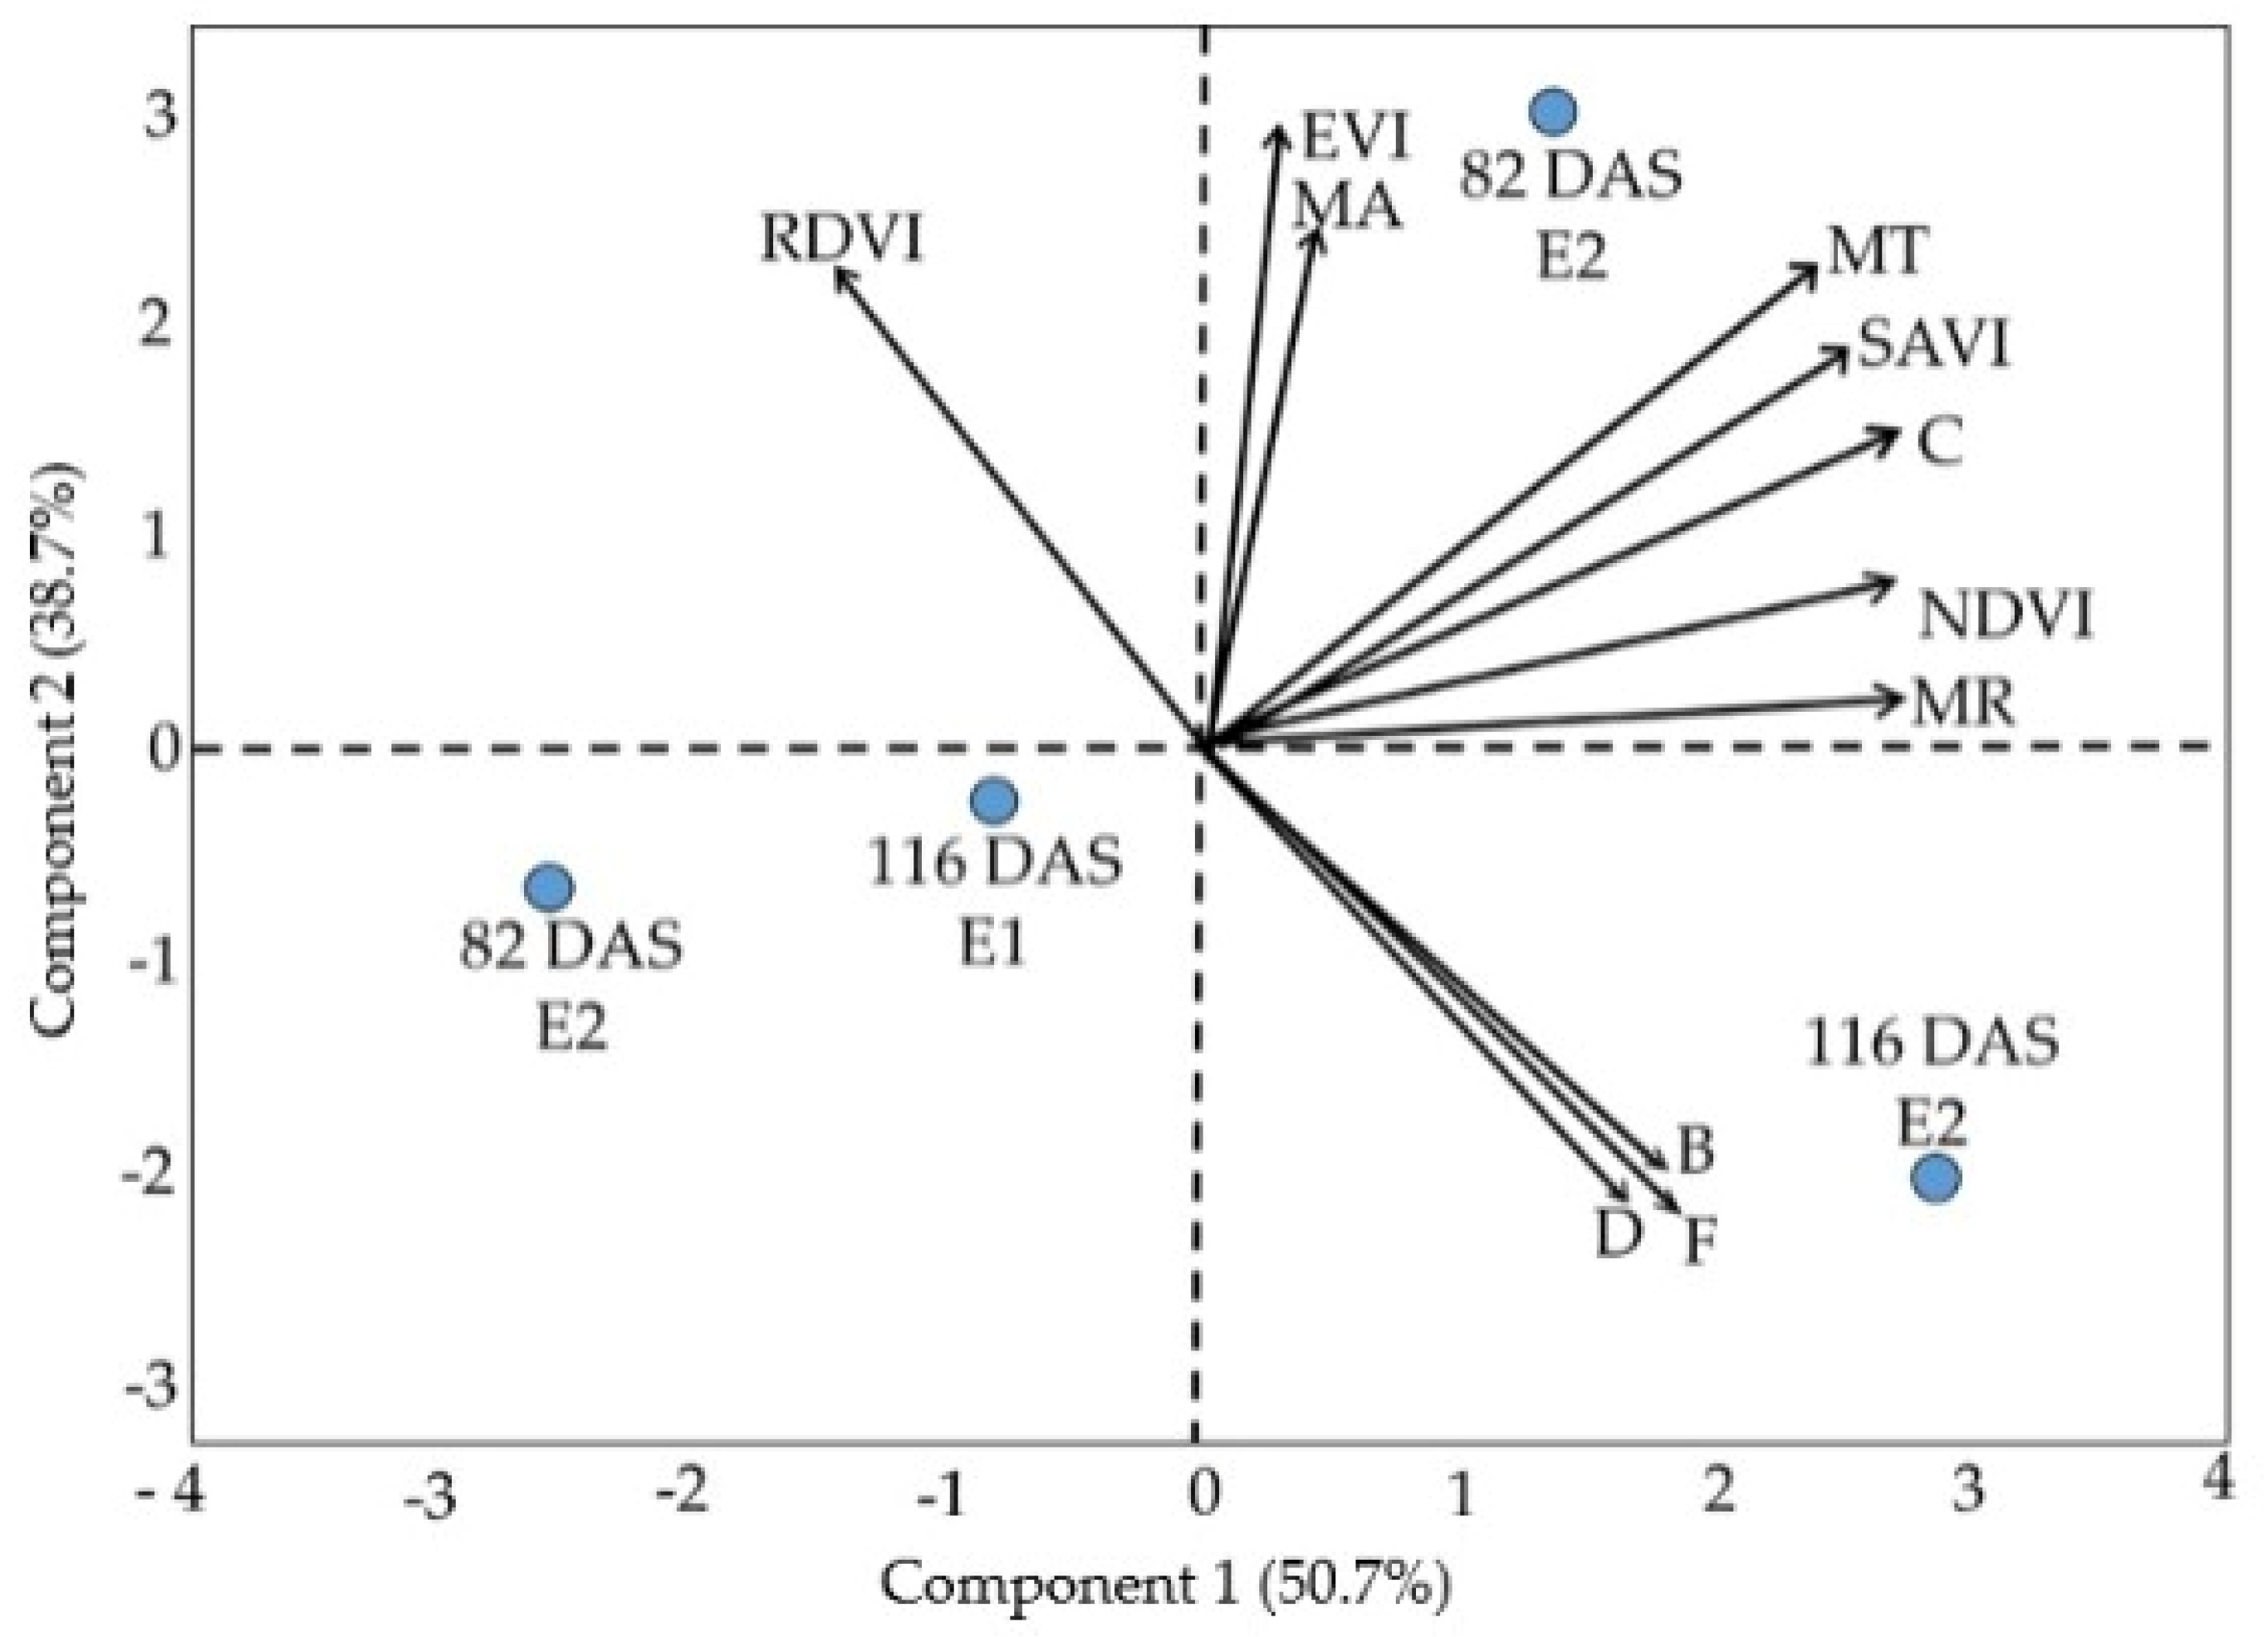
3.2. Correlations between Variables

The results of the statistical correlations (Table 2) indicated that the SAVI and NDVI stood out significantly in relation to the variables of carrot yield (root mass) and quality (firmness). It was observed that carrot yield showed high values of correlation with the SAVI and NDVI. The total mass was correlated by 78 and 68%, respectively. The SAVI and NDVI correlated with root mass at 67 and 78%, respectively. Root length had a low correlation for measuring the crop yield and quality for all variables studied. The qualitative attributes °Brix and firmness were not correlated with each other and showed a low relationship with the root mass of the crop. An inverse negative relationship was observed between the RDVI and root diameter (r = −0.67). The diameter of the roots is directly and linearly proportional to the carrot’s total biomass and root yield [39]. In this study, root mass and diameter correlated by 49%.
The SAVI also stood out in other studies with crops that have a low area of vegetative coverage at the beginning of the cycle and organs positioned below the ground. The good performance of the SAVI correlation with the total mass and root mass assessments is linked to the correction of soil reflectance, which can mask the real reflectance of the crop’s vegetation [40]. Other methodologies to determine °Brix and firmness should be tested to improve the capacity to understand the in-field variations in total soluble solid content and root texture. Reading the °Brix value on the refractometer is simple and quick. However, there must be a standardization of the time of collection of the food to be analyzed and checking the calibration of the equipment. This standardization is already recommended for fruits and other foods [41], but there is no clear and specific methodology for carrots.
The measurement of crop biometrics, as well as qualitative characteristics, should be carried out to determine the phase indicated after half of the cycle as it is more related to the real yield of the crop. After the slow phase of germination and emergence of carrot seedlings, the root develops in length in relation to the soil surface until around 45 DAS. Soon after this growth in depth, the roots grow radially and increase their diameter. The aerial part stabilizes at this stage, while the roots grow in diameter. The closer to the end of the crop cycle, the greater the accuracy of the predictive models will be, because the crop has already defined its potential for production (maximum accumulation of reserve substances and ideal size required by the commercial classification).
Carrot cultivation lacks modeling methods focused on root quality parameters. We brought some answers for the continuity of the qualitative modeling of the crop. It was observed that no regression model was able to predict the quality of the roots. Although carrot quality modeling was not obtained in this study, the use of simple and accessible AI tools can make them more applicable in the field for decision-making purposes regarding the management of the crop. New studies with intensive data collection at the end of the crop cycle could accurately predict root quality before commercial harvest.

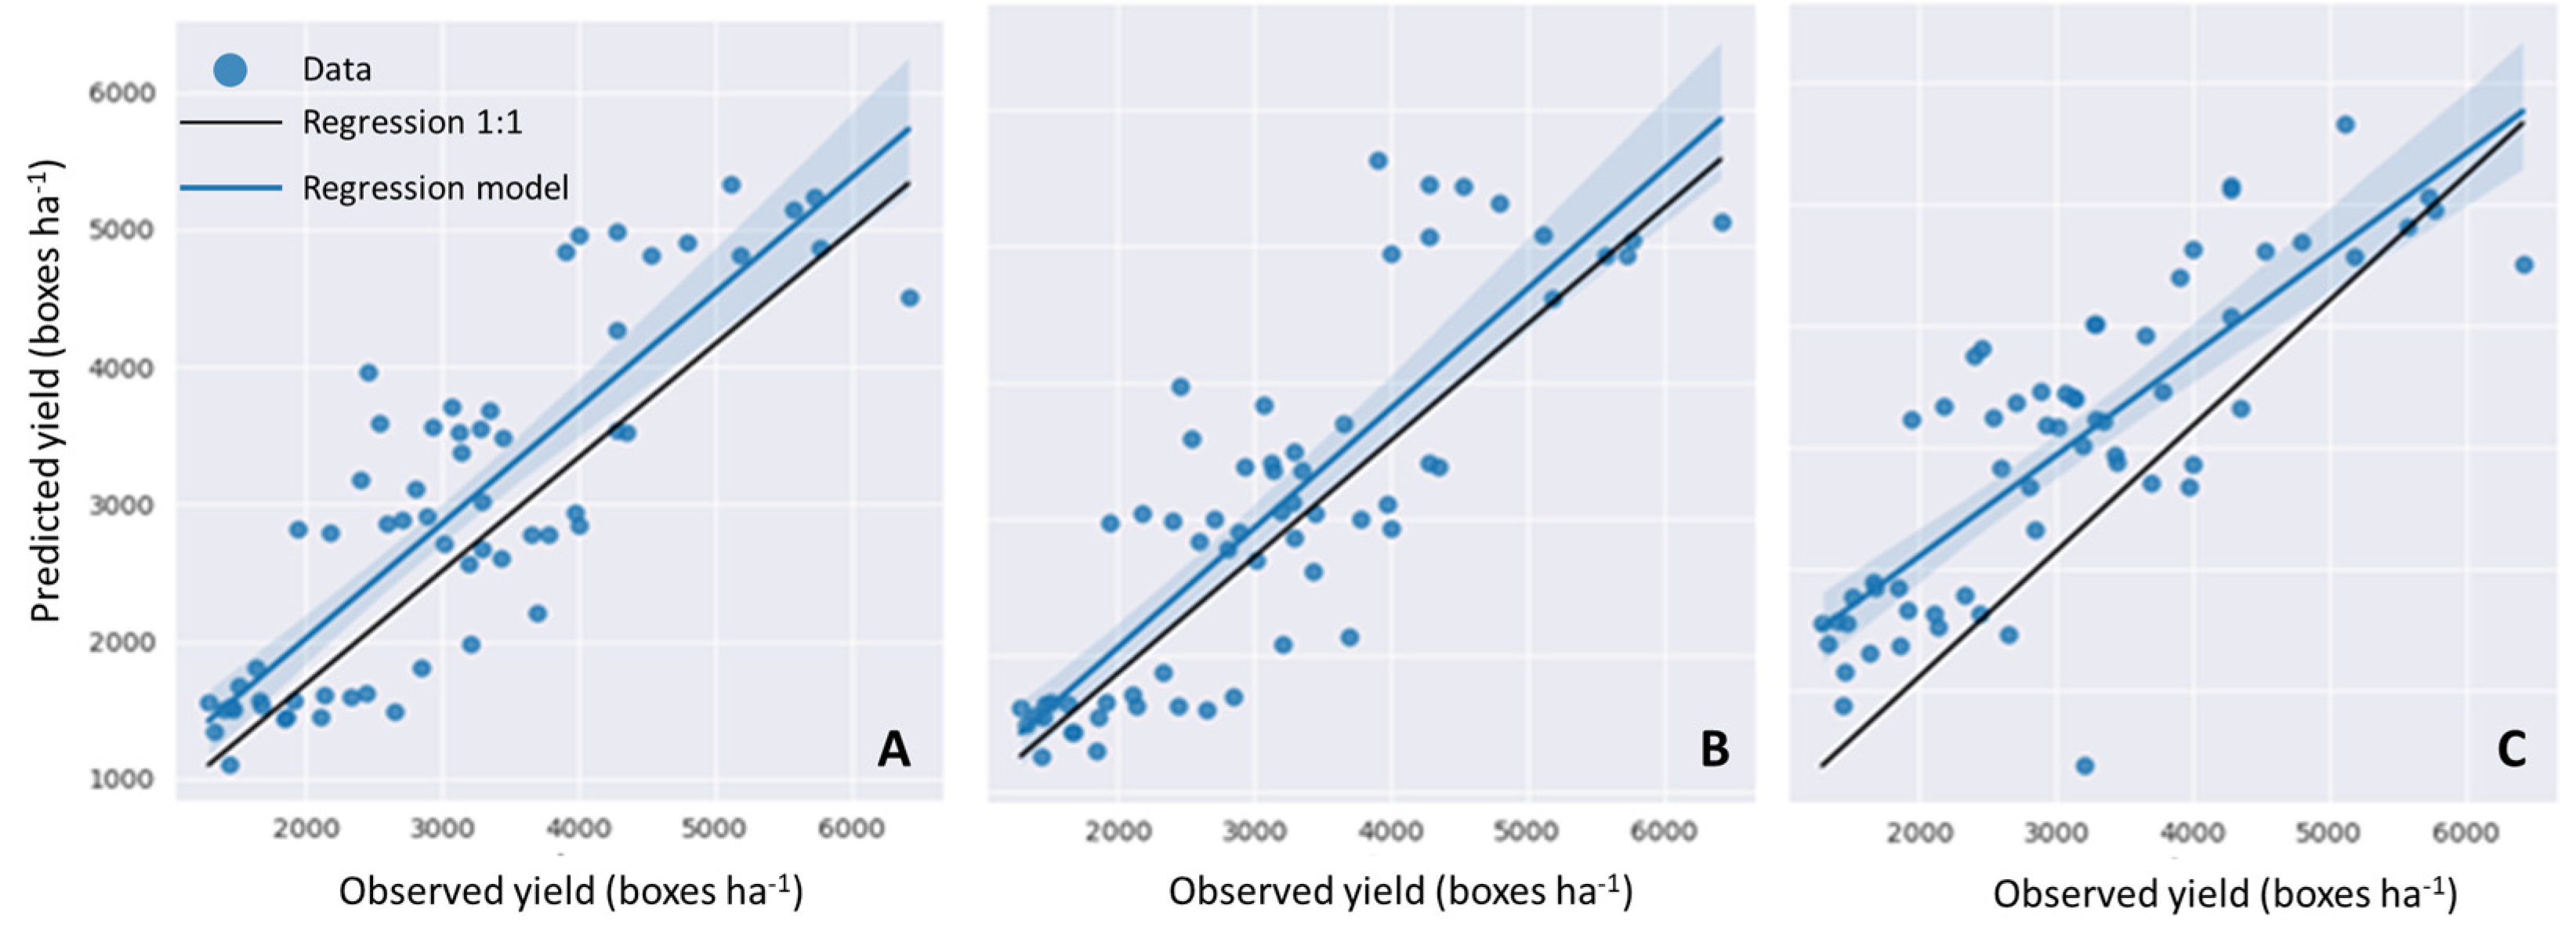
3.3. Assesement of Model Performance

The ANN algorithm proved to be accurate in predicting carrot yield. The model’s performance after training had an R2 value of 0.68 and a RMSE of 23.80 boxes ha−1 (Figure 7a). For training and testing the model, the SAVI and NDVI were selected previously, which obtained a better correlation with crop yield. These Vis are considered capable of deriving relationships between the intrinsic characteristics of crop physiology and monitoring variations in underground crops in the field [42]. The performance of the regression based on the RF algorithm comprised an R2 value of 0.67 and a RMSE of 23.93 boxes ha−1 (Figure 7b) using the same Vis. The results from RF modeling are also in agreement with the coefficients found in the literature for underground crops [43,44]. The results from the MLR model, after training, had a performance comprising an R2 value of 0.61 and a RMSE of 24.21 boxes ha−1 (Figure 7c). The advantage of this model is its simple structuring of the predictor variables for developing the regression that explains the outputs. However, it has the disadvantage of the occurrence of multicollinearity, which implies a high degree of correlation between the independent variables and impacts the estimation of the regression coefficients.
Machine learning algorithms are continually employed to build models that predict crop yield. There are no definitive conclusions about the best fitting model; however, more complex models, such as ANNs, stand out [45,46]. The ANN model was superior in terms of its accuracy and minor error to predict carrot yield at the field level, followed by the RF and MLR models (Table 3). Although the ANN algorithm is considered ineffective on a sub-regional scale with a relatively limited database [46]. The results found in this work showed that the model was able to model crop yield with greater accuracy compared to the RF and MLR methods. R2 values above 0.5 in underground crop modeling are not always found in the literature using Vis to predict underground crop yield, even with the application of ML methods [11].
ANNs and MLR were used in a study on three types of carrots by the authors of [47] to understand the relationship between root volume and agroclimatic factors on yield. These authors found adjustments of 0.80 to 0.90 for modeling carrot yield. Tedesco et al. [18] modeled the yield of sweet potato with RF regression and obtained errors ranging from 2.50 to 2.90 t ha−1, regardless of the stage of the crop-growing season. The SAVI also resulted in better performance in the RF model for this underground crop in this study. Wei et al. [11] modeled carrot yield with the RF algorithm using raw spectral bands and obtained an R2 value of 0.82 and an average error of 2.64 t ha−1. Madugundu et al. [21] concluded that the SAVI correlated satisfactorily with carrot yield in their regression models with an error of 4.50 t ha−1. Abbas et al. [48] studied ML algorithms to predict potato yield with a RMSE ranging from 5.97 to 6.17 t ha−1. The MLR model of this study is similar to that reported by Suarez et al. [12]. The authors had optimal regression adjustments between the VIs and total carrot root production and its size [49], such as the EVI (R2 0.58), RDVI (R2 0.78), and SAVI (R2 0.77).
The findings of this study could be used in regional cooperatives of agriculture to share the estimate of carrot production, avoid crop damage by the tendency of meteorological data, and manage field conditions to obtain a higher quality of the product (added value to the agroindustry chain). It is common to share this kind of information among farmers in Brazil by means of regional or local agricultural cooperatives.
The potential ethical and social implications of the adoption of AI tools in the agroindustry is related to some principles, such as transparency, privacy, sustainability, and responsibility [50]. So, the development of the proposed methodology from this study requires attending to those principles to enable sharing data (imagery, meteorological, and crop variables) and performing computational modeling to validate it on national conditions of production on a large scale.
The implications of this study for the future of agricultural production are related to the integration of multiple sources of data to optimize crop yield and quality, manage the input applications in the field (water, macronutrients, and energy) to reduce the negative impact on the environment, and prove the mechanized operations based on historical databases for sustainability purposes.

4. Conclusions

This study tested different AI algorithms to predict carrot yield and quality based on tropical conditions and previous harvesting, using reflectance data and ground-truth data as input variables in predictive modeling. The satellite imagery was selected according to the crop’s phenology, which enables us to observe the crop’s response and its spectral reflectance by the days after sowing for both experimental areas. The total mass under both field conditions demonstrated higher variability, indicating a non-uniformity of the cover plants despite having the same agricultural practices related to the plant’s nutrition and irrigation management. The SAVI and NDVI indices from orbital images showed promising results on predicting carrot yield, demonstrated by the results of correlation and relevance as input variables in modeling. Principal component analysis revealed the temporal influence on predictor variables, which can be useful for optimizing crop monitoring over the fields. The ANN algorithm demonstrated greater accuracy and lower error on crop yield prediction in relation to the RF and MLR methods. Although crop quality did not achieve satisfactory results in this study, it was possible to provide methodological contextualization for future research and data analysis. This study enables us to implement AI modeling on agricultural scenarios as an alternative manner of field management based on data-driven solutions and integrating multiple sources of georeferenced data.

Author Contributions

Conceptualization: Y.K.d.L.S. and C.E.A.F.; Data analysis: Y.K.d.L.S.; Formal analysis: Y.K.d.L.S., C.E.A.F. and T.F.C.; Investigation: Y.K.d.L.S.; Methodology: Y.K.d.L.S. and T.F.C.; Supervision: C.E.A.F.; Writing—original draft: Y.K.d.L.S. and C.E.A.F.; Writing—review and editing, T.F.C. All authors have read and agreed to the published version of the manuscript.

Funding

This study was financed, in part, by the Coordination for the Improvement of Higher Education Personnel—Brazil (CAPES)—Finance Code 001.

Data Availability Statement

The data presented in this study are available on request from the corresponding author.

Acknowledgments

We would like to thank the volunteer interns, who are undergraduate students and collaborating professors at the Federal University of Viçosa.

Conflicts of Interest

The authors declare no conflicts of interest.

References

  1. Papoutsis, K.; Edelenbos, M. Postharvest environmentally and human-friendly pre-treatments to minimize carrot waste in the supply chain caused by physiological disorders and fungi. Trends Food Sci. Technol. 2021, 112, 88–98. [Google Scholar] [CrossRef]
  2. Kamel, D.G.; Hammam, A.R.A.; Nagm El-diin, M.A.H.; Awasti, N.; Abdel-Rahman, A.M. Nutritional. antioxidant. and antimicrobial assessment of carrot powder and its application as a functional ingredient in probiotic soft cheese. J. Dairy Sci. 2023, 106, 1672–1686. [Google Scholar] [CrossRef] [PubMed]
  3. Wszelaczyńska, E.; Szczepanek, M.; Pobereżny, J.; Kazula, M.J. Effect of biostimulant application and long-term storage on the nutritional value of carrot. Hortic. Bras. 2019, 37, 451–457. [Google Scholar] [CrossRef]
  4. Geofriau, E. Carrot root quality. In Carrots and Related Apiaceae Crop; Geoffriau, E., Simon., P.W., Eds.; CABI: Boston, MA, USA, 2020; pp. 171–184. [Google Scholar]
  5. Turner, S.; Ellison, S.; Senalik, D.A.; Simon, P.W.; Spalding, E.P.; Miller, N.D. An automated, high-throughput image analysis pipeline enables genetic studies of shoot and root morphology in carrot (Daucus carota L.). Front. Plant Sci. 2018, 9, 1703. [Google Scholar] [CrossRef] [PubMed]
  6. Mpemba, O.S.; Du Toit, A.; De Wit, M.; Venter, S.L.; Hugo, A. Edible characteristics of two nopalito cultivars compared to selected popular vegetables. Acta Hortic. 2022, 1343, 409–416. [Google Scholar] [CrossRef]
  7. Chevalier, W.; Moussa, S.A.; Ottoni, M.M.N.; Dubois-Laurent, C.; Huet, S.; Aubert, C.; Desnoues, E.; Navez, B.; Cottet, V.; Chalot, G.; et al. Evaluation of pedoclimatic factors and cultural practices effects on carotenoid and sugar content in carrot root. Eur. J. Agron. 2022, 140, 126577. [Google Scholar] [CrossRef]
  8. Baranski, R.; Maksylewicz-Kaul, A.; Nothnagel, T.; Cavagnaro, P.F.; Simon, P.W.; Grzebelus, D. Genetic diversity of carrot (Daucus carota L.) cultivars revealed by analysis of SSR loci. Genet. Resour. Crop Evol. 2012, 59, 163–170. [Google Scholar] [CrossRef]
  9. Simon, P.W.; Grzebelus, D. Carrot Genetics and Breeding. In Carrots and Related Apiaceae Crop; Geoffriau, E., Simon, P.W., Eds.; CABI: Boston, MA, USA, 2020; pp. 61–75. [Google Scholar]
  10. Buttery, R.G.; Seifert, R.M.; Guadagni, D.G.; Black, D.R.; Ling, L. Characterization of some volatile constituents of carrots. J. Agric. Food Chem. 1968, 16, 1009–1015. [Google Scholar] [CrossRef]
  11. Wei, M.C.F.; Maldaner, L.F.; Ottoni, P.M.N.; Molin, J.P. Carrot Yield Mapping: A Precision Agriculture Approach Based on Machine Learning. AI 2020, 1, 229–241. [Google Scholar] [CrossRef]
  12. Suarez, L.A.; Robson, A.; McPhee, J.; O’Halloran, J.; van Sprang, C. Accuracy of carrot yield forecasting using proximal hyperspectral and satellite multispectral data. Precis. Agric. 2020, 21, 1304–1326. [Google Scholar] [CrossRef]
  13. Suarez, L.; Robertson-Dean, M.; Brinkhoff, J.; Robson, A. Forecasting carrot yield with optimal timing of Sentinel 2 image acquisition. Precis. Agric. 2023. [Google Scholar] [CrossRef]
  14. Stamford, J.D.; Vialet-Chabrand, S.; Cameron, I.; Lawson, T. Development of an accurate and low-cost NDVI imaging system to assess plant health. Plant Methods 2023, 19, 9. [Google Scholar] [CrossRef] [PubMed]
  15. Hossain, D.; Imtiaz, M.H.; Sazonov, E. Comparison of wearable sensors for estimating chewing force. IEEE Sens. J. 2020, 20, 5379–5388. [Google Scholar] [CrossRef]
  16. Rasmussen, J.; Ntakos, G.; Nielsen, J.; Svensgaard, J.; Poulsen, R.N.; Christensen, S. Are vegetation indices derived from consumer-grade cameras mounted on UAVs sufficiently reliable for assessing experimental plots? Eur. J. Agron. 2016, 74, 75–92. [Google Scholar] [CrossRef]
  17. Mkhabela, M.S.; Bullock, P.; Raj, S.; Wang, S.; Yang, Y. Crop yield forecasting on the Canadian prairies using MODIS NDVI data. Agric. For. Meteorol. 2011, 151, 385–393. [Google Scholar] [CrossRef]
  18. Tedesco, D.; Almeida Moreira, B.R.d.; Barbosa Júnior, M.R.; Papa, J.P.; da Silva, R.P. Predicting on multi-target regression for the yield of sweet potato by the market class of its roots upon vegetation indices. Comput. Electron. Agric. 2021, 191, 106544. [Google Scholar] [CrossRef]
  19. Vaiphasa, C. Consideração de técnicas de suavização para sensoriamento remoto hiperespectral. J. ISPRS De Fotogram. E Sensoriamento Remoto 2006, 60, 91–99. [Google Scholar] [CrossRef]
  20. Lyon, R.G. Understanding Digital Signal Processing, 2nd ed.; Prentice Hall: Upper SaddleRiver, NJ, USA, 2004; pp. 556–561. [Google Scholar]
  21. Madugundu, R.; Al-Gaadi, K.A.; Tola, E.; Hassaballa, A.A.; Kayad, A.G. Utilization of Landsat-8 data for the estimation of carrot and maize crop water footprint under the arid climate of Saudi Arabia. PLoS ONE 2018, 13, 2. [Google Scholar] [CrossRef]
  22. Subeesh, A.; Mehta, C.R. Automation and digitization of agriculture using artificial intelligence and internet of things. Artif. Intell. Agric. 2021, 5, 278–291. [Google Scholar] [CrossRef]
  23. Tedesco, D.; Oliveira, M.F.; Santos, A.F.; Silva, E.H.C.; Rolim, G.S.; Silva, R.P. Use of remote sensing to characterize the phenological development and to predict sweet potato yield in two growing seasons. Eur. J. Agron. 2021, 129, 126337. [Google Scholar] [CrossRef]
  24. Adolf, L. Normas Analíticas do Instituto Adolfo Lutz. In Métodos Químicos e Físicos Para Análise De Alimentos, 3rd ed.; IMESP: São Paulo, Brazil, 1985; Volume 1, pp. 181–182. [Google Scholar]
  25. Adolfo, L. Métodos Físico-Químicos Para Análise De Alimentos: Normas Analíticas Do Instituto Adolfo Lutz, 4th ed.; ANVISA: Brasília, Brazil, 2005. [Google Scholar]
  26. Calbo, A.G.; Carmelo, L.G.P. Fisiologia pós-colheita—Métodos macroscópicos e instrumentos. In Instrumentação Pós-Colheita em Frutas e Hortaliças; Embrapa: Brasília, Brazil, 2017; p. 284. [Google Scholar]
  27. Planet Team. Planet Application Program Interface. In Space for Life on Earth; San Francisco, CA, USA. 2019. Available online: https://api.planet.com (accessed on 26 March 2023).
  28. Rouse, J.W.; Haas, R.H.; Schell, J.A.; Deering, D.W. Monitoring Vegetation Systems in the Great Plains with ERTS. Third Earth Resour. Technol. Satell. (ERTS) 1974, 1, 48–62. [Google Scholar]
  29. Huete, A.R. A Soil Adjusted Vegetation Index (SAVI). Remote Sens. Environ. 1988, 25, 295–309. [Google Scholar] [CrossRef]
  30. Huete, A.R.; Didan, K.; Miura, T.; Rodrigues, E.; Goa, X.; Ferreira, L. Overview of the radiometric and biophysical performance of the MODIS vegetation indices. Remote Sens. Environ. 2002, 83, 195–213. [Google Scholar] [CrossRef]
  31. Roujean, J.; Breon, F. Estimating PAR absorbed by vegetation from bidirectional reflectance measurements. Remote Sens. Environ. 1995, 51, 375–384. [Google Scholar] [CrossRef]
  32. Myers, R.H. Classical and Modern Regression with Applications; Duxbury Press: Belmont, CA, USA, 1990; Volume 2. [Google Scholar]
  33. Jolliffe, I.T.; Cadima, J. Principal component analysis: A review and recent developments. Philos. Trans. R. Soc. A Math. Phys. Eng. Sci. 2016, 374, 20150202. [Google Scholar] [CrossRef]
  34. Mas, J.; Flores, J. The application of artificial neural networks to the analysis of re-motely sensed data. Int. J. Remote Sens. 2008, 29, 617–663. [Google Scholar] [CrossRef]
  35. Breiman, L. Random Forests. Mach. Learn. 2001, 45, 5–32. [Google Scholar] [CrossRef]
  36. Aiken, L.S.; West, S.G.; Pitts, S.C. Multiple linear regression. In Handbook of Psychology; Weiner, I.B., Ed.; John Wiley & Sons: Hoboken, NJ, USA, 2003; Volume 4, pp. 481–507. [Google Scholar]
  37. Freund, R.J.; Wilson, W.J.; Sa, P. Regression Analysis Statistical Modeling of a Response Variable; Elsevier. Inc.: San Diego, CA, USA, 2006; p. 459. [Google Scholar]
  38. Montgomery, D.C.; Peck, E.A.; Vining, G.G. Introduction to Linear Regression Analysis; John Wiley and Sons Inc.: New York, NY, USA, 2006; p. 612. [Google Scholar]
  39. Reid, J.; Gillespie, R. Yield and quality responses of carrots (Daucus carota L.) to water deficits. N. Z. J. Crop Hortic. Sci. 2017, 45, 299–312. [Google Scholar] [CrossRef]
  40. Gocic, M.; Trajkovic, S. Spatiotemporal characteristics of drought in Serbia. J. Hydrol. 2014, 510, 110–123. [Google Scholar] [CrossRef]
  41. Jaywant, S.; Singh, H.; Arif, K. Sensors and instruments for brix measurement: A review. Sensors 2022, 22, 2290. [Google Scholar] [CrossRef] [PubMed]
  42. Pham, H.; Awange, J.; Kuhn, M.; Nguyen, B.; Bui, L. Enhancing Crop Yield Prediction Utilizing Machine Learning on Satellite-Based Vegetation Health Indices. Sensors 2022, 22, 719. [Google Scholar] [CrossRef]
  43. Zhu, J.; Pierskalla, W.P. Applying a weighted random forests method to extract karst sinkholes from LiDAR data. J. Hydrol. 2016, 533, 343–352. [Google Scholar] [CrossRef]
  44. Qaisrani, Z.N.; Nuthammachot, N.; Techato, K.; Asadullah Jatoi, G.H.; Mahmood, B.; Ahmed, R. Drought variability assessment using standardized precipitation index. re-connaissance drought index and precipitation deciles across Balochistan, Pakistan. Braz. J. Biol. 2024, 84. [Google Scholar] [CrossRef]
  45. Van Klompenburg, T.; Kassahun, A.; Catal, C. Crop yield prediction using machine learning: A systematic literature review. Comput. Electron. Agric. 2020, 177, 105709. [Google Scholar] [CrossRef]
  46. Thiagarajan, A.; Lada, R.R.; Muthuswamy, S.; Adams, A. Agroclimatology-Based Yield Model for Carrot Using Multiple Linear Regression and Artificial Neural Networks. Agron. J. 2013, 105, 863. [Google Scholar] [CrossRef]
  47. Metiva, M.; Bunting, E.; Steinke, K.; Hayden, Z. Topdress strategies and remote sensing for nitrogen management in processing carrots. Agron. J. 2023, 115, 408–425. [Google Scholar] [CrossRef]
  48. Abbas, F.; Afzaal, H.; Farooque, A.; Tang, S. Crop Yield Prediction through Proximal Sensing and Machine Learning Algorithms. Agronomy 2020, 10, 1046. [Google Scholar] [CrossRef]
  49. Brainard, S.; Ellison, S.; Simon, P.; Dawson, J.; Goldman, I. Genetic characterization of carrot root shape and size using genome-wide association analysis and genomic-estimated breeding values. Theor. Appl. Genet. 2022, 135, 605–622. [Google Scholar] [CrossRef] [PubMed]
  50. Ryan, M. The social and ethical impacts of artificial intelligence in agriculture: Mapping the agricultural AI literature. AI Soc. 2023, 38, 2473–2485. [Google Scholar] [CrossRef]
Disclaimer/Publisher’s Note: The statements. opinions and data contained in all publications are solely those of the individual author(s) and contributor(s) and not of MDPI and/or the editor(s). MDPI and/or the editor(s) disclaim responsibility for any injury to people or property resulting from any ideas. methods. instructions or products referred to in the content.
Figure 1. Experimental sites 1 (A) and 2 (B) and their respective areas of data collection.
Agriengineering 06 00022 g001
Figure 2. Meteorological data from both experimental sites over the crop season. Source: NASA Power, 2022–2023 (https://power.larc.nasa.gov/data-access-viewer/), accessed on: 8 January 2024.
Agriengineering 06 00022 g002
Figure 3. Manual data collection of the carrots.
Agriengineering 06 00022 g003
Figure 4. Flowchart of the experimental process and data processing.
Agriengineering 06 00022 g004
Figure 5. Comparison of the total crop mass data in relation to the normal distribution.
Agriengineering 06 00022 g005
Figure 6. Principal component analysis at 82 and 116 DAS. MT-total mass; MA-air mass; MR-root mass; C-root length; D-root diameter; B-°Brix; and F-firmness; E1-experimental site 1; E2-experimental site 2.
Agriengineering 06 00022 g006
Figure 7. Performance of the predictive models by method: ANN (A); RF (B); and MLR (C).
Agriengineering 06 00022 g007
Table 1. Descriptive statistics of the database.
MinimumMaximumMeanSDCV (%)
VariablesSite 1Site 2Site 1Site 2Site 1Site 2Site 1Site 2Site 1Site 2
NDVI0.680.680.910.880.780.810.050.0476
RDVI0.320.410.920.600.870.550.040.0153
SAVI0.310.420.880.630.520.580.170.02323
EVI0.600.440.930.720.760.630.100.03135
Total mass (g)693140064124466332630037345252217
Air part (g)28143431922436116412243933343427
Root mass (g)17459533573598123418833434122822
Root length (cm)141624221818831175
Root diameter (cm)1925314325321.533610
°Brix7.656.507.8797.767.880.030.410.355
Firmness (N)29.7926.1532.3839.783132.560.331.7615
SD: standard deviation; CV: coefficient of variation.
Table 2. Correlations between predictor variables.
NDVIRDVISAVIEVI
Total mass0.680.240.780.64
Aerial mass0.140.030.540.48
Root mass0.78−0.210.670.09
Root length0.250.030.260.12
Root diameter0.38−0.670.21−0.55
°Brix0.23−0.330.23−0.17
Firmness0.56−0.150.31−0.05
Bold numbers mean r > 0.65.
Table 3. Metrics of the performance of ANN, RF, and MLR modeling from the test dataset.
ModelR2MAERMSE
ANN0.68566.6423.80
RF0.67572.4723.93
MLR0.61591.2224.21
MAE: mean absolute error (boxes ha−1). RMSE: root-mean-squared error (boxes ha−1).
Disclaimer/Publisher’s Note: The statements, opinions and data contained in all publications are solely those of the individual author(s) and contributor(s) and not of MDPI and/or the editor(s). MDPI and/or the editor(s) disclaim responsibility for any injury to people or property resulting from any ideas, methods, instructions or products referred to in the content.

