1. Introduction
Agriculture 4.0 consists of an upgrade of the usual farming techniques and has the scope to create a more sustainable and efficient agriculture system that can produce higher yields while minimizing the impact on the environment. By using advanced technologies, farmers can make more informed decisions, reduce waste, and optimize resource utilization, leading to a more sustainable and profitable agriculture industry. Agriculture 4.0 encompasses the advancement of precision farming and refers to all agricultural actions that are based on a precise and accurate analysis of data and information acquired and transferred using advanced tools and technology. This refers to the tools and techniques that allow for the synergistic use of a variety of digital 4.0 technologies, allowing for the automatic collection, integration, and analysis of data collected from the field, sensors, or other third-party sources. Agriculture 4.0 refers to the application of the Internet of Things (IoT), Big Data, artificial intelligence, and robotics to extend, accelerate, and improve the efficiency of operations affecting the entire production chain [
1].
Some innovations are:
Process automation: thanks to the use of drones and sensors, it is possible to monitor crops throughout their growth phase, as well as check the state of well-being or the need to irrigate and fertilize the soil. There are countless benefits associated with drones in the context of the agricultural industry. In fact, they can be of help to farmers in acquiring data on the state of stress of plants and observing the movements of livestock, but they can also allow the identification of diseases in plants and animals, allowing timely interventions.
The use of GIS: thanks to this software that can integrate data of different natures, it is possible to efficiently determine (according to different parameters such as soil pH, temperature, and humidity) the position of the crops, the land use, and the need for fertilization and irrigation. It is also possible to carry out an analysis of historical data to provide farmers with tools that allow them to choose the best conditions for their crops.
Of fundamental importance is the sustainable management of the environment and the planet’s resources, including water. As is known, intelligent consumption of this resource is essential in the field of agriculture, [
2]. Moreover, there are many studies carried out on the automation of agricultural vehicles and the monitoring of crops and livestock. The advent of robotics in agriculture has allowed numerous benefits, including an increase in productivity, the acceleration of operations in the procedures related to the maintenance of cultivation, as well as safety during production processes and precision in the analysis of the possible interventions to be carried out to optimize the harvest [
3,
4]. The GIS (Geographic Information System) is a crucial tool frequently utilized in the realm of Agriculture 4.0. It has numerous applications, particularly in precision agriculture, such as assessing the potential of agricultural waste to generate bioenergy [
5]. Particularly useful are open-source GISs that allow for the implementation of internal functions (including forecasting ones) useful in various application fields, also allowing interaction with external technologies in real time. As it is known, diverse data types can be incorporated into the GIS, including free satellite data, although many of these data are limited due to their low resolution. As a result, higher spatial and temporal resolution multispectral UAV images must be combined with this data to resolve this limitation. To address the issue of integrating non-uniform data, data fusion techniques are frequently employed [
6,
7]. So, in the literature, extensive studies could be found regarding the technologies, materials, algorithms, and protocols involved in this research, but less could be found regarding their integration. The present research fits into this context by proposing as the main novelty the use of an atmospheric experimental simulator capable of providing punctual variables, which, together with local sensor data and the data fusion of satellite and drone images, are all managed by an open-source GIS capable of estimating fundamental parameters related to the cultivation and automation of agricultural vehicles. This estimation is in the frame of a strategic management of crops through the identification of local optimal cultivation typologies and the automation of optimal field route planning for both self-driving tractors and UAVs, which is further useful for tactical in-season crop monitoring to guide crop irrigation and fertilization management.
2. Materials and Methods
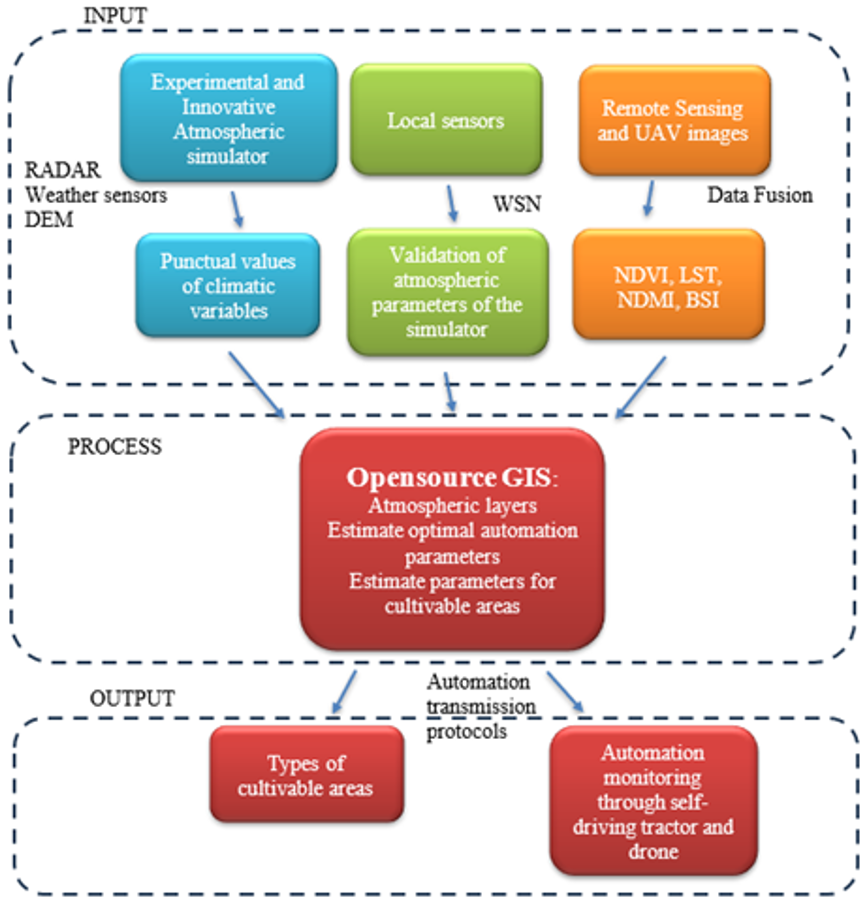
During experimentations, in order to identify areas that best fit the different possible typologies of cultivation and to plan the routes of both self-driving tractors and UAVs, we have used different systems, algorithms, and methodologies structured and integrated with each other as schematically shown in the flow diagram in
Figure 1. Referred to in more detail:
An open-source GIS, in particular the open-source QGIS;
an innovative and experimental atmospheric simulator;
satellite and UAV images,
local sensors;
algorithms and protocols for data transmission.
Figure 1.
Flow diagram developed in the frame of Agriculture 4.0 concept illustrating the methodological scheme and the different integrated systems, algorithms, and methodologies aiming to identify areas that best fit the different possible typologies of cultivation and to plan the optimal routes of both self-driving tractors and UAVs as final products of the built strategic management system for crop irrigation and fertilization.
Firstly, the atmospheric simulator (using as inputs the Digital Elevation Model (DEM) of the territory, weather sensor data, radar data, and very large-scale weather models) was used to obtain, as outputs, the punctual values of some characteristic weather variables: precipitation, wind, pressure, and temperature, which were subsequently reprocessed to obtain DEM layers of these variables. (Weather variables such as precipitation, wind, pressure, and temperature are important for Agriculture 4.0 because they directly influence the environmental conditions that can have an impact on crops. Precipitation is crucial for the water supply of plants; wind can affect growth and disease spread; atmospheric pressure provides information about imminent climatic changes; and temperature influences plant growth and maturation). The validation of the results obtained was performed through the combination of different ground truth devices: local sensors (soil moisture sensor, leaf wetness sensor, pH sensor, temperature and humidity sensor, and barometric pressure sensor), using wireless sensor network nodes (WSNn). This WSN was supported with the ZigBee protocol (Texas Instruments, Dallas, TX, USA), an ATmega128L microcontroller (Microchip Technology Inc., Chandler, AZ, USA), and a solar cell module (Canadian Solar, Guelph, ON, Canada) with the aim of collecting information from various sensors and passing the information to a cloud server. Through the data fusion technique [
8], we have combined satellite data and UAV images to establish important indices used as an indication of vegetation richness and to capture soil differences: NDVI (normalized difference vegetation index), LST (land surface temperature), NDMI (normalized difference moisture index), and BSI (bare soil index). In particular, the satellite images used are:
Sentinel-2, Level 2A: Level 2A of Sentinel-2 processing includes a scene classification and an atmospheric correction applied to Top-Of-Atmosphere (TOA) Level-1C orthoimage products. Level-2A’s main output is an orthoimage bottom-of-atmosphere (BOA) corrected reflectance product.
WorldView-3: capable of acquiring images at 31 cm panchromatic, 1.24 m multispectral, 3.7 m shortwave infrared, and 30 m CAVIS (clouds, aerosols, vapors, ice, and snow) resolution.
As regards UAV images, a Micasense Altum Camera was used to capture multispectral photos with a DJI Matrice 600 Pro. This camera is ideal for agricultural use since it can collect photos of crops in both visible and infrared wavelengths at the same time. The drone flew around 30 m above the ground, producing aerial GSD photos with a resolution of 5 cm. All this information was processed by the GIS, which estimates the optimal automation parameters and those relating to the cultivable areas. In particular, the algorithms used to identify the cultivable areas are as follows:
Spatial data analysis algorithms, in particular buffering, intersection, overlay, and clustering analysis, are useful for identifying areas of interest, evaluating the proximity of climatic data, sensor data, and DEM data, and carrying out comparative analyses between different areas.
Raster analysis algorithms to extract information from raster data such as DEM and NDVI by calculating terrain statistics and identifying specific slope or elevation areas that are best suited for certain crops.
Supervised classification algorithms such as random forest, support vector machine (SVM), and neural networks to classify image data to determine crop typology and to build a predictive model. These algorithms are available as plugins or additional extensions that can be installed and used within the QGIS environment.
In relation to the algorithms used for tractor automation, QGIS includes a number of tools and algorithms that can be used to perform routing analysis and route planning and also supports the use of additional plugins and integration with other tools and libraries that offer advanced routing and route optimization features. Specifically, the “Network Analysis Library (NAl)” and “pgRouting” plugins were used to perform advanced routing analysis within QGIS. These plugins offer optimized routing algorithms that take into account factors such as obstacles, speed constraints, and specific preferences to calculate optimal routes, always keeping in mind the necessary use of GPS for positioning and referenced cartography for displaying the position.
As regards the parameters, the output parameters for identifying the cultivable areas are as follows:
Crop classification map: Using the supervised or unsupervised classification algorithms, it was possible to generate a crop classification map that assigns the estimated crop type to each area of the study area.
Crop suitability assessment: Based on the analysis of climate data, local sensor data, DEM, and NDVI, it was possible to generate a crop suitability assessment for the study area.
Analysis of environmental characteristics: The analysis of climate data, local sensor data, DEM, and NDVI provided information on the environmental characteristics of the study area, including maps of temperature, precipitation, soil moisture, and soil pH, which have been used to evaluate the adaptability of crops to local environmental conditions.
Analysis report: They included statistics on the prevailing crops, indicators of crop suitability, analyses of environmental characteristics, and other relevant information for determining the type of cultivation in the study area.
Tabular output data: In addition to the maps and reports, tabular output data have been produced, which reports detailed information on the study area.
In relation to the automation of the tractor, the output parameters are GPS coordinates (in real time), driving routes (to maximize operation efficiency), speed control (to ensure safe and efficient driving), sensor monitoring (to detect any obstacles, avoid collisions and efficiently manage the resources of the tractor), actuator control (to ensure precise and smooth driving according to the routes and instructions provided), ground condition monitoring (to adapt the driving of the tractor, make decisions in real time and to optimize the use of resources), alarms and warnings (to alert the operator or user in case of emergency situations, unforeseen obstacles or technical problems during automated driving), and performance monitoring (for operations management).
Then, through Cannelloni software (written in C++11 and capable of transferring CAN frames between two machines using UDP) and a series of protocols (datagram protocol (UDP) or stream control transmission protocol (SCTP), which are supported by Cannelloni software. In some cases, it is necessary to convert SCTP to the transmission control protocol (TCP)). The data are transmitted to the agricultural vehicle, which will have the task of irrigating and fertilizing the area according to the vegetation’s needs, and to the drone, which will have the task of monitoring the existing cultivation. As a result, it is possible to visualize the different typologies on the GIS of areas suitable for cultivation related to land, water, and climate parameters.
2.1. Geografic Information System
Geographic Information System (GIS) technology is increasingly being used in agriculture to help farmers make better decisions and optimize their farming practices. GIS is a system that allows for the capture, storage, analysis, and visualization of geographic data, such as crop yields, soil characteristics, weather patterns, and other relevant information. By integrating this information with other data sources, farmers can gain insights into their operations and make more informed decisions.
GIS can help farmers in various ways, such as:
Land use planning: GIS can help farmers make informed decisions about the best use of their land. It can be used to analyze factors such as soil type, topography, and climate to determine the best species to crop in a particular area.
Market analysis: it can be used to analyze market trends and demand for certain crops.
Disaster management: GIS can be used to monitor and respond to natural disasters such as floods, droughts, and wildfires. By quickly identifying affected areas, farmers can take appropriate action to protect their crops and minimize losses.
In our research, GIS plays a central role in the management of the information collected from different sources and in the return of important information related to Agriculture 4.0. In fact, the choice of the optimal areas for cultivation depends on several factors that can affect the yield and quality of the crop, which include climate, type of soil, irrigation, topography, and market needs. In the following study, QGIS (an open-source GIS) was used, which consists of software that allows one to process, display, and analyze geographic data such as maps, satellite images, sensor data, etc., using the Python language. This type of software, which is entirely updatable, has therefore allowed the automation of the management of geographical data, the creation of customized scripts for data analysis, and the creation of customized tools for data visualization.
2.2. Atmospheric Simulator
The main novelty of this research is the use of an atmospheric simulator [
9] that, through a DEM and radar/sensor data, can provide important climate information in relation to the orographic characteristics of the land. This article outlines the functioning of an atmospheric simulator that has the ability to generate highly detailed weather field outputs within a restricted domain. With minimal input, this software can produce outputs related to wind, temperature, humidity, cloud cover, rain, and other atmospheric parameters for cubic cells as small as 50 m. Unlike NWP (numerical weather prediction), the simulator’s atmosphere microphysics is based on laws that regulate the interaction of a number of particles with which the atmosphere has been discretized. The latter, in fact, consists of a set of particles contained in the center of a cube (cells). Each of these particles contains within it a specific quantity of gas, water, and humidity from which its mass exchanges and interactions with other particles and the external environment are defined. The particles will be subjected to a force derived from their energy state, from interaction with other particles, or from the surface.
Essentially, the simulator emulates the behavior of the Earth’s atmosphere as it relates to weather patterns and represents the state of variation of the particles with which the atmosphere has been discretized and how they interact with each other. The simulation model incorporates two solvers, L1 and L2, which work in tandem and process tasks at a higher level. These solvers translate the phenomena of the troposphere and vertical exchange into a particle representation of the atmosphere.
2.2.1. Solver 1
Solver L1 is responsible for several tasks, including assigning physical and chemical properties to particles, applying forces to particles based on their energy state from interactions with radiation and heat sinks, assigning initial states to particles and environmental elements, dividing the 3D domain into macro-clusters, and providing atomically referable forecast fields for each. Real-time data or hypothetical values can be used as input.
2.2.2. Solver 2
On the other hand, Solver L2 is a Newtonian Simulator that utilizes the values of force, mass, viscosity, and local density assigned by Solver L1 to individual particles. It employs a software library for fluid modeling called SPH (smoothed particle hydrodynamics) [
10] that specializes in realistic simulations of fluids or gases within a few hundred meters. The library is developed by Nvidia, and the technology is called Nvidia PhysX. Solver L2 introduces the forces attributed to the particles by L1 and initiates dynamic evolution through PhysX using SPH Fluids rules. For instance, if there is local interpenetration of cells at time
t, repulsion forces come into play according to the represented parameters, such as partial compressibility, friction, viscosity, and mass. This mechanism represents winds, including complex turbulence characterizations and localized pressure variations, such as convective or ascending situations, in the 3D domain. The mechanism is particularly effective in complex orographic regions, such as the Apennines, where sudden altitude variations are challenging to manage with classic NWP (numerical weather prediction).
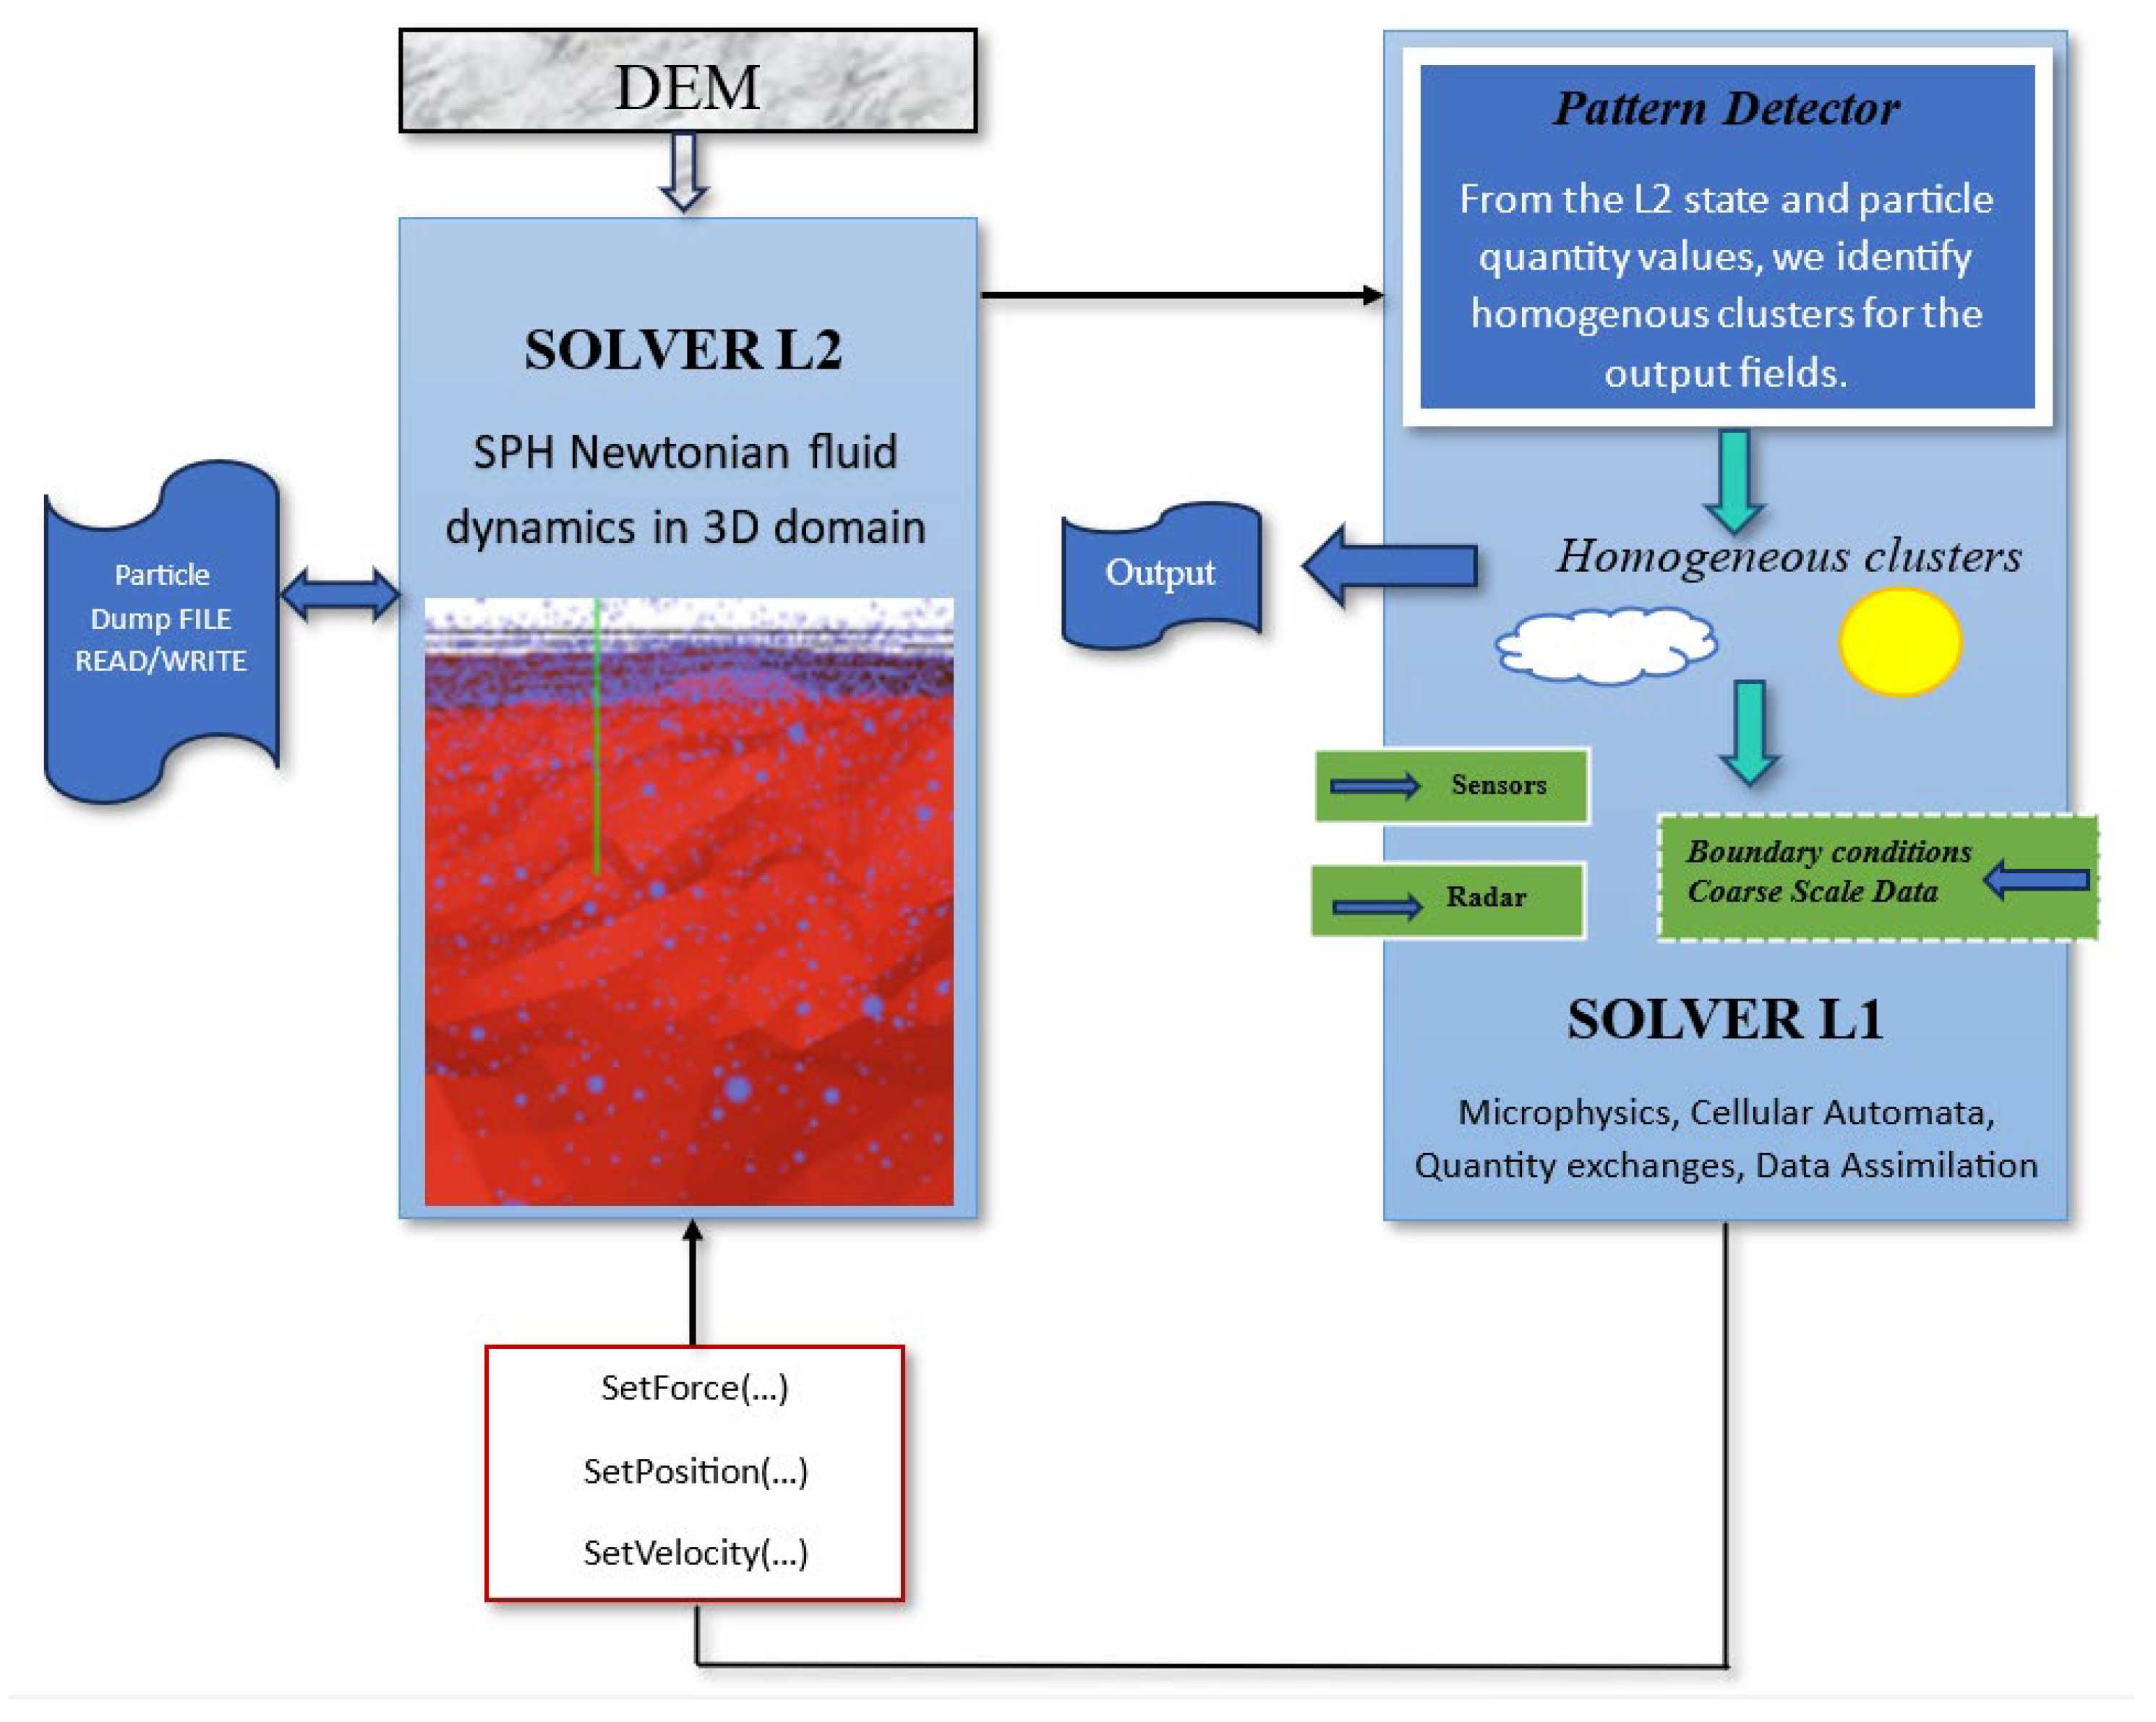
2.2.3. General Diagram of the Simulator
The initialization of Solver L2 involves reading an ASCII DEM that will serve as the orographic domain of the simulation. The particles are positioned uniformly on the scene and evolve until a point of stability is reached. Solver L1 processes the initial conditions obtained from measurements, such as sensors or radar, and provides directives for assigning forces, velocities, and positions to particles in specific spatial volumes (clusters) to Solver L2. L2 evolves by applying these directives for a specified time interval, and Solver L1 is informed of the new state of particles at the end of the evolution, including their position, velocity, density, and changes compared to the previous state. Solver L1 then associates the attributes provided by L2 with particle and atmospheric state-related characteristics such as humidity and temperature. The pattern detector (part of L1) creates clusters with homogeneous atmospheric characteristics such as cloud cover, rain, humidity, average temperature, and pressure from the states provided by Solver L2. The values referred to as clusters are the output provided by the simulator.
The L1 now has the following inputs, which are no longer initial conditions: Pattern detector clusters, internal phenomenological conditions such as the position of the sun or the orography as seen from the point of view of atmospheric heat absorption, and coarse-scale boundary conditions, which are only required at the boundaries of the domain. The processed output then becomes directives for the new evolutionary step for L2, thus closing the feedback loop.
For this research, we have used a workstation with 3 GPUs configured in SLI mode with 17280 CUDA CORE and 36 GB of video memory, in addition to 12 CORE Intel CPUs, a dedicated CPU Intel I7-10810U, and 16 GB RAM. This workstation was built to operate and cover an area of 60 km × 60 km.
The advantages of this simulator are obvious:
allows you to have a general view of how some weather variables can evolve in a small area and with high resolution, providing valid outputs in the selected area of interest;
analyzes inhomogeneous data of different nature, therefore different in quality and quantity;
use hardware components that are affordable and do not limit their use to specialized personnel only;
operates at the microscale.
Figure 2 shows the architecture of the experimental software.
2.3. Sensors and Communication Protocols
Resources such as fertilizers, seeds, and water, the latter of which has become increasingly precious for a farmer, are indispensable but unfortunately not infinite resources. Today, with the development of new technologies, the concept of intelligent or precision agriculture has been introduced, which makes it possible to maximize crops while minimizing the resources indicated above. The introduction of increasingly performing sensors installed on the ground allows small-scale information to be provided to the farmer on crops, minimizing resources and reducing the impact on the environment [
11,
12,
13,
14,
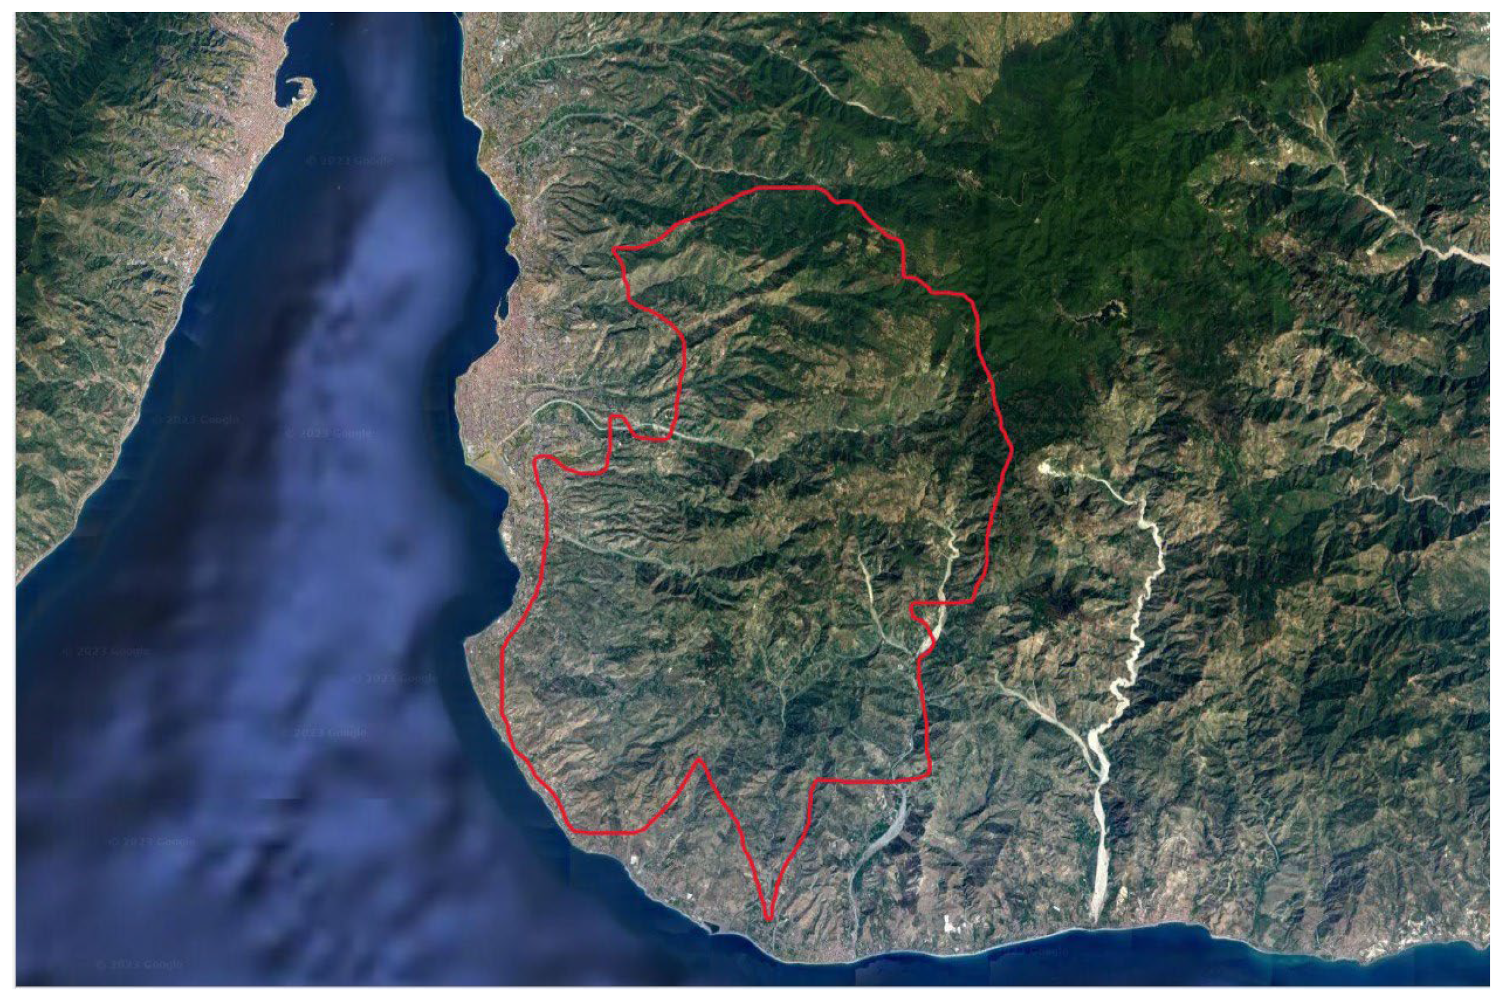
15]. The concept of modern agriculture is based on numerous physical and chemical measurements. This is possible considering sensors and Internet of Things (IoT) networks. Based on this concept, sensors in agriculture are primarily used to measure properties in soil, plants, air, and water. A sensor is a transducer designed to convert one physical quantity into another, usually an electrical signal. The latter will have to meet requirements such as the transmission, processing, storage, display, recording, and control of information. A real scenario is shown in
Figure 3, which shows the real functioning of smart farming.
As regards local sensor communication, wireless sensor nodes (WSNs) [
16,
17,
18,
19,
20,
21,
22,
23] communicate via their radio modules. If two or more nodes can send and receive data from each other, they are directly connected. The result is a network able to transmit/receive data to/from each other, collecting large amounts of data. The benefit for WSNs is due to their connection without wiring infrastructure. Today, WSNs represent a robust, simple, and complete wireless solution for agriculture, improving quality and productivity.
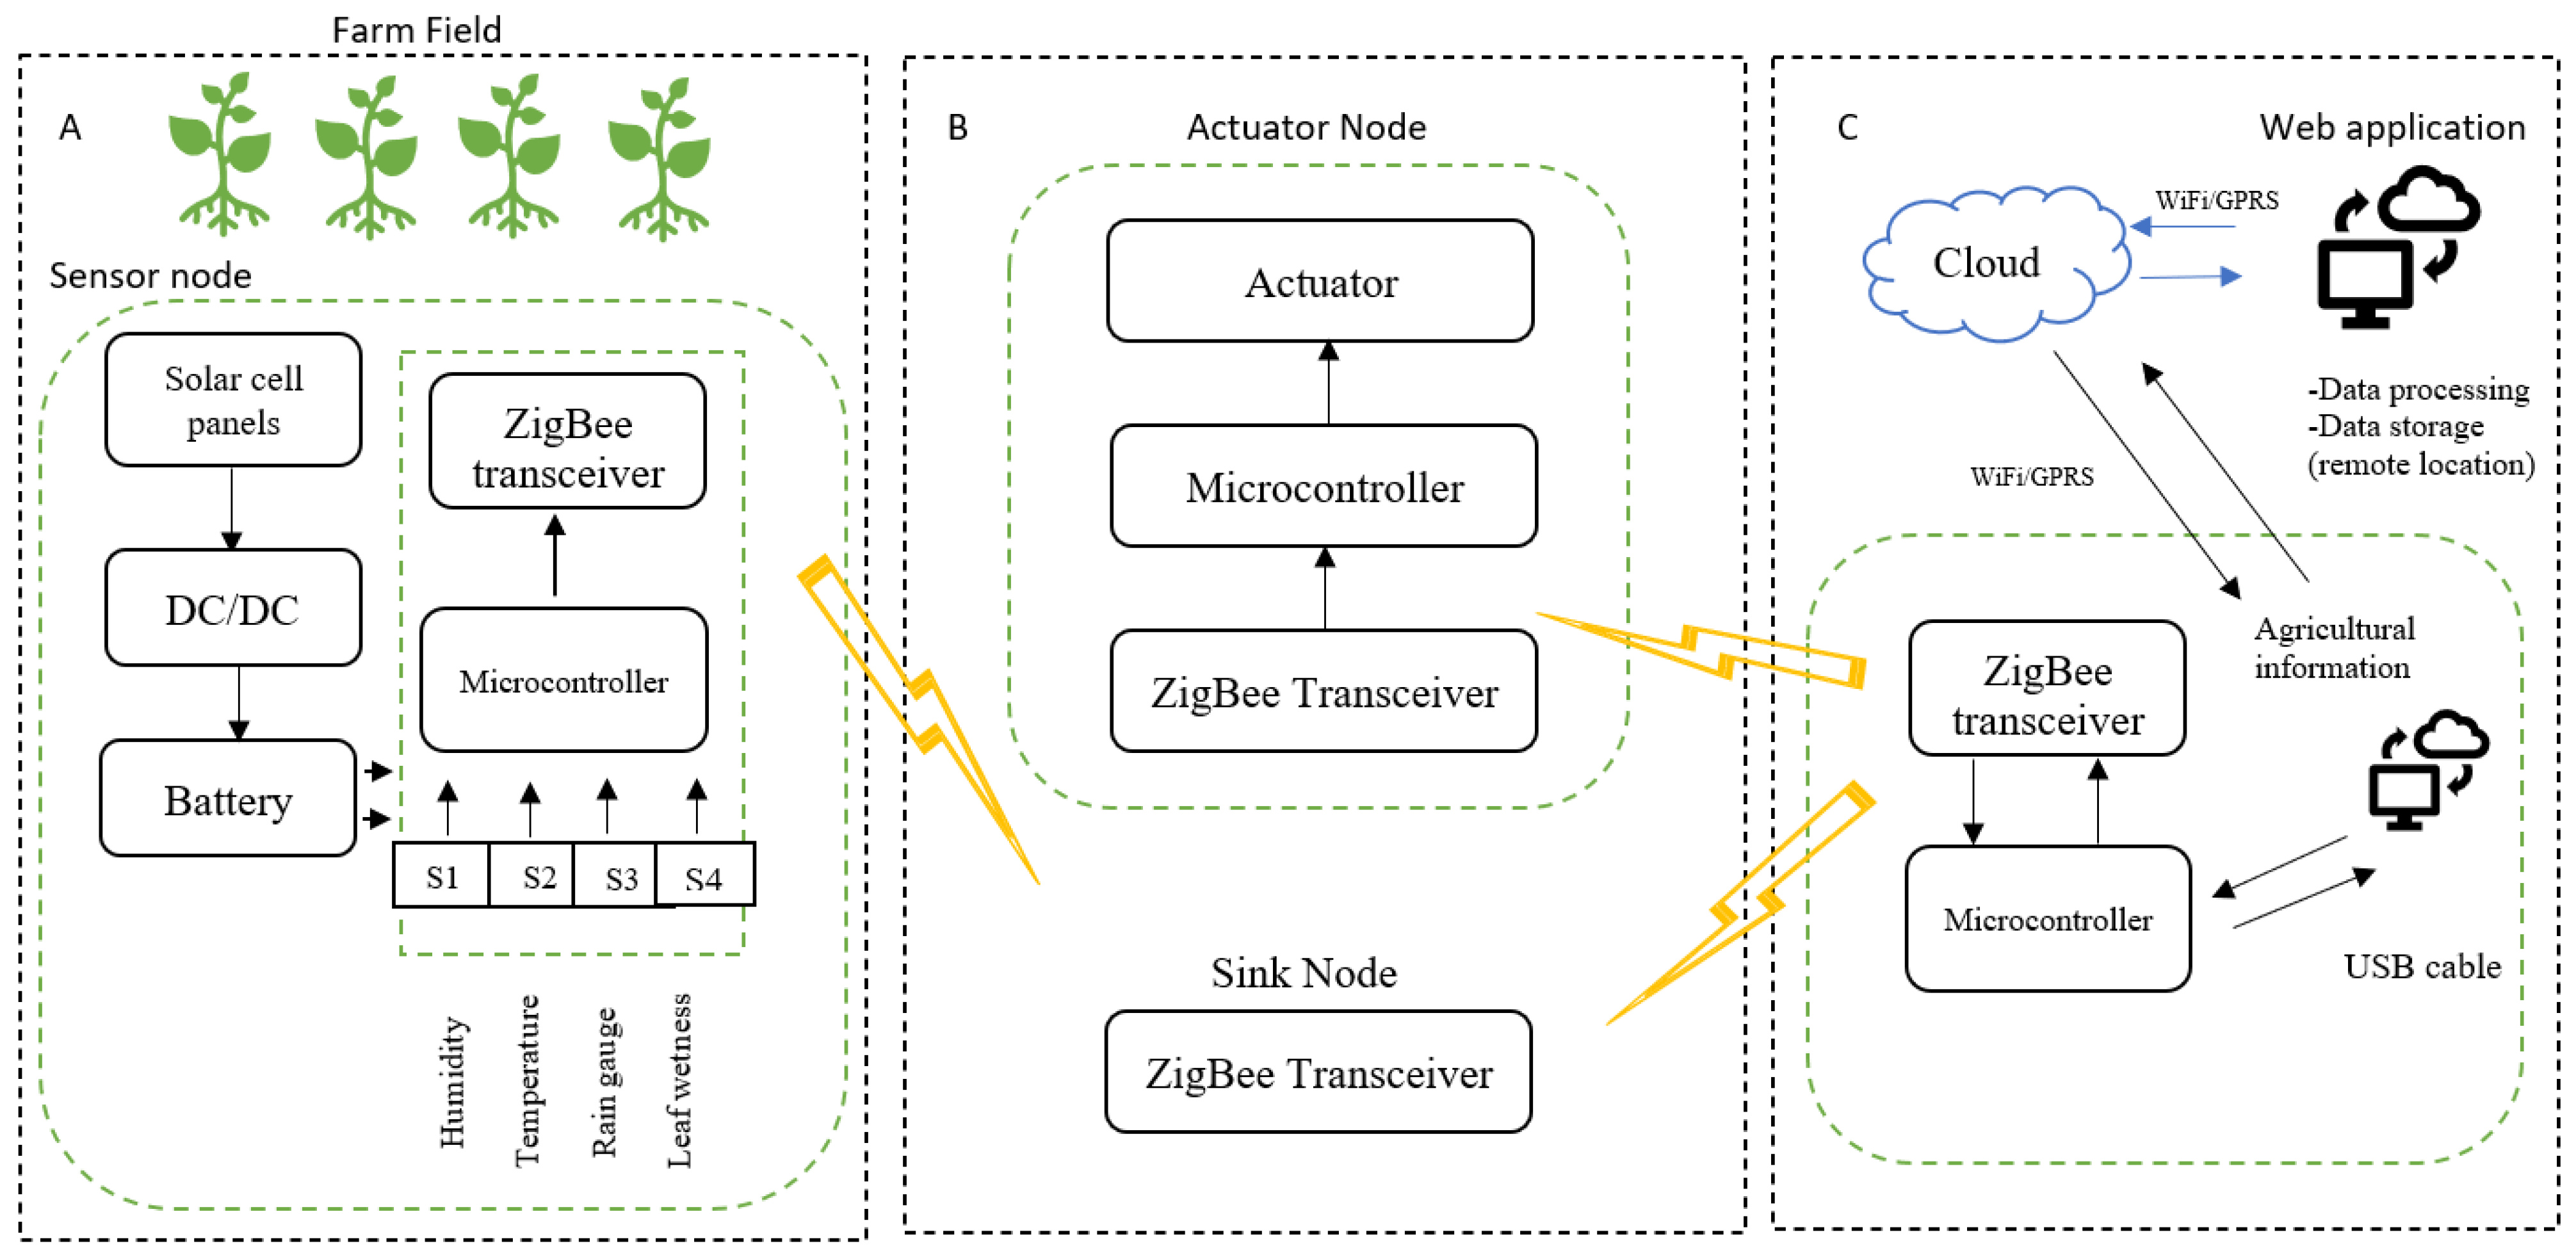
The elements that constitute a sensor node are mainly sensing, storage, processing, and communication capabilities, as shown in
Figure 4. Part A is composed of several sensors, such as a temperature sensor, humidity sensor, rain sensor, leaf wetness sensor, ZigBee protocol [
24,
25,
26], ATmega128L microcontroller, and solar cell module, that support this WSN. Communication protocols play a major role in intelligent IoT-based agriculture and cover short or long distances for smart farming. Wireless protocols/technologies that are used in agricultural applications are, for short distances, ZigBee and Wi-Fi, and for long distances, mobile communication networks, long-range wireless area networks (LoRaWAN), Bluetooth, and LPWAN protocols. Among microcontrollers, the most used in agriculture are ATmega128L nodes because this microcontroller supports multi-level data aggregation, decision making, storage capabilities, flash memory, low complexity, and energy management. Traditionally, batteries limited in size and capacity influence the lifetime of WSNs. Today, solutions such as the combination of ultra-low-power nodes with energy-harvesting techniques make WSNs perpetually operational. Part B indicates two components—special nodes usually called sinks, hubs, or gateways in the literature, depending on their function—are added when the network needs to coordinate or communicate with an external network. Actuators allow for indirect intervention in the operation or control of mechanisms. The sink node passes all information to the cloud platform. All sensor, sink, and actuator nodes adopted the low-power ZigBee wireless protocol. This information obtained from sensors and governed by actuators is then transmitted via a gateway to cloud computing for data processing and storage, as shown in Part C. The task of the gateway is to collect information from various sensors and pass the information to the cloud server [
27,
28,
29,
30,
31,
32,
33].
Figure 3 represents the area where the deployment of a mobile network is beneficial in the agricultural sector for IoT devices such as sensors and terrestrial and aerial drones known as UAVs, which require constant, reliable, wide coverage, low energy consumption, low-cost devices, high spectrum efficiency, and high-speed Internet connections to exchange large amounts of data. Data transmitted by sensors on the ground and captured by sensors on board the drone are processed, analyzed, and then stored in a cloud data repository through a communication link. This swift transfer of data to the cloud is possible in real time thanks to common communications protocols between sensors/vehicles and operators. Typically, agricultural drones are used for low-altitude flights below 120 m and use Wi-Fi, with a limited range of 3–7 km if on board the drone is a large transmitting antenna. Alternatively, for wireless control, the use of a 4G network link seems to alleviate the distance problem, allowing the drone to fly several kilometers away from the controller. To increase the range of UAVs, the 5G mobile network is suitable to promote low-flying drone communications and enhance the safety and security of drone operations. Moreover, 5G cellular networks allow farmers to receive real-time data, such as high-resolution video streams and other critical sensory and telemetry data from drones, faster and more seamlessly than with previous-generation mobile networks. Drones do not need to be equipped with large amounts of processing power, and 5G technology allows all data to be transmitted to the cloud for faster processing. Today, cellular technologies are playing a crucial role in IoT devices. Narrow-band IoT (NB-IoT) is a new IoT system protocol derived from the current long-term evolution (LTE) capabilities that can share the LTE frequency band without coexistence problems, use the same devices, and seamlessly connect to the LTE main network. NB-IoT design shows high coverage area, extended battery life (i.e., 10 years), high network size (52,000 devices/channel/cell), and low-cost devices. In the near future, NB-IoT technologies such as long-range radio (LoRa) will be preferred for transmitting agricultural information over long distances due to their low power consumption. In a point-to-point Zigbee network, the communication range can reach 100 m in an outdoor environment. ZigBee’s range can be extended by employing ad hoc distributed and mesh network topologies. In addition, drones and UAVs can be used as mobile router nodes to extend the communication range within smart farming. Drones can pass data collected from sensor nodes to master nodes through multi-hop [
34,
35].
Sensors Used in the Study
In the study, five types of sensors that measure important soil characteristics were mainly used: Soil moisture sensor, leaf wetness sensor, pH sensor, temperature and humidity sensor, and barometric sensor. As is known, one of the limitations of using point measurement sensors is their representativeness of soil or vegetation parameter variability within a field. In fact, point measurements provide information at a specific location, but they may not fully capture the spatial variability of the parameters of interest. While aware of the limitations, we have used these local sensors because they have been useful to validate the reliability of the model given by the atmospheric simulator.
Soil moisture sensors are commonly used in agriculture to help farmers determine when to irrigate their crops, as overwatering can be costly and damaging to the crops, and underwatering can also be detrimental. They can also be used in landscaping to ensure that plants are receiving the appropriate amount of water. Information given by the soil Moisture Sensor (we have used the TEROS 12 soil moisture sensor (Meter Environment, Washington, DC, USA) is of fundamental importance in agriculture; in fact, thanks to this instrument, farmers can measure the volumetric water content in the soil—which is the amount of water present in the soil as a percentage of the total volume of the soil—and manage the irrigation system in a productive way. This type of sensor uses different technologies with which the content of water is measured indirectly through specific parameters such as the dielectric constant. As is known, there are two categories of soil moisture sensors depending on the technology they use: sensors that measure volumetric water content (VWC) and sensors that measure soil tension when placed in the soil profile. Volumetric content is the volume of liquid water in the soil, usually expressed as a percentage. Soil water tension indicates, instead, the energy required by plant roots to extract water from soil particles. As soil water is removed from the soil, soil tension increases. The three most common types of soil moisture sensors are:
Electromagnetic sensors: The most common electromagnetic sensors are capacitance sensors or frequency domain reflectometry (FDR) sensors and time domain reflectometry (TDR) sensors. These sensors indirectly measure VWC based on the dielectric and electric properties of the soil medium (soil bulk permittivity or soil dielectric constant). The dielectric constant is a measure of the substance’s ability to store electrical energy. Since soil particles, water, and air all have different dielectric constants, their ability to store or dissipate electrical energy is different.
Capacitance or frequency domain sensors: Typically, these sensors are in the form of two parallel rods (two electrodes) or a pair of metal rings (two electrodes) mounted along the length of a PVC pipe. The capacitor along the length of the PVC pipe allows simultaneous measurements of soil moisture at different depths. Portable capacitance probes also allow measurements at several locations through access tubes. When electric current passes through these electrodes, they form an electromagnetic field in the soil. The probe measures the permittivity of a soil medium by measuring the charge time of a capacitor made with that medium and thus the soil water content.
Time domain reflectometry (TDR) sensors: Time domain reflectometry (TDR) sensors consist of two or three parallel rods inserted into the soil, acting as waveguides. When a defined voltage pulse is sent to the sensor, it travels along the waveguide. When this pulse reaches the end of the waveguide, it reflects back. The oscilloscope connected to the sensor measures this reflection. As the soil’s water content increases, the dielectric constant of the soil also increases. Consequently, the travel time of the pulse decreases, and thus, the soil moisture content can be estimated using the calibration equation [
36].
A leaf wetness sensor is a device used to measure the amount of moisture present on the surface of leaves. It is often used in agriculture to help farmers determine the optimal time for irrigation or to prevent fungal diseases that may occur due to prolonged leaf wetness. The sensor works by measuring the electrical resistance between two conductive plates, or probes, that are placed on the surface of the leaf. By monitoring the changes in resistance over time, the sensor can detect when the leaf becomes wet and when it dries out. Leaf wetness sensors may also include temperature and humidity sensors to provide additional environmental data that can help farmers make more informed decisions about irrigation and disease management. In particular, in this study, we have used the AccuPAR LP-80 Leaf Wetness Sensor: The LP-80 Leaf Wetness Sensor consists of a flat surface that is placed in contact with the leaves. It utilizes electrical resistance or capacitive sensing technology to detect the presence or absence of moisture on the leaf surface. By measuring the wetness level, the sensor can provide valuable information for various applications, such as determining optimal irrigation schedules, assessing plant health, and monitoring disease conditions [
37].
A pH sensor is a device used to measure the acidity or alkalinity of a liquid or soil. A pH sensor works by using a probe or electrode that is sensitive to changes in hydrogen ion concentration. Modern pH sensors may also include temperature sensors and microprocessors to automatically compensate for changes in temperature and provide more accurate readings. pH sensors are widely used in agriculture for monitoring and maintaining the pH levels of soil, water, and nutrient solutions used for crop growth. pH sensors are essential in agriculture because pH levels directly affect the plant’s ability to take up nutrients from the soil or water. They are also used in hydroponic farming to monitor the nutrient solutions used to grow plants that grow in water. In particular, for the experimentation, we have used the HALO wireless Soil pH meter (Hanna Instruments, Inc., Padova, Italy) [
38].
A temperature and humidity sensor is a device used to measure the temperature and relative humidity of the surrounding air. It is commonly used in environmental monitoring systems, greenhouses, and HVAC (heating, ventilation, and air conditioning) systems. Temperature and humidity sensors are widely used in agriculture to monitor environmental conditions in crop production areas. These sensors are essential in agriculture because temperature and humidity levels directly affect plant growth and health. The applications of these sensors also include the monitoring of environmental conditions in greenhouses and the control of pest infestations. Pests thrive in specific conditions, and thanks to this type of sensor, farmers can identify conditions that favor pest populations. For the study, we have used BI-SENSOR (Maher Smart Agrocontrollers, Almeria, Spain) [
39].
A barometric pressure sensor is an instrument used to measure atmospheric pressure. It is commonly used in weather monitoring systems, aviation, and altimeters.
The sensor works by using a thin, flexible membrane, typically made of silicon, that is exposed to the atmosphere. As atmospheric pressure changes, the membrane expands or contracts, causing a corresponding change in the electrical resistance of the sensor. Modern barometric pressure sensors may also include temperature sensors to compensate for temperature-related changes in atmospheric pressure. This compensation is necessary because temperature affects the density of air, which in turn affects atmospheric pressure. Atmospheric pressure is an essential factor in determining weather patterns and can affect crop growth and yield. Barometric sensors are used in several ways in agriculture, including weather forecasting and livestock management. In the study, we used the Digital Barometer PS-0060-AD (Netsens Sensing the Environment, Firenze, Italy) [
40].
2.4. Self-Driving Remote Controlled Tractor in Smart Agriculture
Self-driving tractors are autonomous vehicles that use advanced technologies such as sensors, cameras, GPS, and machine learning algorithms. Autonomous tractors are becoming increasingly popular in the agriculture industry as they offer numerous benefits to farmers. One of the main advantages of self-driving tractors is their ability to operate around the clock, which increases the efficiency of farming operations. They can work continuously without the need for rest breaks or sleep, which can be particularly useful during critical periods such as planting and harvesting seasons. Self-driving tractors also offer greater precision and accuracy in farming operations. They can operate with high levels of accuracy and repeatability, which can help reduce the use of fertilizers, pesticides, and other inputs, leading to improved crop yields and reduced costs. Moreover, self-driving tractors can be programmed to work in various weather conditions and terrains, which helps reduce soil erosion and improve overall soil health. They can also operate in hazardous conditions or environments that may be dangerous for human operators.
Thanks to improvements in several fields of engineering, autonomous and remote-control studies today allow increased productivity in agriculture [
41,
42,
43,
44]. With a remote control, the tractor is operated by a person from a remote area, considering data from tractor cameras and sensors. TX/RX of data is possible if requirements such as latency and bandwidth for video and control data transfer are verified. A remote-control system includes cameras, sensors, collision avoidance sensors, and control devices. ISO 11783, commonly known as ISOBUS, is a communication standard that allows a link between tractors. ISOBUS is based on the SAE J1939 protocol, which includes the controller area network (CAN) and allows electronic control units (ECUs) to communicate through the CAN bus. Autonomous control algorithms for agricultural tractors use communication based on the ISOBUS standard. The Cannelloni software allows the connection of area network controllers on a local area network. However, data transmission over the Internet or a mobile network using this software is not secure. Control of the tractor is based on the CAN bus, whose protocol allows a bit rate of up to 1 Mbps. The components inside the tractor to remotely drive the tractor are a remote-controlled cabin, a remote-controlled tractor, and a computer for CAN tunneling on a mobile network [
45].
All network traffic is over a virtual private network (VPN) connection, and communication data among devices occurs on the same local area network. A router connects the tractor to the tactical network using various mobile networks. By default, the router uses all these connections simultaneously and switches between them to provide the best possible service. The target of the remote control is to verify the possibility of remote control of the tractor through various trial networks. This is possible by sending CAN messages over the network. SocketCAN [
46,
47] allows the CAN interface to be controlled and programmed as a standard network interface. The Cannelloni tool allows CAN data to be transferred over an Ethernet tunnel. Cannelloni supports tunneling over UDP (user datagram protocol) or SCTP (stream control transmission protocol). The two protocols show substantial differences. In fact, SCTP is fast but unreliable in receiving data, while SCTP provides reliable transport but is slower. The secure shell protocol (SSH) is used to transfer the CAN traffic over the network and encrypt it. However, the SSH port is not compatible with SCTP. It is needed to convert SCTP to the transmission control protocol (TCP). This step is possible using the Socat utility. On board the tractor and remote-control cabin is a Raspberry Pi 4 computer connected to the local CAN using a Kvaser USB adapter. The Raspberry Pi onboard the tractor represents a client, allowing a connection to the server Raspberry Pi computer on the remote-control cabin. The remote-control cab server has a known address on the Internet, while the tractor may be behind the network address translation (NAT) and/or firewall of the mobile operator. The tractor software will constantly try to establish a connection to the server. If the connection to the server is lost, the client will keep trying to establish a new connection. The devices on the tractor generate a lot of CAN traffic, but much of it is not relevant to remote control. The same also applies to the remote-control cabin. So, a filter has been inserted so that only the requested messages pass through. Filtering is achieved by modifying the Cannelloni software to regulate outgoing and incoming traffic [
48].
2.5. Data Fusion Method for Remote Sensing and UAV Images
Data fusion involves merging data from different sensors, platforms, or domains to create a single, integrated data set. The purpose of data fusion is to enhance the accuracy, reliability, and completeness of data and to improve the performance of decision-making systems. By integrating information from different sources, data fusion can help identify patterns, trends, and relationships that may not be apparent from individual sources alone. Data fusion has numerous applications in various fields, including defense, aerospace, medicine, transportation, and environmental monitoring. For example, in military operations, data fusion can be used to combine data from multiple sensors, such as radar, infrared, and acoustic sensors, to provide a more complete picture of the battlefield. In healthcare, data fusion can be used to combine data from various medical devices and sensors to monitor patient health and provide better care. In this case study, we have combined remote sensing and UAV data.
Today, real-time information in several application fields can be obtained thanks to a variety of sensors on board UAVs. These flight objects receive large amounts of data (e.g., large amounts of images), and for this reason, it is needed to introduce intelligent algorithms capable of receiving different types of data and converting them into valuable and concise information. To overcome this problem, the trend today is to use multiple sensor data fusions capable of handling not only data from UAVs but also data from regular revisit times in high-resolution satellite imagery. So, the use of UAVs allows for obtaining periodic data, while the combination of satellites maintains a fine spatial resolution in the large area of observation [
49,
50,
51,
52]. However, the data obtained from UAVs and satellites are used separately; the goal is to merge them through data fusion techniques to obtain images useful for determining the indices useful for agriculture, bearing in mind all the advantages and disadvantages deriving from UAVs and satellite data sources, which differ in flexibility, cloud dependence, direct meteorological constraint, operator requirements, data management, and payload [
53,
54,
55,
56,
57].
The “data fusion” strategy (spatial-spectral) aims to create datasets with advanced features by combining one or more resolutions from each source. This strategy, designed to extract the biophysical properties of land cover and vegetation cover at high resolution, is currently little used in fields such as agriculture. The fusion of satellite and UAV data offers a range of advantages, including improved spatial and temporal resolution, greater customization, and more detailed and comprehensive information. However, there are also some disadvantages, such as the limited coverage of drones compared to satellites, higher costs and more complex logistics, restrictions related to weather conditions, and the management of collected data. In particular, the fusion spatial-spectral method is useful to improve the spectral resolution of low-cost UAV sensor imagery and the accuracy of land cover classification [
58,
59]. Spatiotemporal is used in data analysis when data are collected over both space and time. It describes a phenomenon at a particular place and time. The fusion spatial-temporal method is useful to obtain biophysical parameters (leaf area index and chlorophyll content) of crops and make consistent predictions with fine spatial patterns. The spectral resolution of an image describes the frequency of the electromagnetic spectrum collected by the satellite. This spectral characteristic allows different features to be seen as separate entities. The temporal resolution of an image is defined as the amount of time needed to revisit and acquire data for the exact same location. The fusion spatial-temporal method is used to obtain information in multispectral satellite data with hyperspectral data from a UAV [
60,
61]. The obtained results allow for obtaining biophysical variables (e.g., leaf area index and chlorophyll content). Finally, the satellite/UAV data fusion improved the performance of the model compared to data obtained individually from satellite or UAV due to satellite-based spectral characteristics and structural characteristics obtained from UAVs [
62,
63].
As is known, remote sensing techniques could be an important tool to ground information on the characteristics of vegetation through the production of significant vegetation indices. This information can be collected by multispectral and hyperspectral systems using optical sensors, and thanks to these, it is possible to analyze some fundamental indices in agriculture, such as the NDVI (normalized difference vegetation index), NDMI (normalized difference moisture index), and BSI (bare soil index). In this research, Sentinel-2 satellite images were used that have a spatial resolution of a decameter and a revisit time of six days, together with images captured by UAVs, which have a higher resolution and the possibility to catch details within the canopies with no difficulty thanks to their flexibility. The data utilized for this analysis included a Sentile-2 Level 2A image obtained on four different dates (17 May, 14 July, 30 August, and 25 September 2022) at 10:00 UTC, as well as a WorldView-3 satellite image taken on 17 November 2022. The WorldView-3 images are considered to be one of the most detailed and precise commercial satellite images accessible to the public, with a spatial resolution of approximately 30 cm per pixel, allowing for the detection of small objects on the Earth’s surface, including cars, buildings, vegetation, and other features.
In addition, the multispectral images acquired by the DJI Matrice 600 Pro drone (SZ DJI Technology Co. Ltd., Shenzhen, China), which was equipped with a Micasense Altum Camera (AgEagle Aerial System Inc., Kansas, USA), were also utilized. This camera is well suited for agricultural purposes and has the capability to capture images of crops in both visible and infrared spectra simultaneously. The drone flew at a height of approximately 30 m above the ground, resulting in aerial GSD images with a resolution of 5 cm.
4. Results
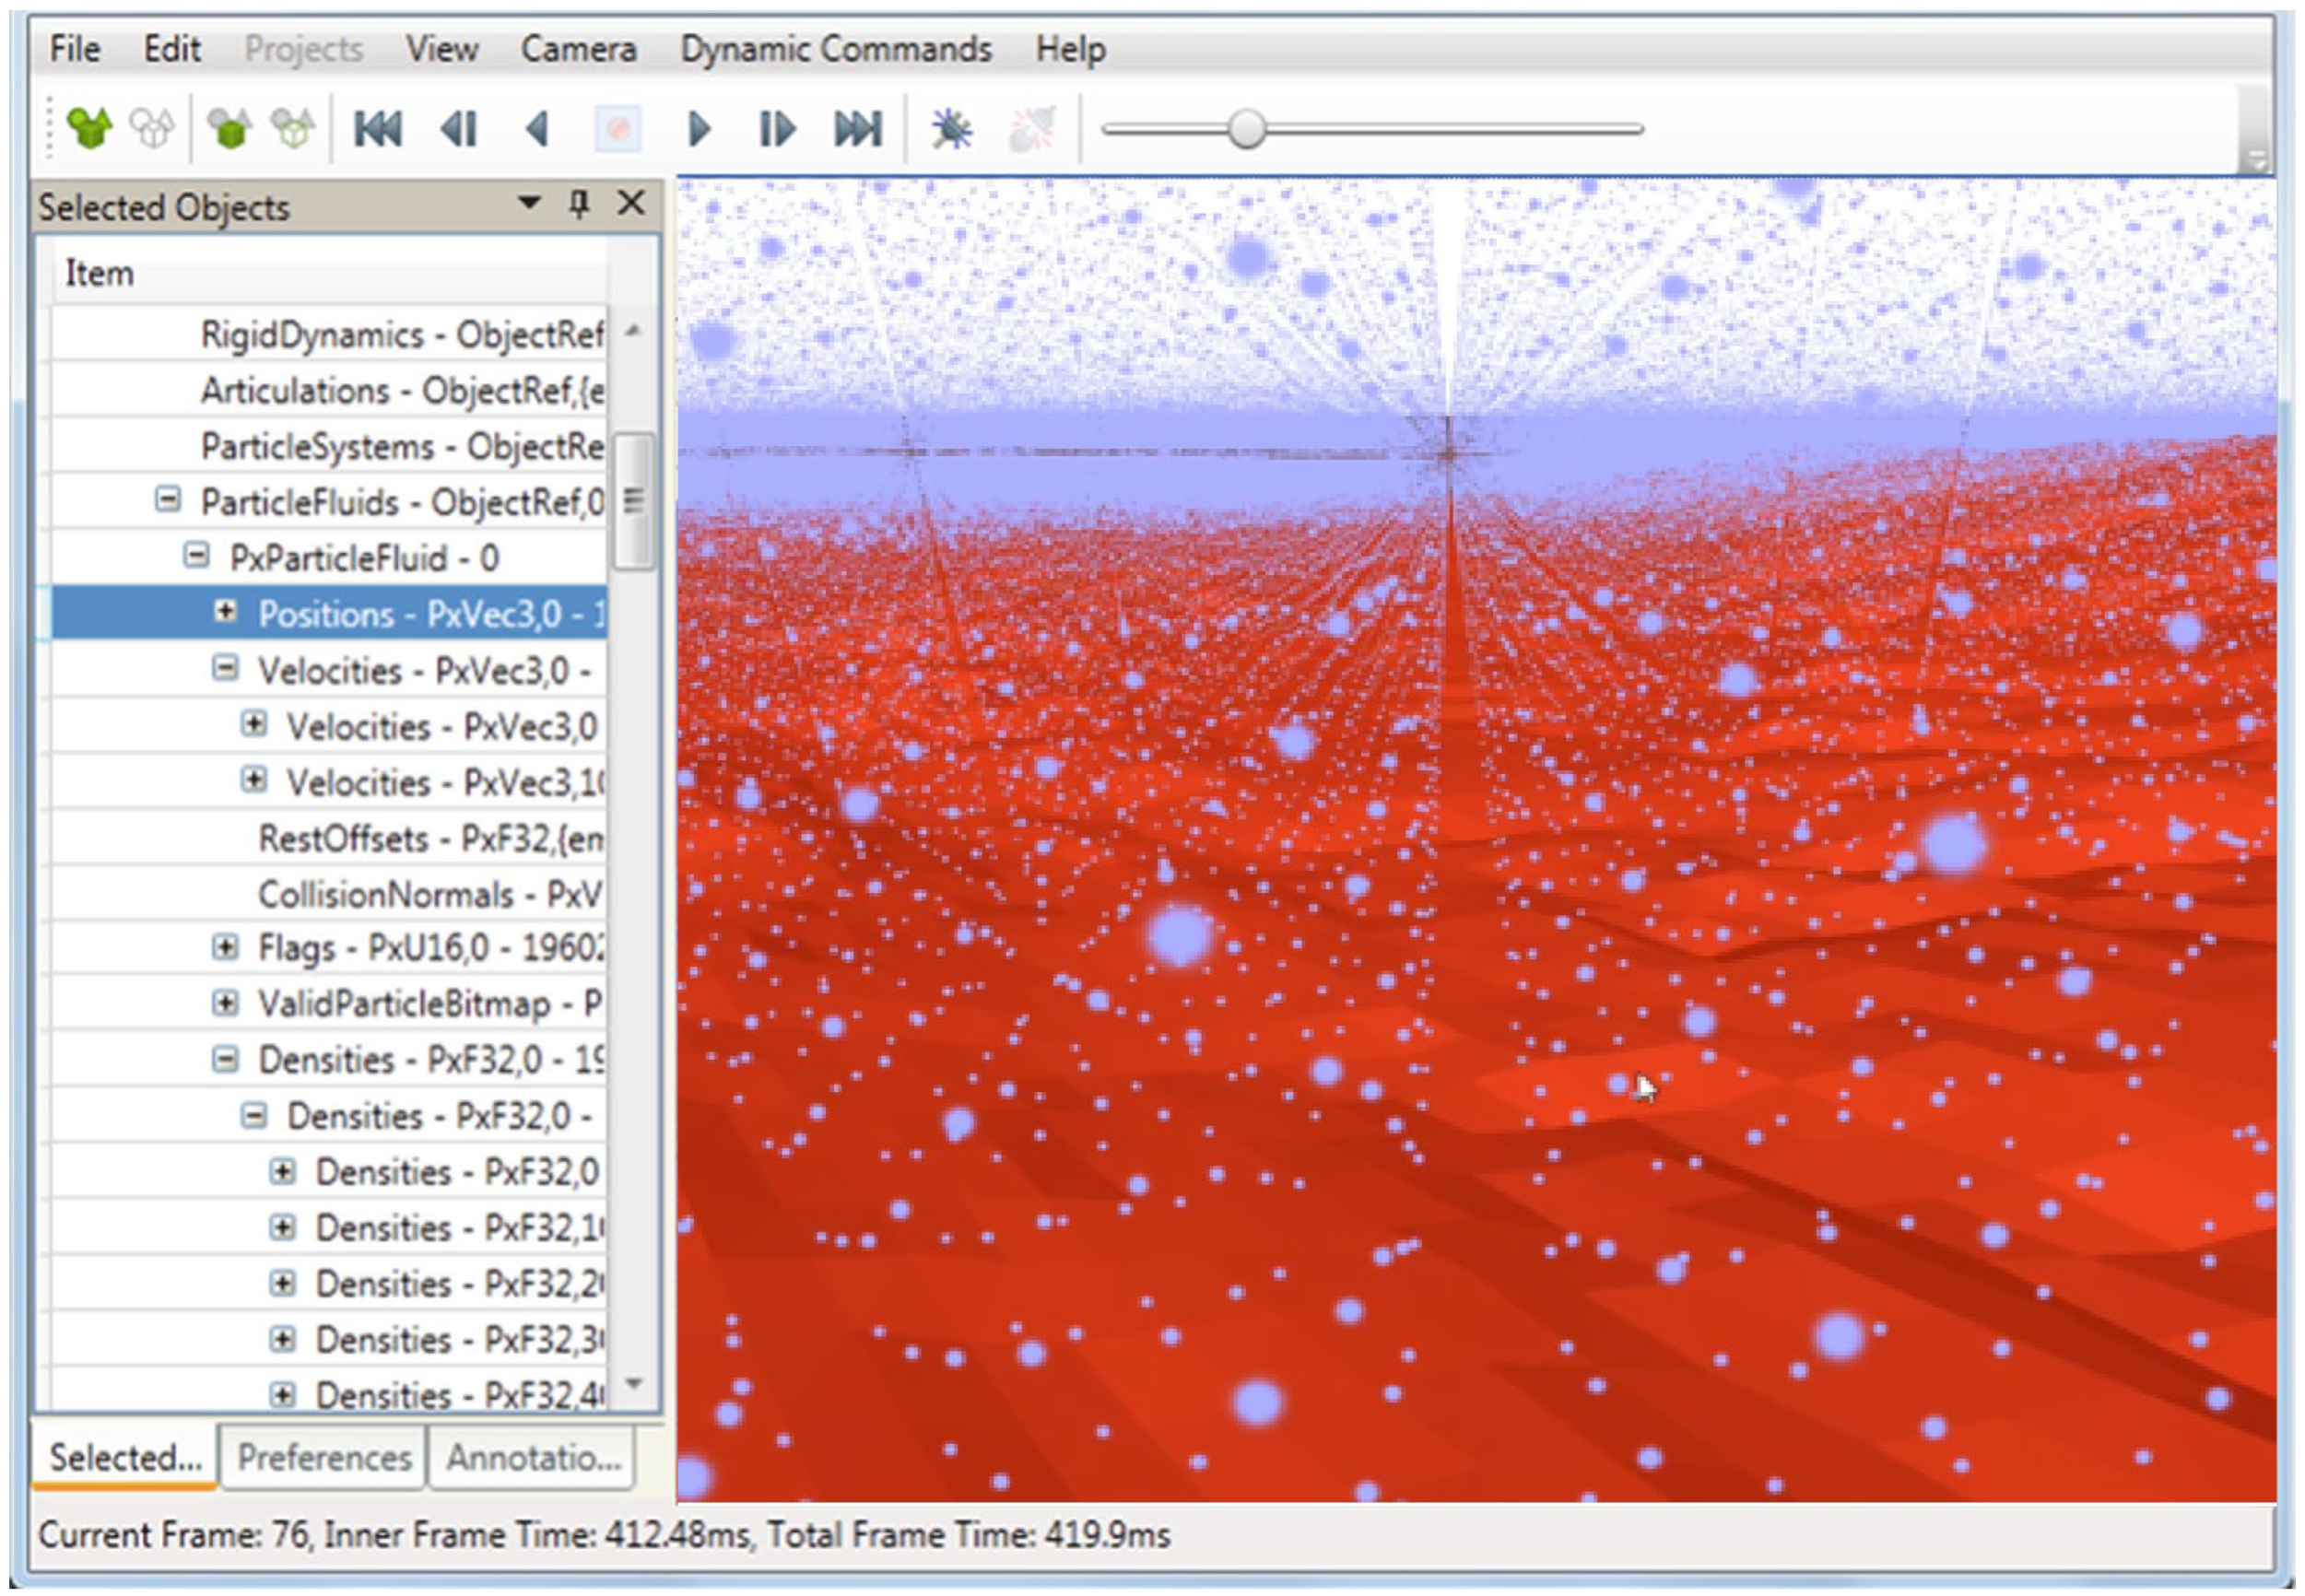
All the data collected during the research were imported into a GIS that, using the methodology in paragraph 2, displayed the main results of the activities we conducted. As regards the atmospheric simulator software,
Figure 5 shows a single frame extracted from the animation offered by the software, highlighting the positions of the particles of the atmosphere in the domain of interest. In
Figure 5, orography (derived from the DEM) is represented with the red color, while with blue dots, the positions of particles in the atmosphere are shown according to the SPH model that rules the interactions between them and their evolution over time.
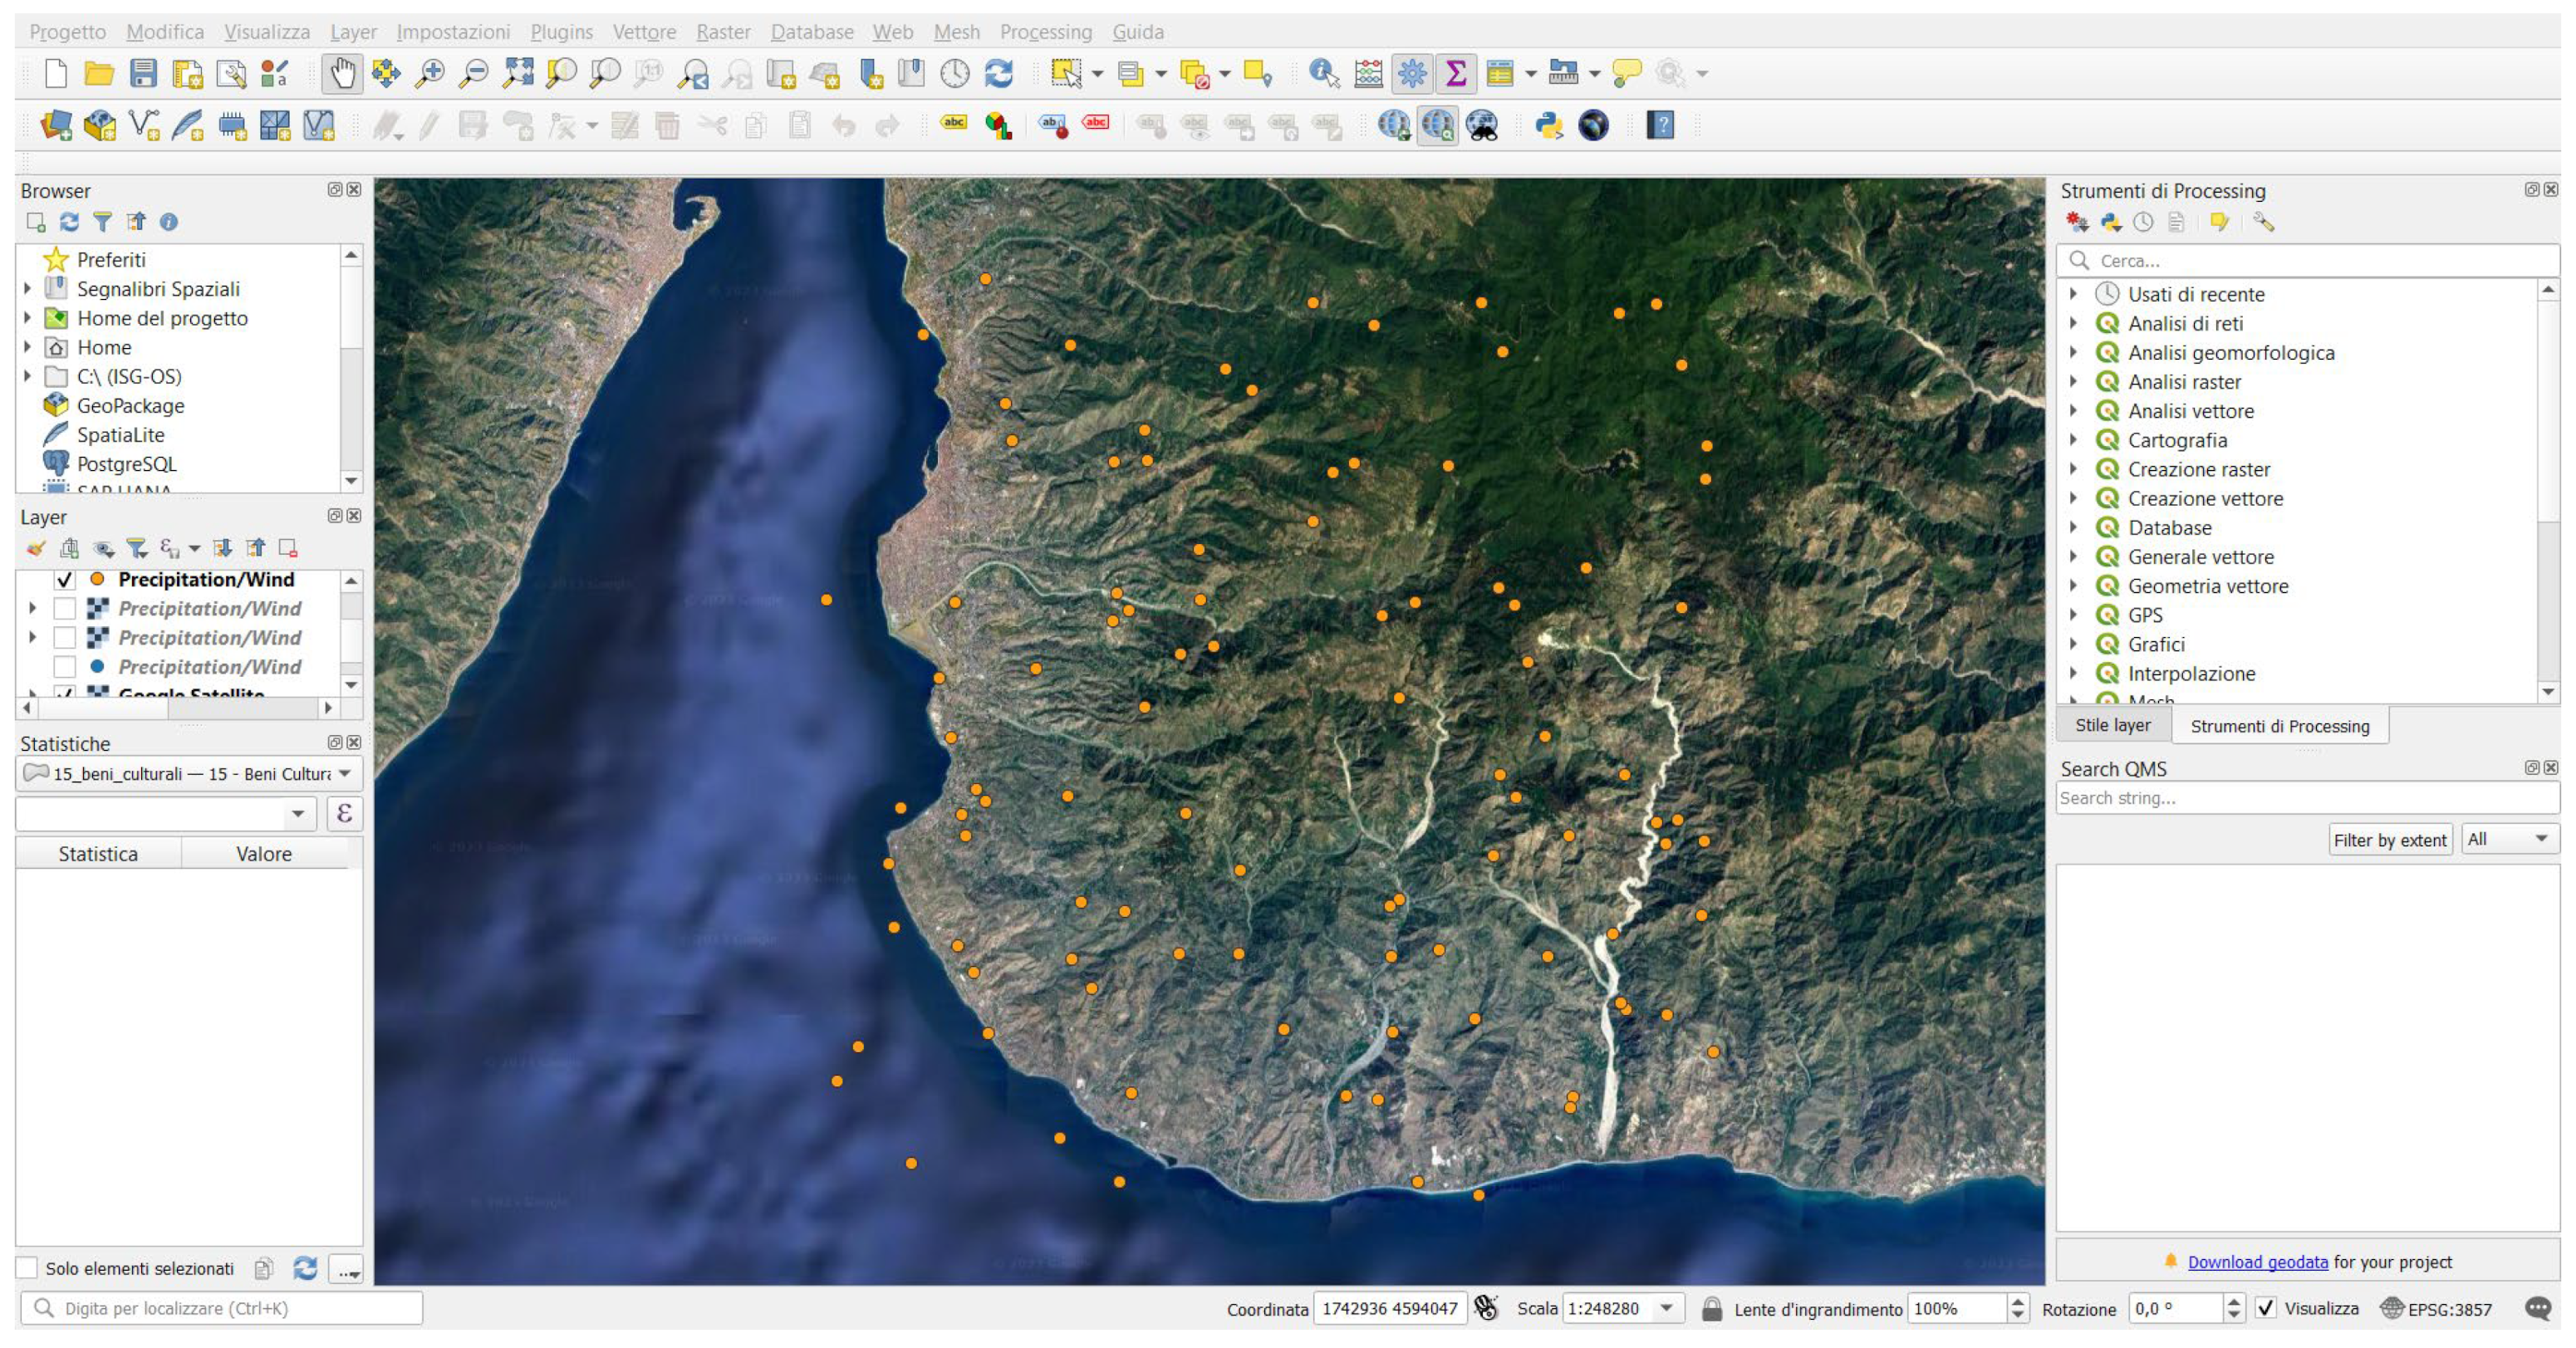
Once the software is running, the Pattern Detector (part of Solver L1) creates clusters with similar atmospheric characteristics, identifying rain, humidity, wind, pressure, etc. Each punctual value, referred to as Clusters, is the output provided by the simulator, which is then imported into the GIS. Below, it shows an example of the extrapolation of the precipitation and wind values represented in
Figure 6 with dots within the area of the case study. One hundred dots with the respective values of these climatic variables were produced by the simulator and reported to the GIS. In the specific case, the values obtained (also validated with the local sensors considering a tolerance of 10%) varied in a range between 0 and 4 mm for the precipitation and in a range from 0 to 55 km/h for the gusts of wind.
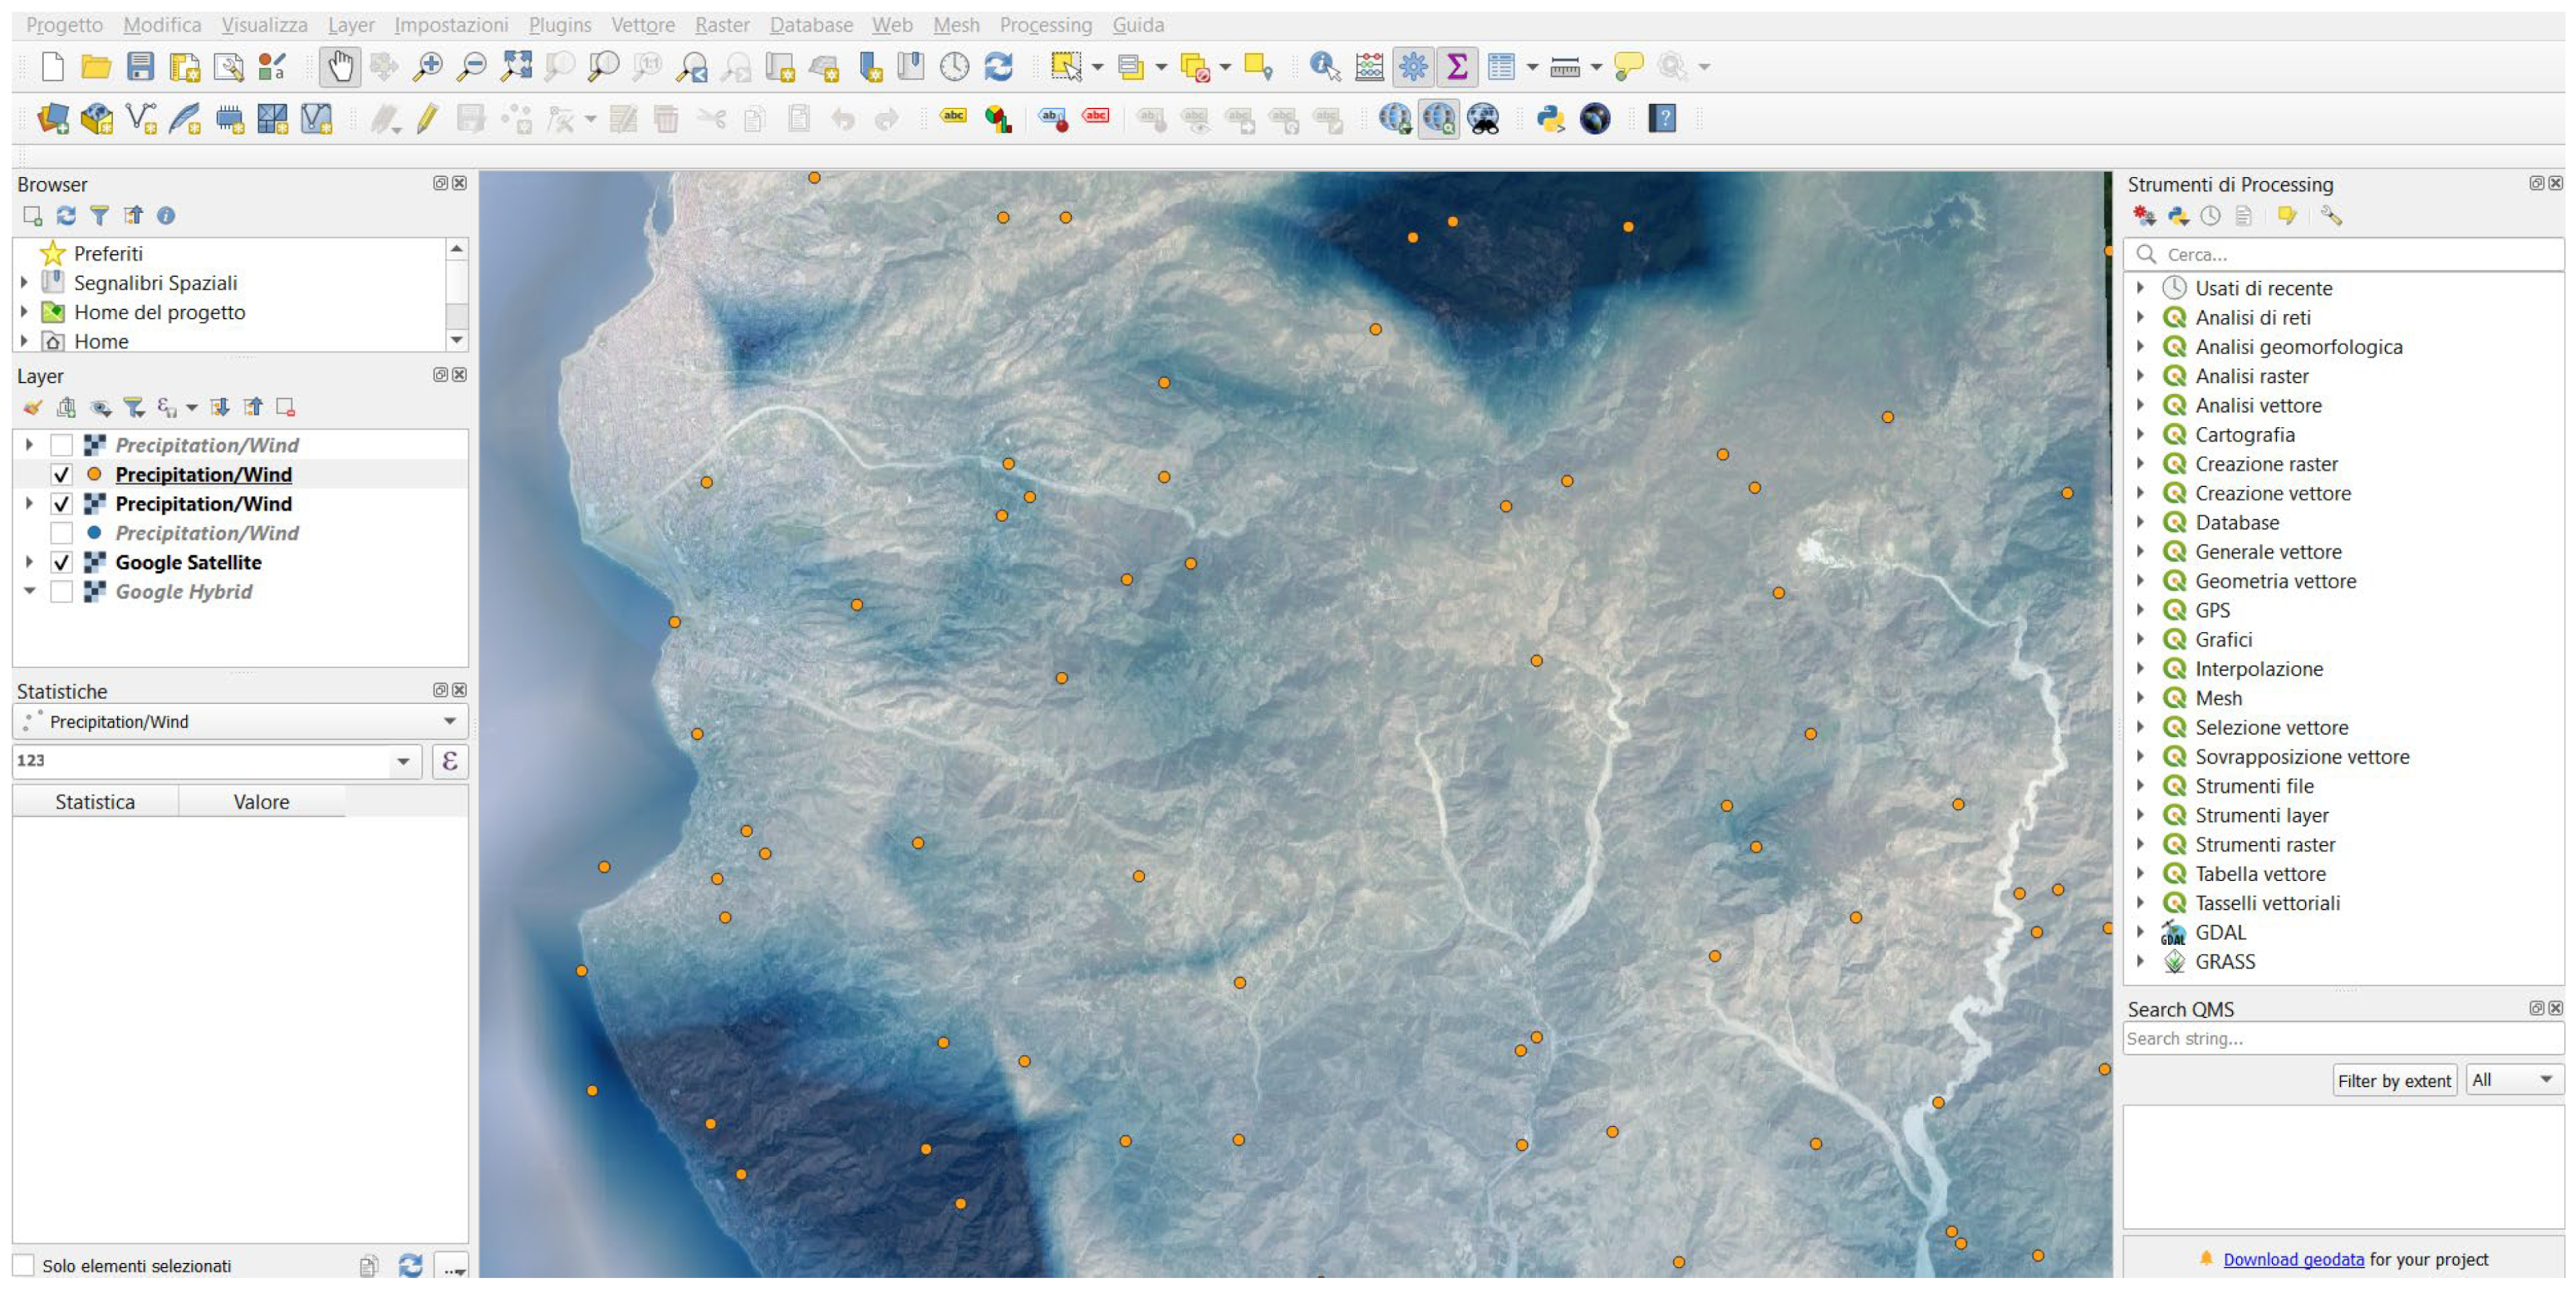
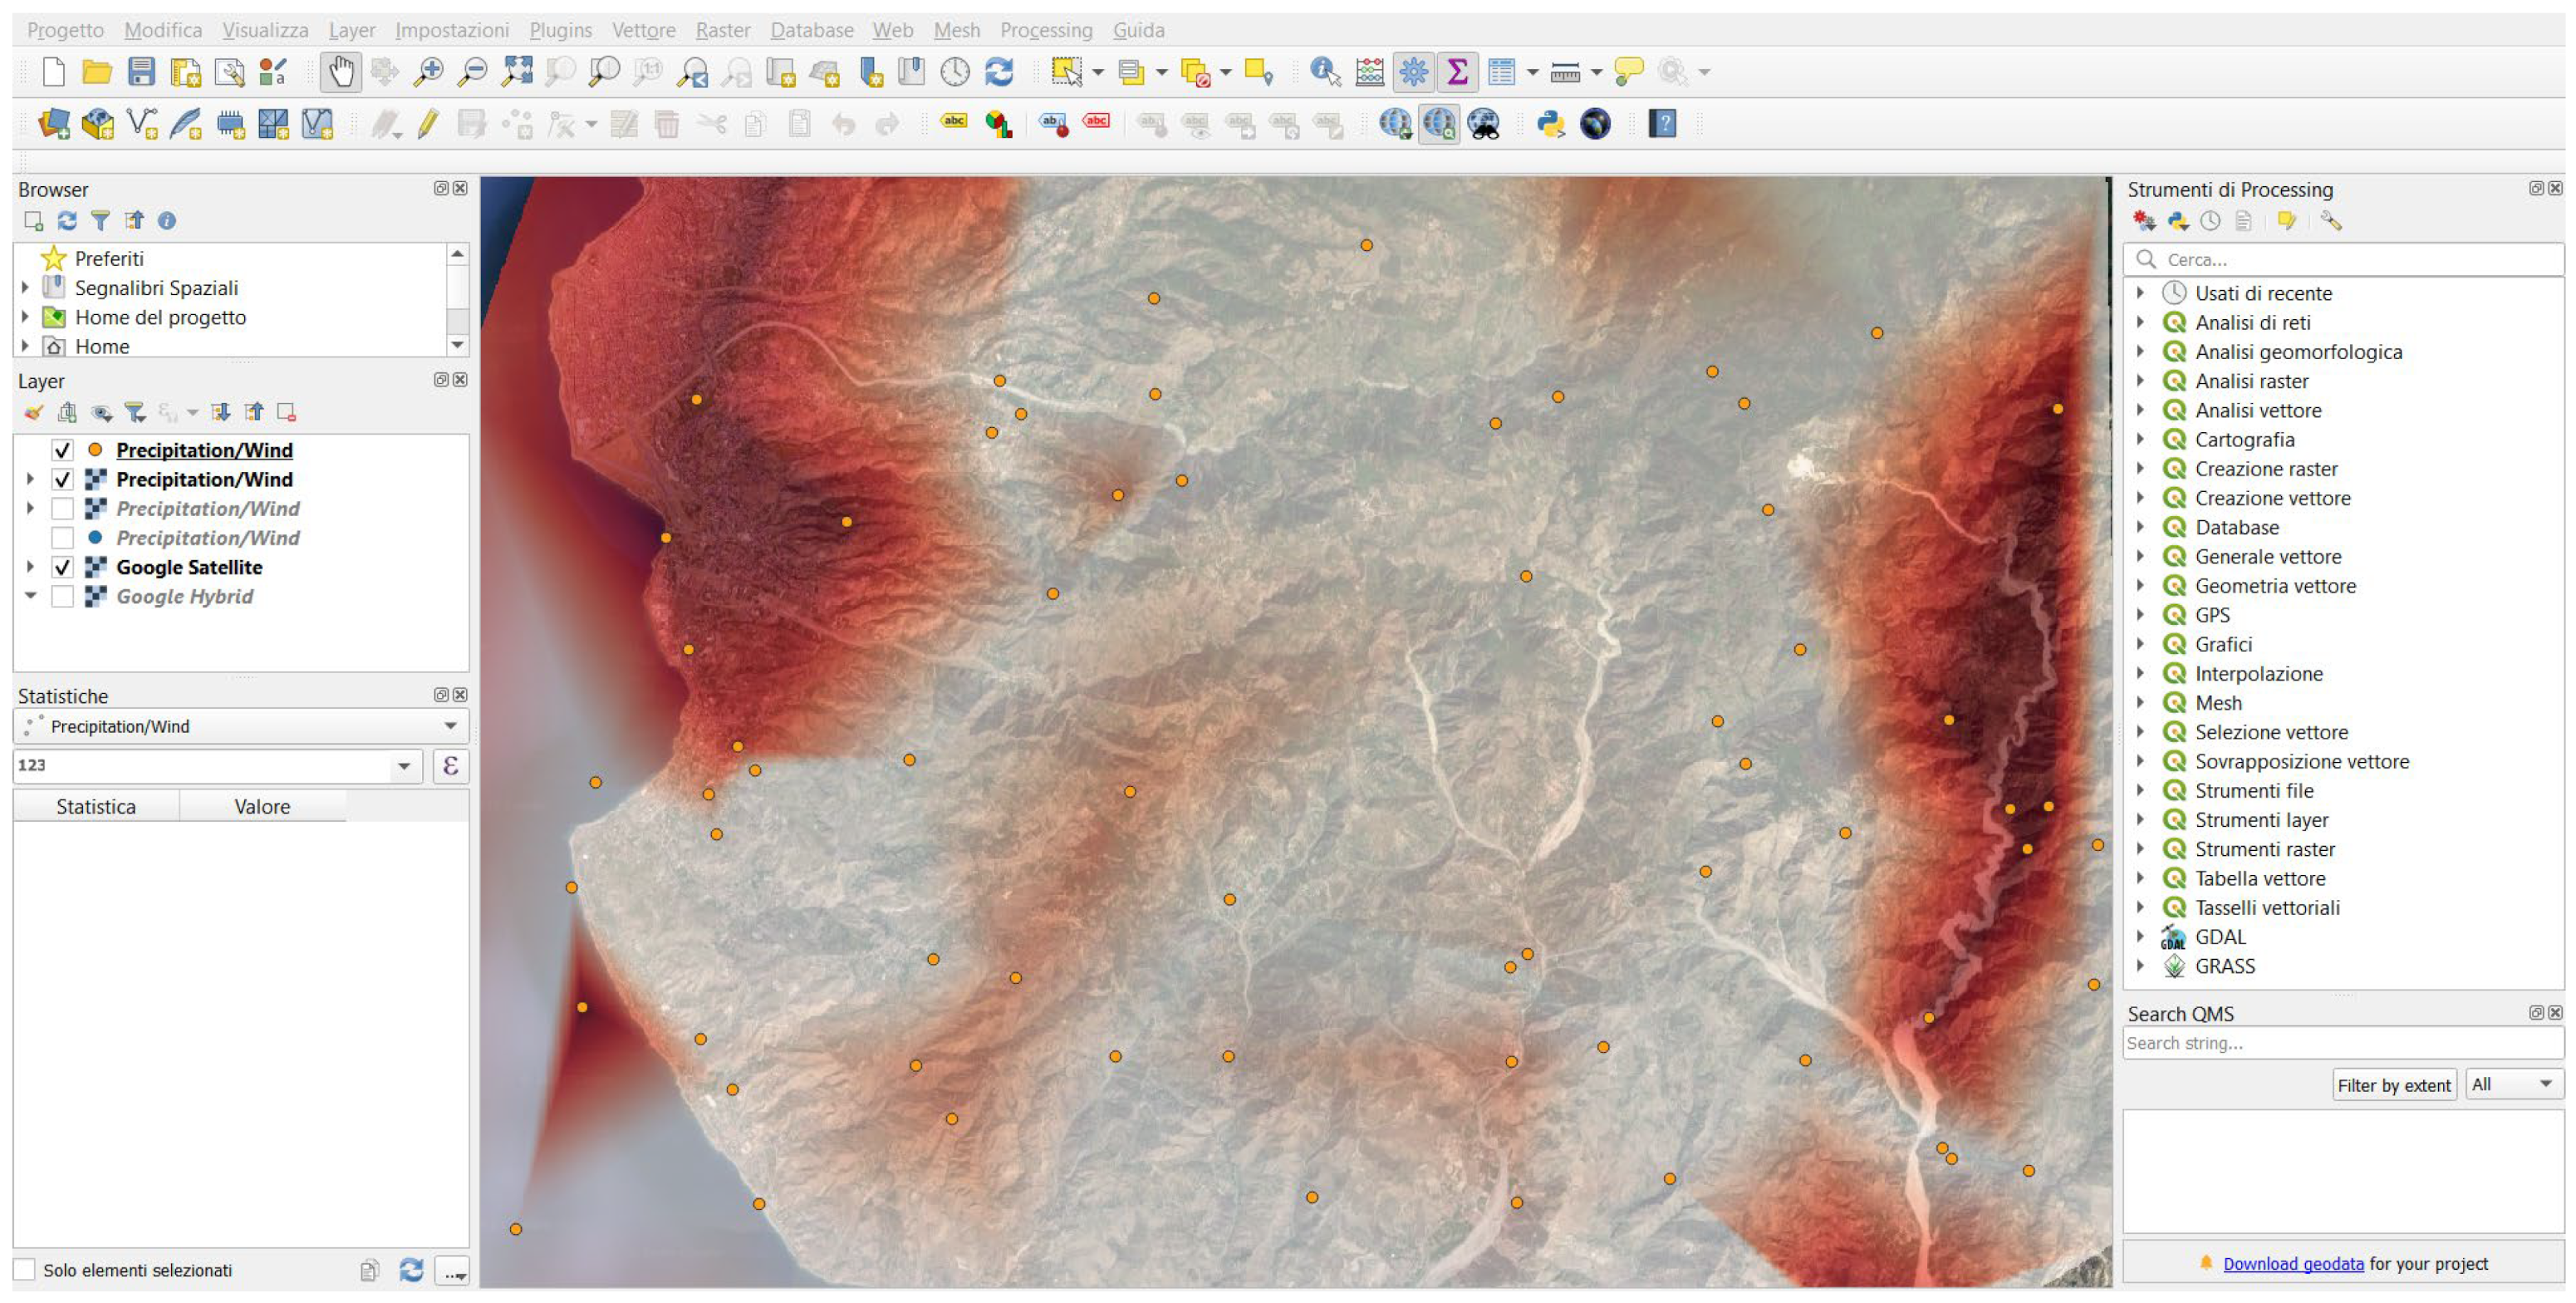
In order to identify the area more susceptible to adverse climatic events, we have interpolated these values, creating the tridimensional map shown in
Figure 7 and
Figure 8. The distribution of climatic events can be variable according to the seasons and specific weather conditions. For an accurate prediction of adverse climatic events, it is necessary to use local meteorological data. For this reason, an analysis of the data from the local weather stations in Calabria (which were used in the initialization phase of the simulator) was carried out. From this analysis, it emerged that, in principle, the areas most affected in Calabria are the coastal areas and the mountainous areas.
After having evaluated Sentinel-2 and WorldView-3 images and UAV multispectral images, a data fusion technique (which also leverages different sensors, such as soil moisture sensors, to further enhance the overall understanding) [
7] was performed in the area of interest, determining the different interest indices such as the NDVI (normalized difference vegetation index), LST (land surface temperature), NDMI (normalized difference moisture index), and BSI (bare soil index) useful for the planning and management of agricultural activities. The choice fell into these indices because they are very relevant in the context of Agriculture 4.0 in order to have an indication of vegetation richness and to capture soil differences [
64]. As is known, to quantify the link between land surface temperature (LST) and vegetation, the normalized difference vegetation index (NDVI) is usually employed as an indication of vegetation richness. But the normalized difference moisture index (NDMI) is an alternative indicator. By studying the correlations between the land surface temperature (LST), the NDMI, and the NDVI, some studies show that the linear association between LST and NDMI is stronger, whereas the relationship between LST and NDVI is significantly less and varies by month. The linear association between LST and NDMI steadily decreases as the seasons change from summer to fall. This finding implies that NDMI, in addition to the previously used NDVI, can be used to analyze LST. NDVI values range from −1.0 to 1.0 in general, with negative values suggesting clouds and water, positive values near zero indicating bare soil, and higher positive values indicating sparse vegetation (0.1–0.5) to thick green vegetation (0.6 and above). The bare soil index (BSI) is a numerical indicator that captures soil differences by combining blue, red, near-infrared, and short-wave infrared spectral bands. These spectral bands are employed in a normalized fashion. The blue and near-infrared spectral bands are utilized to highlight the presence of plants, whereas the short-wave infrared and red spectral bands are employed to measure soil mineral content. BSI can be utilized in a variety of remote sensing applications, including soil mapping, crop identification (in conjunction with NDVI), and so on. In particular,
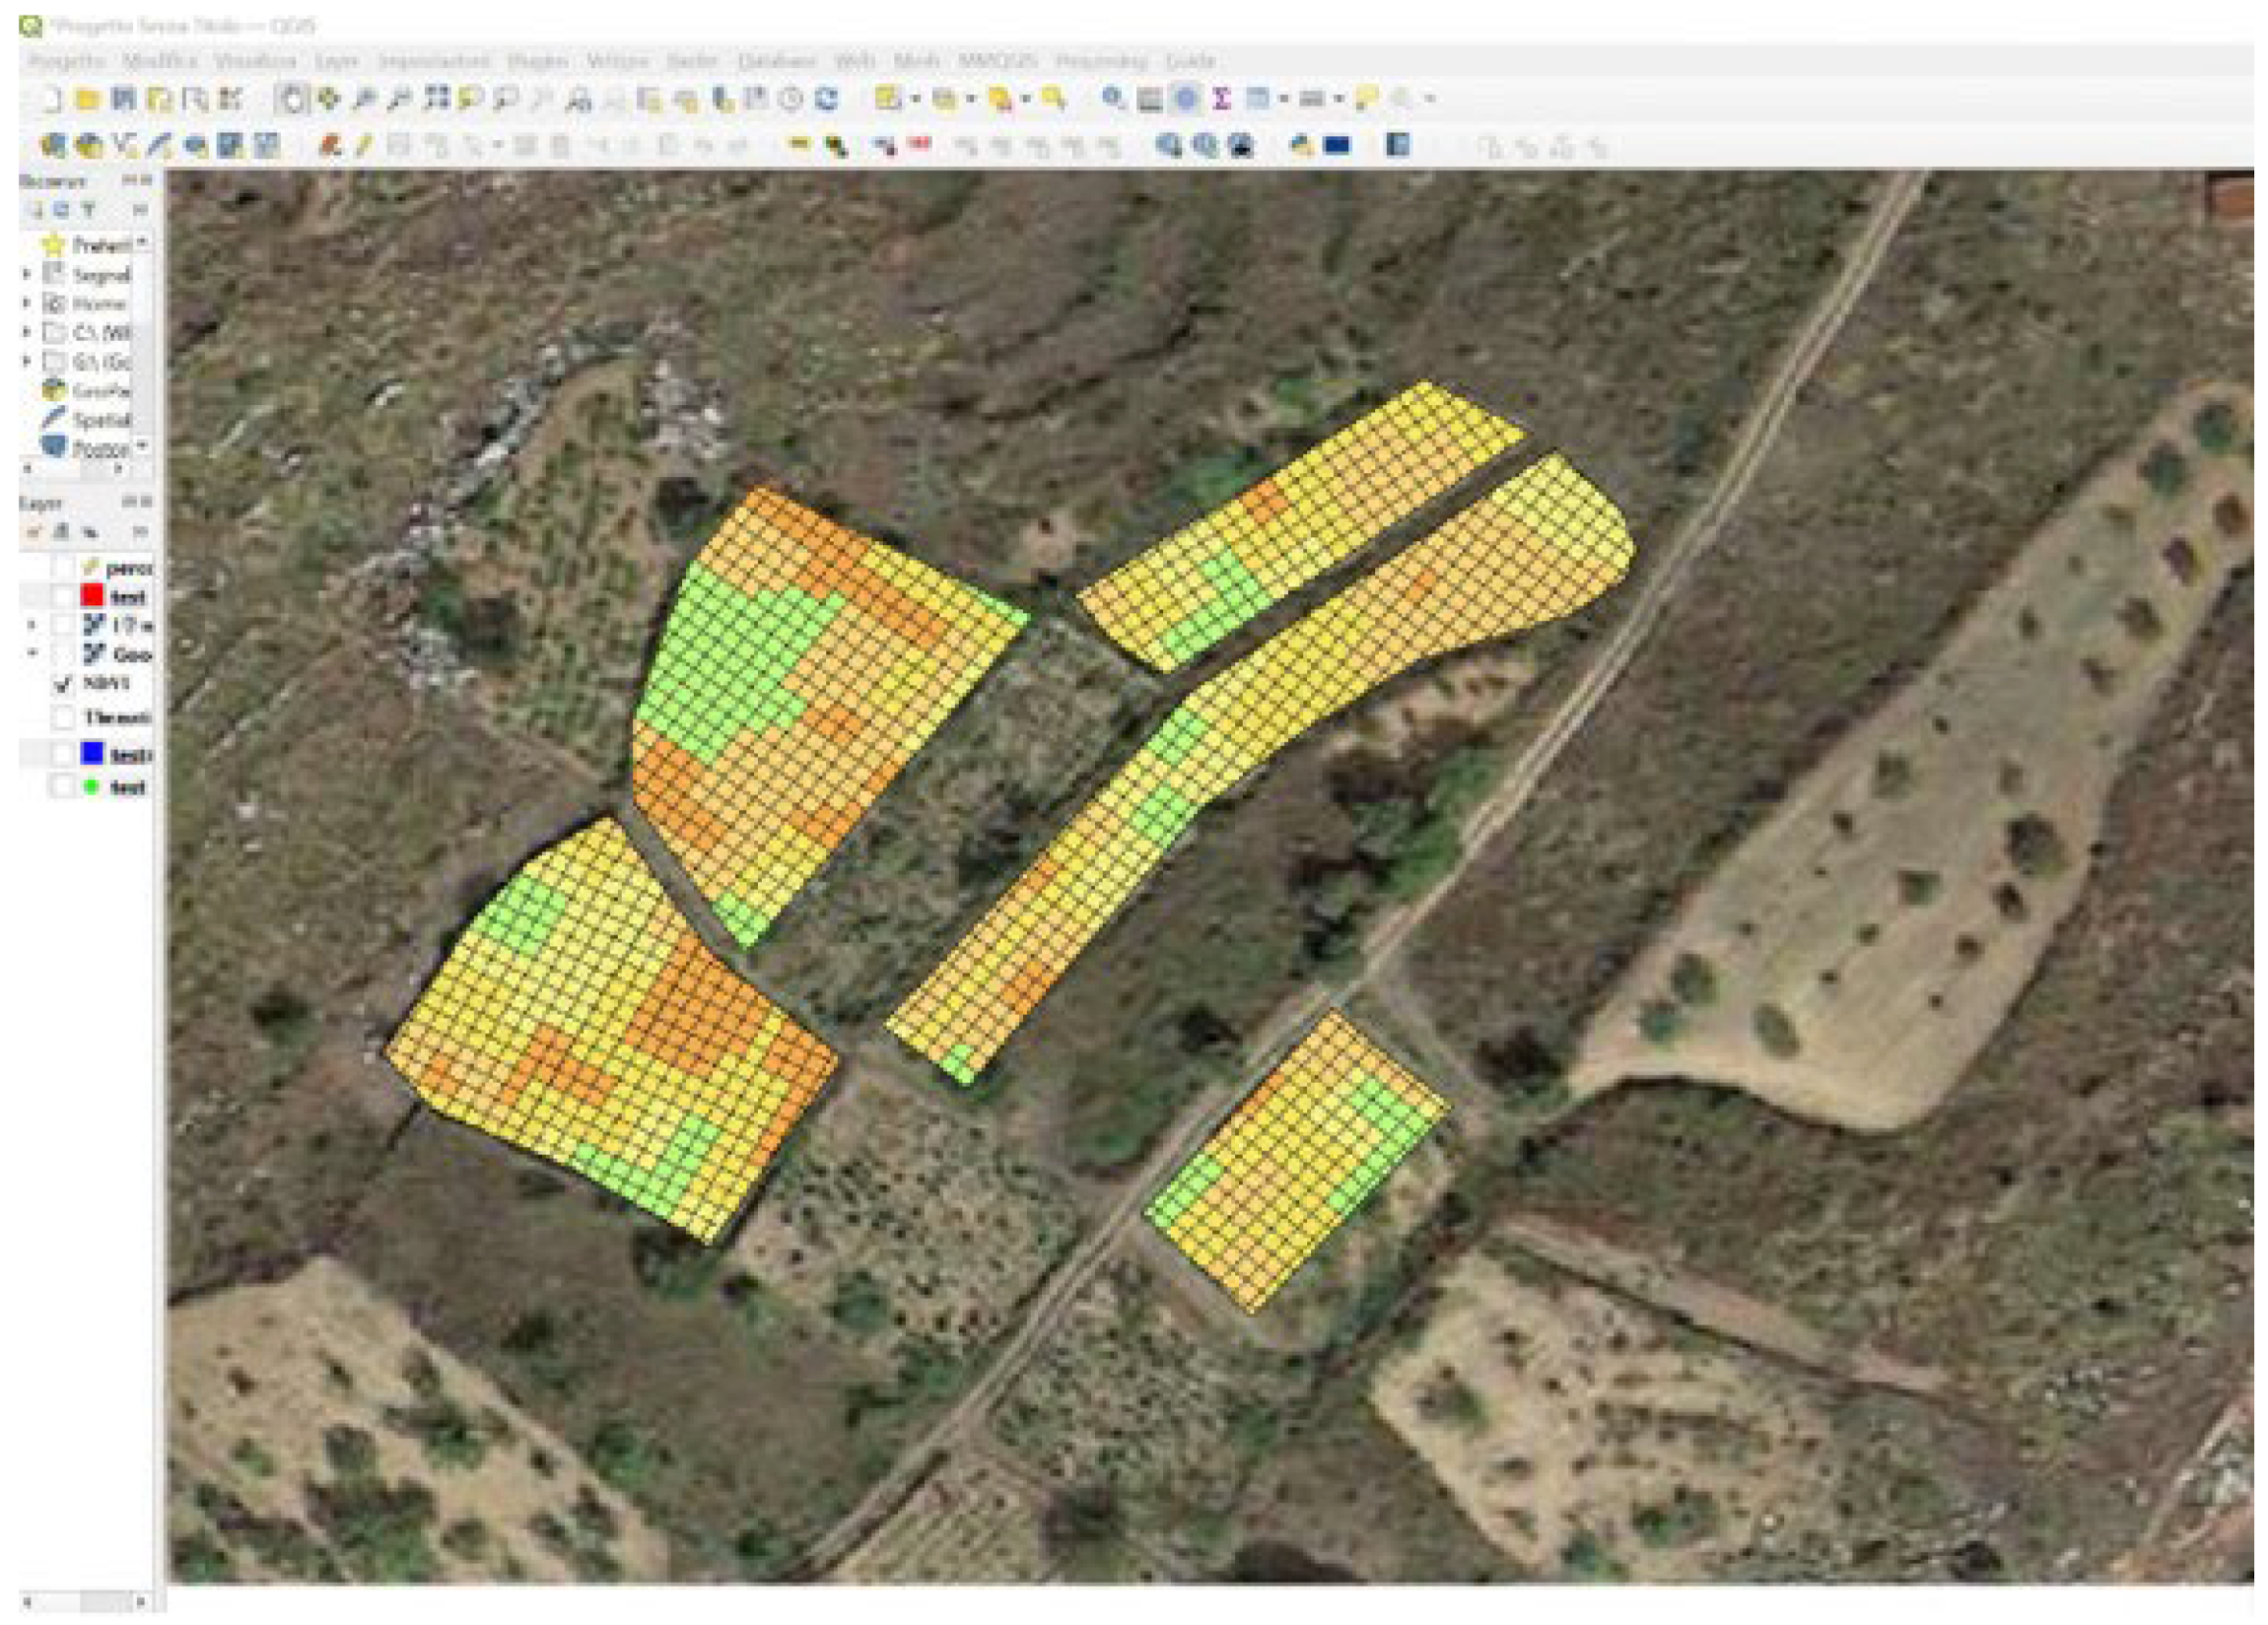
Figure 9 shows an application of the data fusion technique [
7] used to calculate the NDVI in the study area.
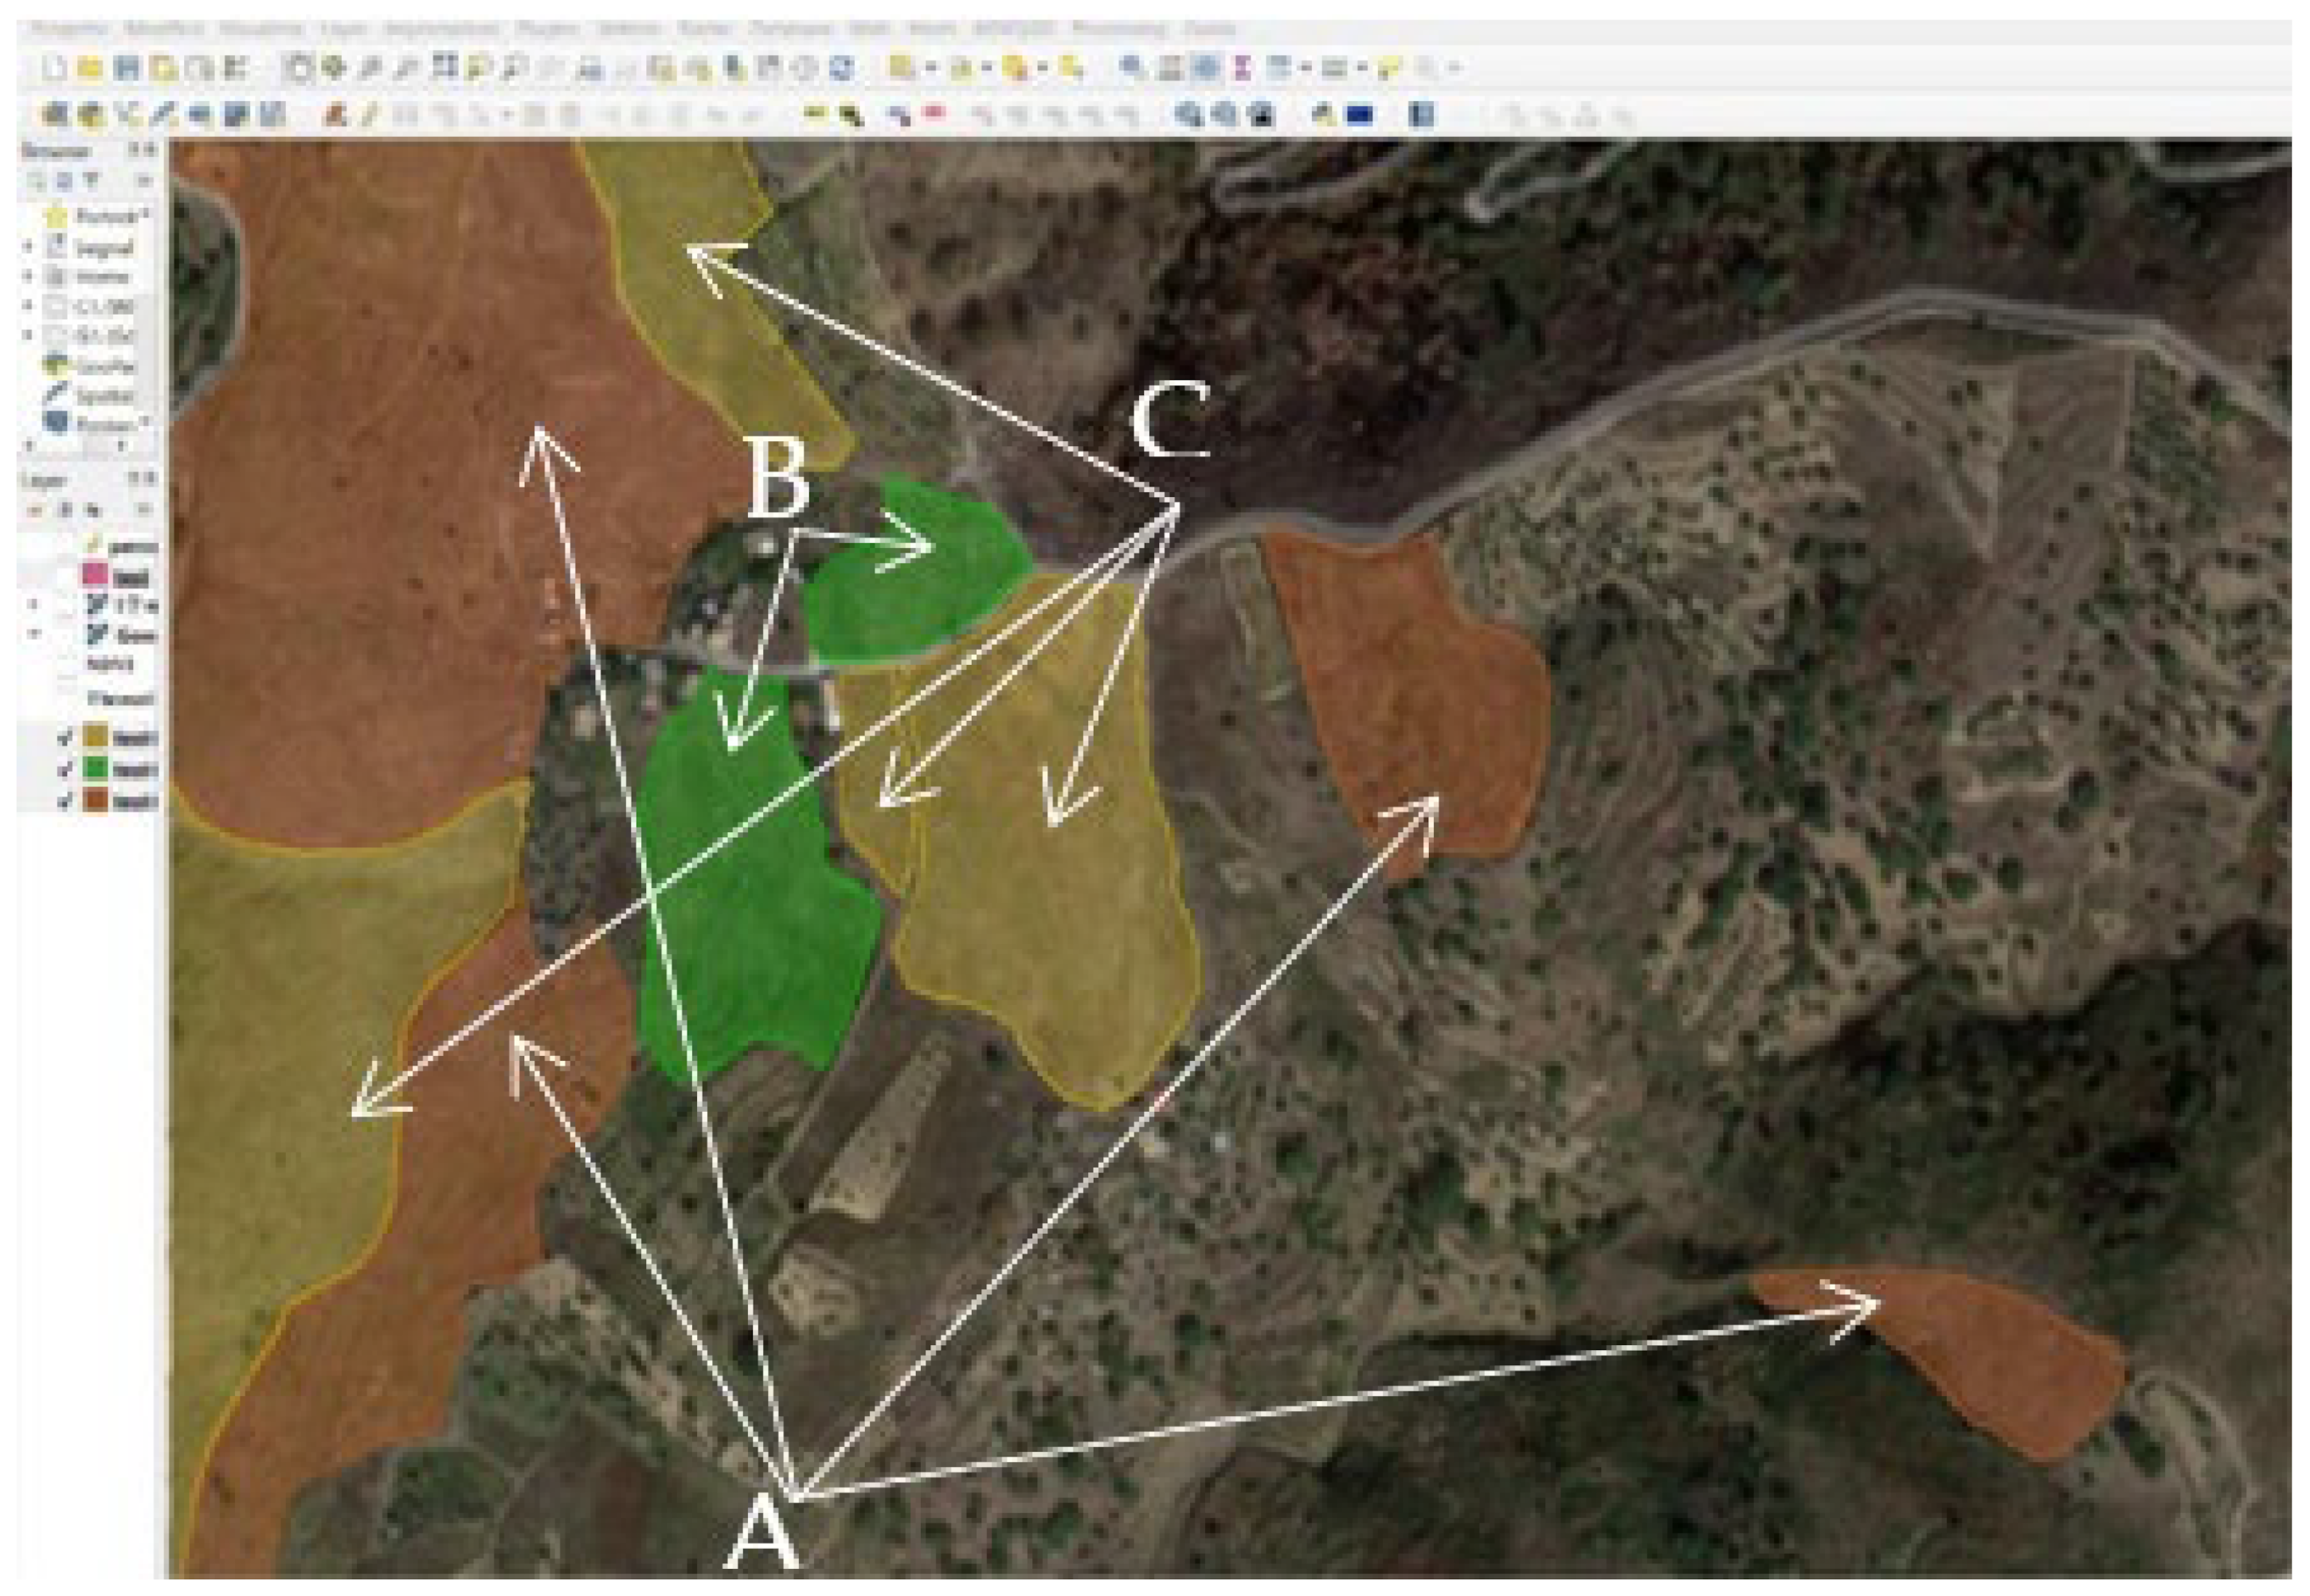
Once the data were collected from the multiple sources, we were enabled to identify using the open-source GIS, in relation to climate parameters, sensor values, and indices deriving from satellite and UAV images (wind, soil type, soil moisture, NDVI…), different types of areas suitable for the cultivation indicated with different capital letters (A, B, C, D…) and grouped for simplicity of treatment according to the parameters useful for the particular types of crops. Specifically, the available data have made it possible to identify in the study area exclusively three types of classes (A, B, and C) reported with different colors. Typology A (orange color): cultivation areas suitable for crops that do not need continuous irrigation. Typology B (green color): cultivation areas suitable for crops that need continuous irrigation. Typology C (yellow color): cultivation areas suitable for trees.
Figure 10 shows the three different typologies of cultivation.
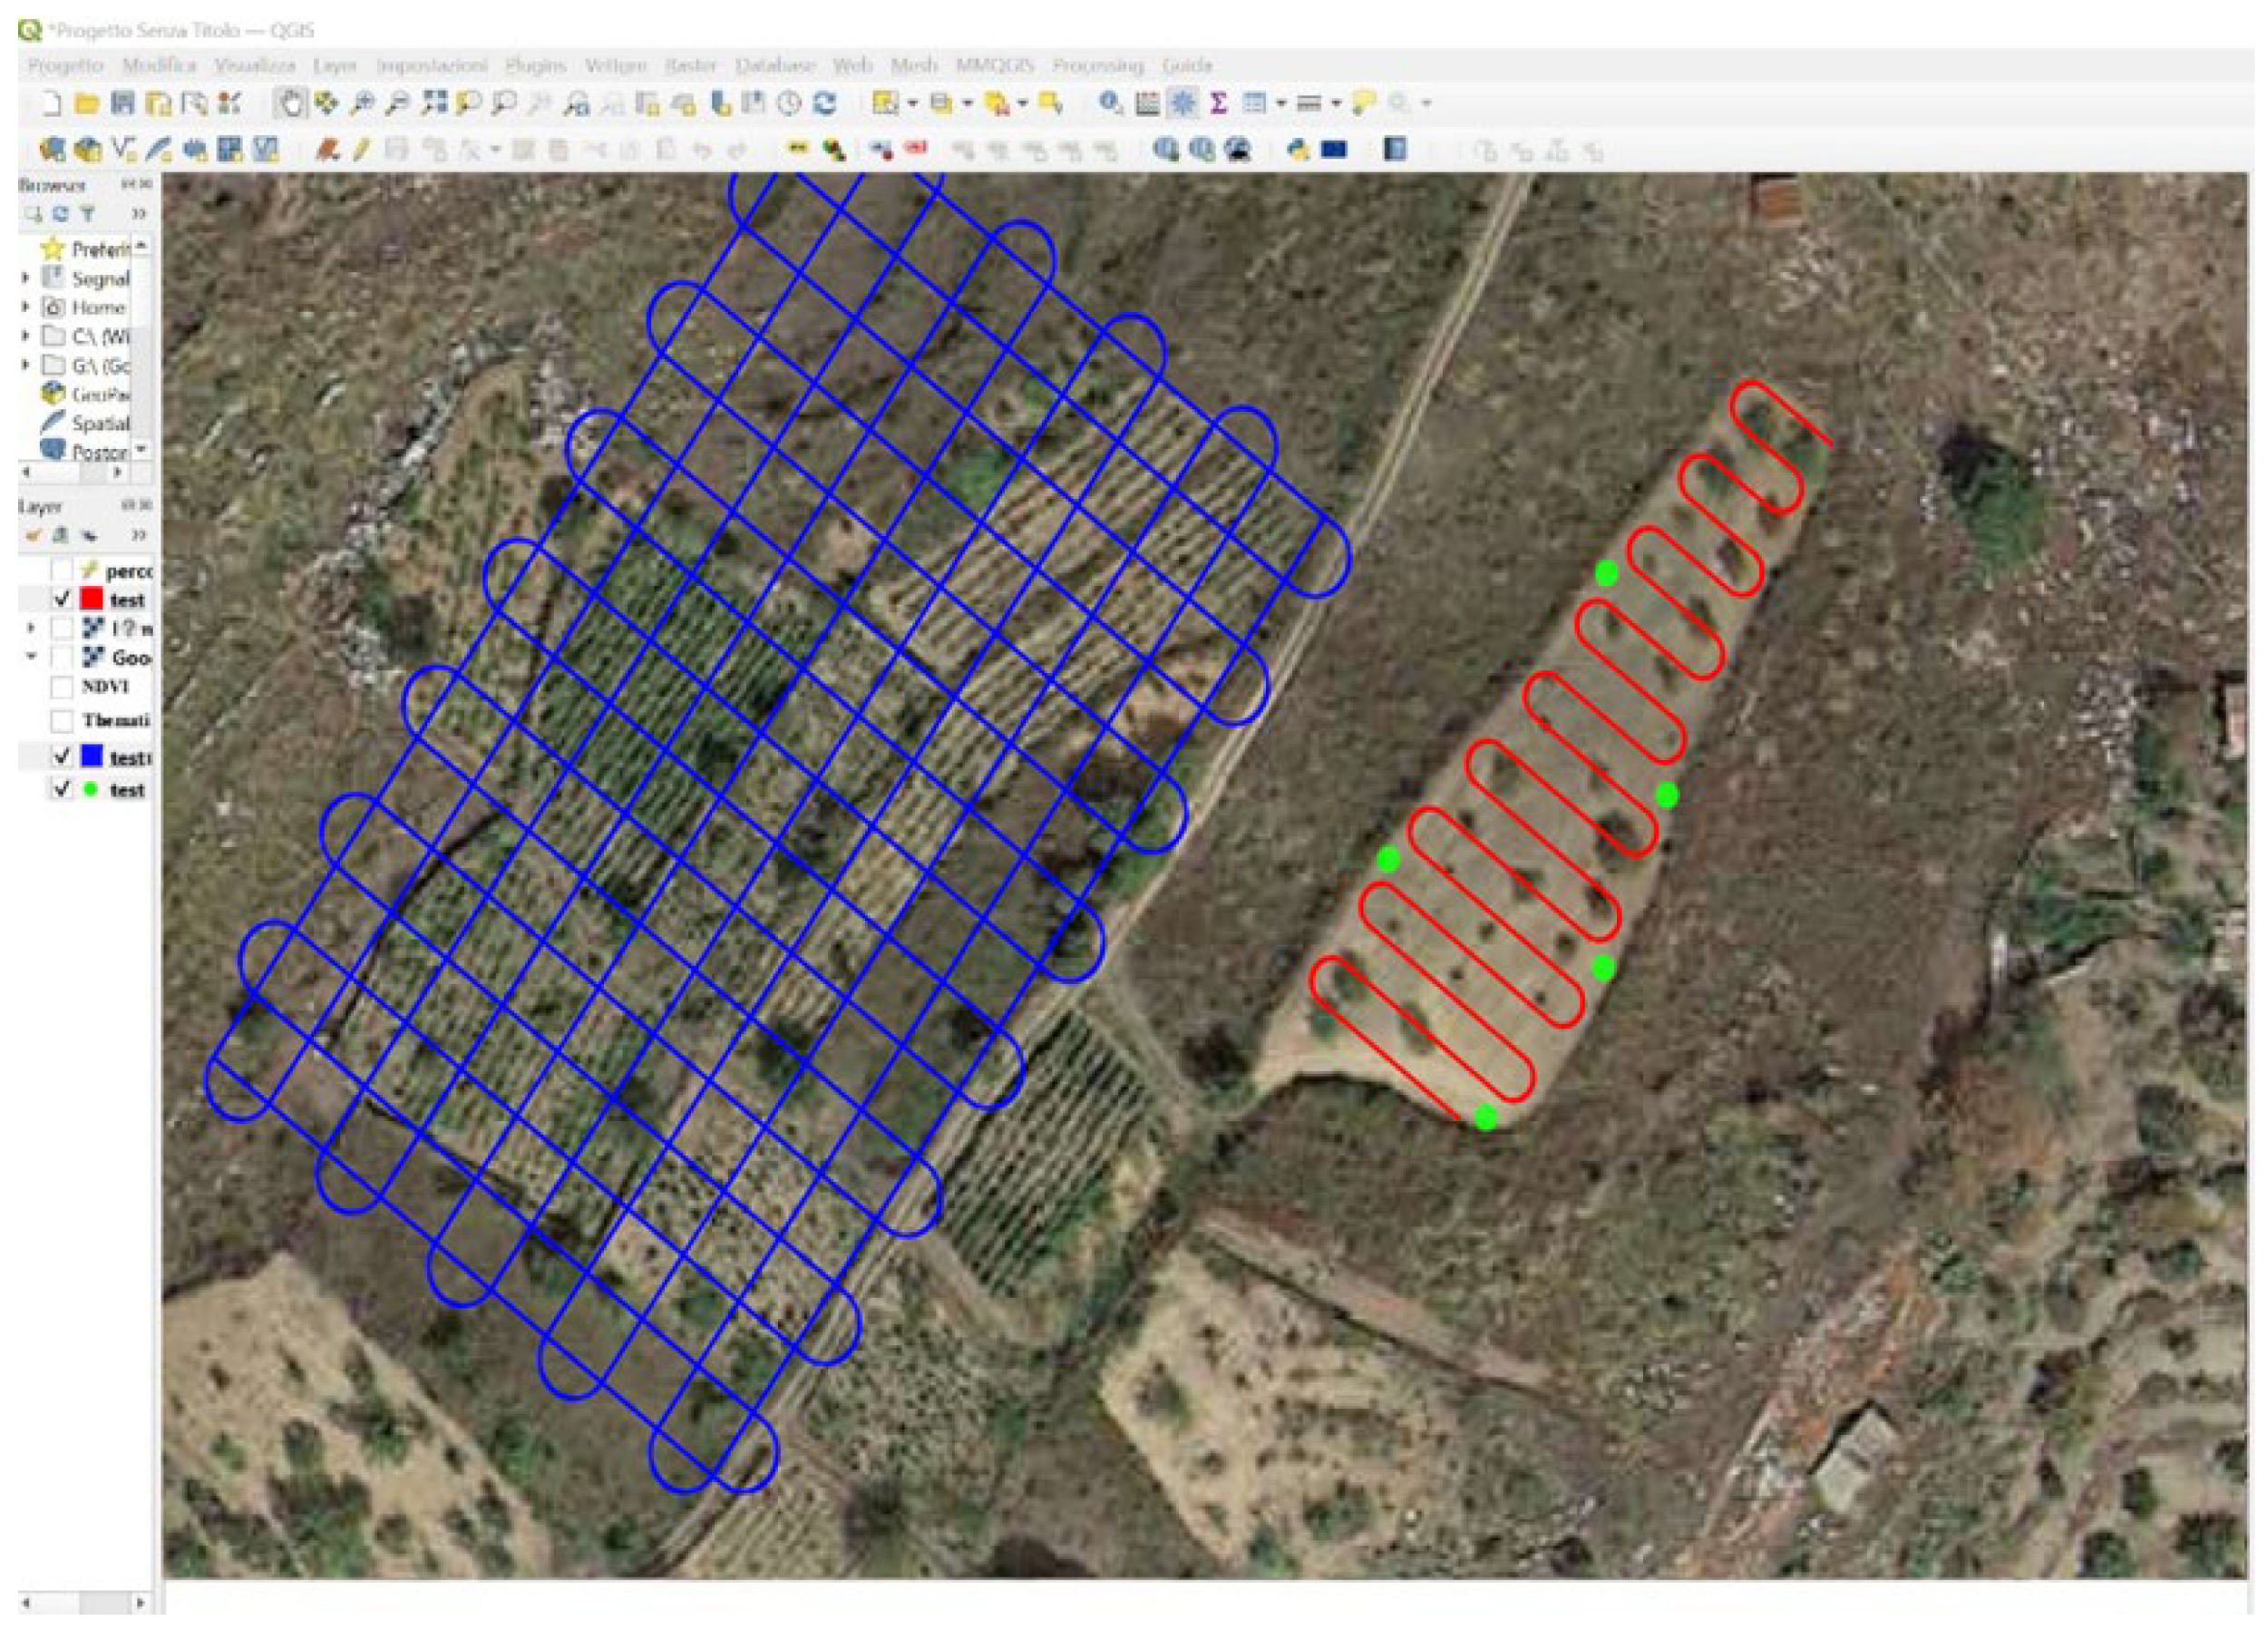
Finally, using the methodology and algorithms illustrated in paragraph 2, the GIS allowed us to establish the path of a drone used for monitoring existing crops and the path of an automatic tractor used for fertilization and irrigation. In
Figure 11, the path of the drone in an existing crop is shown with a blue line, the path of the tractor with a red line, and the points at which greater fertilization and irrigation interventions are required with green dots.
Figure 10 shows the application of the methodology concerning the choice of the different typologies of cultivation in a small portion of the study area.
Figure 9 and
Figure 11, representing the calculation of the NDVI and the optimal path of the drone and the tractor, respectively, refer to a small area included within the larger area represented in
Figure 10.
6. Conclusions
The advantages of the proposed innovative system are evident in terms of time consumption, human resources, and productivity. In fact, the automation of some fundamental agricultural activities normally carried out by people saves time and costs. Furthermore, the possibility of analyzing different types of data on soil conditions and the well-being of crops can increase productivity and quality and save a highly precious resource, water, which is instead managed according to what emerges from the weather variables provided by the simulator. The main novelty reported in this article lies precisely in the use of this software, which, through a few input data, allows you to have an assessment of the weather conditions. Furthermore, although self-driving tractors are still relatively new, they are already having a significant impact on the agriculture industry. With the rapid advances in technology, it is likely that self-driving tractors will become more common in the future and will continue to transform the way farming is conducted.
This research focused on a specific area in the province of Reggio Calabria, leveraging the morphological and orographic characteristics of the region for the application of various technologies. This demonstrates that, with proper planning and implementation, such approaches can be adapted to specific agricultural contexts, thus maximizing the benefits obtained. The future developments of this research should focus first of all on speeding up and optimizing data processing and data transmission protocols, possibly experimenting with more efficient algorithms in terms of productivity and processing, and moreover, on the validation and large-scale implementation of these integrated systems. Collaboration between research institutions, agricultural organizations, and farmers will be crucial to promoting the adoption of these innovative solutions. The ultimate goal is to create a sustainable agricultural approach that efficiently utilizes available resources, reduces environmental impact, and is beneficial for farmers. This requires the continuous development and adaptation of technologies and methods, taking into account the specific needs of different crops, environmental conditions, and the farmers’ requirements.


 ,
, 


