1. Introduction
The pervasive issue of plastic contamination in cotton lint has swiftly escalated in importance for the U.S. cotton industry. This urgency has been underscored by the rise in new harvester designs that involve plastic-wrapped cotton modules, consequently leading to a new prevalence of plastic within cotton bales–a trend noted by textile mills. U.S. cotton classing offices have pinpointed the primary source of contamination to be the plastic wraps used on cotton modules sourced by the novel John Deere harvesters. Despite the industry’s robust efforts to eliminate all plastic during module unwrapping, residues persistently infiltrate the cotton gin’s processing system [
1]. Plastic contamination has been implicated in the depreciation of the U.S. cotton’s market value. Once commanding a premium of
$0.02 (U.S.)/kg on the international market for its superior cleanliness, the advent of plastic-wrapped modules has some economists projecting that U.S. cotton is now trading at a discount of
$0.01 (U.S.)/kg, amounting to a total loss of
$0.034 (U.S.)/kg [
2,
3] in comparison to relative market trading just before the introduction of the new harvesters that wrap the cotton in plastic. When extrapolated across a typical annual cotton yield, the projected financial burden on U.S. producers exceeds
$750 (U.S.) million per annum, prompting grave concerns among cotton growers and the gin industry [
4,
5,
6,
7,
8]. While it is noted that plastic contamination may not be wholly responsible for this loss, economic analysis suggests it is a major contributor.
In response to this critical issue, our team has developed an innovative plastic contamination detection and removal system. This system harnesses the capabilities of economical color cameras to detect plastic on the otherwise obscured dispersing cylinders of the module feeder. This paper outlines our pioneering work towards combating the plastic contamination challenge in the U.S. cotton industry. In particular, it focuses on the development of an auto-calibration algorithm to help reduce the skill and labor required to operate the system. Our research further identified a recurrent mechanism for the introduction of the contamination: plastic entrapped beneath modules due to improper unloading or unwrapping processes (
Figure 1).
Which would invariably lead to large pieces of module wrap plastic becoming entrained onto the module feeder dispersing cylinders,
Figure 2.
In the course of cotton processing, the accumulation of plastic on the dispersing cylinders of module feeders results in the disintegration of these plastic constituents into diminutive fragments, subsequently leading to the pervasive dispersion of contaminants within a substantial cotton volume. The optimal location for detecting and removing these plastic contaminants is on the gin-stand feeder apron, immediately preceding its entrance into the gin stand. This juncture is characterized by a maximally dispersed, minimally dense cotton stream. Consequently, the feeder apron is a prime location for the integration of a vision system purposed with the detection and removal of plastic contaminants contained within seed cotton. Notably, the application of such a system is met with significant challenges, primarily due to the high-speed detection operation necessitated by the spatial constraints of the feeder apron, which only extends to a length of 0.4 m, within which the plastic contaminants must be detected and extricated from the seed cotton.
The ejection mechanism utilizes a series of air-knives that blow the plastic off the gin-stand feeder apron. The system was configured with four air-knives, and the software was developed to spot the location of the plastic which, in turn, allows it to trigger the correct air-knives. For plastic on the edge of the image, the software turns on both its air-knives as well as its neighbor’s air-knife to ensure successful ejection occurs even when plastic is straddling between two neighboring systems. The feeder apron facilitates the progression of cotton at approximately 3 ms−1, affording the machine-vision software a narrow window of approximately 25 ms to execute image capture and subsequent analysis, and ultimately initiate a digital output line capable of actuating a solenoid that facilitates the removal of plastic contaminants from the seed cotton stream. To achieve these tasks within the constricted temporal parameters, the software was developed utilizing a combination of custom software, written in a low-level C++ programming language, while leveraging high-speed open-source machine-vision libraries. Laboratory and commercial field trials provided evidence that the technology, as a system, is able to reject >90% of plastic (excluding black, clear and white plastic). Further details on the experimental testing will be covered in a subsequent experimental “Research” paper that will be submitted for publication shortly.
The primary aim of this technical manuscript is to elucidate the intricacies involved in the software architecture of a sophisticated, machine-vision guided, cotton-gin stand feeder inspection and contaminant removal system. The system includes a machine-learning program that automatically detects and removes plastic contamination on the gin stand. With the proposed new algorithm, the system will be capable of automated adaptive learning of the colors of the flowing cotton. Further, it will be able to adjust detection performance to avoid false-positive detections when cotton’s natural constituents exhibit colors very close to plastic contamination.
While the semi-automated approach works, when cotton conditions change; for instance, the addition of green-leaf or yellow-spotted cotton bolls; then a new calibration is needed to avoid having the system be inundated with lots of false positives. With the addition of the plastic ejection module, these false positives each end up blowing cotton out of the process stream and onto the gin floor which if it happens too often, becomes such a nuisance that it is likely the gin personnel may turn off the system rendering it inoperable. To correct the system to ignore these new non-plastic colors, a significant amount of work is required to redo the calibration, as an end user must sort through all the false-positive pictures and determine which ones are free of plastic and can be used to calibrate the system and which ones it must exclude in order to obtain a valid classifier. For example, in one of the commercial trials, 15,000 triggered plastic images were collected across the season from 6 camera nodes. It should be noted that not all of these images are of plastic contamination. Some of these images were duplicate occurrence images that were taken on consecutive frames, as the plastic slides through the field of view of the camera (typically 3 images are taken for the same piece of plastic). Other triggered pictures were captured of the ginner’s hand and clearing stick as they were performing maintenance. These maintenance images cannot be used in the calibration as many times the ginner’s clothing or clearing stick has colors that could potentially match plastic contamination, so these images must be excluded from the negative-classifier build. The number of images that must be examined to ensure only cotton images are utilized to build the classifier can become overwhelming, especially if the cotton has seen a recent change in normal cotton colors such as the addition of green-leaf or yellow-spotted cotton.
The camera nodes were set up with a single camera-node per gin stand, to provide a sample observation of plastic contamination. Extrapolating to a complete set of images, that would be taken for a full plastic protection system which covered the entire length of all the gin stands (6× number of cameras); 90,000 images would be captured as potential plastic, per season. Someone looking at running a calibration would have to delete or sample this mass of images to find and extract images of just cotton, that were responsible for incorrectly triggering the system. The task of sorting through all the plastic-detected images, for clean cotton images that do not have any plastic or ginner’s clothing or brightly colored clearing sticks, can be somewhat alleviated through automated periodic discarding of images. However, even in a single day, a fair number of images need to be opened and verified as clean and suitable for submission to the build-classifier. Plus, a good classification build can benefit from having hundreds or even thousands of images, to ensure all potential colors in the current cotton flow are represented in the classifier. A further impediment to this operation, for the cotton ginning industry, is that this task also requires a user to be skilled in using computers. Which unfortunately precludes this operation from the many unskilled laborers that make up the bulk of the labor force in the cotton ginning industry. What is needed is an easy method to obtain a calibration that non-skilled workers can execute.
There are a few different methodologies that potentially could be utilized for the detection of plastic images, to ensure a calibration image data set is clean and only contains plastic-free cotton images. The first is a deep-learning AI approach, which we are currently exploring in another research effort. The second is a statistical exclusion method that seeks to exclude plastic images based upon frequency of occurrence. This report covers this approach. Other potential sources of images that are not valid for use in calibration occur when gin personnel stick their hands under the cameras during maintenance operations. This work assumes the absence of these types of images, and work is currently ongoing to develop a sensor to sense when these hand-intrusion events occur. This work will be submitted for publication shortly.
An autocalibration system that dynamically tracks the cotton flow and adjusts itself will be a significant improvement in the design of the system and is the primary objective is this research. To achieve this auto calibration, the research developed a novel algorithm that can dynamically track the cotton while avoiding plastic images, which if utilized in the calibration step, would seriously degrade the performance of the system. So, the primary objective of the algorithm is to sample current cotton flow, while avoiding plastic contamination images, to provide a clean image dataset to submit to the classifier-build routines. The development analysis and design of the autocalibration algorithm are presented in the subsequent sections of this research report.
1.1. Technical Decision Process
The technical decision process for the evaluation of potential solutions was as follows:
Problem Identification: The primary problem is to protect against the inclusion of non-cotton images into the calibration image dataset. As the inclusion of such images can degrade the ability of the negative-classifier, utilized in our machine-vision plastic detection system, to detect plastic. In commercial use we found three times the number of false-positive plastic classified images to actual plastic contamination images. The dominant source of these false-positives was gin personnel performing maintenance operations on the gin-stand feeder. Hence, the primary objective is to find a sensor that can detect these maintenance hand-intrusion detection, HID, events. The events are characterized by when gin personnel stick their hands under the plastic detection cameras. So a suitable sensor should detect when hands are placed into these inboard positions on the gin-stand feeder apron. There are a couple of options that could be considered a solution. Detect when a ginner sticks his hand, arm, body or a stick, up into the feeder apron. So a beam break technology that looks across the entire gin stand, beam-break, is one possible solution. Another is a sensor that is more localized and placed in near-proximity to the camera and looks down to see when an object becomes visible. A third option would be to detect the presence of when an operator is in the vicinity of the feeder. As when an HID event is detected, the plastic detection system will be turned off; from an efficiency perspective, it would be ideal to limit the number of times and duration of HID sensor triggers. As such, the first and second options are deemed the most likely to satisfy both accurate detection while still minimizing total detection time. As the third option will be triggered even when the ginner is just hanging out by the feeder, which does happen quite frequently.
Data Driven: The evaluation of potential HID sensors was performed by evaluating the datasheets of potential sensors against the need.
Comparison against existing solutions: in industrial environments, it is quite common to utilize laser safety curtains. While these solutions could work, as they consist of a paired laser array that is placed opposite of a detector array. For the position that it would be placed into service, this design causes several issues: (1) it is a high-vibration environment, and alignment is critical; (2) it is a location that requires frequent periodic maintenance and if installed would likely have to be moved and then reinstalled with subsequent alignment requirements. Given the non-critical process operation need of the equipment, it was felt that it was unlikely that gin maintenance workers would do a good job, if at all, of realigning the system and ensuring it was operational. Hence, this solution was deemed unlikely to work in the target environment.
Evaluation of alternatives: during the course of the investigation, additional work was conducted into exploring alternative approaches; the most promising of which were: aritifical intelligence, AI, deep-learning image recognition of HID objects in images. And depth sensing camera sensors that look down from camera position and detect when any object is above the plane of cotton flowing down the feeder apron.
Timeliness: due to the rapid need for a solution, the evaluation period was accelerated, so the most accessible and promising solution was explored first.
Review and learning: as results were obtained and new sensors became available, possible solution alternatives were re-evaluated periodically.
1.2. Economic Drivers
The economic drivers behind this design is that the current plastic detection system requires highly skilled personnel to monitor the systems and keep them well calibrated. As such, for the target industry this is a significant deterrent to adoption. A successful HID sensor would allow for fully autonomous operation that would turn the system into an appliance where you can install and mostly forget about it, other than occasional clearing of optics.
2. Materials and Methods
The materials suitable for an HID sensor is any that can withstand high vibrations and a high dust environment; so care was taken in the production of the prototypes to ensure long life by providing vibration isolation and utilization of glass optics to minimize static attraction of dust to the optics. The housings of the prototypes were 3D printed with a thick wall design to help ensure longevity. The electronics were all manufactured with commercial processes utilizing surface mount components to minimize unsprung mass on the circuit boards. Inside the housings the electronics were isolated from vibration utilizing open-cell foam and custom 3D printed soft durometer encapsulation blocks.
This section will cover the statistical basis, design, and test protocol for the proposed auto-calibration algorithm. The algorithm is proposed to utilize frequentist statistics, to allow for the sampling of cotton images that are statistically unlikely to have plastic contamination in them. The design and development leveraged data collected at 2 commercial cotton gins where the research deployed 10 machine-vision-based plastic contamination monitoring stations, which were used to collect data for the duration of the 2021–2022 cotton ginning season. The monitoring stations are the vision-only portion of the machine-vision plastic-inspection-detection and ejection system, “PIDES” of the authors that are described in detail in Pelletier et al. (2021 [
9]). When a monitoring station observes a plastic contaminant, it saves the image and logs the time and date in the image file name. Due to the high-speed nature of cotton contamination monitoring, in order not to interrupt the detection of subsequent events, the software queues each image in memory and writes them out to file in a metered method so as not to interrupt the software’s focus on detection. This drip-feed file-writing method results in a time stamp accuracy of 1–5 s. This time bias is anticipated to have a minor impact on the statistical assessment of the time occurrences. It should also be noted that the high-speed camera system typically captures 1–4 images per piece of plastic, as it’s over-sampling to help in the detection of hard-to-spot pieces that might be buried for part of the transit through the field-of-view of the machine vision system. These extra images were included in the analysis as there’s no way for the auto-calibration system to exclude them. The next challenge is images created by the gin personnel performing clearing operations on the gin-stand feeder to clear tags of cotton that get hung up. To exclude these ginner-triggered images, the system will utilize some form of optical gate to let the algorithm know there’s a maintenance process going on, so it must exclude any images during this time.
2.1. Statistical Basis: Poisson-Process
To enable the current semi-automatic calibration system to become fully automated, the primary impairment to fully automatic operation is how to automatically collect images of cotton that are free from plastic. To aid in the development of this algorithm, the research placed 10 detection systems into 2 commercial cotton gins and tracked plastic detection events throughout the 2021–2022 cotton-ginning season. Each detection system was carefully calibrated using expert operators to assess the images used by the machine-vision system’s software (Pelletier et al., 2021 [
9]). The machine-vision software was configured to save all detected plastic images and ttrack the time and date of each plastic detection event, hereafter referred to as an “Event”. After the ginning season ended, the data were analyzed to assess the potential for finding a means to provide separation that would allow an auto-classification algorithm to gather ongoing cotton images while avoiding plastic images, which would degrade the classifier’s performance. The separation method of interest utilizes frequentist statistics, similar to how music or communication systems remove the effect of key frequencies utilizing frequency domain filtering. To assess this potential exclusion mechanism, the observation time of each event, for a single day, was plotted (
Figure 3). From this observation, it is clear the events are not uniformly spaced but instead occur in clusters.
To observe the clustering nature of the events, the event time log was converted to time duration since the last plastic event. A histogram of this data is plotted below and shown in
Figure 4. Due to the very wide span in observed durations, ranging from secs to numerous hours on some occasions, the time data was plotted on a log scale to allow for better observation of the occurrences. From this, it is apparent that once the timespan exceeds 1 min, the number of occurrences is fairly uniform. This is fortuitous as it provides flexibility in the selection of the cluster observation window, for use in the design of an algorithm.
Using experimentally logged plastic events, when the data was plotted it was observed that the events seemed to occur in bursts or clusters. This intuitive observation does align with the physical system as plastic typically occurs only after a piece of plastic gets embedded onto the module dispersing cylinder and then gets shredded, as shown previously in
Figure 2. As the initial introduction of the plastic onto the dispersing cylinder is a random event in time, the random occurrence of a start of a cluster is a reasonable assumption. However, once a piece of plastic has become embedded onto the dispersing cylinder, there is a much higher probability of a plastic shedding event. Hence, the observed clustering of the plastic events is a reasonable model, based upon the physical nature of the process.
To assess the clustering of plastic events, commercial observations of plastic event logs were assessed using a sliding observation window (in time). A preliminary survey of the data suggests similar statistics, number of occurrence events per minute, as the window size changes from 1 to 20 min. As the longer the window duration, the greater the number of plastic events; then to exclude the plastic based upon occurrence differences, the algorithm will have to use a much larger number of images. To strike a balance, a two-minute window was selected as it provides a reasonable duration in which to collect a sufficient number of images to build a reasonable calibration, while not having so many images to analyze that it impacts the processing power of the machine-vision node. The start of a cluster was noted by a pause greater than the window duration, and then all subsequent plastic events, for the duration of the window, were assigned to that cluster group. In assessing the clustering, a histogram of time from the initial plastic (at the start of the cluster) is shown in
Figure 4, which was constructed using a two-minute sliding window to assess clusters. In the time domain,
Figure 5 shows the time positioning and size of clusters (also using a 2-min sliding observation window).
Along with the timing occurrences, a histogram of the cluster sizes was also constructed,
Figure 6.
As the potential algorithm for separating plastic images from non-plastic images is proposed to be based on the number of occurrences exceeding a threshold level, of interest is to examine the Poisson-Process statistics of the cluster size. This will provide the statistical basis to estimate an upper threshold on the expected number of occurrences of plastic images within a selected window duration, beyond which plastic being responsible becomes increasingly unlikely. To ensure the approach is valid, several tests were conducted to assess if the experimentally observed number of plastic events, for a given cluster window duration, followed a Poisson distribution.
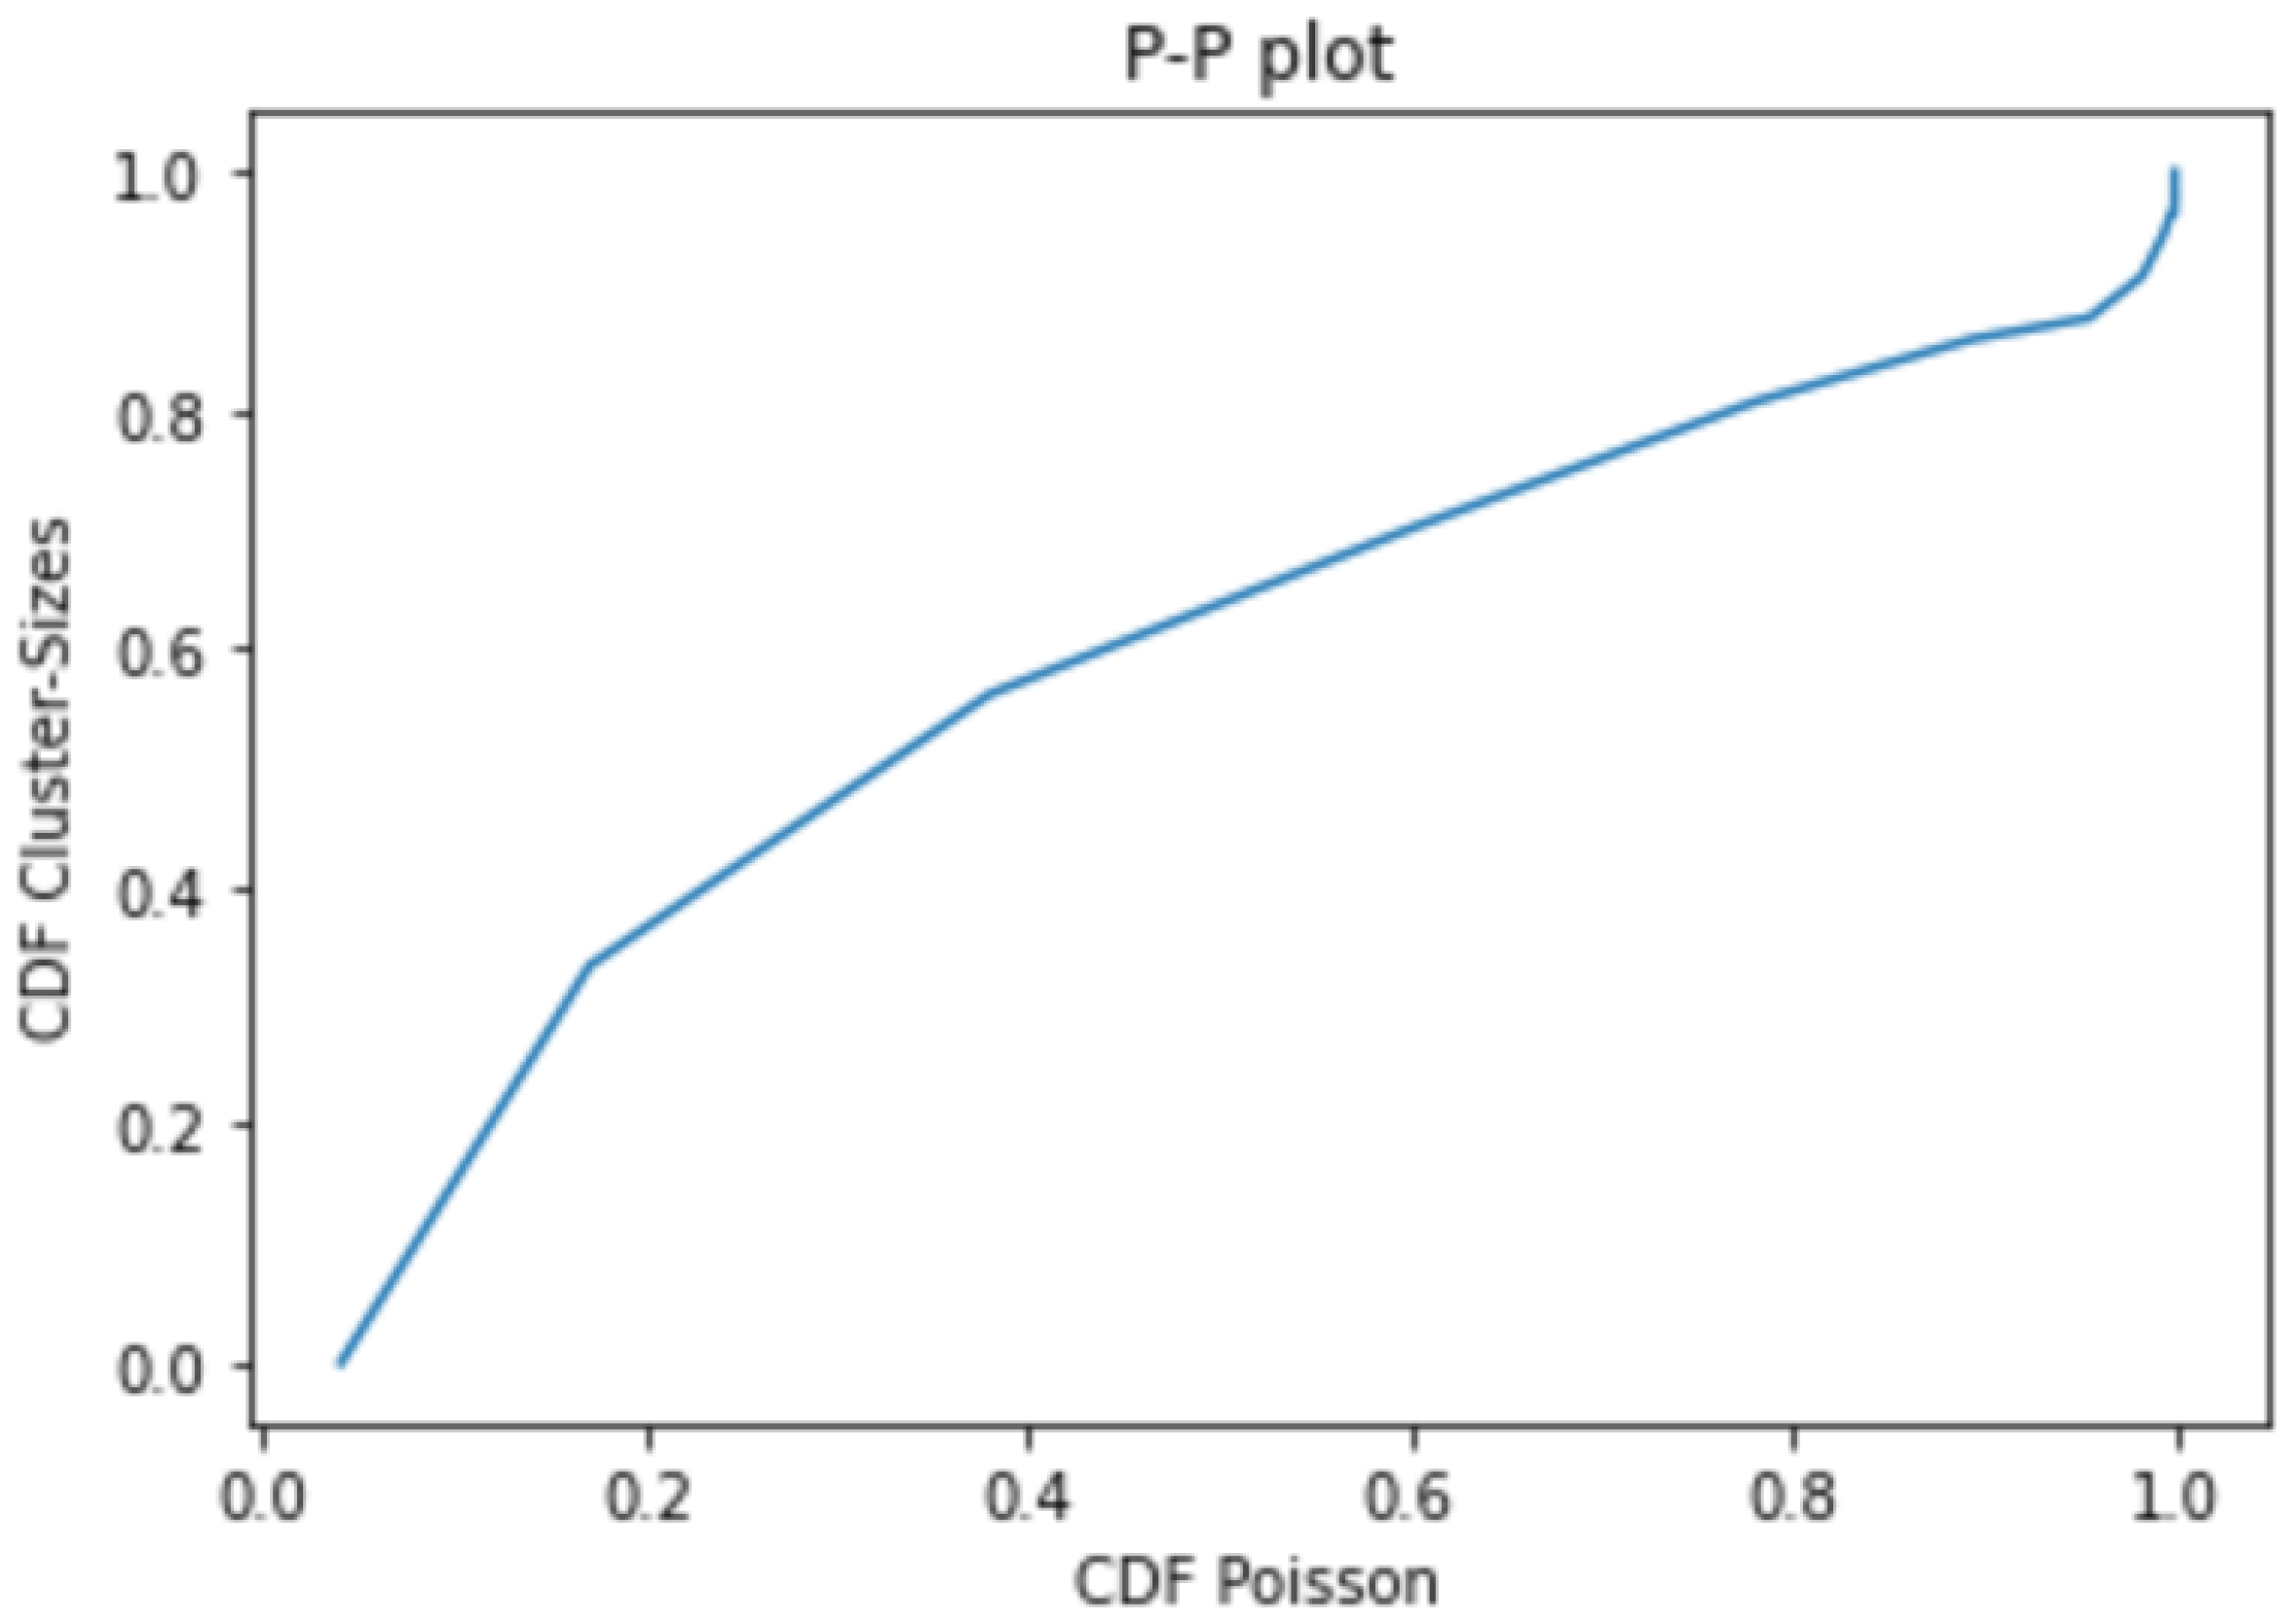
To assess if cluster sizes followed a Poisson distribution, the experimentally observed distribution of the cluster sizes was compared to several types of standard statistical distribution functions. To assess the type fit to a particular distribution, a z-test was performed. Results comparing a Poisson distribution to the experimentally observed cluster sizes, with a two-minute window, were found to be statistically the same, with a z value of 0.0027 (z > 2.5 is required to reject the null hypothesis that groups are the same). A visual confirmation is also provided, by means of a probability-probability (P-P) plot, which compares the cumulative distribution function for a Poisson-Distribution versus the distribution found experimentally from the clustered plastic events, which is shown in
Figure 7.
The final observation that supports the cluster model is to compare the statistics of clustered observations, versus the pure random chance occurrence model. Over the observation time of 10 days, there were 57 clusters with a mean of 3.2 events per cluster (using a two-minute window) with a standard deviation of 3.1 events. Over an observation time of 30 days (again two-minute cluster window), 171 clusters were found with a mean number of events for each cluster of 3.3. For the random chance model, the mean time between plastic events was found to be 63.76 min, (average time between plastic images averaged across the entire ginning season). Using the Poisson-Process model for the non-cluster randomly occurring model, the probability of having 3 events within a two-minute window (the mean of the cluster model) was found to be effectively zero (less than 1 in billion). As the experimental observation was for 57 clusters (two-minute window) over 10 days,
Table 1, and for a 30-day observation time there were 171 clusters with a mean of 3.3 images detected, it is safe to conclude that the non-cluster random event model is not predictive for this purpose. It should also be noted that for an algorithm trying to exclude plastic, based on the number of occurrences, the larger the number the more conservative, so the cluster model provides the most conservative and safest approach.
Leveraging the knowledge that the cluster sizes follow a Poisson distribution, a Poisson-Process model was developed to assess the potential for creating statistical separation between “plastic events” and more frequently occurring normal cotton color events. The approach was to assess the Poisson-Process statistics of plastic events for a given window. Then construct an algorithm that requires the number of events to exceed a probability threshold to ensure that the color is not from a plastic image. As the mean cluster size, for a two-minute observation window, was found to be 4.44 events, using this as the Lambda input into a Poisson-Process model provides a probability of 1 in a million for k = 17 events to occur. Of note is a two-minute observation window will be repeated continuously throughout an entire ginning season. Thereby providing upwards of 65,000 opportunities for a statistical anomaly to occur, so the collective probability for an occurrence across a season of 90 days is reduced to 0.065, or roughly 94% probability that the system will operate throughout the season without inadvertently introducing plastic into a calibration. To further ensure safe operation, the algorithm will be deployed to continuously adjust the classifier, thereby providing a short operational life, for a given classifier. Thus, should a classifier be inadvertently created with a plastic image, there will only be a short operational time in which the bad classifier will be operational and potentially allow the plastic to be ignored.
To further test the hypothesis of the Poisson-Process for predicting cluster events (not to exceed); further confirmation was sought by performing a search of plastic event images captured at the commercial gin that had the highest number of plastic events on the gin stand that saw the largest number of clusters. This produced a list of all the clusters, over the longer timeframe of 30 days, in which of interest was the number of times clusters were equal or greater in size than thresholds identified by the Poisson-Process statistics model. These exceedance events are detailed in
Table 2. From this list, it is apparent that the Poisson-Process model is under-estimating, as the k ≥ 15 thresholds occurred once every 7 days. This extended observation supports the Poisson-Process statistical threshold concept but also suggests it would be prudent to use the more stringent k = 45 threshold, if possible. The next phase of this report will examine if that high a value of k is practical, for a two-minute sampling window, to build a classifier capable of plastic detection and very low false-positive rates.
In summary, the observations of cluster sizes from the commercial gin suggest the Poisson-Process model approach is valid, but the approach should consider an increase in the threshold level. Hence, it is recommended to use the Poisson-Process k ≥ 45 levels, if possible, to ensure the highest level of protection possible when developing and utilizing the auto-calibration approach based upon the frequentist exclusion principle provided by Poisson-Process modeling.
2.2. Algorithm
To implement the Poisson-Process statistics, to ensure the exclusion of any plastic images, the statistics require that any color entered into the negative classifier (Pelletier et al., 2021 [
9]), must occur in 45 or more images within any two-minute time window. The negative classifier utilizes L*a*b* color space and discards the luminance, “L” channel that reduces 3-dimensional, “D”, red-green-blue, RGB, color space down to a 2-dimensional color space (Schanda, 2007 [
10]). To implement the negative classifier, all the colors of a set of cotton images, free of plastic contamination, are scanned; and all the colors in those images are used to create a look-up-table, LUT, that provides the exclusion criterion. If a color is in the LUT, then it is ignored as being cotton, else it triggers a detection. On a side note: tests were conducted using multiple levels of “L”, for a multi-LUT approach (multiple LUTs were used one for each range of L) to see if there might be some advantages to a more detailed classifier. The tests looked at using up to five levels of “L” for a 5 LUT negative classifier. This multi-LUT approach was tested against a rich dataset of plastic contamination images versus cotton images free from plastic contamination. After thorough testing comparing the two approaches (single-LUT versus multi-LUT), no advantage was found for the more complicated multi-LUT approach.
To collect the images across the two-minute window, the machine-vision software monitoring for plastic detection should be configured to save an image once every one to two seconds. To allow for colors to be removed from the classifier, it should not differentiate if the current classifier marks a particular image as plastic or not. So, the software is set up for simple blind sampling of images of the cotton flowing in the field of view of the machine-vision system. For each auto-classifier build, the sampling is structured to sample once every two seconds for two minutes. Then, the auto-classifier analyzes the images to build a LUT that statistically should be free from plastic images. Once the new LUT is constructed, the program sets a flag to alert the machine-vision software that it should load the new LUT. This process then repeats continuously, such that a new LUT is provided, based upon the current cotton conditions, every 10 min.
The protocol for the auto-calibration algorithm starts with the build-LUT (look-up-table) routine, from the negative classifier (Pelletier et al., 2021 [
9]). For each image collected over the two-minute window, the build-LUT routine analyzes all the colors in the image and notes them as colors to ignore in the LUT it creates (that is used for later image classification for plastic detection) and returns to the calling auto-calibration routine. The auto-calibration algorithm routine then takes the returned LUT and adds each color to build a histogram of the number of occurrences for each color. The algorithm restricts each color occurrence, from a single image to only count once in this histogram, regardless of how many times it occurs in any one image. Hence, a given color only counts once per image. This is repeated for each of the images that are collected over the two-minute window. Once all the colors, from the LUTs from each of the images are added to the histogram, a threshold of 45 is applied to each color as the threshold for entry into the working classifier’s LUT. For clarification on the details,
Figure 8 provides a flowchart of the auto-calibration LUT build protocol.
To test if this is a possible protocol that will still allow for a reasonably accurate classifier to be constructed, python code was developed (attached to this report in the
Supplementary Materials).
2.3. Test Protocol
The second part is to assess if an auto-calibration protocol can generate a classifier, that exhibits high accuracy while minimizing the number of false positives. As the current plastic removal system dumps the plastic, and a small amount of cotton, onto the gin floor in front of the gin stand; when the number of false positives increases, so does the annoyance factor. This raises the risk that the gin personnel will simply turn off the system if the false-positive rates are allowed to become elevated. To ensure against this risk, a fundamental criterion is to ensure low false-positive rates are a primary metric of the system’s overall performance.
To test this proposal of using only a two-minute window by which to collect images and then to exclude colors, but only if the colors occur in at least 45 images (Poisson-Process exclusion criterion). To obtain images for testing, cotton with varying levels of trash was run on a research cut-down gin-stand feeder that was fed with a conveyor. Approximately 8000 images were collected of cotton, free of plastic, at varying cotton trash levels. Additionally, a dataset was collected of more than 5000 images of cotton that included plastic, sourced from the most common contamination plastics that are used to wrap cotton modules. To build the classifier, the plastic-free cotton-only images were randomly sub-sampled into two groups (calibration, and test). Images from the calibration pool were utilized to create a LUT that was then used to classify the images from the test pool. As these images do not have plastic, the metric of interest here was the number of false positives. The partition ratio between the calibration versus test pool was 1:3. From the calibration pool, a random time window of 2 min was selected and the images within that 2 min window were utilized to build the classifier. To assess the number of false positives, the classifier was utilized to assess if the images from the test pool, also from the same 2 min window, were incorrectly classified as containing plastic. To assess the classifier’s efficacy in the detection of plastic, the classifier was then used to predict from the pool of images known to contain plastic contamination. The accuracy specification of interest, in this case, is not on a per image basis but rather on a per plastic-event basis, as the over-sampling of the machine-vision system was a designed feature to compensate for lower image detection rates as plastic when conveyed with cotton can show up at varying angles and varying levels of occlusion by the surrounding cotton. This over-sampling is especially important for plastic colors that are overlapping the cotton colors, as the incident angle of lighting varies during conveyance through the image detection zone, and the light angle can impact the camera perceived color and subsequently impact the detection rate. This is especially important with most of the current plastic module wrap colors as both the yellow and pink wraps overlap the cotton colors. So, in the development of the original system, having multiple opportunities for detection was found to be a critical design element in the plastic-contamination machine-vision detection system (Pelletier, et al., 2021 [
9]). Hence, the primary metric of interest, and the metric that was tested, was to determine if the new auto-classifier build algorithm could generate a classifier that can perform as well as the original classifier.
3. Preliminary Algorithm Assessment
The software discussed in this report provides a proposed auto-calibration routine for the machine-vision plastic monitoring-ejection system (Pelletier et al., 2021 [
9]) that is mounted on a gin-stand feeder. To provide a preliminary assessment of the algorithm, prior to undergoing more rigorous statistically sound experimental validation, which will be published in an upcoming scientific “Research” paper; a test was conducted that utilized images collected on a laboratory cut-down version of a commercial gin-stand feeder with cotton harvested on a commercial cotton harvester. For assessment, the captured images were submitted to the algorithm. The size of the number of images utilized to build the classifier, from the calibration pool of images, was varied to test for sensitivity for producing false positives when performance was tested on the test-set of images. The criterion for allowing color to enter the negative classifier was the Poisson-Process number of events, “k”. For this preliminary assessment, “k” was set equal to 45 to provide sound rejection of single plastic events from entering the image calibration dataset. This effectively imposes the criteria of a color being required to have occurred at least once in each of 45 images before that color is allowed to enter the final negative classifier LUT.
For assessment of the false-positive rate, the auto-classifier generated classifier LUTs were constructed utilizing the following number of images, known to be free of plastic, to build the classifier (600, 900, 1200, 1500, 2400). To reduce noise, the system is typically run with an area threshold (below which the image is ignored) of 500 pixels, which is approximately 10 × 10 mm. Previous testing by the authors found that sizes of small plastic are removed by the feeder and have a very low probability of occurrence. The results of a series of Monte-Carlo tests found the number of false positives, from a pool of 5500 test images, to have from 0.2 to 2 false positives, using the exclusion criterion of k = 45,
Table 3. From
Table 3, it is apparent that to keep a low false-positive rate, it will be necessary to use numerous calibration images. In a two-minute window, collecting images at 25 frames per second, this is 3000 images, which the data suggests would be the ideal calibration image pool. Given the large number of images that must be captured and processed, the use of a dedicated camera node is suggested, as this large processing load will most likely interfere with a camera node’s primary purpose of detection and removal of the plastic contaminants.
For assessment of the efficacy of the auto-classifier to detect plastic contamination effectively, the auto-classifier generated LUT, with k = 45, was used to classify a pool of images with yellow plastic contamination. The auto-classifier built LUT detected 1405 plastic contamination images in this dataset. The classifier was then rebuilt with k = 1, effectively turning off the auto-classifier constraint yielding a normal classifier build. By comparison, the normal classifier built LUT also detected 1405 plastic contamination images (area-threshold = 100). This was repeated with area-threshold = 500, where the number of plastic images was found to be 1350, again for both the auto-classifier as well as normal build. Of note is that increasing the area-threshold criterion to 500 resulted in a reduction of 4% efficacy that is exchanged for the elimination of false-positives, “FP (FP increases to 3 for 2400 image calibration set). It is the authors’ belief that this is an important trade-off as over a two-minute window, an FP rate of 3 is 1.5 plastic ejections per minute (90 per hour), which causes too much work for the gin personnel, which then runs the risk of having gin personnel just turning off the system. As such, the area threshold of 500 is the current value that has been used in commercial prototypes as well as the units that were transferred to commercial partners for sale into the ginning industry. It is one area, though, that would be of interest to examine further if one were trying to get a bit more performance out of the system.
In summary, it appears that the main limiting feature, to the auto-classifier construction, is not due to the Poisson-Process threshold to entry. But rather lies in the limitation of the sample size of the images used for building the classifier. Given the large number of images needed to eliminate the false positives, it is not surprising this is the case as k = 45 is very much less than the 2500 images used in the construction of the classifier. So there are ample opportunities for color duplication in the normal cotton constituents. It should be noted, however, that the optimal number of images used to build the classifier will depend upon the level of various constituents in a particular batch of cotton. If sticks or burs are at a high level, their high occurrence level will provide ample opportunities to calibrate them out; however, should they occur at a much lower level, then more images will need to be sampled to find the rarer color occurrences. Of question is if there might be a situation where a sporadically occurring cotton constituent begins to encroach upon the scarcity of plastic, which would render it non-discriminable. Future research, with further commercial field trials, will have to explore if this is an issue of concern for use of the auto-calibration. An example image classified by the LUT created with the auto-classifier algorithm is shown in
Figure 9.
In future work, one may find it of interest to use a longer cluster window, in order to increase the opportunity to detect rarer cotton constituents. From the experimental cluster statistics, from the cotton-gin stand that was found to have the highest occurrence rate for plastic events,
Table 4 provides the experimentally observed cluster statistics for various window durations. Setting k = maximum cluster size will help to eliminate the potential for clusters to occur that might exceed that number of events and is anticipated to be a safe threshold criterion for color entry into an auto-classifier LUT for the window duration of interest.


