
Drought Risk Assessment and Monitoring of Ilocos Norte Province in the Philippines Using Satellite Remote Sensing and Meteorological Data


Abstract
:1. Introduction
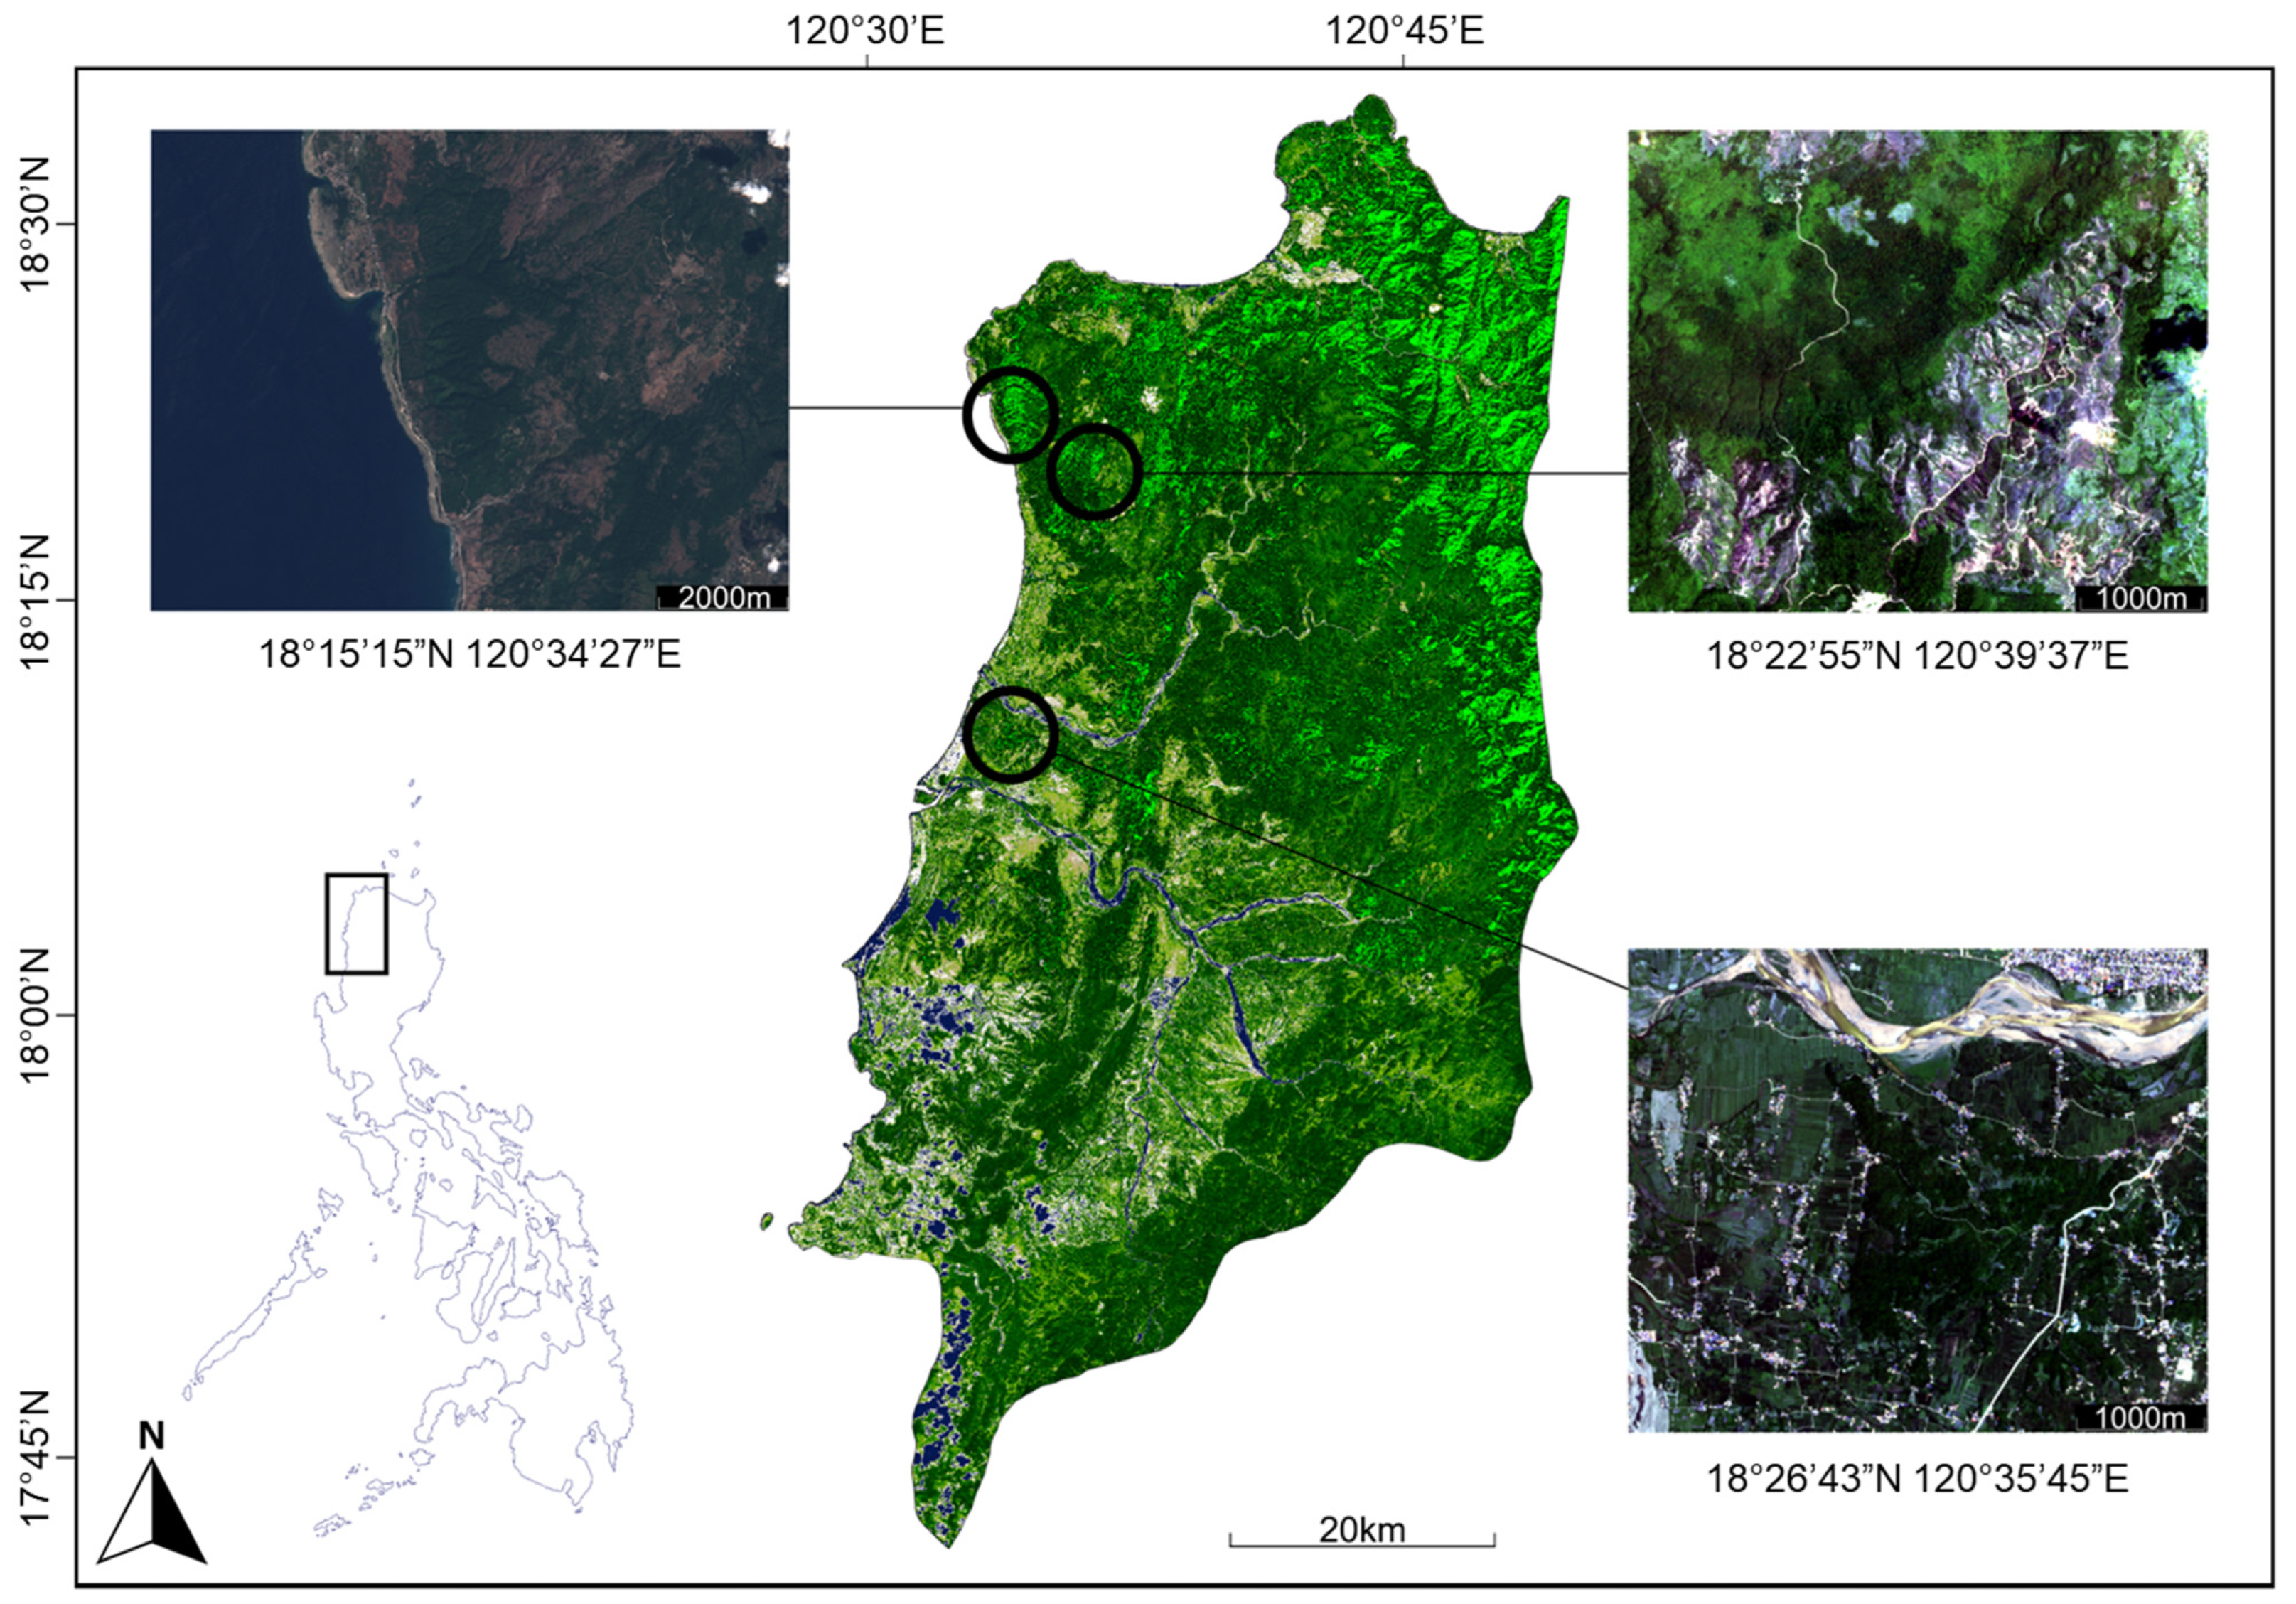
2. Study Area
3. Materials and Methods
3.1. Sentinel-1 SAR Data
3.2. Sentinel-2 Optical Data
3.3. SPI Calculation
3.4. KBDI Calculation
3.5. Correlation Analysis
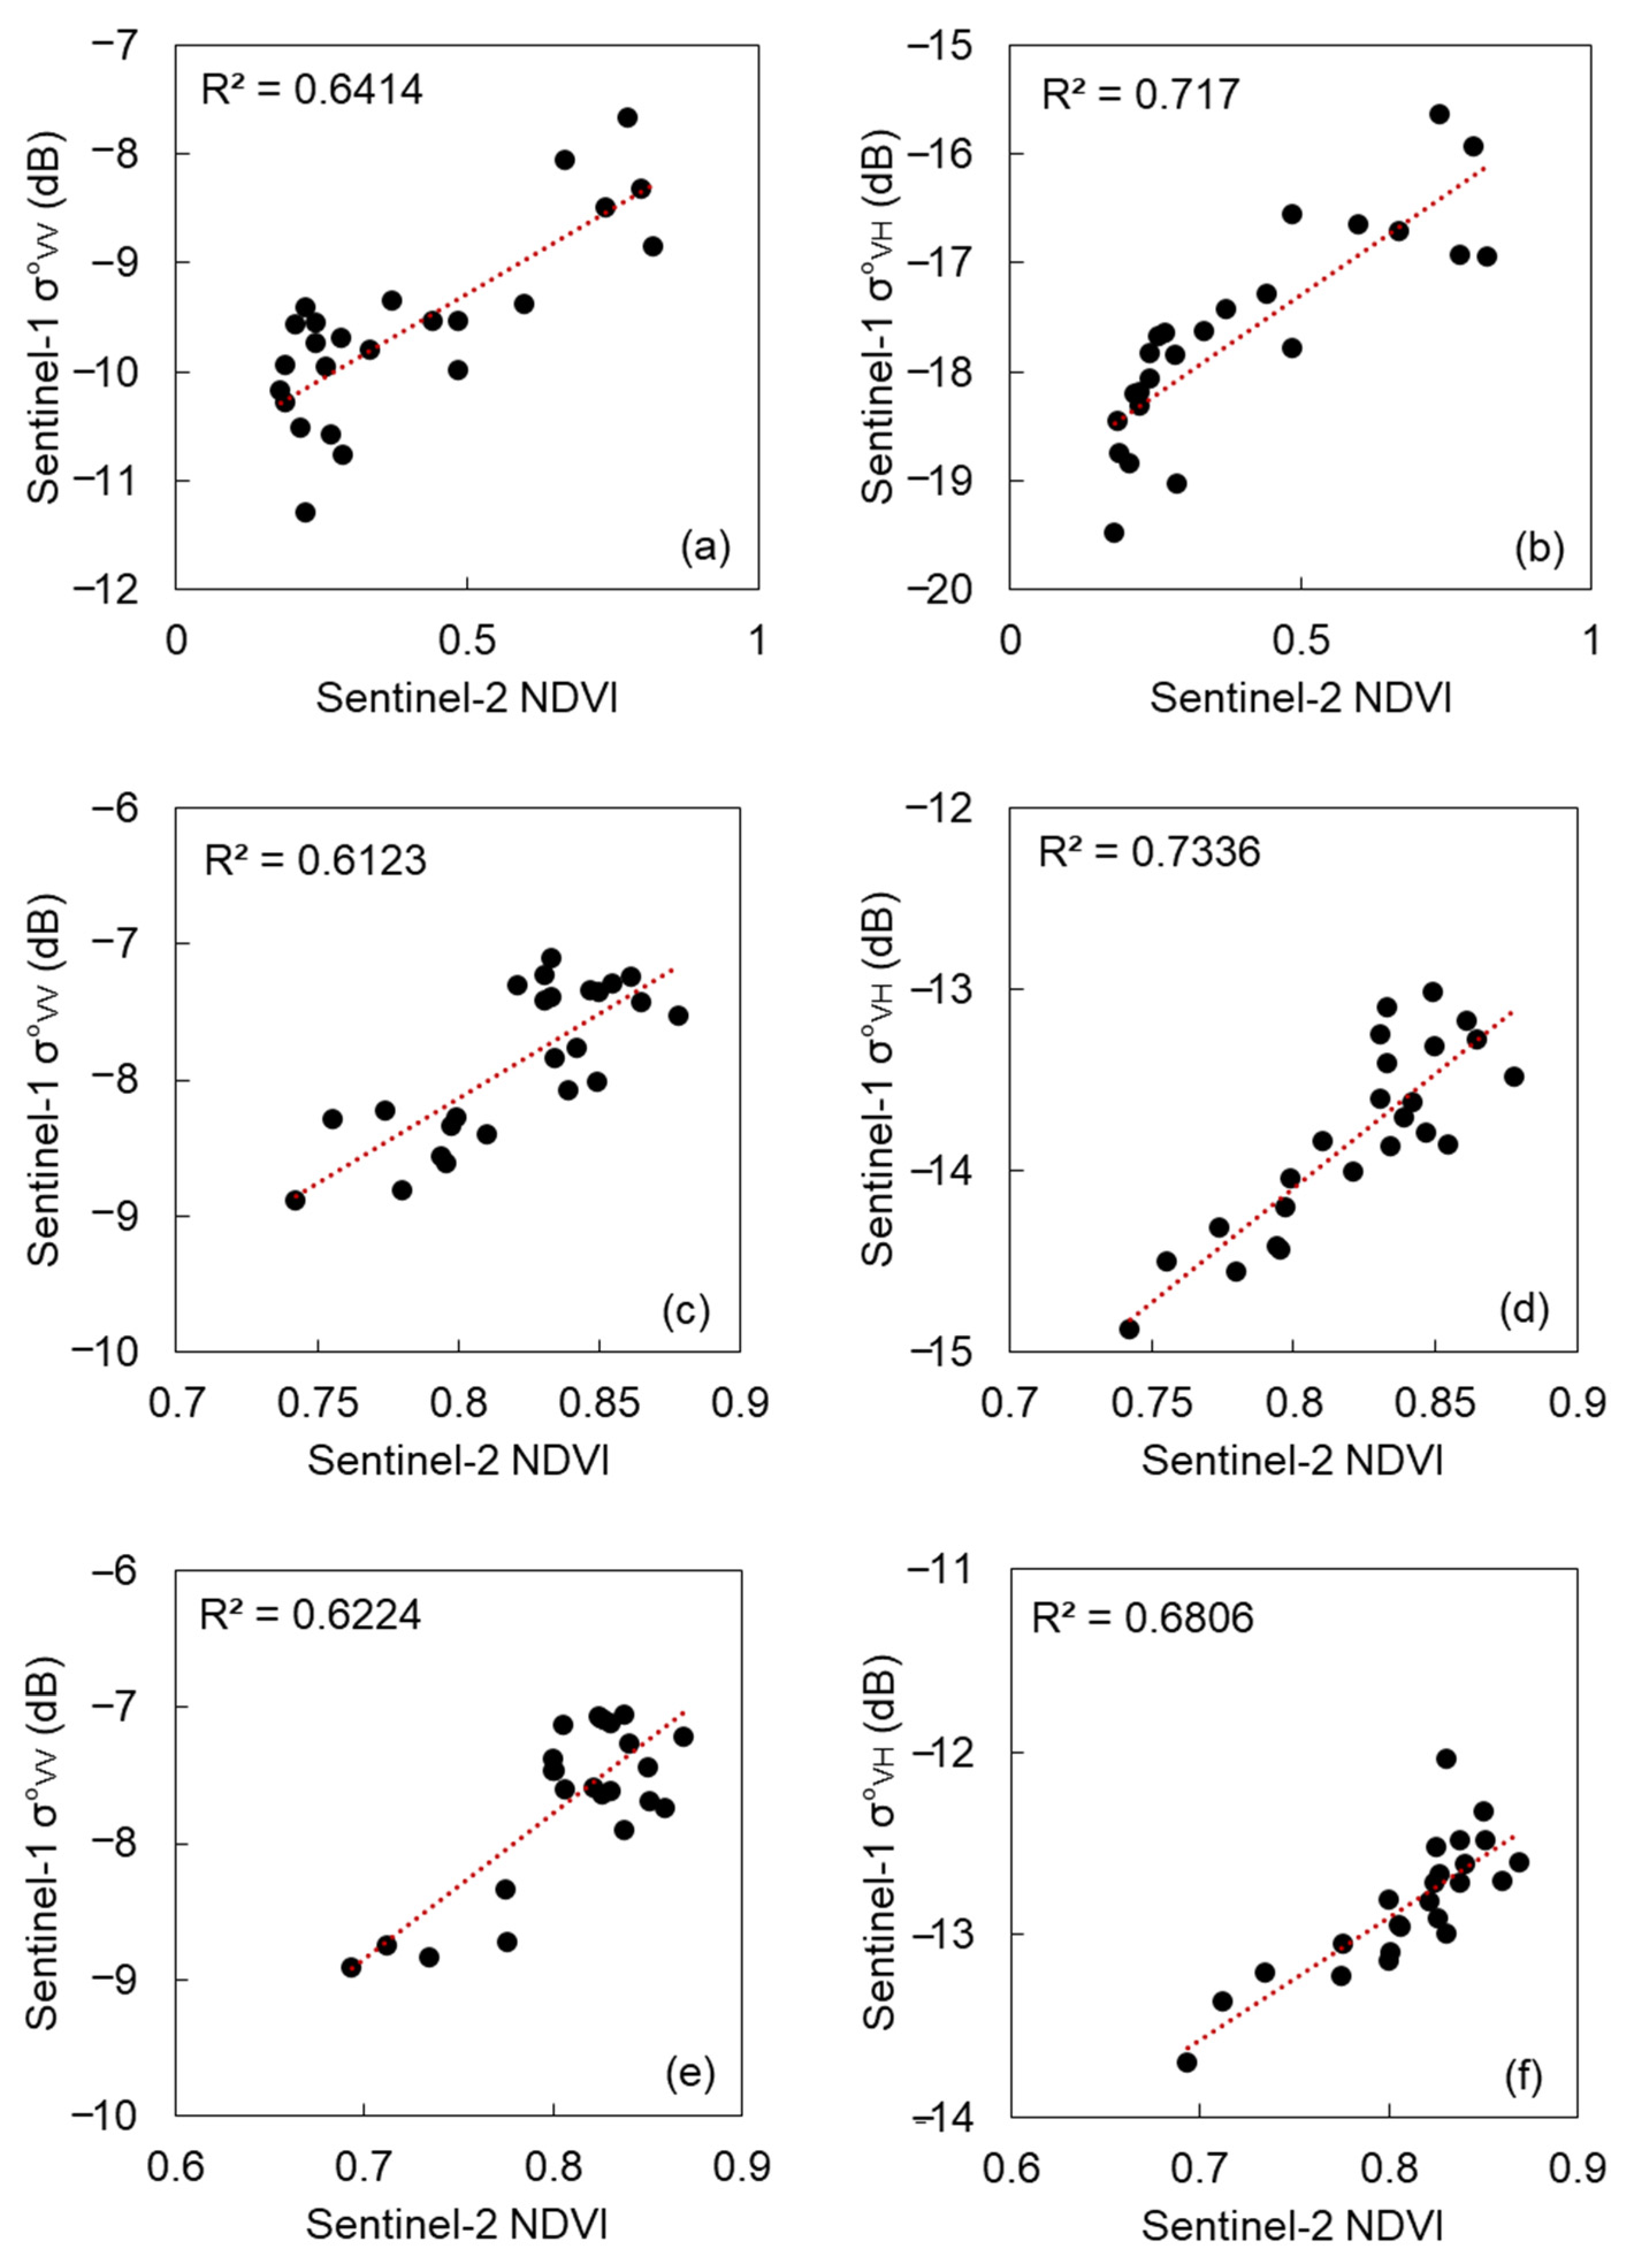
3.5.1. Relationship between Sentinel-1 Backscatter Coefficient and Sentinel-2 NDVI
3.5.2. Relationship of Remotely Sensed Data with Meteorological Data
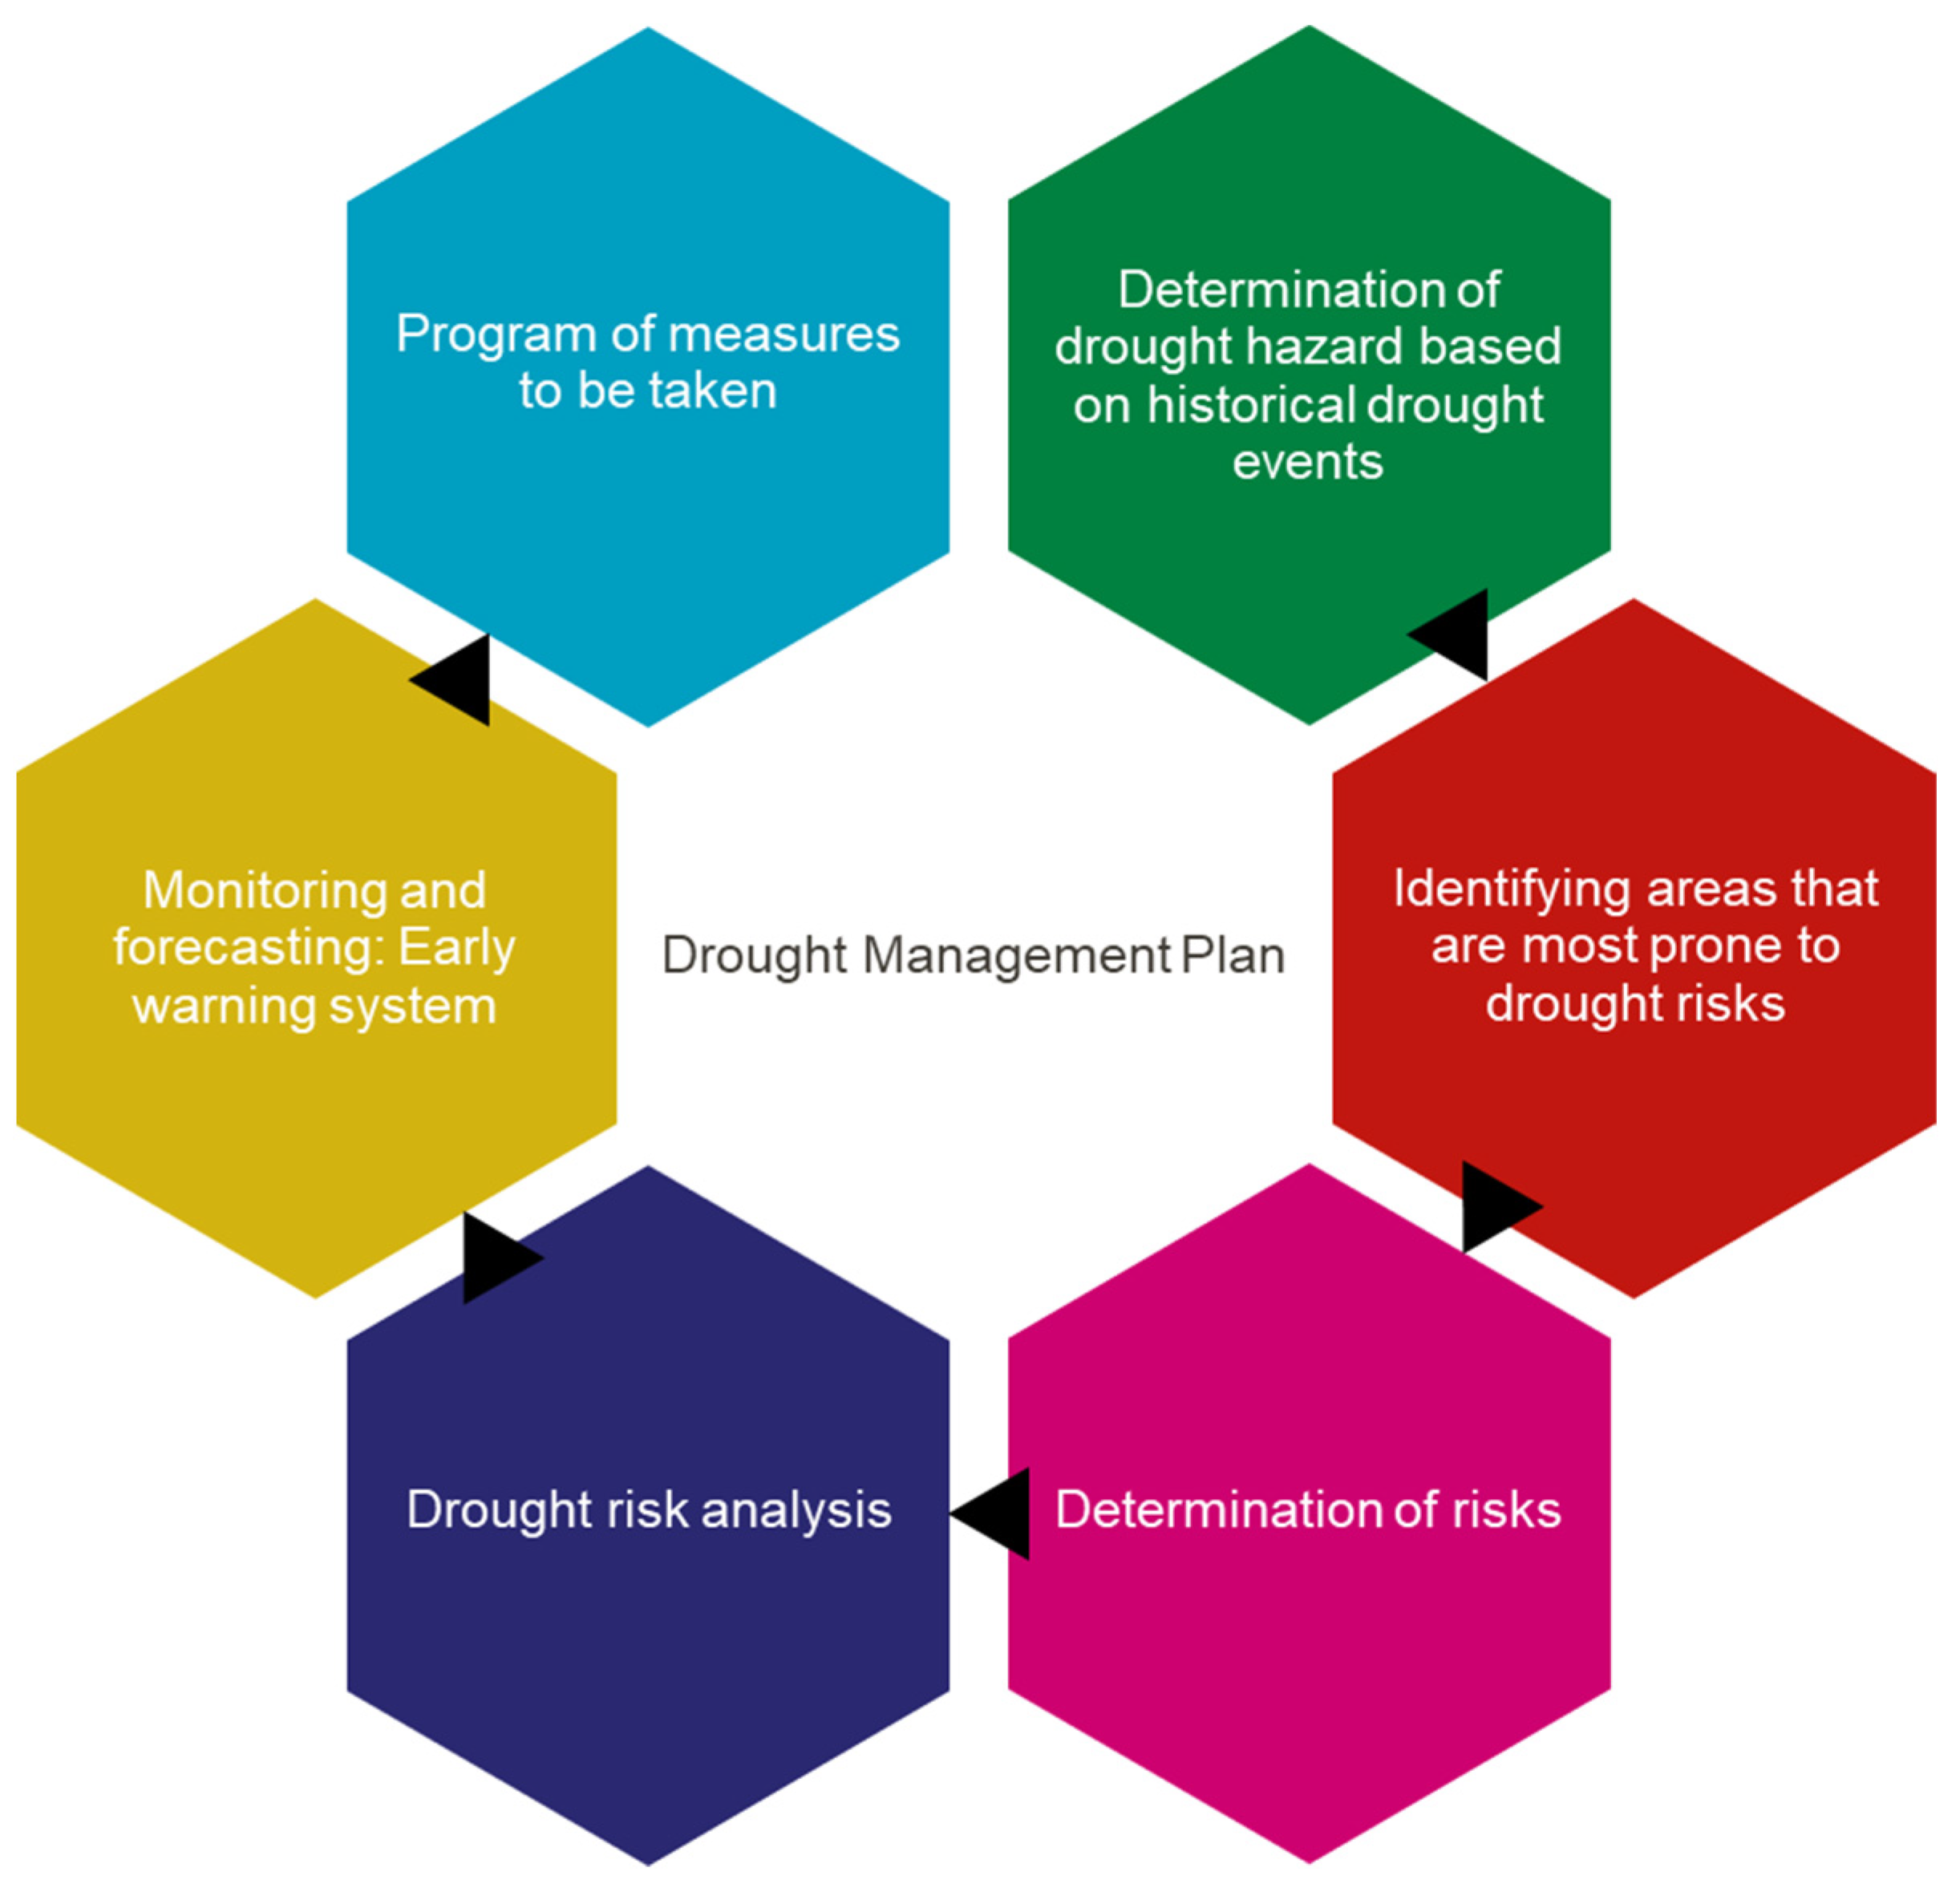
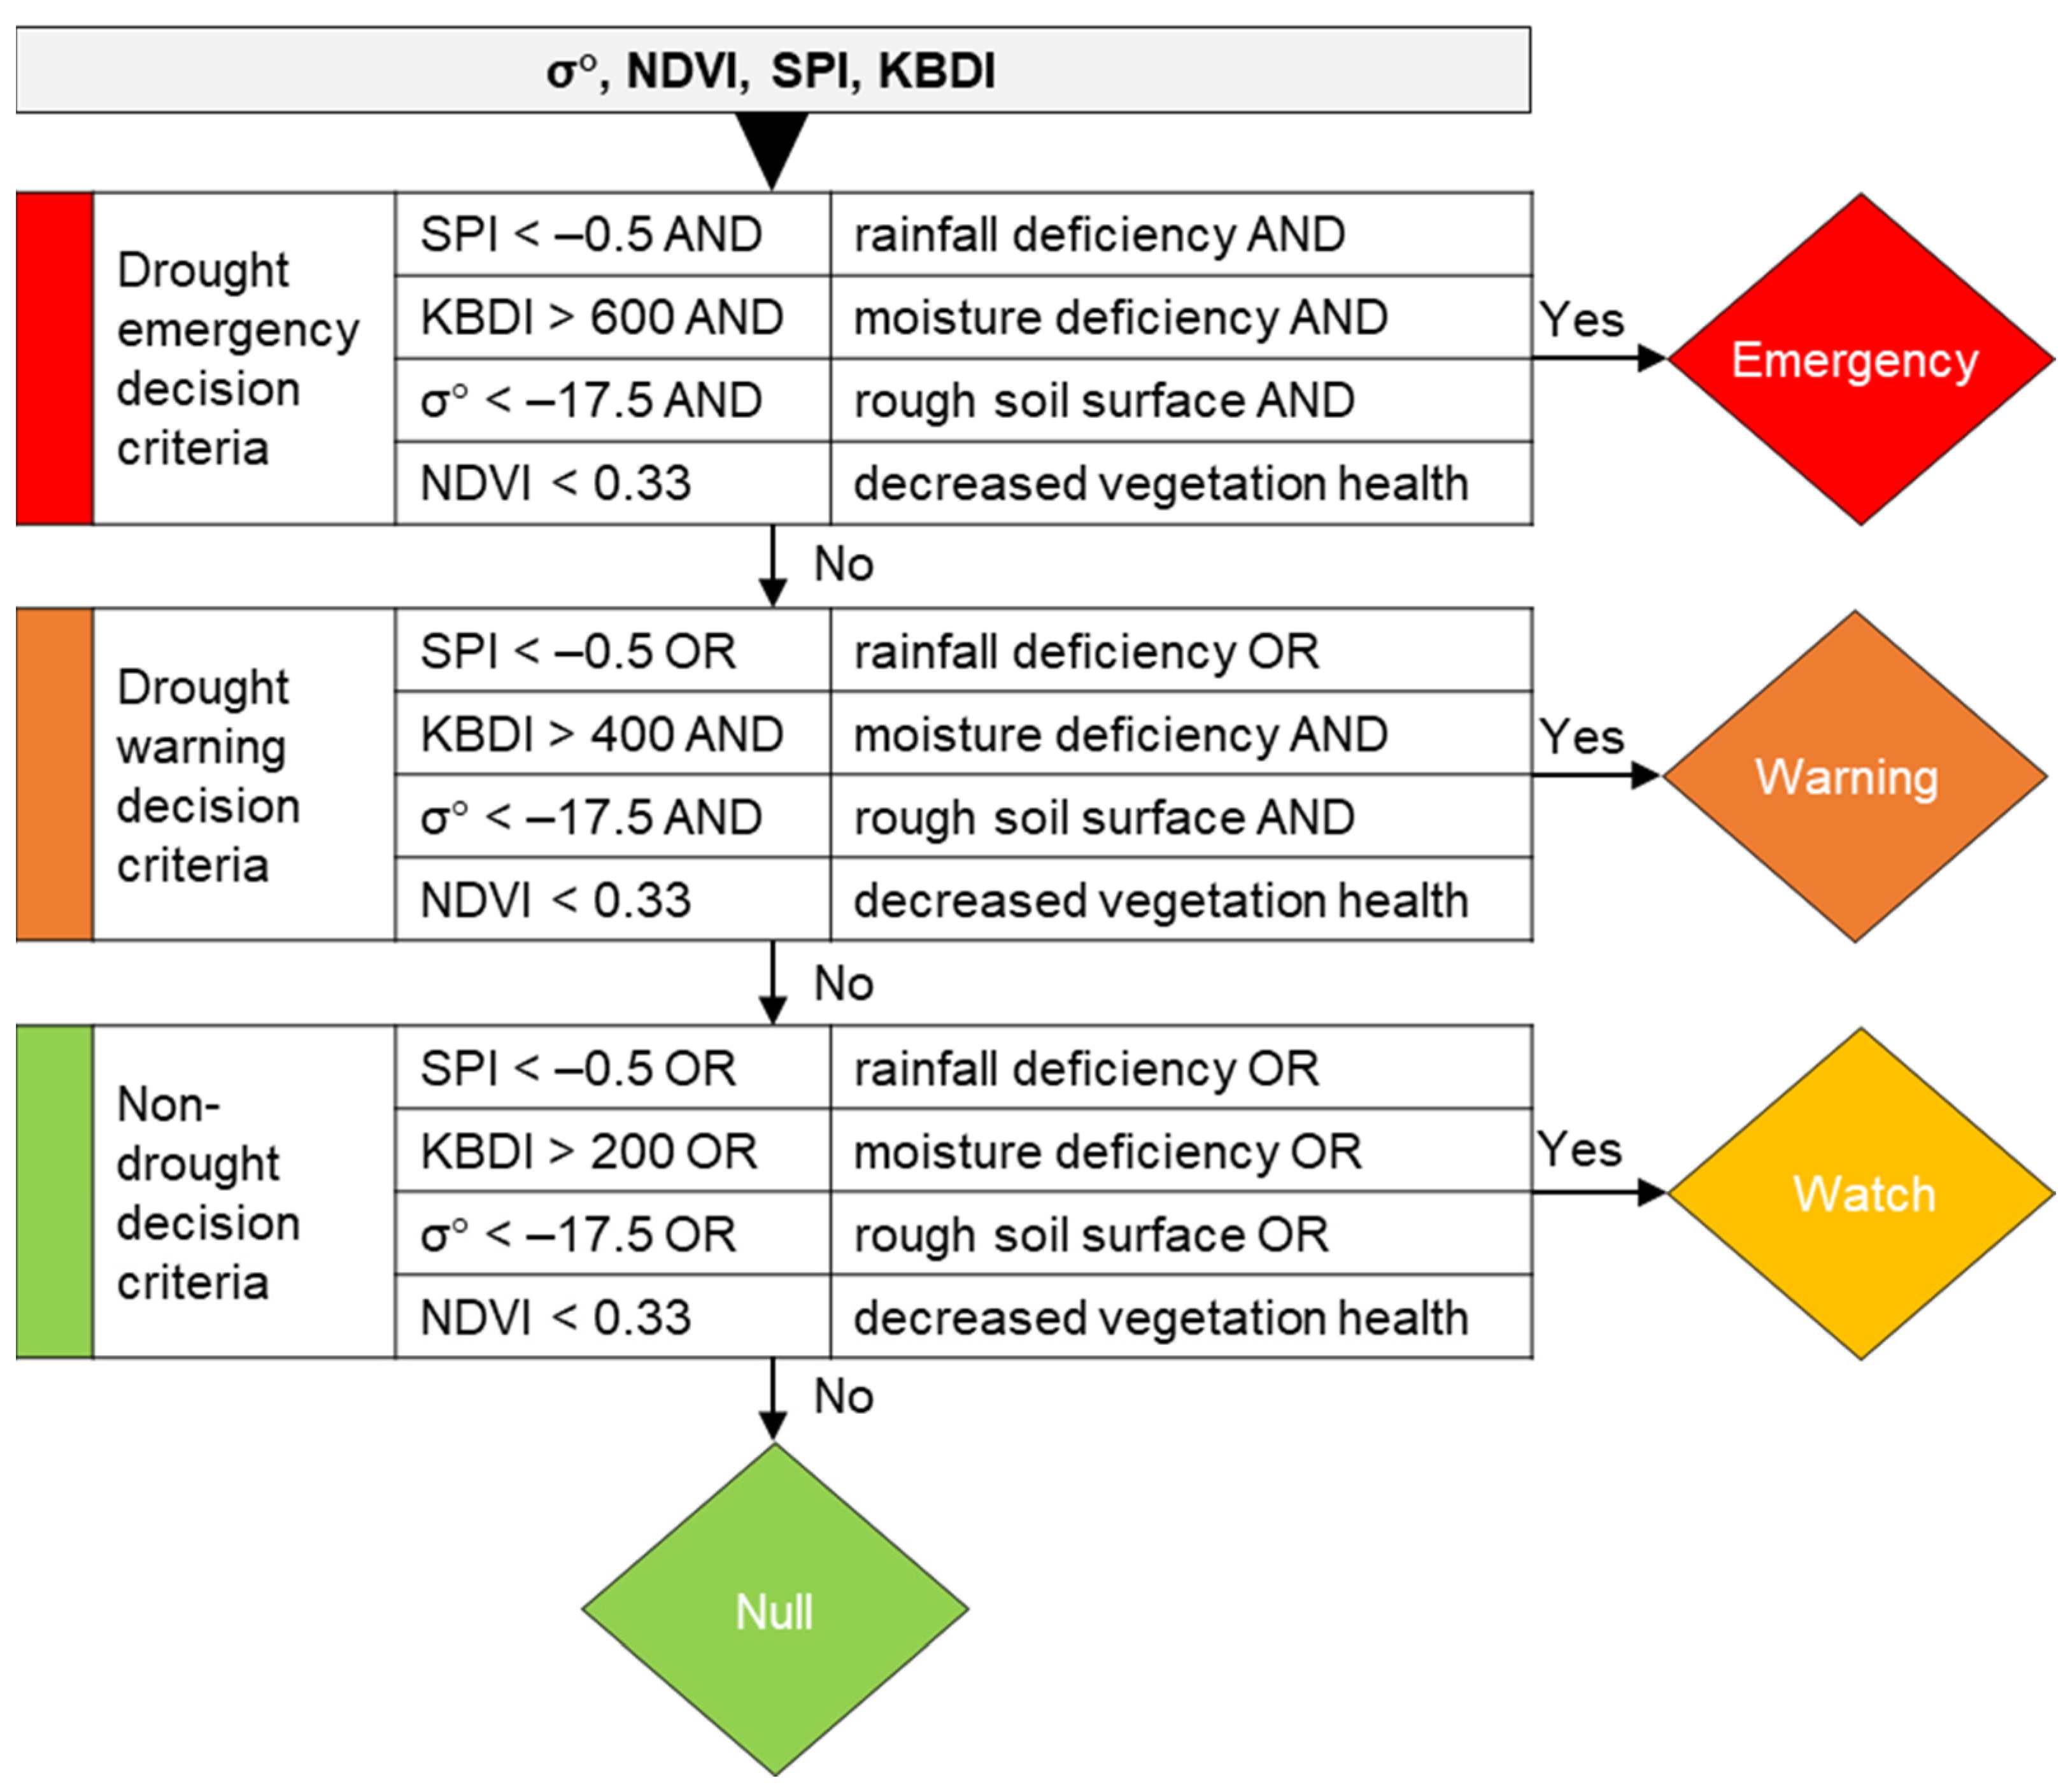
3.6. Drought Risk Management Plan
4. Results and Discussion
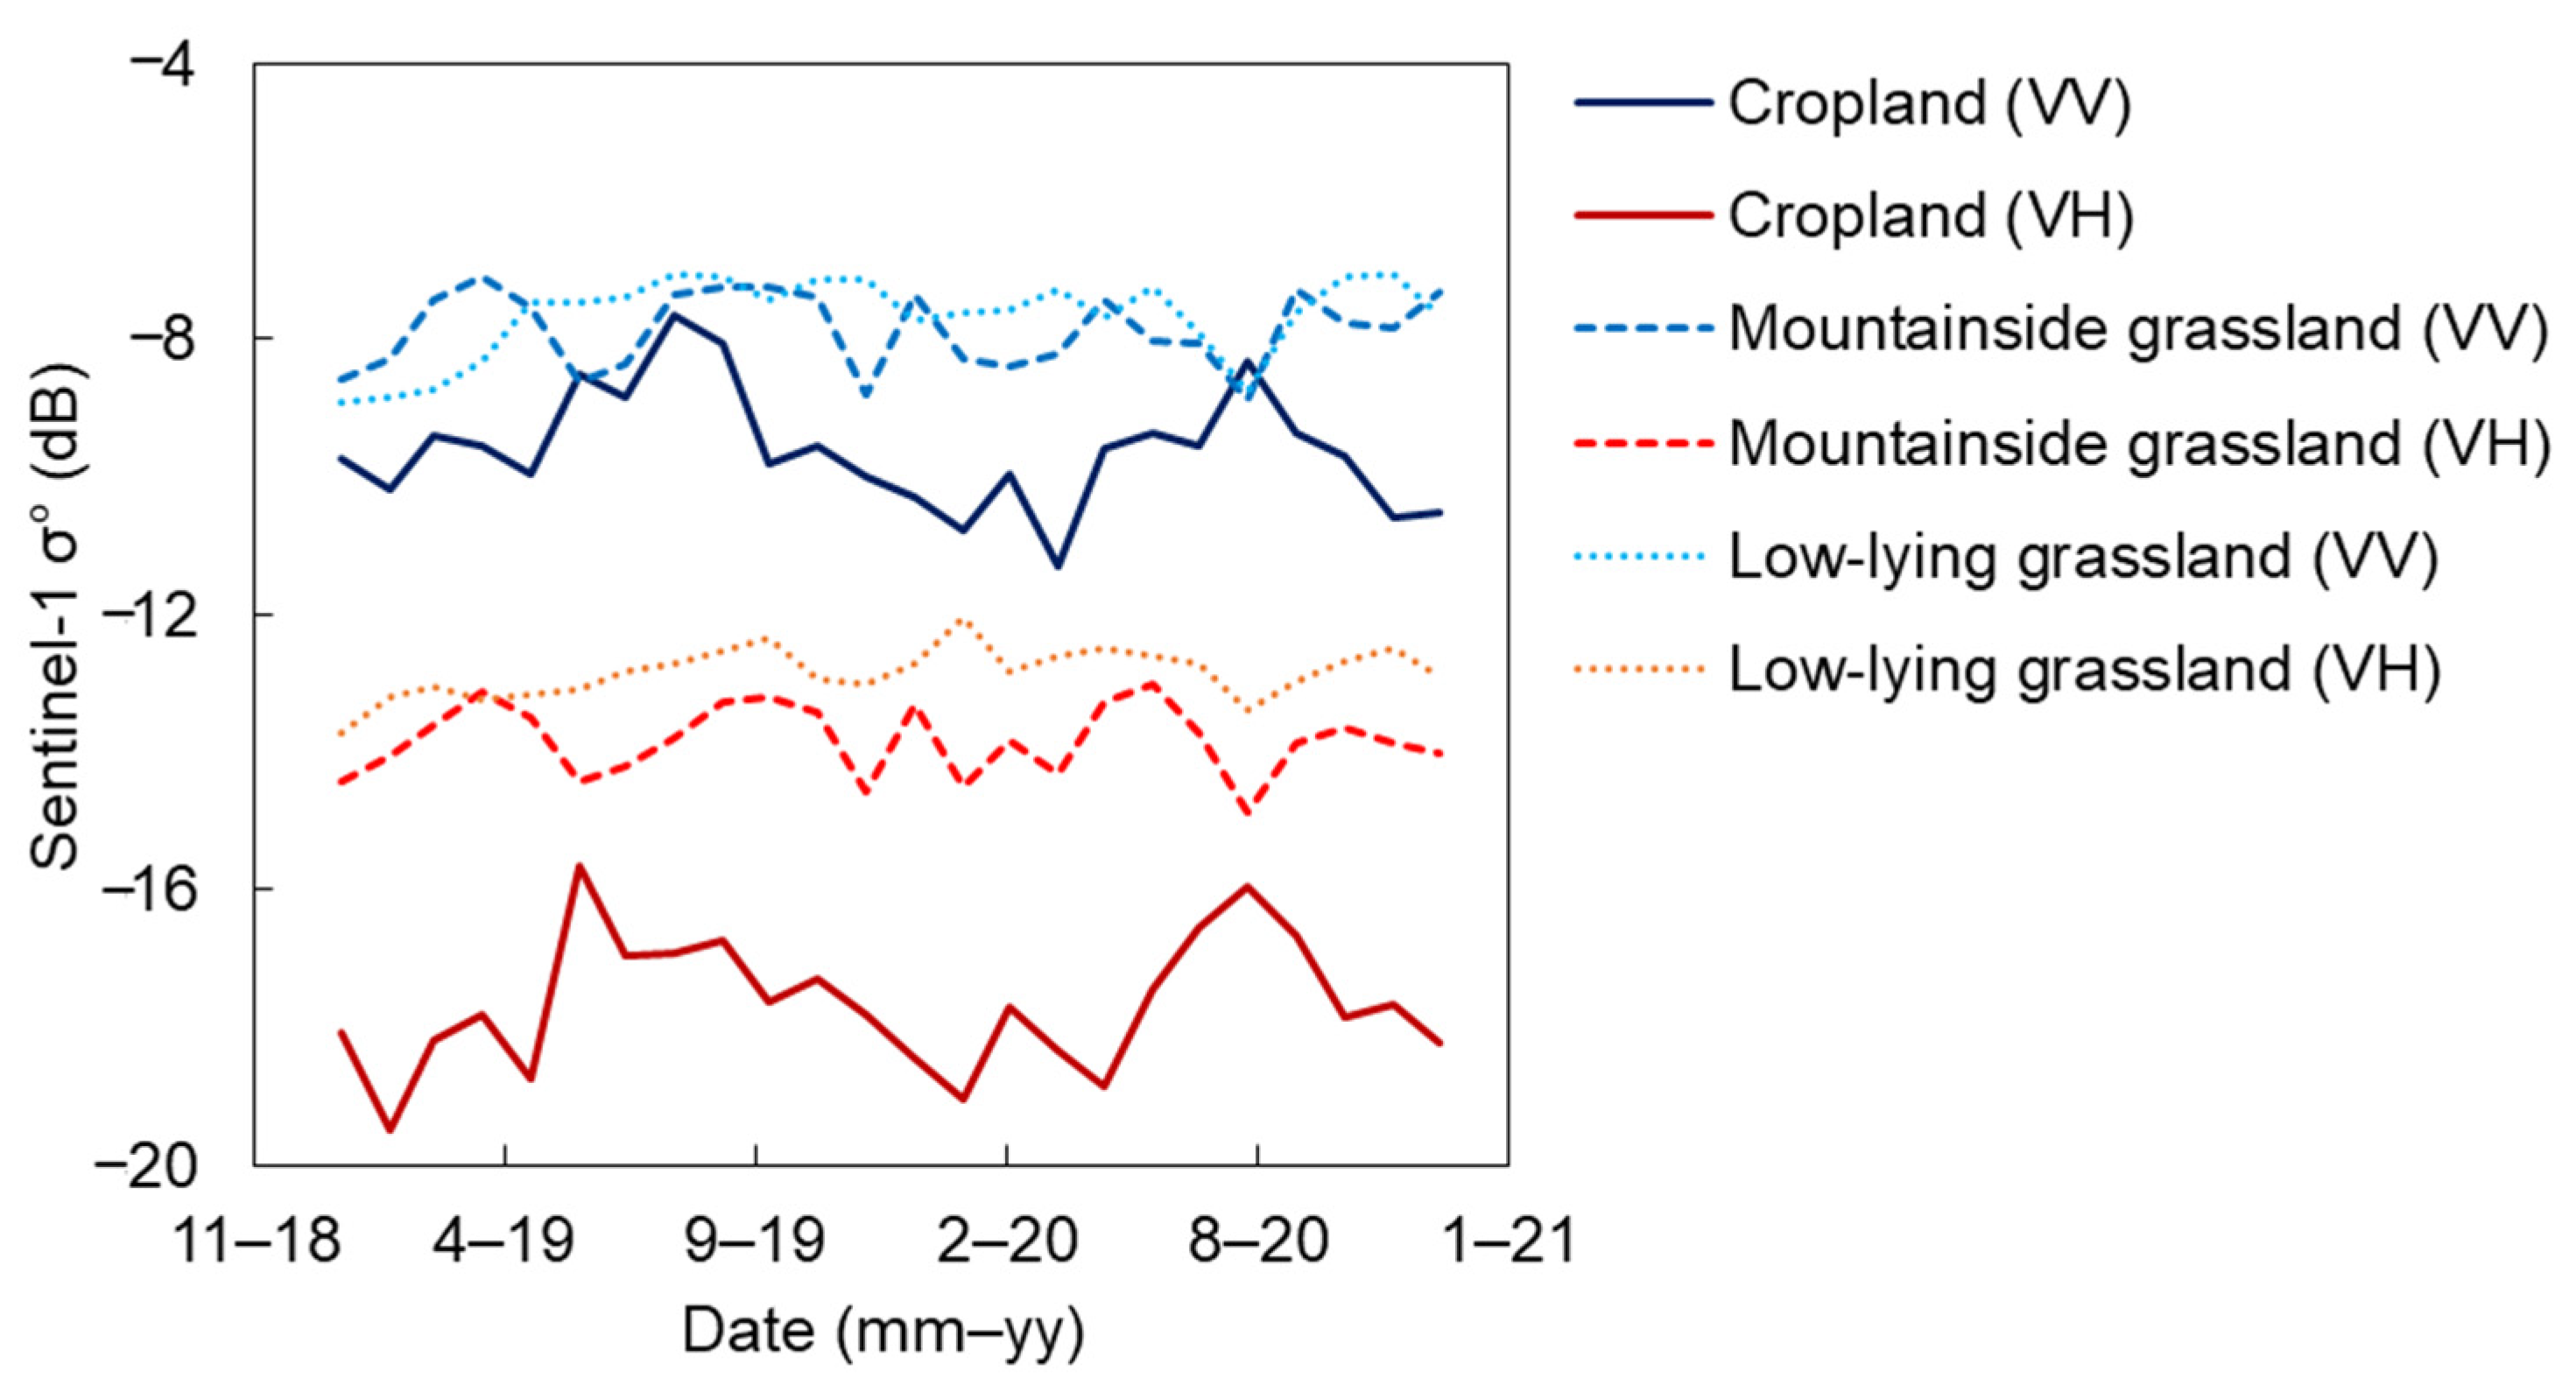
4.1. Comparison of VV and VH Channels
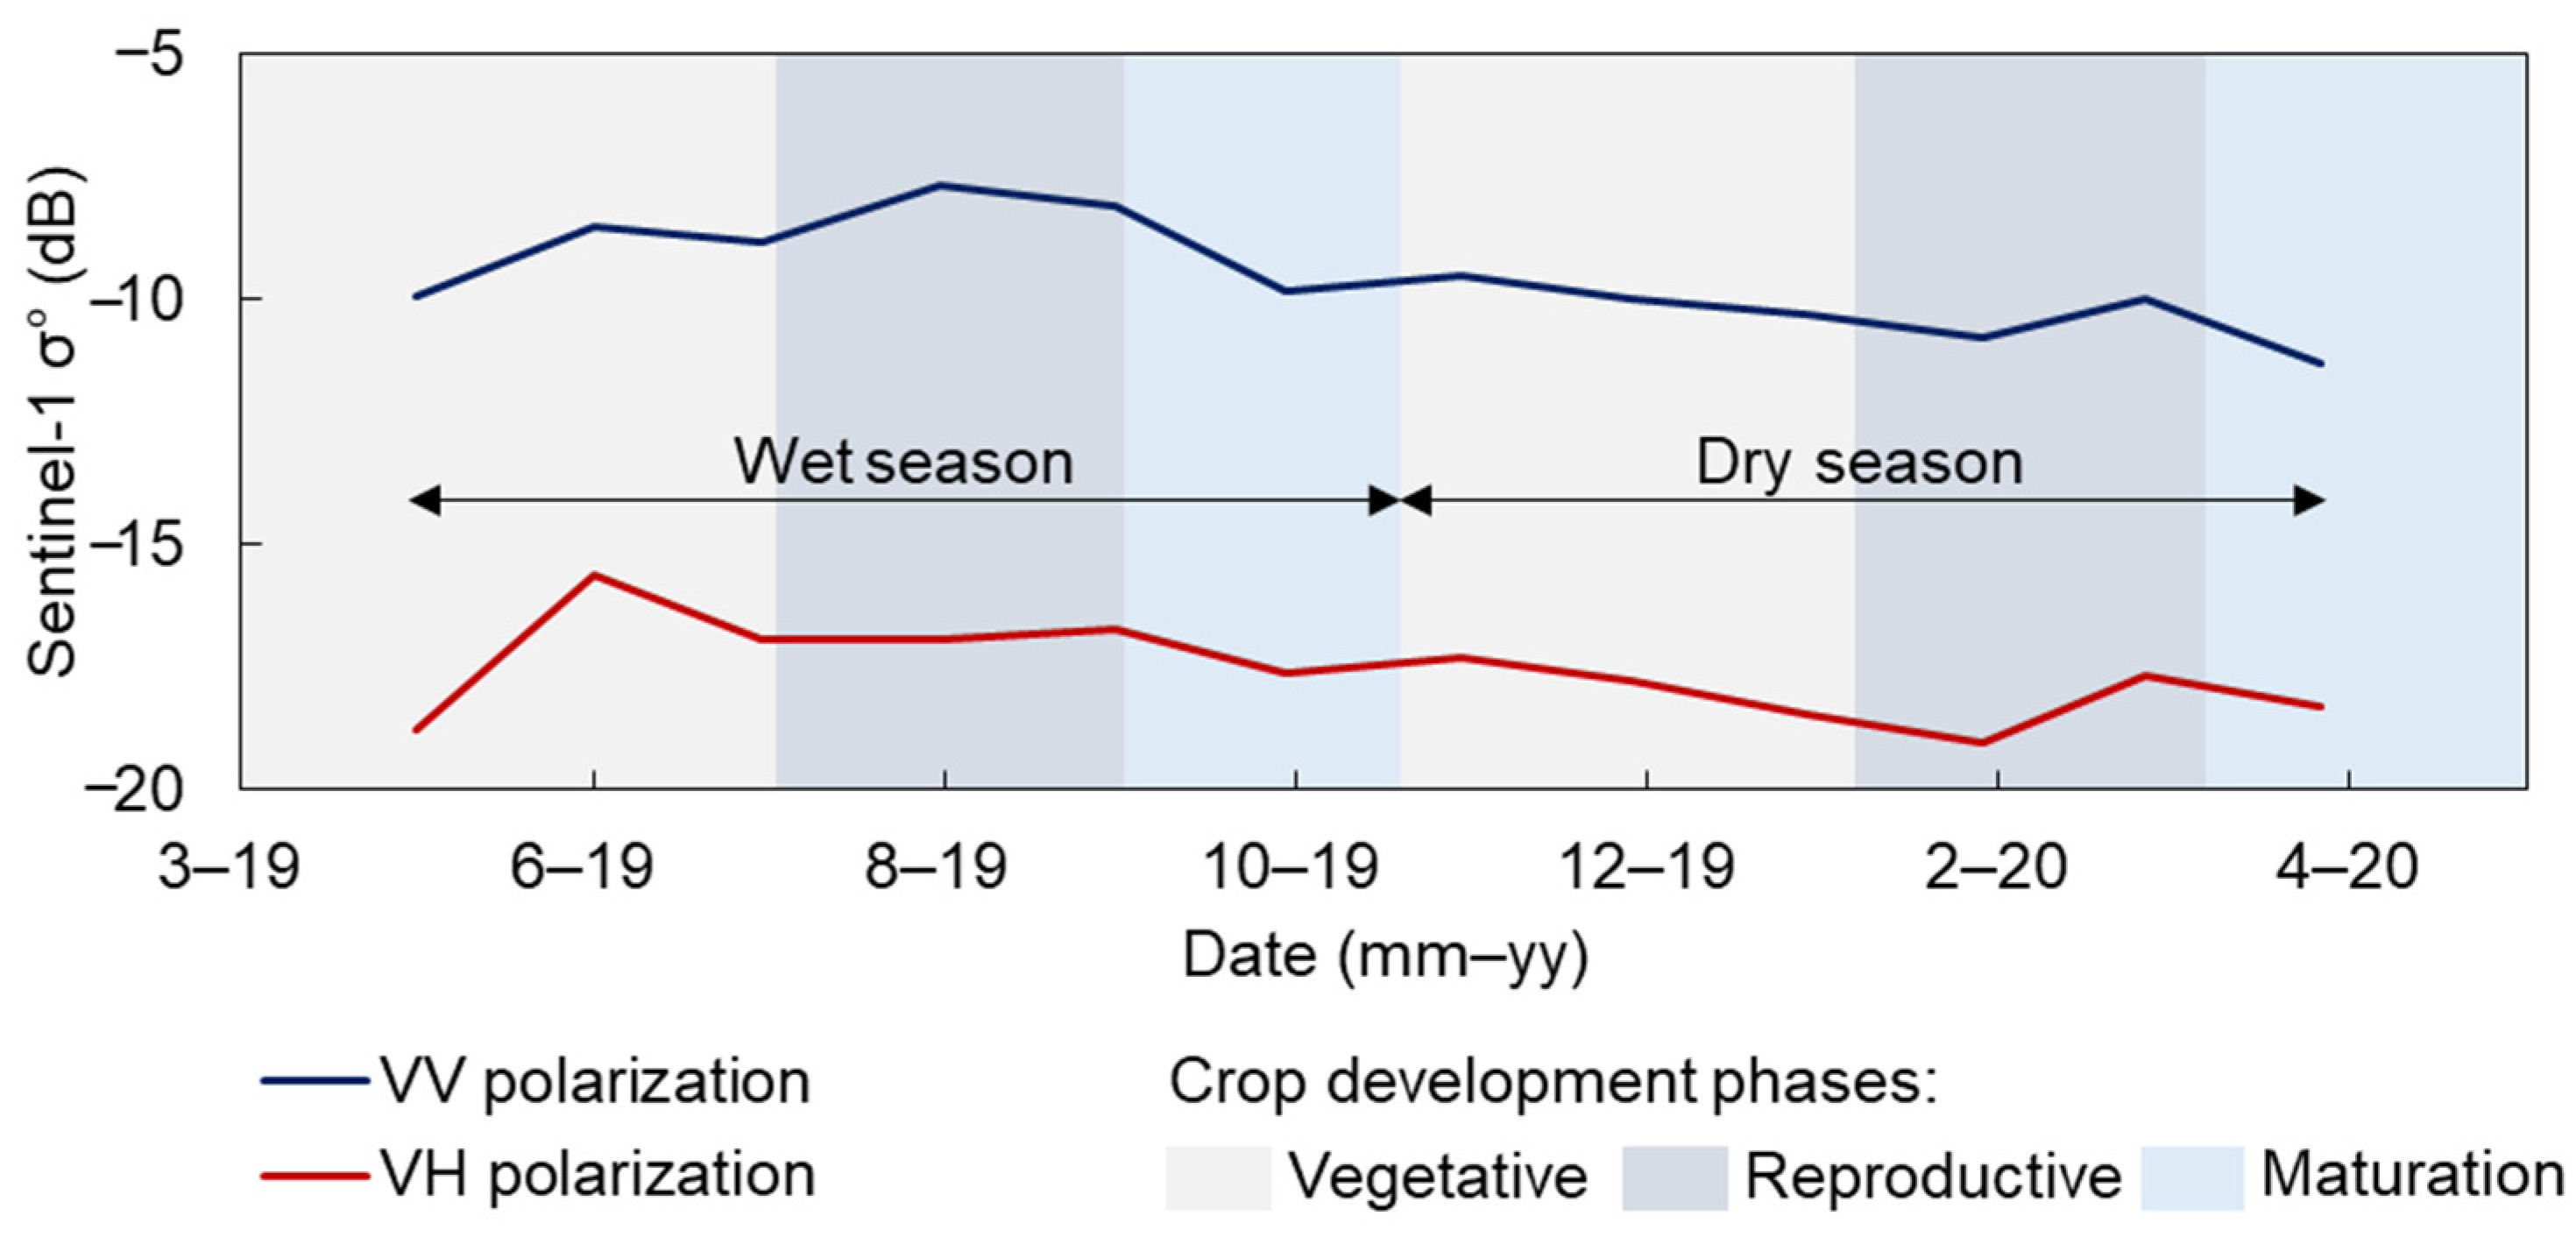
4.2. Temporal Analysis of Backscatter Intensity
4.2.1. Cropland Areas
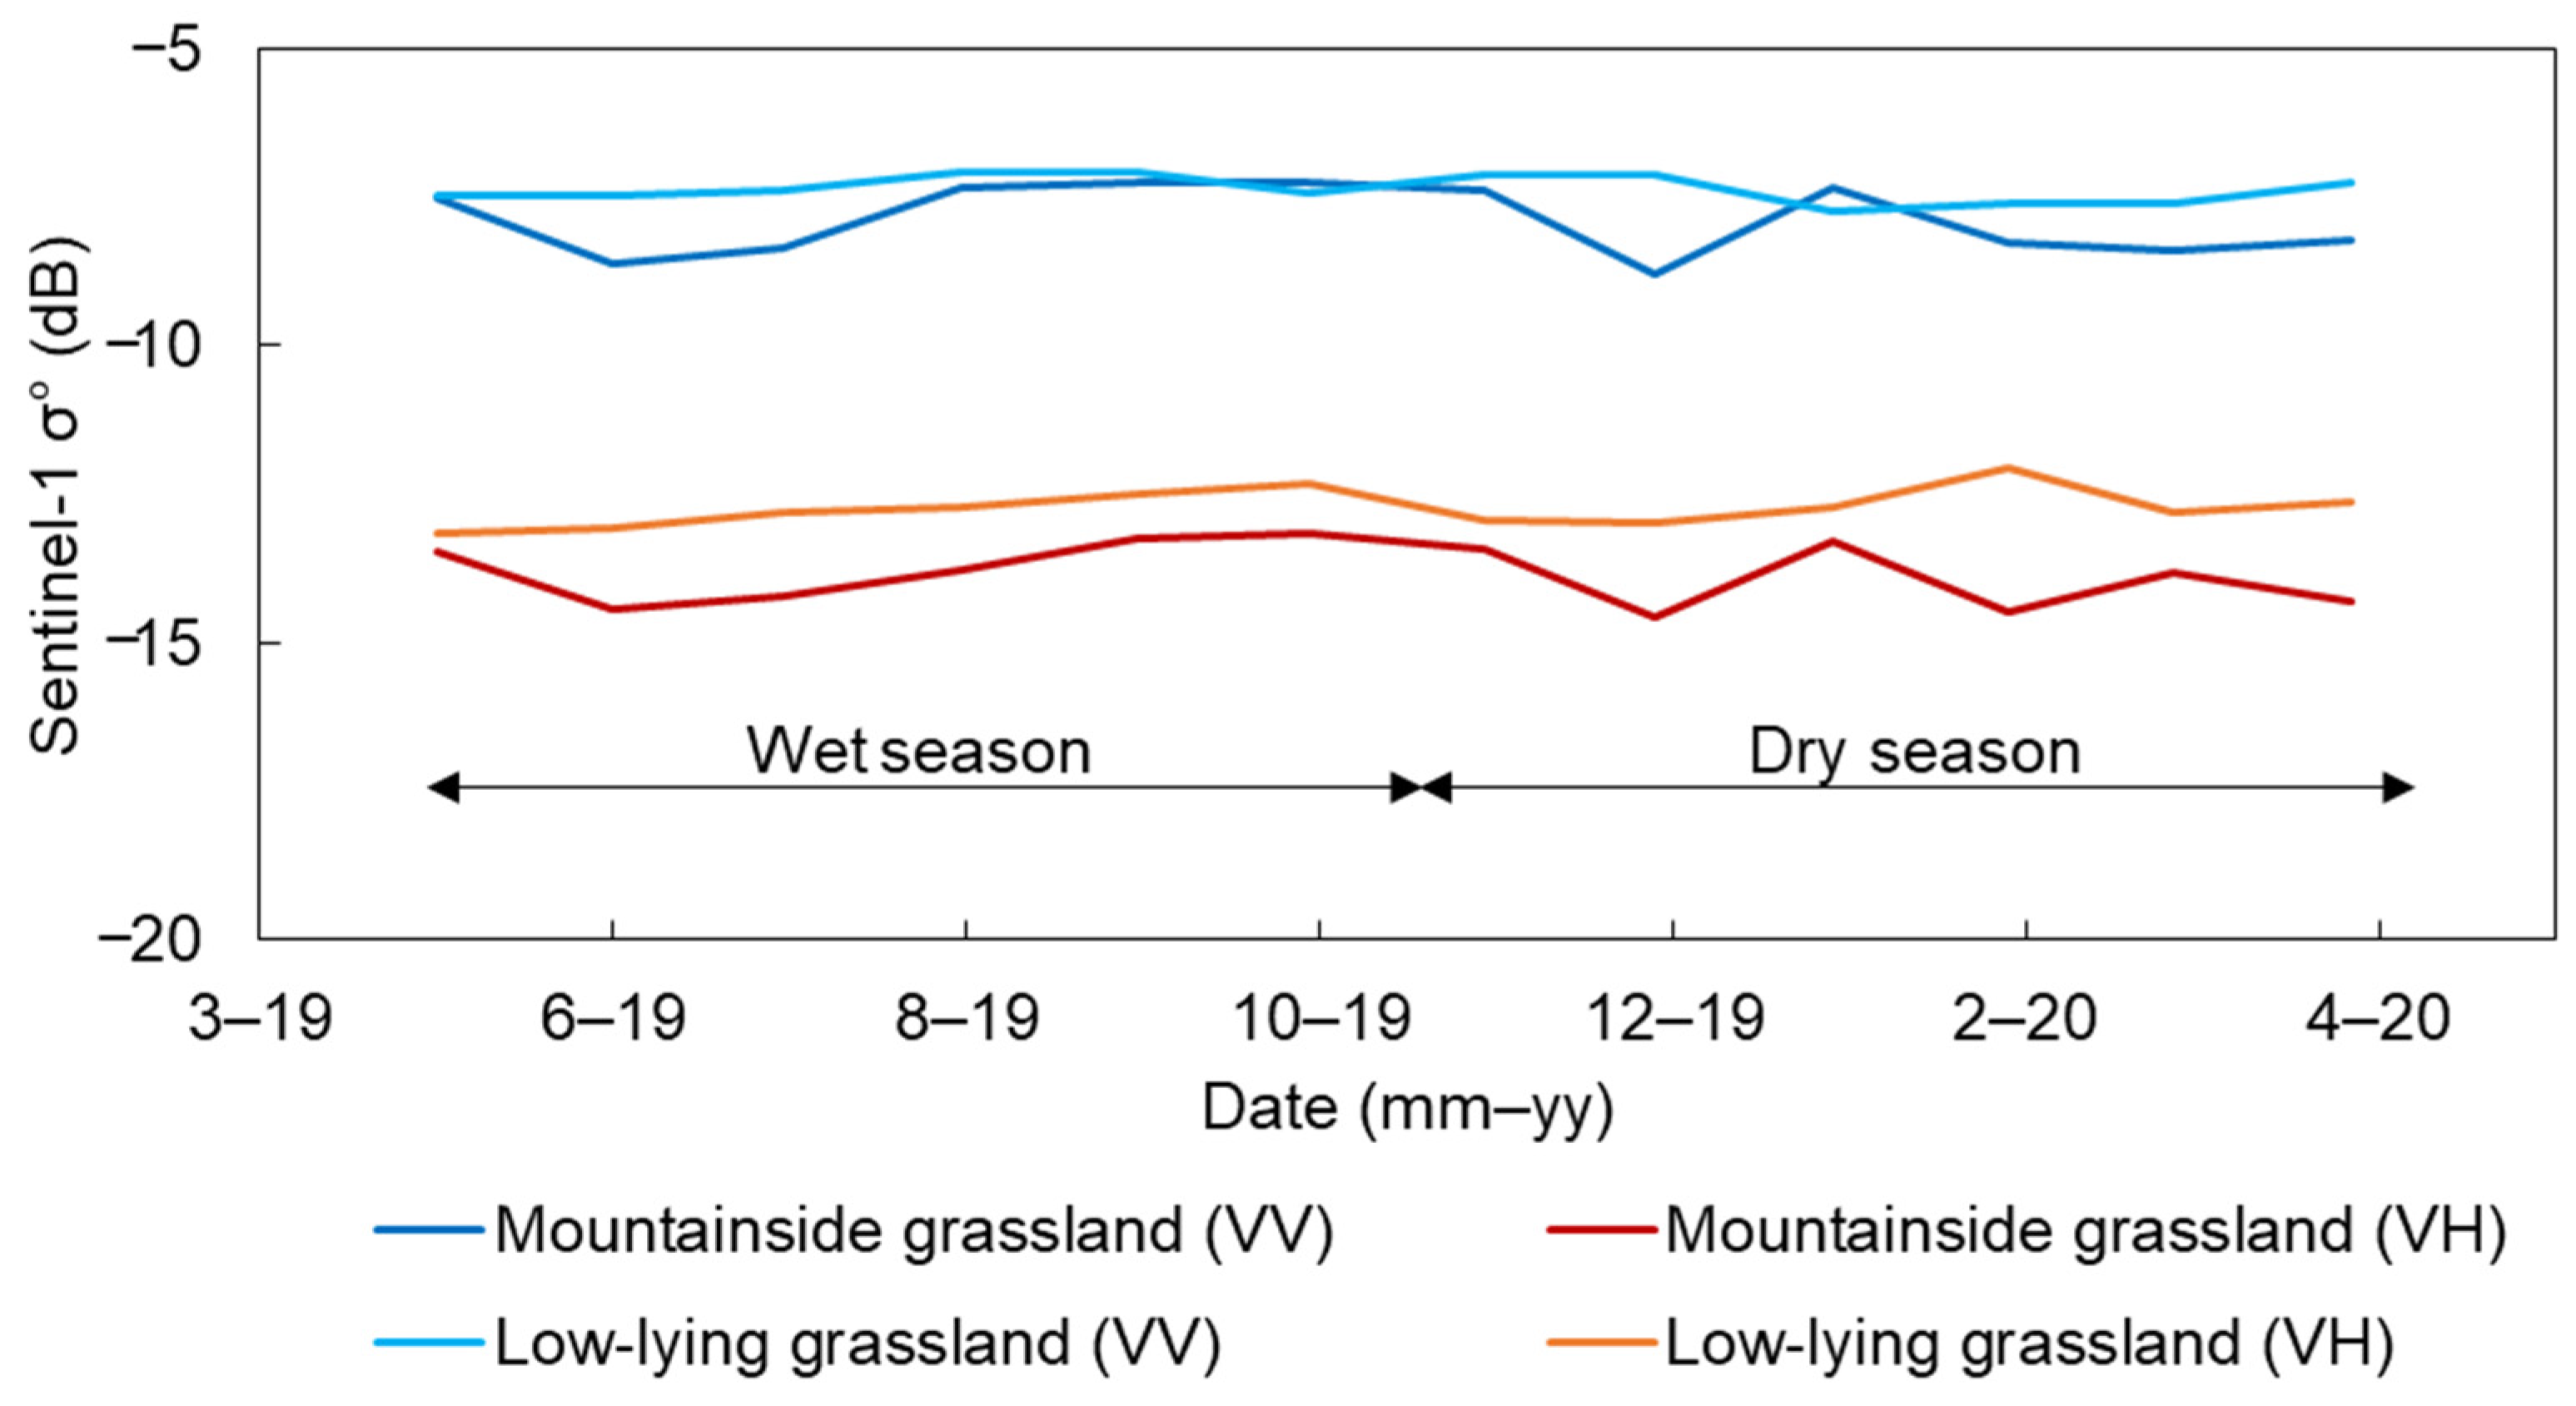
4.2.2. Grassland Areas
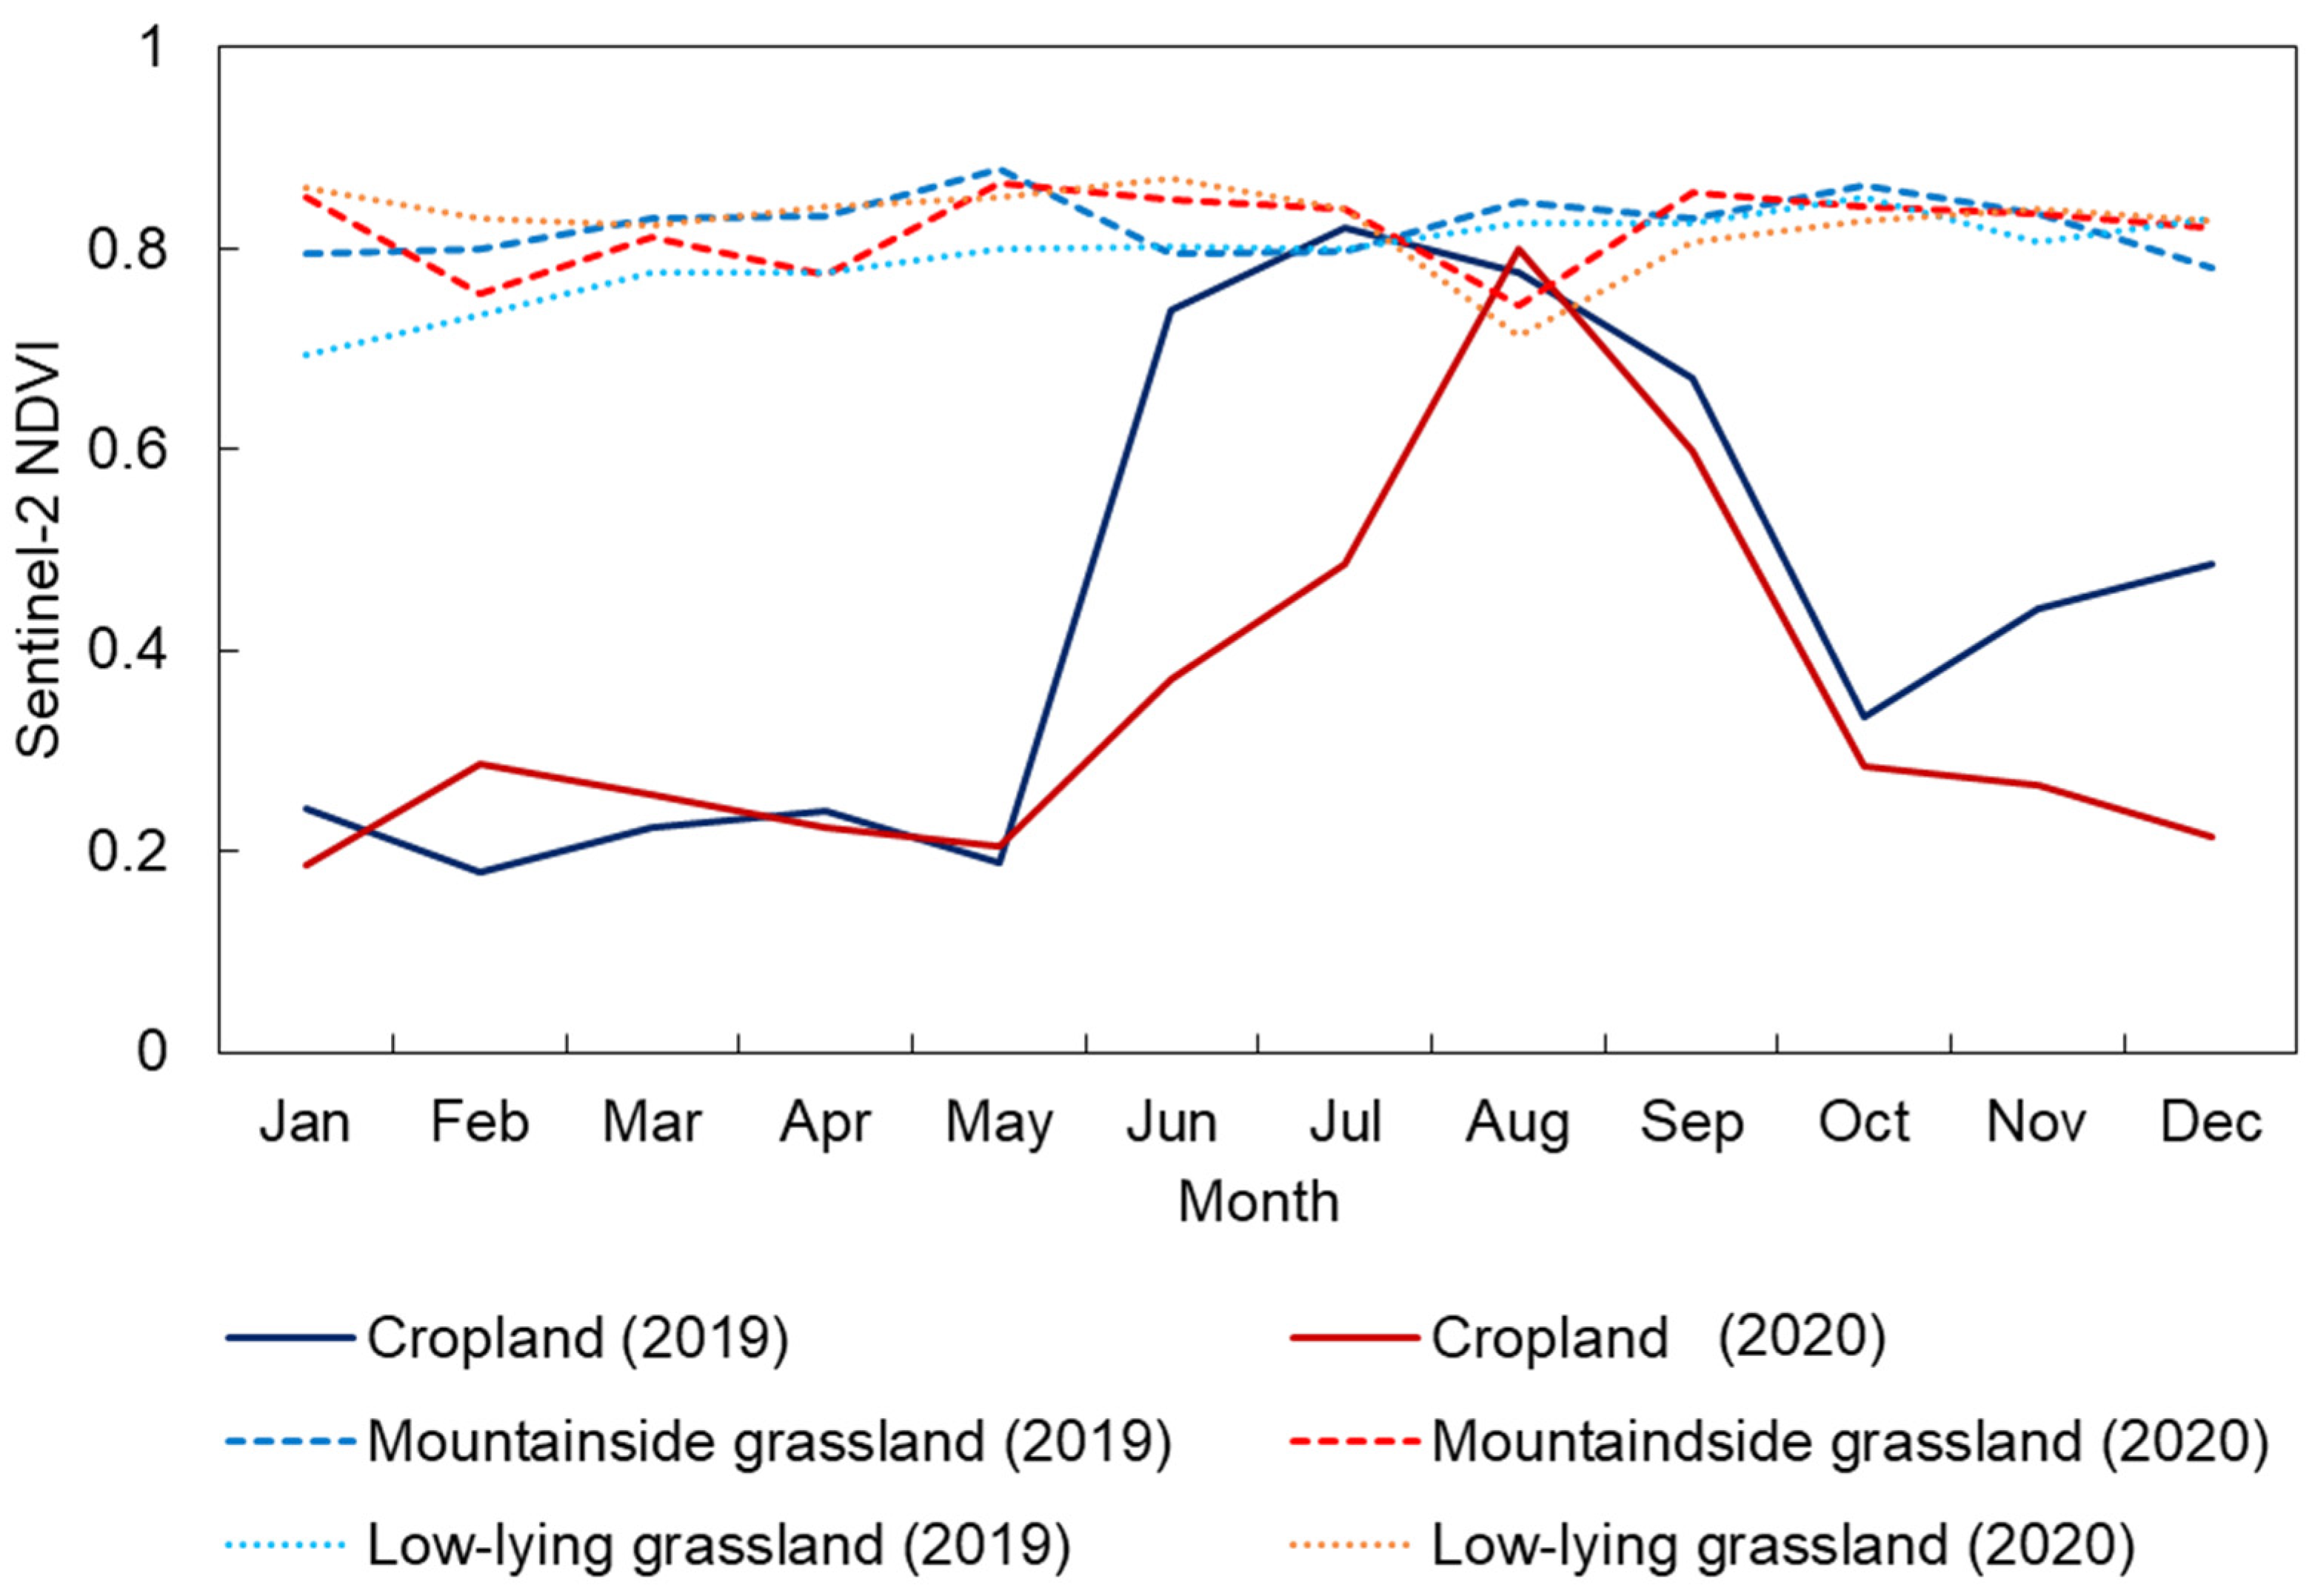
4.3. Temporal Analysis of Sentinel-2 NDVI
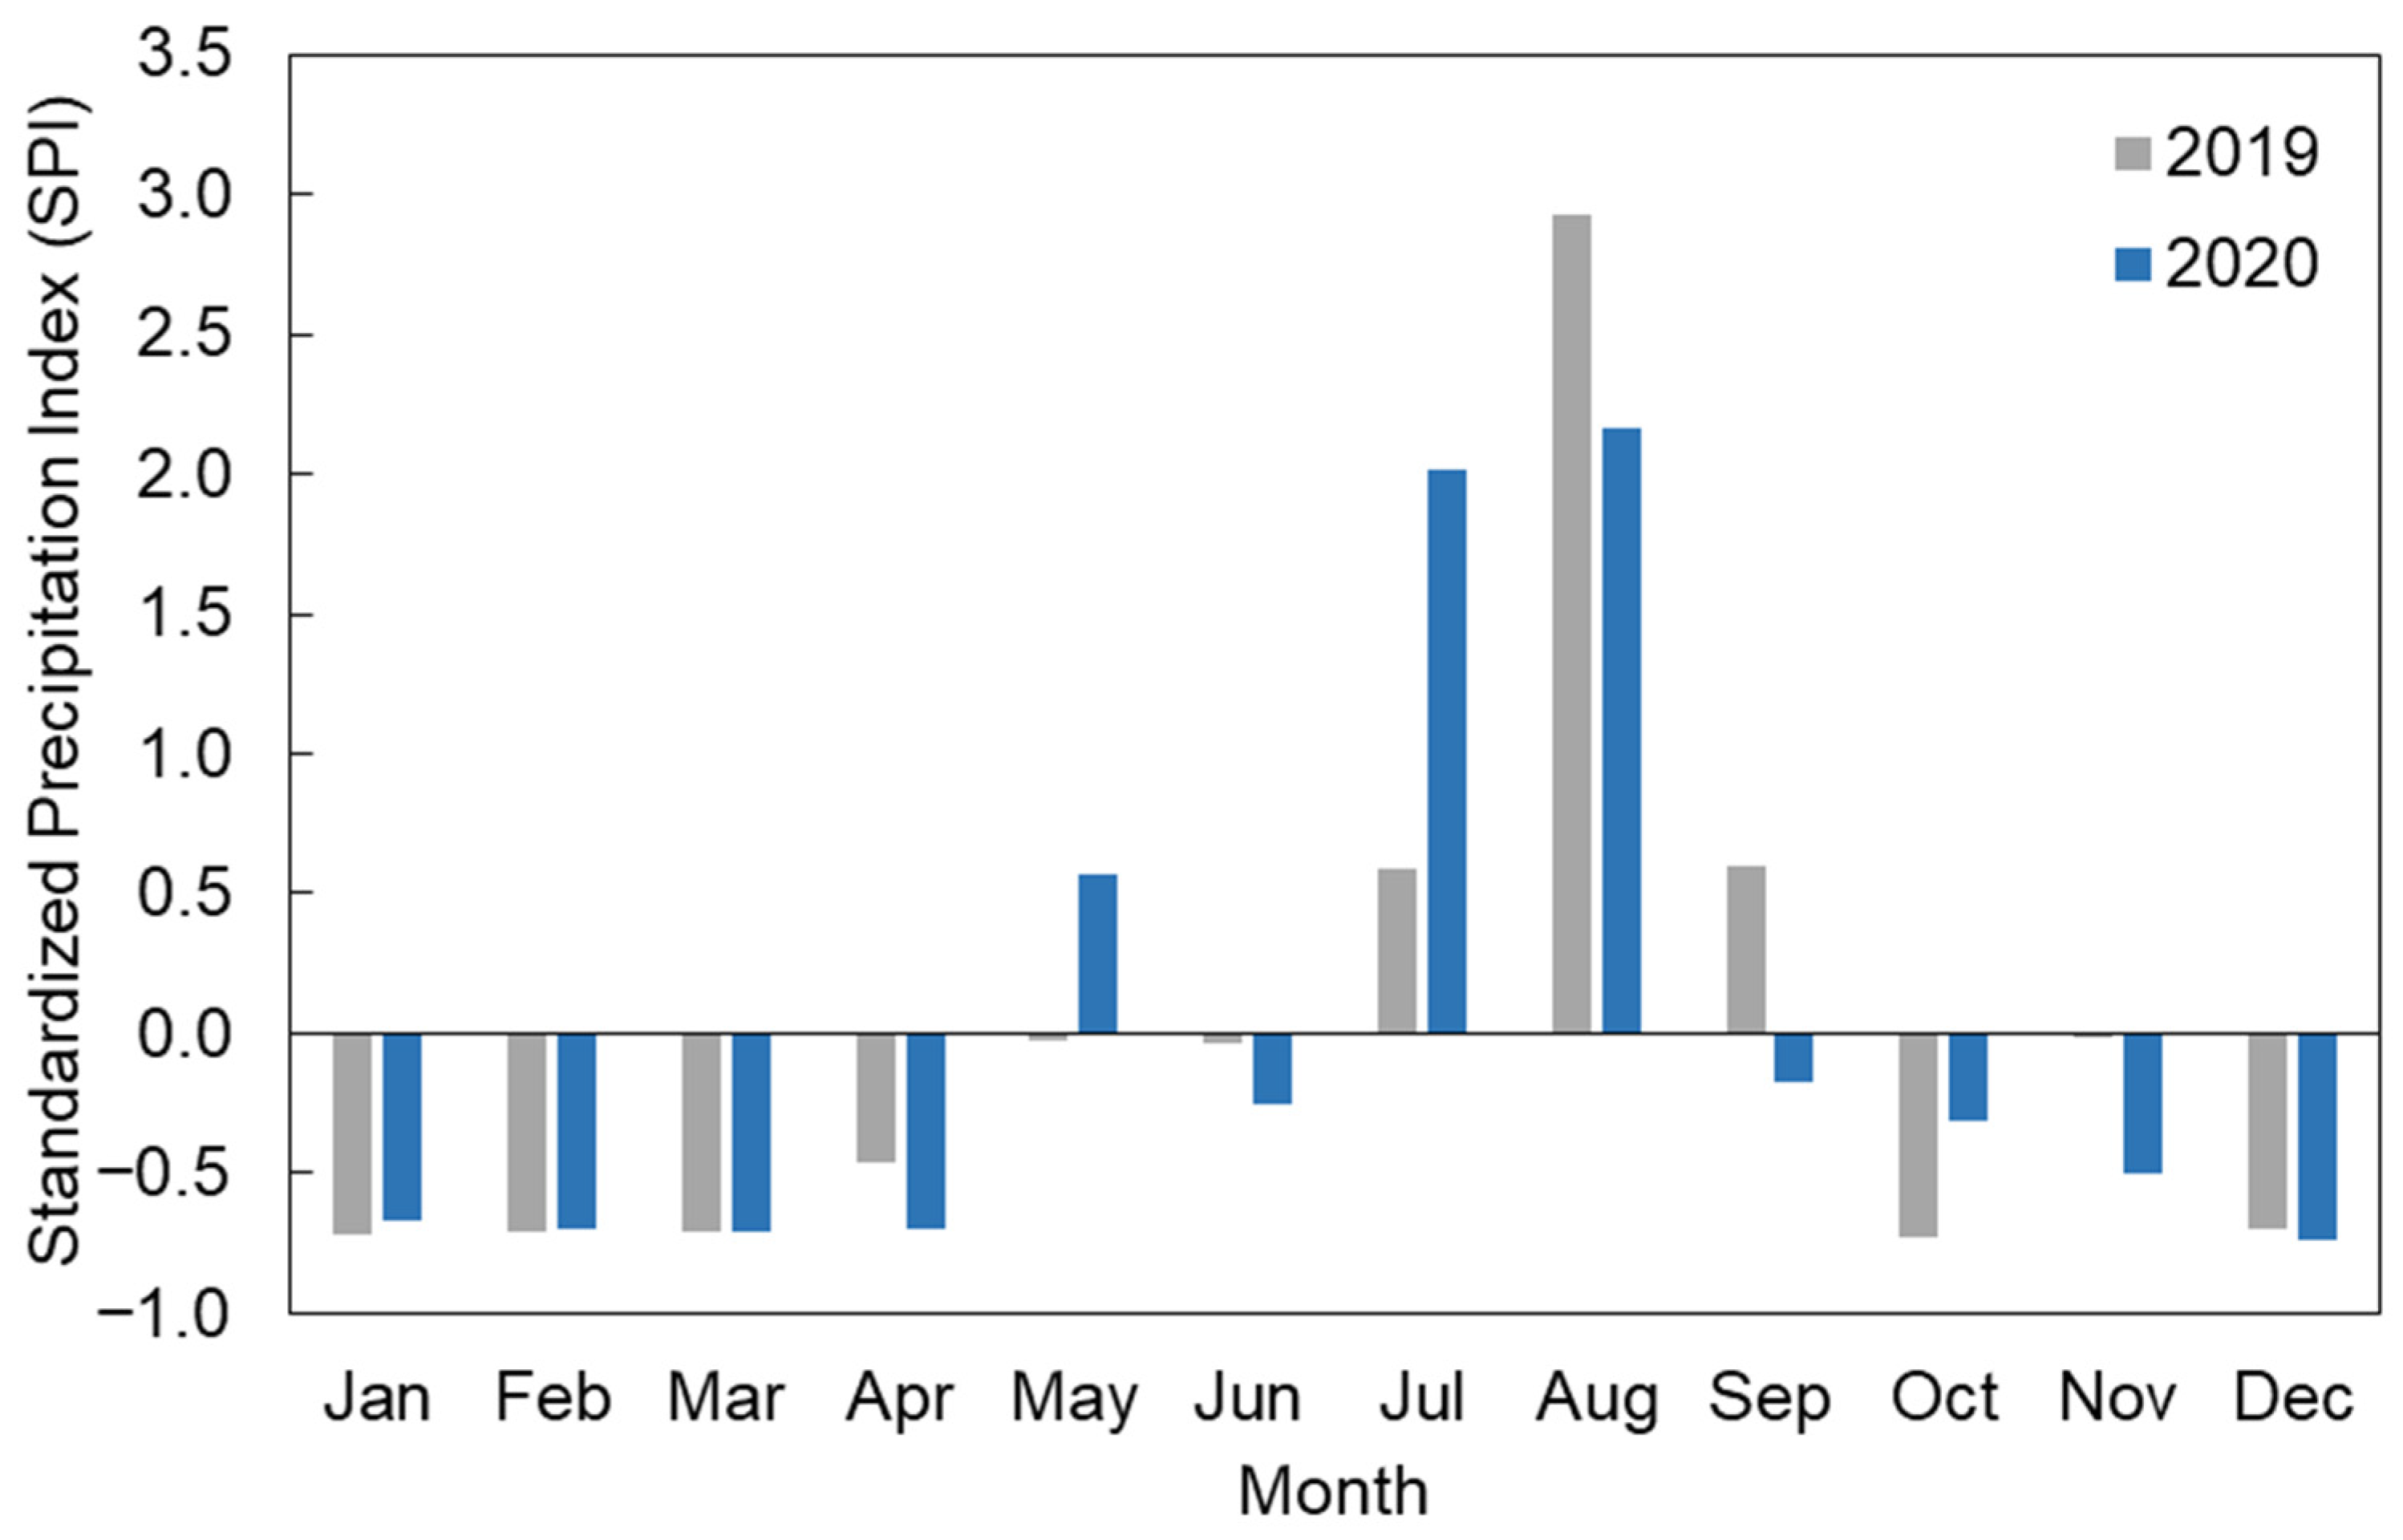
4.4. Temporal Analysis of SPI
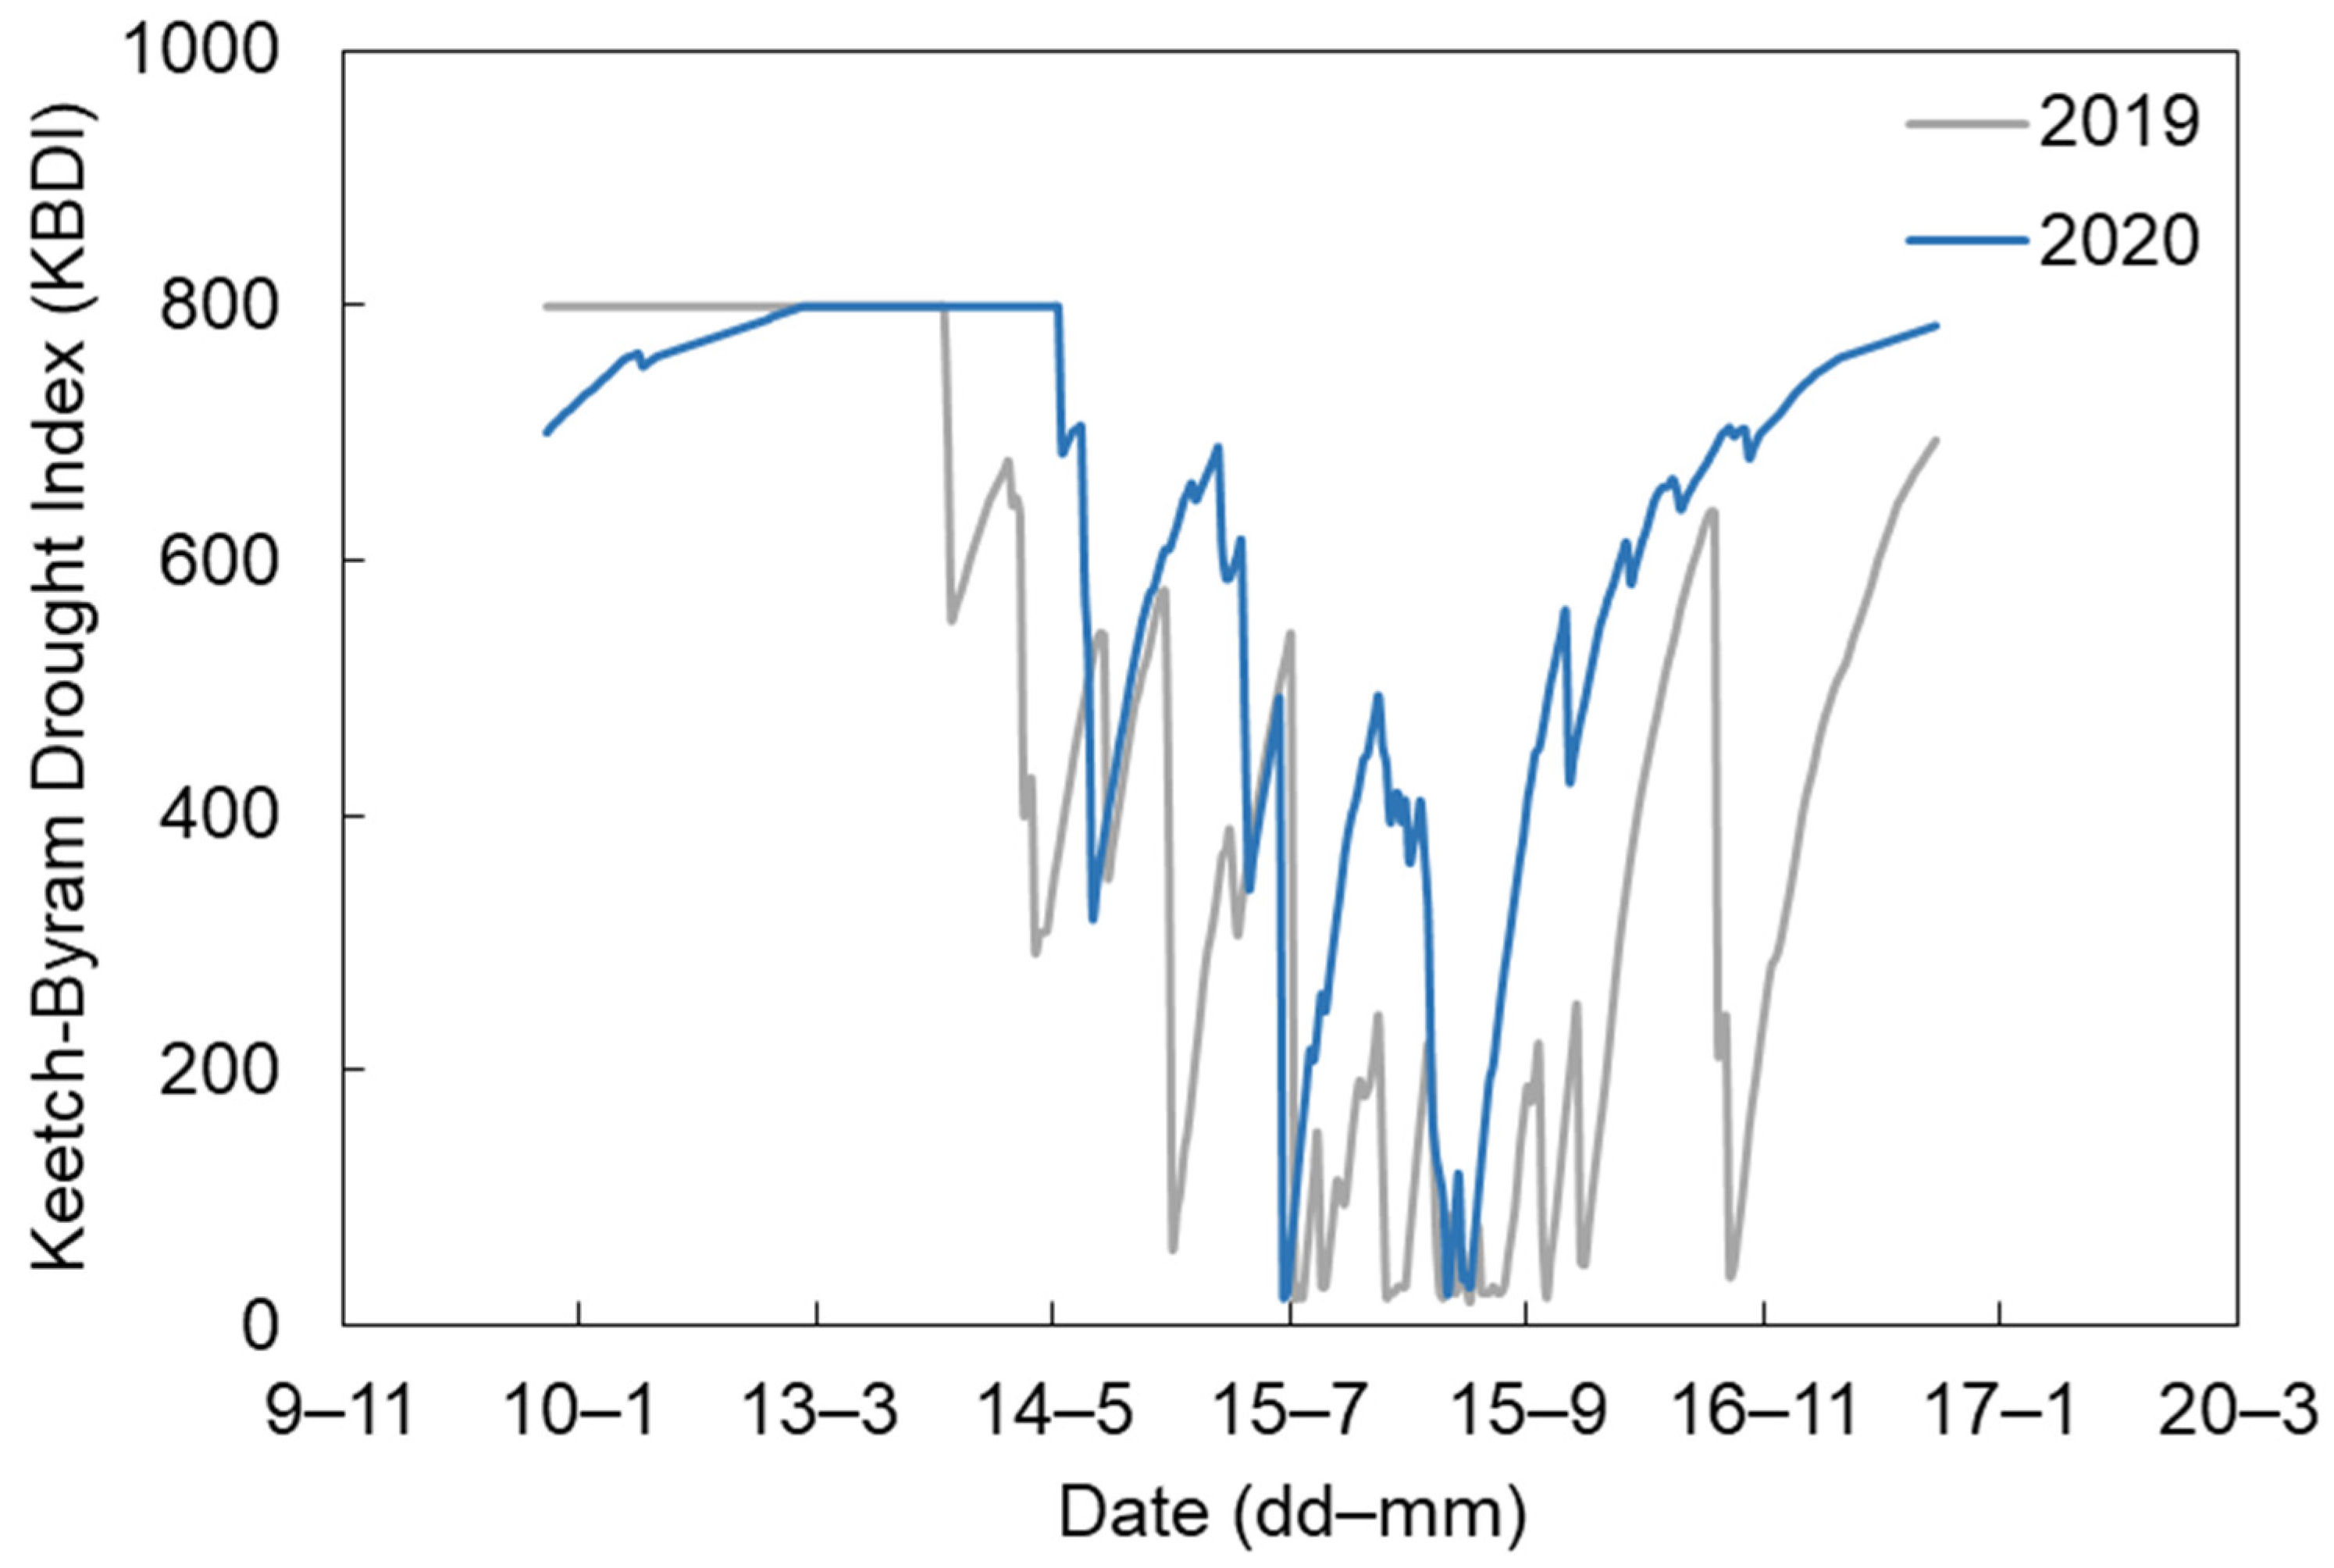
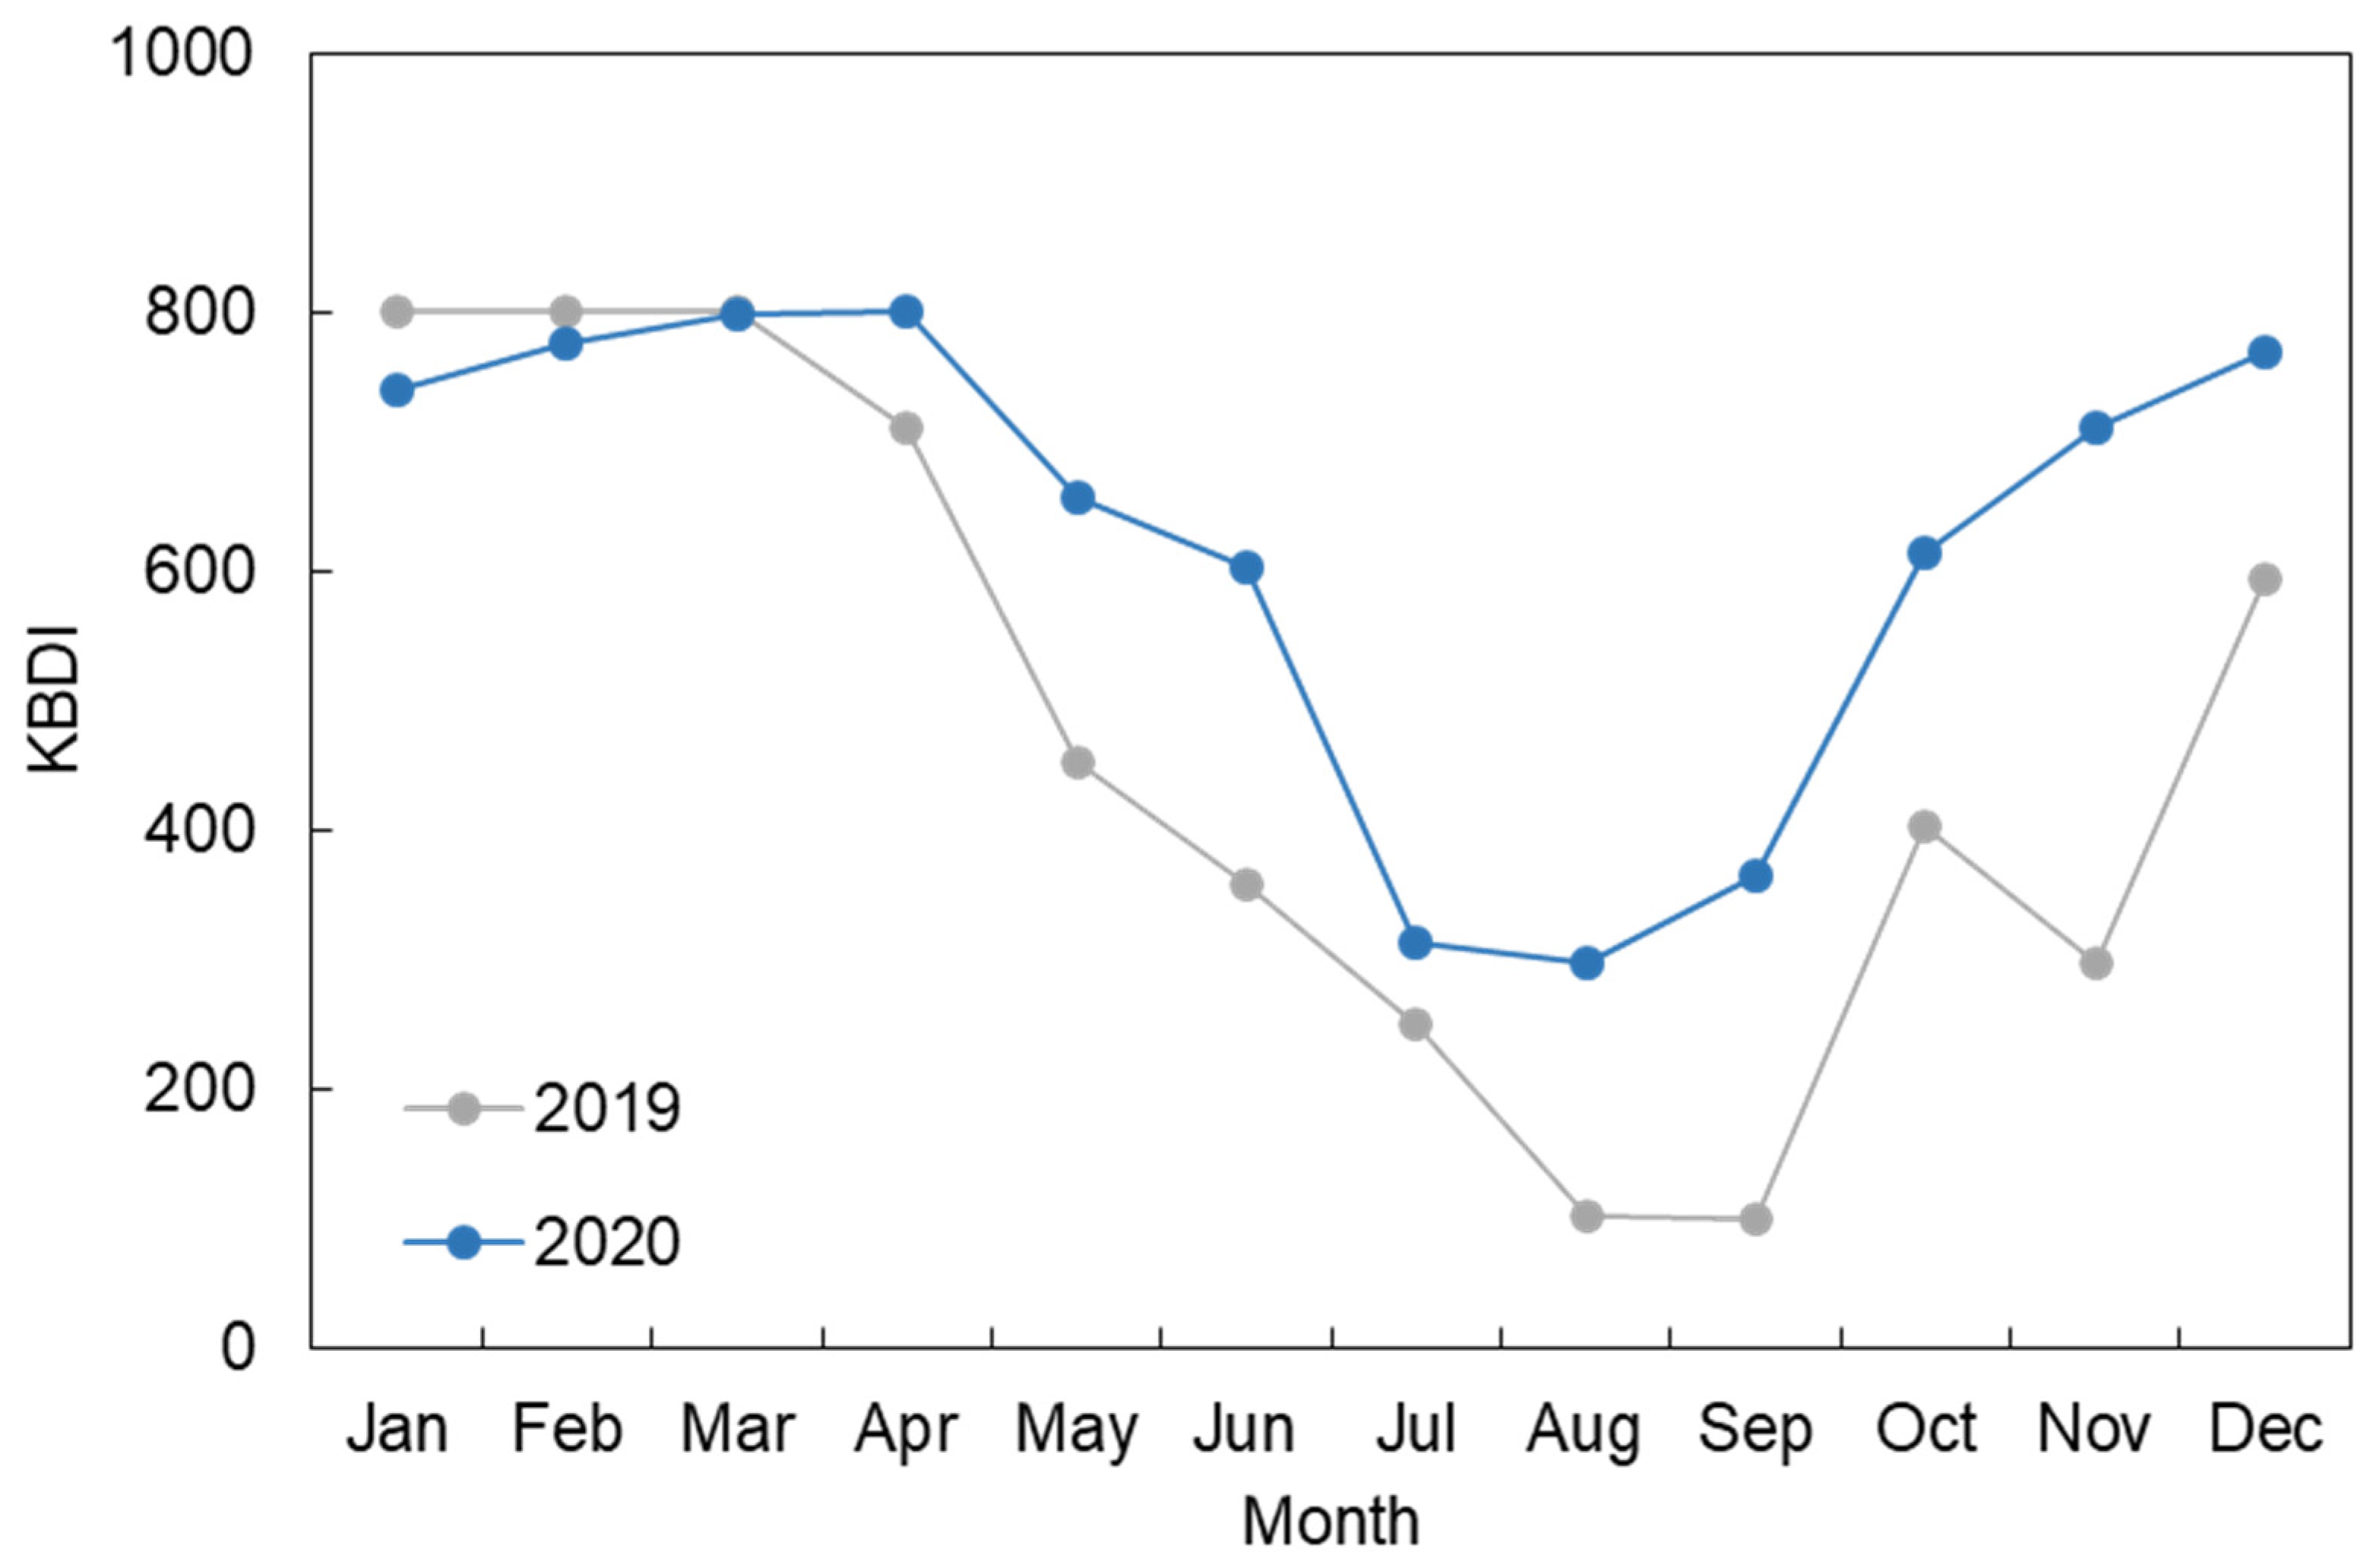
4.5. Temporal Analysis of KBDI
4.6. Correlation Analysis of Remote Sensing and Meteorological Drought Indicators
4.7. Proposed EWS for Drought Risk Management
4.8. Implications
5. Outlook
Author Contributions
Funding
Data Availability Statement
Acknowledgments
Conflicts of Interest
Appendix A

References
- Golian, S.; Mazdiyashi, O.; AghaKouchak, A. Trends in meteorological and agricultural droughts in Iran. Theor. Appl. Clim. 2015, 119, 679–688. [Google Scholar] [CrossRef]
- Baudoin, M.A.; Vogel, C.; Nortje, K.; Naik, M. Living with drought in South Africa: Lessons learnt from the recent El Niño drought period. Int. J. Disaster Risk Reduct. 2017, 23, 128–137. [Google Scholar] [CrossRef]
- Poornima, S.; Pushpalatha, M. Drought prediction based on SPI and SPEI with varying timescales using LSTM recurrent neural network. Soft. Comput. 2019, 23, 8399–8412. [Google Scholar] [CrossRef]
- Bhunia, P.; Das, P.; Maiti, P. Meteorological drought study through SPI in three drought prone districts of West Bengal, India. Earth Syst. Environ. 2020, 4, 43–55. [Google Scholar] [CrossRef]
- Fung, K.F.; Huang, Y.F.; Koo, C.H. Assessing drought conditions through temporal pattern, spatial characteristics and operational accuracy indicated by SPI and SPEI: Case analysis for Peninsular Malaysia. Nat. Hazards 2020, 103, 2071–2101. [Google Scholar] [CrossRef]
- Pei, Z.; Fang, S.; Wang, L.; Yang, W. Comparative analysis of drought indicated by the SPI and SPEI at various timescales in inner Mongolia, China. Water 2020, 12, 1925. [Google Scholar] [CrossRef]
- Liu, C.; Yang, C.; Yang, Q.; Wang, J. Spatiotemporal drought analysis by the standardized precipitation index (SPI) and standardized precipitation evapotranspiration index (SPEI) in Sichuan Province, China. Sci. Rep. 2021, 11, 1280. [Google Scholar] [CrossRef] [PubMed]
- Ben, O.D.; Abida, H. Monitoring and mapping of drought in a semi-arid region: Case of the Merguellil watershed, central Tunisia. Environ. Monit. Assess. 2022, 194, 287. [Google Scholar]
- Shaik, R.; NT, M. Estimation of annual regional drought index considering the joint effects of climate and water budget for Krishna River basin, India. Environ. Monit. Assess. 2020, 192, 472. [Google Scholar] [CrossRef]
- Hu, Z.; Wu, Z.; Zhang, Y.; Li, Q.; Islam, A.; Pan, C. Risk assessment of drought disaster in summer maize cultivated areas of the Huang-Huai-Huai plain, eastern China. Environ. Monit. Assess. 2021, 193, 441. [Google Scholar] [CrossRef]
- Bazrakshan, J.; Hejabi, S.; Rahimi, J. Drought monitoring using the multivariate standardized precipitation index (MSPI). Water Resour. Manag. 2014, 28, 1045–1060. [Google Scholar] [CrossRef]
- Aghelpour, P.; Kisi, O.; Varshavian, V. Multivariate drought forecasting in short- and long-term horizons using MSPI and data-driven approaches. J. Hydrol. Eng. 2021, 26, 04021006. [Google Scholar] [CrossRef]
- Ndlovu, M.S.; Demlie, M. Assessment of meteorological drought and wet conditions using two drought indices across KwaZulu-Natal Province, South Africa. Atmosphere 2020, 11, 623. [Google Scholar] [CrossRef]
- Chahal, M.; Singh, O.; Bhardwaj, P.; Ganapuram, S. Exploring spatial and temporal drought over the semi-arid Sahibi river basin in Rajasthan, India. Environ. Monit. Assess. 2021, 193, 743. [Google Scholar] [CrossRef]
- Dehghan, S.; Salehnia, N.; Sayari, N.; Bakhtiari, B. Prediction of meteorological drought in arid and semi-arid regions using PDSI and SDSM: A case study in Fars Province, Iran. J. Arid. Land 2020, 12, 318–330. [Google Scholar] [CrossRef]
- Yang, Y.; Zhang, S.; Roderick, M.L.; McVicar, T.R.; Yang, D.; Liu, W.; Li, X. Comparing Palmer Drought Severity Index drought assessments using the traditional offline approach with direct climate model outputs. Hydrol. Earth Syst. Sci. 2020, 24, 2921–2930. [Google Scholar] [CrossRef]
- Trenberth, K.E.; Dai, A.; van der Schier, G.; Jones, P.D.; Barichivich, J.; Briffa, K.R.; Sheffield, J. Global warming and changes in drought. Nat. Clim. Chang. 2014, 4, 17–22. [Google Scholar] [CrossRef]
- Zhang, Q.; Shi, R.; Singh, V.P.; Xu, C.Y.; Yu, H.; Fan, K.; Wu, Z. Droughts across China: Drought factors, prediction and impacts. Sci. Total Environ. 2022, 803, 150018. [Google Scholar] [CrossRef] [PubMed]
- Mishra, A.K.; Ines, A.V.M.; Das, N.N.; Khedun, C.P.; Singh, V.P.; Sivakumar, B.; Hansen, J.W. Anatomy of a local-scale drought: Application of assimilated remote sensing products, crop model, and statistical methods to an agricultural drought study. J. Hydrol. 2015, 526, 15–29. [Google Scholar] [CrossRef]
- Zhang, X.; Chen, N.; Li, J.; Chen, Z.; Niyogi, D. Multi-sensor integrated framework and index for agricultural drought monitoring. Remote Sens. Environ. 2017, 188, 141–163. [Google Scholar] [CrossRef] [Green Version]
- West, H.; Quinn, N.; Horswell, M. Remote sensing for drought monitoring & impact assessment: Progress, past challenges and future opportunities. Remote Sens. Environ. 2019, 231, 111291. [Google Scholar]
- Xu, Z.; Cao, L.; Zhong, S.; Liu, G.; Yang, Y.; Zhu, S.; Luo, X.; Di, L. Trends in global vegetative drought from long-term satellite remote sensing data. IEEE J. Sel. Top. Appl. Earth Obs. Remote Sens. 2020, 13, 815–826. [Google Scholar] [CrossRef]
- Javed, T.; Li, Y.; Rashid, S.; Li, F.; Hu, Q.; Feng, H.; Chen, X.; Ahmad, S.; Liu, F.; Pulatov, B. Performance and relationship of four different agricultural drought indices for drought monitoring in China’s mainland using remote sensing data. Sci. Total Environ. 2021, 759, 143530. [Google Scholar] [CrossRef]
- Shahzaman, M.; Zhu, W.; Ullah, I.; Mustafa, F.; Bilal, M.; Ishfaq, S.; Nisar, S.; Arshad, M.; Iqbal, R.; Aslam, R.W. Comparison of multi-year reanalysis, models, and satellite remote sensing products for agricultural drought monitoring over South Asian countries. Remote Sens. 2021, 13, 3294. [Google Scholar] [CrossRef]
- Dotzler, S.; Hill, J.; Buddenbaum, H.; Stoffels, J. The potential of EnMAP and Sentinel-2 data for detecting drought stress phenomena in deciduous forest communities. Remote Sens. 2015, 7, 14227–14258. [Google Scholar] [CrossRef] [Green Version]
- West, H.; Quinn, N.; Horswell, M.; White, P. Assessing vegetation response to soil moisture fluctuation under extreme drought using Sentinel-2. Water 2018, 10, 838. [Google Scholar] [CrossRef] [Green Version]
- Hashim, B.M.; Sultan, M.A.; Attyia, M.N.; Al Maliki, A.A.; Al-Ansari, N. Change detection and impact of climate changes to Iraqi southern marshes using Landsat 2 MSS, Landsat 8 OLI and Sentinel 2 MSI data and GIS applications. Appl. Sci. 2019, 9, 2016. [Google Scholar] [CrossRef] [Green Version]
- Puletti, N.; Mattioli, W.; Bussotti, F.; Pollastrini, M. Monitoring the effects of extreme drought events on forest health by Sentinel-2 imagery. J. Appl. Remote Sens. 2019, 13, 020501. [Google Scholar] [CrossRef]
- Nguyen, M.D.; Baez-Villanueva, O.M.; Bui, D.D.; Nguyen, P.T.; Ribbe, L. Harmonization of Landsat and Sentinel-2 for crop monitoring kin drought prone areas: Case studies of Ninh Thuan (Vietman) and Bekaa (Lebanon). Remote Sens. 2020, 12, 281. [Google Scholar] [CrossRef] [Green Version]
- Wieland, M.; Martinis, S. Large-scale surface water change observed by Sentinel-2 during the 2018 drought in Germany. Int. J. Remote Sens. 2020, 41, 4742–4756. [Google Scholar] [CrossRef]
- Varghese, D.; Radulović, M.; Stojković, S.; Crnojević, V. Reviewing the potential of Sentinel-2 in assessing the drought. Remote Sens. 2021, 13, 3355. [Google Scholar] [CrossRef]
- Benzougagh, B.; Meshram, S.G.; El Fellah, B.; Mastere, M.; Dridri, A.; Sadkaoui, D.; Mimich, K.; Khedler, K.M. Combined use of Sentinel-2 and Landsat-8 to monitor water surface area and evaluated drought risk severity using Google Earth Engine. Earth Sci. Inform. 2022, 15, 929–940. [Google Scholar] [CrossRef]
- Kowalski, K.; Okujeni, A.; Brell, M.; Hostert, P. Quantifying drought effects in Central European grasslands through regression-based unmixing of intra-annual Sentinel-2 time series. Remote Sens. Environ. 2022, 268, 112781. [Google Scholar] [CrossRef]
- Ngo, P.T.T.; Hoang, N.D.; Pradhan, B.; Nguyen, Q.K.; Tran, X.T.; Nguyen, Q.M.; Nguyen, V.N.; Samui, P.; Bui, D.T. A novel hybrid swarm optimized multilayer neural network for spatial prediction of flash floods in tropical areas using Sentinel-1 SAR imagery and geospatial data. Sensors 2018, 18, 3704. [Google Scholar] [CrossRef] [Green Version]
- Landuyt, L.; Van Coillie, F.M.B.; Vogels, B.; Dewelde, J.; Verhoest, N.E.C. Towards operational flood monitoring in Flanders using Sentinel-1. IEEE J. Sel. Top. Appl. Earth Obs. Remote Sens. 2021, 14, 11004–11018. [Google Scholar] [CrossRef]
- Harvey, M. Sentinel-1 InSAR captures 2019 catastrophic White Island eruption. J. Volcanol. Geotherm. Res. 2021, 411, 107124. [Google Scholar] [CrossRef]
- Ramirez, R.A. The application of interferometric synthetic aperture radar (InSAR) on damage area mapping: The case of the 2020 Taal Volcano eruption. In Proceedings of the 2021 IEEE International Geoscience and Remote Sensing Symposium (IGARSS), Brussels, Belgium, 11–16 July 2021. [Google Scholar]
- Qu, W.; Liu, B.; Zhang, Q.; Gao, Y.; Chen, H.; Wang, Q.; Hao, M. Sentinel-1 InSAR observations of co- and post-seismic deformation mechanisms of the 2016 Mw 5.9 Menyuan earthquake, Northwestern China. Adv. Space Res. 2021, 68, 1301–1317. [Google Scholar] [CrossRef]
- Abcede, E.L.; Ajesta, A.; Alfonso, J.D.; Nucup, R.J.; Peralta, M.; Ramirez, R. InSAR-based detection and mapping of seismically induced ground surface displacement and damage in Pampanga, Philippines. ASEAN Eng. J. 2022, 12, 1–10. [Google Scholar] [CrossRef]
- Dai, C.; Li, W.; Wang, D.; Lu, H.; Xu, Q.; Jian, J. Active landslide detection based on Sentinel-1 data and InSAR technology in Zhouqu County, Gansu Province, Northwest China. J. Earth Sci. 2021, 32, 1092–1103. [Google Scholar] [CrossRef]
- Tzouvaras, M. Statistical time-series analysis of interferometric coherence from Sentinel-1 sensors for landslide detection and early warning. Sensors 2021, 21, 6799. [Google Scholar] [CrossRef] [PubMed]
- Santangelo, M.; Cardinali, M.; Bucci, F.; Fiorucci, F.; Mondini, A.C. Exploring event landslide mapping using Sentinel-1 SAR backscatter products. Geomorphology 2022, 397, 108021. [Google Scholar] [CrossRef]
- Cao, J.; Gong, H.; Chen, B.; Shi, M.; Zhou, C.; Lei, K.; Yu, H.; Sun, Y. Land subsidence in Beijing’s sub-administrative center and its relationship with urban expansion inferred from Sentinel-1/2 observations. Can. J. Remote Sens. 2021, 47, 802–817. [Google Scholar] [CrossRef]
- Azarakhsh, Z.; Azadbakht, M.; Matkan, A. Estimation, modeling, and prediction of land subsidence using Sentinel-1 time series in Tehran-Shahriar plain: A machine learning-based investigation. Remote Sens. Appl.-Soc. Environ. 2022, 25, 100691. [Google Scholar] [CrossRef]
- Espiritu, K.W.; Reyes, C.J.; Benitez, T.M.; Tokita, R.C.; Galvez, L.J.; Ramirez, R. Sentinel-1 interferometric synthetic aperture radar (InSAR) reveals continued ground deformation in and around Metro Manila, Philippines, associated with groundwater exploitation. Nat. Hazards 2022, 114, 3139–3161. [Google Scholar] [CrossRef]
- Abdel-Hamid, A.; Dubovyk, O.; Graw, V.; Greve, K. Assessing the impact of drought stress on grasslands using multi-temporal SAR data of Sentinel-1: A case study in Eastern Cape, South Africa. Eur. J. Remote Sens. 2020, 53, 3–16. [Google Scholar] [CrossRef]
- Maleki, S.; Rahdari, V.; Soffianain, A. Drought impact detection on wetlands in the arid area using synthetic aperture radar data. Arab. J. Geosci. 2022, 15, 919. [Google Scholar] [CrossRef]
- Shorachi, M.; Kumar, V.; Steele-Dunne, S.C. Sentinel-1 SAR backscatter response to agricultural drought in The Netherlands. Remote Sens. 2022, 14, 2435. [Google Scholar] [CrossRef]
- Urban, M.; Berger, C.; Mudau, T.E.; Heckel, K.; Truckenbrodt, J.; Odipo, V.O.; Smit, I.P.J.; Schmullius, C. Surface moisture and vegetation cover analysis for drought monitoring in the southern Kruger National Park using Sentinel-1, Sentinel-2, and Landsat-8. Remote Sens. 2018, 10, 1482. [Google Scholar] [CrossRef] [Green Version]
- Ghazaryan, G.; Dubovyk, O.; Graw, V.; Kussul, N.; Schellberg, J. Local-scale agricultural drought monitoring with satellite-based multi-sensor time-series. GISci Remote Sens. 2020, 57, 704–718. [Google Scholar] [CrossRef]
- Makineci, H.B. Seasonal drought analysis of Akşehir Lake with temporal combined sentinel data between 2017 and 2021 spring and autumn. Environ. Monit. Assess. 2022, 194, 529. [Google Scholar] [CrossRef] [PubMed]
- International Disaster Database. Centre for Research on the Epidemiology of Disasters (CRED), Emergency Events Database (EM-DAT). Available online: https://www.cred.be/ (accessed on 27 May 2022).
- El Niño Wreaking Havoc in the Philippines. Asia Times. Available online: https://asiatimes.com/2019/03/el-nino-wreaking-havoc-in-the-philippines/ (accessed on 27 May 2022).
- Lucas, M.; Pabuayon, I. Risk perceptions, attitudes, and influential factors of rainfed lowland rice farmers in Ilocos Norte, Philippines. Asian J. Agric. Dev. 2011, 8, 61–78. [Google Scholar] [CrossRef]
- Laborte, A.G.; Van Ittersum, M.K.; Van den Berg, M.M. Multi-scale analysis of agricultural development: A modeling approach for Ilocos Norte, Philippines. Agric. Syst. 2007, 94, 862–873. [Google Scholar] [CrossRef]
- Galacgac, E.S.; Balicasan, C.M. Traditional weather forecasting for sustainable agroforestry practices in Ilocos Norte Province, Philippines. Ecol. Manag. 2009, 257, 2044–2053. [Google Scholar] [CrossRef]
- Drought, Pests Hit Parts of Ilocos Norte. Philippine News Agency. Available online: https://www.pna.gov.ph/articles/1116506 (accessed on 27 May 2022).
- McKee, T.B.; Doesken, N.J.; Kleist, J. The relationship of drought frequency and duration to time scales. In Proceedings of the Eight Conference on Applied Climatology, Anaheim, CA, USA, 17–22 January 1993. [Google Scholar]
- Vreugdenhil, M.; Navacchi, C.; Bauer-Marschallinger, B.; Hahn, S.; Steele-Dunne, S.; Pfeil, I.; Dorigo, W.; Wagner, W. Sentinel-1 cross ratio and vegetation optical depth: A comparison over Europe. Remote Sens. 2020, 12, 3404. [Google Scholar] [CrossRef]
- Baghdadi, N.; El Hajj, M.; Zribi, M.; Bousbih, S. Calibration of the water cloud model at C-band for winter crop fields and grasslands. Remote Sens. 2017, 9, 969. [Google Scholar] [CrossRef] [Green Version]
- Davidse, J. The Relation between the NDVI and Backscatter of Sentinel-1 for Sugarcane Monitoring (Case Study in South Africa); Internship Report GRS-70424; Wageningen University: Wageningen, The Netherlands, 2015. [Google Scholar]


| No. | Acquisition Date | Pass | No. | Acquisition Date | Pass |
|---|---|---|---|---|---|
| 1 | 28 January 2019 | Ascending | 13 | 23 January 2020 | Ascending |
| 2 | 21 February 2019 | Ascending | 14 | 28 February 2020 | Ascending |
| 3 | 17 March 2019 | Ascending | 15 | 23 March 2020 | Ascending |
| 4 | 27 April 2019 | Ascending | 16 | 28 April 2020 | Ascending |
| 5 | 28 May 2019 | Ascending | 17 | 22 May 2020 | Ascending |
| 6 | 21 June 2019 | Ascending | 18 | 27 June 2020 | Ascending |
| 7 | 27 July 2019 | Ascending | 19 | 21 July 2020 | Ascending |
| 8 | 20 August 2019 | Ascending | 20 | 16 August 2020 | Ascending |
| 9 | 25 September 2019 | Ascending | 21 | 19 September 2020 | Ascending |
| 10 | 31 October 2019 | Ascending | 22 | 25 October 2020 | Ascending |
| 11 | 24 November 2019 | Ascending | 23 | 30 November 2020 | Ascending |
| 12 | 30 December 2019 | Ascending | 24 | 24 December 2020 | Ascending |
| No. | Acquisition Date | No. | Acquisition Date | No. | Acquisition Date |
|---|---|---|---|---|---|
| 1 | 31 January 2019 | 9 | 13 September 2019 | 17 | 5 May 2020 |
| 2 | 25 February 2019 | 10 | 28 October 2019 | 18 | 29 June 2020 |
| 3 | 27 March 2019 | 11 | 22 November 2019 | 19 | 19 July 2020 |
| 4 | 26 April 2019 | 12 | 22 December 2019 | 20 | 18 August 2020 |
| 5 | 1 May 2019 | 13 | 31 January 2020 | 21 | 17 September 2020 |
| 6 | 20 June 2019 | 14 | 20 February 2020 | 22 | 2 October 2020 |
| 7 | 5 July 2019 | 15 | 21 March 2020 | 23 | 21 November 2020 |
| 8 | 29 August 2019 | 16 | 20 April 2020 | 24 | 11 December 2020 |
| Anomaly | Range of SPI Values | Precipitation Regimes |
|---|---|---|
| Positive | 2 < SPI ≤ Max 1.5 < SPI ≤ 2 1 < SPI ≤ 1.5 | Extremely wet Very wet Moderately wet |
| None | −1 < SPI ≤ 1 | Normal precipitation |
| Negative | −1.5 < SPI ≤ −1 −2 < SPI ≤ −1.5 Min < SPI ≤ −2 | Moderately dry Very dry Extremely dry |
| Area of Interest | R2 | |
|---|---|---|
| VV Polarization | VH Polarization | |
| Croplands | 0.6414 | 0.7170 |
| Mountainside grasslands | 0.6123 | 0.7336 |
| Low-lying grasslands | 0.6224 | 0.6806 |
| Drought Indices Correlation | Area of Interest | R2 | |
|---|---|---|---|
| VV | VH | ||
| Backscatter intensity vs. SPI | Croplands | 0.5160 | 0.3162 |
| Mountainside grasslands | 0.0006 | 0.0006 | |
| Low-lying grasslands | 0.0024 | 0.0004 | |
| Backscatter intensity vs. KBDI | Croplands | 0.6301 | 0.5600 |
| Mountainside grasslands | 0.0012 | 0.0025 | |
| Low-lying grasslands | 0.305 | 0.0105 | |
| SPI vs. NDVI | Croplands | 0.4701 | |
| Mountainside grasslands | 0.0006 | ||
| Low-lying grasslands | 0.0053 | ||
| KBDI vs. NDVI | Croplands | 0.7066 | |
| Mountainside grasslands | 0.0105 | ||
| Low-lying grasslands | 0.0035 | ||
| SPI vs. KBDI | - | 0.5542 | |
Disclaimer/Publisher’s Note: The statements, opinions and data contained in all publications are solely those of the individual author(s) and contributor(s) and not of MDPI and/or the editor(s). MDPI and/or the editor(s) disclaim responsibility for any injury to people or property resulting from any ideas, methods, instructions or products referred to in the content. |
© 2023 by the authors. Licensee MDPI, Basel, Switzerland. This article is an open access article distributed under the terms and conditions of the Creative Commons Attribution (CC BY) license (https://creativecommons.org/licenses/by/4.0/).
Share and Cite
Alonzo, C.A.; Galabay, J.M.; Macatangay, M.N.; Magpayo, M.B.; Ramirez, R. Drought Risk Assessment and Monitoring of Ilocos Norte Province in the Philippines Using Satellite Remote Sensing and Meteorological Data. AgriEngineering 2023, 5, 720-739. https://doi.org/10.3390/agriengineering5020045
Alonzo CA, Galabay JM, Macatangay MN, Magpayo MB, Ramirez R. Drought Risk Assessment and Monitoring of Ilocos Norte Province in the Philippines Using Satellite Remote Sensing and Meteorological Data. AgriEngineering. 2023; 5(2):720-739. https://doi.org/10.3390/agriengineering5020045
Chicago/Turabian StyleAlonzo, Christian Albert, Joanna Mae Galabay, Margadrew Nicole Macatangay, Mark Brianne Magpayo, and Ryan Ramirez. 2023. "Drought Risk Assessment and Monitoring of Ilocos Norte Province in the Philippines Using Satellite Remote Sensing and Meteorological Data" AgriEngineering 5, no. 2: 720-739. https://doi.org/10.3390/agriengineering5020045