Technical Note

Evaluation of Ultrasonic Sensor for Precision Liquid Volume Measurement in Narrow Tubes and Pipes

Department of Agricultural and Biosystems Engineering, Iowa State University, Ames, IA 50011, USA
*
Author to whom correspondence should be addressed.
AgriEngineering 2023, 5(1), 287-298; https://doi.org/10.3390/agriengineering5010019
Submission received: 30 November 2022 / Revised: 24 January 2023 / Accepted: 27 January 2023 / Published: 1 February 2023
(This article belongs to the Special Issue Sensors and Actuators for Crops and Livestock Farming)

Abstract

:
The introduction of computer vision and machine learning into agricultural systems has produced significant new opportunities for high precision application of liquid products in both grain and livestock agriculture. These technologies, which enable liquid application in site-specific, non-broadcast applications, are driving new evaluations of nozzle technologies which apply a consistent dose of liquid product in a non-conventional manner compared to historic perceptions. This field of innovation is driving the need for improved high-capacity systems for evaluating nozzle performance in high-precision applications. Historically, patternator tables with volumetric measurements of total applied liquid have served as the standard for fluid nozzle evaluation. These volumetric measurements are based on measuring the displaced distance of liquid over a defined time to determine flow rate. However, current distance sensors present challenges for achieving small-volume measurements and enabling automation at a scale necessary to meet innovation demands of high-precision nozzle systems. A novel concept for high speed and automated measurement of a high precision patternator table was developed using an ultrasonic sensor and a carefully designed liquid retainment system to maximize measurement precision. The performance of this system was quantified by comparing calibrations and performance across different vessels for volume measurement (tubes and pipes) used in the application of a nozzle patternator. A total of three square tubes (15.9, 22.3, 31.0 mm widths) and three pipes (25.2, 27.0, 35.1 mm diameters) were evaluated, with the 27 mm pipe matching the ultrasonic sensor’s rating. All calibrations were successful, depicting linear characteristics with R2 > 0.99. The smallest pipe presented issues for the sensor to measure in post-calibration and was thus not evaluated further. The residual values from operational performance highlight that the 25.2 mm tube and the 27.0 mm pipe are highly accurate with no indication of bias or non-normality. The relative uncertainty ranges from 2.9 to 42% (350 mL to 25 mL) depending on the tube and pipe cross-sectional diameter or width with the sensor accuracy and uncertainty in the tube and pipe area being the largest factors. The results of this study indicate that the 25.2 mm tube and the 27.0 mm pipe could be excellent options for autonomous liquid volume measurement with the ultrasonic sensor. A key challenge identified in this study is that the assumptions in the sensor’s intrinsic calibration are violated with the tubes and pipes evaluated.

1. Introduction

The autonomous measurement of liquid volume has multiple applications in the fields of precision agriculture and precision livestock farming, both in operations and development of new technologies. Such technologies could include water intake monitoring in livestock, sprayer nozzle analysis, and chemical tank level monitoring [1,2,3,4]. Of particular interest is the liquid volume measurement for sprayer nozzle patternator tables. These tables measure the lateral pattern of a sprayer nozzle in the direction of travel, which is a crucial component of plant protection in chemical application [5,6]. Historical versions of such tables rely on manual volume measurement with low pattern resolution from 50 to 25 mm of width [3,5,7]. While there have been versions of spray tables utilizing automated mass measurement to determine spay pattern and flow, the implementation of higher resolution tables presents costs and implementation challenges [8]. Increasing the patternator’s resolution results in added need for automatic volume measurement, as each segment of the resolution must be measured, with lower volumes in each resolution. A measurement application with the ability to measure the volume of the liquid has the best implementation potential for a high-resolution patternator.
Accurately measuring the volume of a liquid in a container can be achieved by measuring the liquid level in a container with a known cross-sectional area. It is common to utilize level-measurement techniques such as mechanical floats, electrical methods, or non-contact measurement, with ultrasonic sensors being the preferred option [9,10]. Ultrasonic sensors are the preferred noncontact sensor as the frequency spectrum of the ultrasonic signal is highly reflective off the surface of a liquid and will minimize measurement errors that could occur with sensor frequencies that penetrate the air–liquid boundary [9,10]. Ultrasonics offer the ability to sense liquids without the use of physical objects as a float; however, the sensing pattern of an ultrasonic can present challenges due to the size of the pattern and the fact that if multiple objects are introduced in the sensing cone, errors occur [11]. The additional downside of ultrasonics is what is referred to as the “Dead Zone”, which is an area immediately in front of the sensor face where detection is impossible [10]. Lasers are unable to sense liquid surfaces with shallow heights as the laser wavelength will penetrate the liquid surface and reflect off the bottom of the measurement vessel, due to the low reflectivity of water [9,12]. The ultrasonic option carries much less risk for unpredictable errors as it is naturally capable of sensing liquid surfaces and is the preferred liquid level measurement option.
For the highest accuracy possible when utilizing a sensor, the calibration process must be completed and evaluated against the system requirements for the sensor. The process of calibrating a sensor commonly references two main factors that relate to sensor performance, intrinsic, and extrinsic factors, and thus intrinsic and extrinsic calibrations [13,14]. Intrinsic factors are factors relating to the sensor itself (materials, lenses, etc.) and how that impacts its measurement [13]. It is common for sensors to be intrinsically calibrated by the manufacturer for basic installations [14]. Extrinsic factors are those related to how the sensor is deployed in the applications and how those factors impact the sensor’s measurements [13,14]. The process of extrinsic calibration is the most successful at removing errors when performed under the similar conditions the sensor will perform in the application [10,14,15,16,17]. This process is also referred to as a static calibration, where the sensor’s output is measured in respect to known or “true” values [18]. These true measurements are determined based on the specific sensor and application being evaluated. Thus, without accurate calibration prior to operation of a sensor in any given application, unknown errors will exist in the measurement system, reducing the accuracy and precision on the system.
In the quest for the development of high accuracy and high throughput measurement of liquid volumes in a nozzle patternator table, an evaluation of an ultrasonic sensor was undertaken with the overall goal of evaluating the ability to sense in narrow tubes and pipes that are smaller than the specified rating by the manufacturer and select which tubes and pipes may be best suited for liquid volume sensing. The following objectives were derived to achieve this goal and to test the hypothesis according to which the selected ultrasonic sensor would perform differently in various sizes of tubes and pipes: (1) to develop calibration curves for the same ultrasonic sensor across various narrow tubes and pipes selected and compare them to the curve for the pipe in the manufacturer’s specifications, (2) to evaluate the calibration curves on an operational set of data, and (3) to quantify the uncertainty associated with each tube and pipe; to ultimately identify the highest accuracy and precision option for use with the ultrasonic sensor.

2. Materials and Methods

2.1. Experimental Set-Up and Instrumentation

A combination of three unique diameter round pipes and three unique square tubing sizes (Figure 1, Table 1) were evaluated in this study. Pipe B is the diameter stated in the manufacturer’s specification for the ultrasonic sensor and serves as the control in each test for comparison. The additional pipes were selected due to commercial availability and were one size larger and smaller than Pipe B. Each tube and pipe was prepared by cutting a 610 mm section, sealing one end of the pipe or tube. Initial attempts to calibrate the sensor by adding water through the open end of each tube and pipe presented significant issues with non-typical sensor response caused by condensation on the pipe and tube walls. Due to this, all experiments were completed by adding water through the bottom of the tubes and pipes through a secondary tube.
A plastic hose barb to NPT threads 6 mm, 90° fitting was installed in the sealed end by drilling a 11 mm hole and threading the fitting with liquid thread sealant, Figure 1a. This was performed on all six experimental units to provide identical conditions in the bottom of the units. The water was added through the bottom of the tube, as the water droplets created by pouring water through the top of the tube or pipe created sensor errors in reading. Each tube and pipe were individually attached to a support structure to hold it upright, Figure 1b. A clear, flexible hose, 600 mm length minimum, was attached to the barb fitting and a 60 mL disposable syringe was installed on the other end of the hose.
The ultrasonic sensor (UM30-213113, SICK, Inc., Waldkirch, Germany) was installed with a mounting bracket such that the face of the sensor was 15 mm above the end of the tube or pipe when taking measurements. This specific ultrasonic sensor was selected as the manufacturer claimed a viewing pattern suitable for a 27 mm diameter pipe. The same sensor was utilized for collecting data for all tubes and pipes. The analog voltage output of the sensor was measured using a digital storage oscilloscope (DSO, Model 2510, BK Precision, Yorba Linda, CA, USA). This analog signal is preconditioned to the range specified by the manufacturer (200 mm to 1300 mm) During all tests, the sensor was sampled at 2 Hz, with the DSO recording the instantaneous voltage reading and time stamp for each sample.

2.2. Data Collection Procedures

2.2.1. Calibration Data

Data were collected using the following procedures to perform a static calibration of the sensor for each tube and pipe. Static calibration is the process of regressing sensor measurements against known “true” values [18]. The liquid volume was added in set intervals to the pipe or tube to serve as the “true” standard to calibrate the sensor to. Water was measured in a 100 mL, ±1 mL, graduated cylinder. The specified volume was poured into the flexible tubing by using a funnel. The funnel was removed from the tubing and a 60 mL syringe full of air was attached to the tubing. Air was pushed into the tubing until all water was pushed into the tube or pipe, with a visual indication of no water in the flexible tubing. Prior to any measurements, increments of 10 mL were added until the water levels were above the fitting in the bottom of each pipe or tube to give the ultrasonic sensor a flat-water surface to read. During the calibration, water was added in 15 mL increments until the water level entered the ultrasonic sensor’s no-read zone (200 mm from the face of the sensor). Regardless of tube or pipe size, the same volumetric increments were utilized for the calibration and 15 mL was selected such that the smallest tube would have a minimum of a five-point calibration curve. Data were recorded for 45 s at 2 Hz starting at five seconds.
After, all the water was pushed out of the flexible tubing with the DSO. The statistical analysis will be discussed in later sections.

2.2.2. Operational Performance

Following the previously mentioned data collection procedure for data recording and adding water to each tube, each tube and pipe was evaluated for operational performance. This was completed by measuring the baseline level of the tube then adding a known volume of water, starting at 25 mL, and increasing in 25 mL increments up to the limit of the calibration. Between each measurement of a known volume of water, the tube was emptied back to the base level of water and a base level reading was recorded. The aforementioned calibration equations were applied to the data collected. The residual value of the prediction was calculated.

2.3. Data Processing and Analysis

Data processing was completed in Python using a PyCharm IDE for software development [19]. For the calibration data points, a randomly initiated, consecutive 30 s sample (n = 60) was averaged from each 45 s recorded sample. The change in the sensor’s voltage was calculated as the average of the base reading minus the calibration increment’s average reading. The change of height of water was calculated using the known total volume from the graduated cylinder at each calibration increment and the cross-sectional area which was determined based on the manufacturer’s specification of the inside width or diameter, see Table 1, for the respective pipe or tube and using standard geometric equations for the volume of a cylinder or rectangular prism. Linear regression coefficients were determined using the Scikit Learn package within Python [20]. This was achieved by fitting the change in height of the water as the independent variable (y-axis) and the change in voltage reading as the dependent variable (x-axis) [18].
The root mean square error (RMSE) of the calibration, standard error (SE) of the regression and of the calibration were calculated; the SE of the calibration was calculated by dividing the SE of the regression by the slope of the regression. The calibrated height of fluid was calculated from the change of voltage using the inverse of the previously described calibration equation (Equation (1)), [18]. The slope coefficients were compared using analysis of covariance (ANCOVA) in statistical software [21] to test whether the slopes of the calibrations were statistically different.
h ^ = b v p r e v p o s t + a
where
  • h ^ = calibrated height difference in tube (mm)
  • v p r e = voltage measurement pre-volume (VDC)
  • v p o s t = voltage measurement post-volume (VDC)
  • b = slope coefficient
  • a = intercept coefficient
The calibration equation for each tube or pipe previously discussed was applied to the operational performance data. The volume calculation was determined by multiplying the calibrated height by the cross-sectional area for the respective tube or pipe, as seen in Equation (2). The residuals were calculated as the predicted height minus the known height (calculated from the volume added). The average residuals were calculated by tube and pipe. A residual plot, known height from volume (x axis), and residual value (y axis) was created to visualize trends in residuals from each tube/pipe.
V = C S A b v p r e v p o s t + a 1000
where
  • V = Calculated volume (mL)

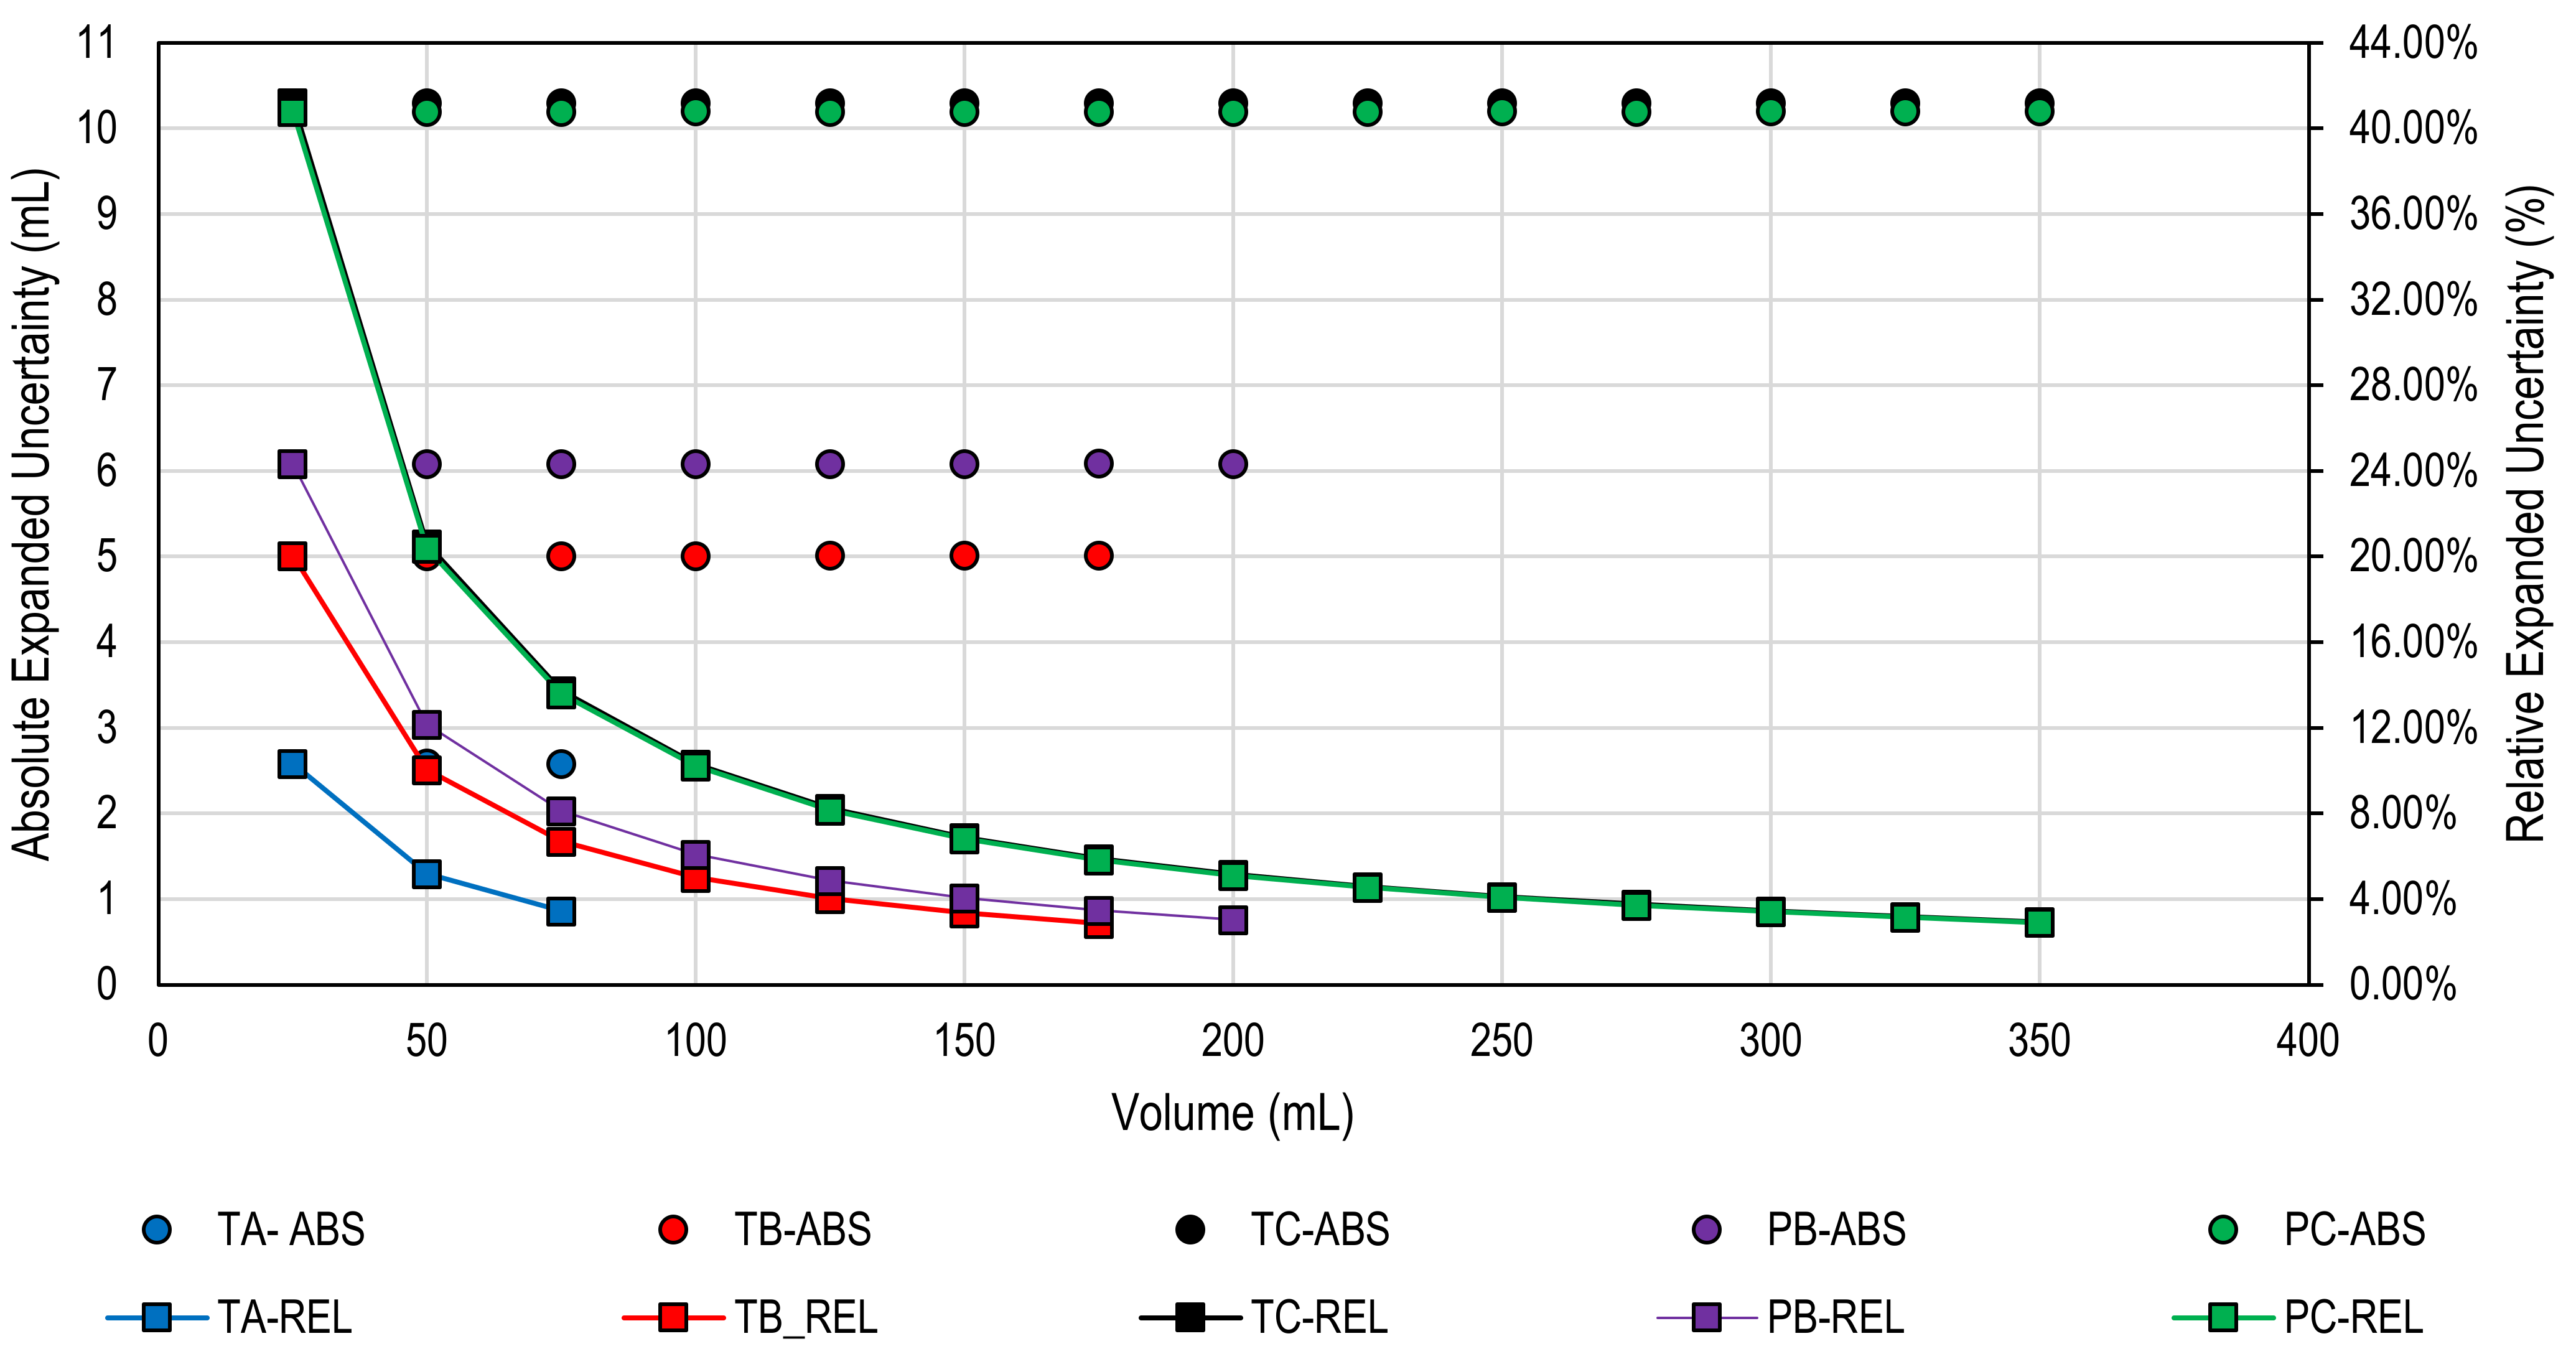
2.4. Uncertainty Analysis

The final standard uncertainty of the volume measurement was calculated from the standard uncertainty obtained from the ultrasonic measurement and the cross-sectional area of the tube or pipe by propagating both through the respective volume equation. A zeroth-ordered uncertainty budget was created for input ultrasonic measurement pre Dpre and post Dpost addition of the liquid and the cross-sectional area CSAT/P, which included the sensor manufacturer’s accuracy and long-term stability and quantization error from the DSO (Table 2) and the standard error (SE) from the experimental data (operational performance), the SE was removed from the table as it changes with each experiment [22]. The standard uncertainty Δdi of the tube width or pipe diameter was determined as one half the reading scale set by the manufacturer’s tolerance of the inside width or diameter (see Table 1 for manufacturer’s information), Table 3. The combined standard uncertainty in the cross-sectional area was calculated by Equation (3), the methodology is based on the component error analysis [18]. The operation data set for each tube and pipe, excluding P-A, were used to calculate the uncertainty. The combined standard uncertainty in the volume was calculated using Equation (4) [18].
Δ A i 2 = A d i Δ d i   2
where
  • Δ A i = combined standard uncertainty in cross-sectional area (CSA) tube or pipe.
Table 2. Zeroth order uncertainty budget for the ultrasonic sensor (UM30-213113, SICK, Inc., Waldkirch, Germany).
SourceValueProbability DistributionDivisorStandard Uncertainty
Accuracy [a]0.1 V (11 mm)Rectangular√30.058
Repeatability1.53 × 10−2 V (0.18 mm)Rectangular√38.8 × 10⁻³
Quantization Error [b]0.06 VRectangular√33.46 × 10⁻²
Combined Standard sensor uncertainty, Δvpre, Δvpost 6.79 × 10⁻²
[a] Manufacturer stated accuracy 1% assumed to be full-scale accuracy. [b] Manufacturer stated accuracy of DSO analog voltage input.
Table 3. Standard uncertainty of the width and diameter and resulting cross-sectional area of the tubes and pipes. See Table 1 for manufacturer’s information from which the inside width or diameter was collected as well as the respective tolerance of the measurement.
Tube/PipeStandard Uncertainty of the Width/Diameter (Δdi, mm)Standard Uncertainty of the Cross-Sectional Area (ΔAi, mm2)
T-A0.1270.254
T-B0.1910.381
T-C0.2540.508
P-B0.050.314
P-C0.1270.798
Δ V 2 = V A i Δ A i   2 + V v p r e Δ v p r e   2 + V v p o s t Δ v p o s t   2 + R M S E 2
where
  • ΔV2 = combined standard uncertainty volume
  • RMSE = root mean square error of the calibration (Equation (1))

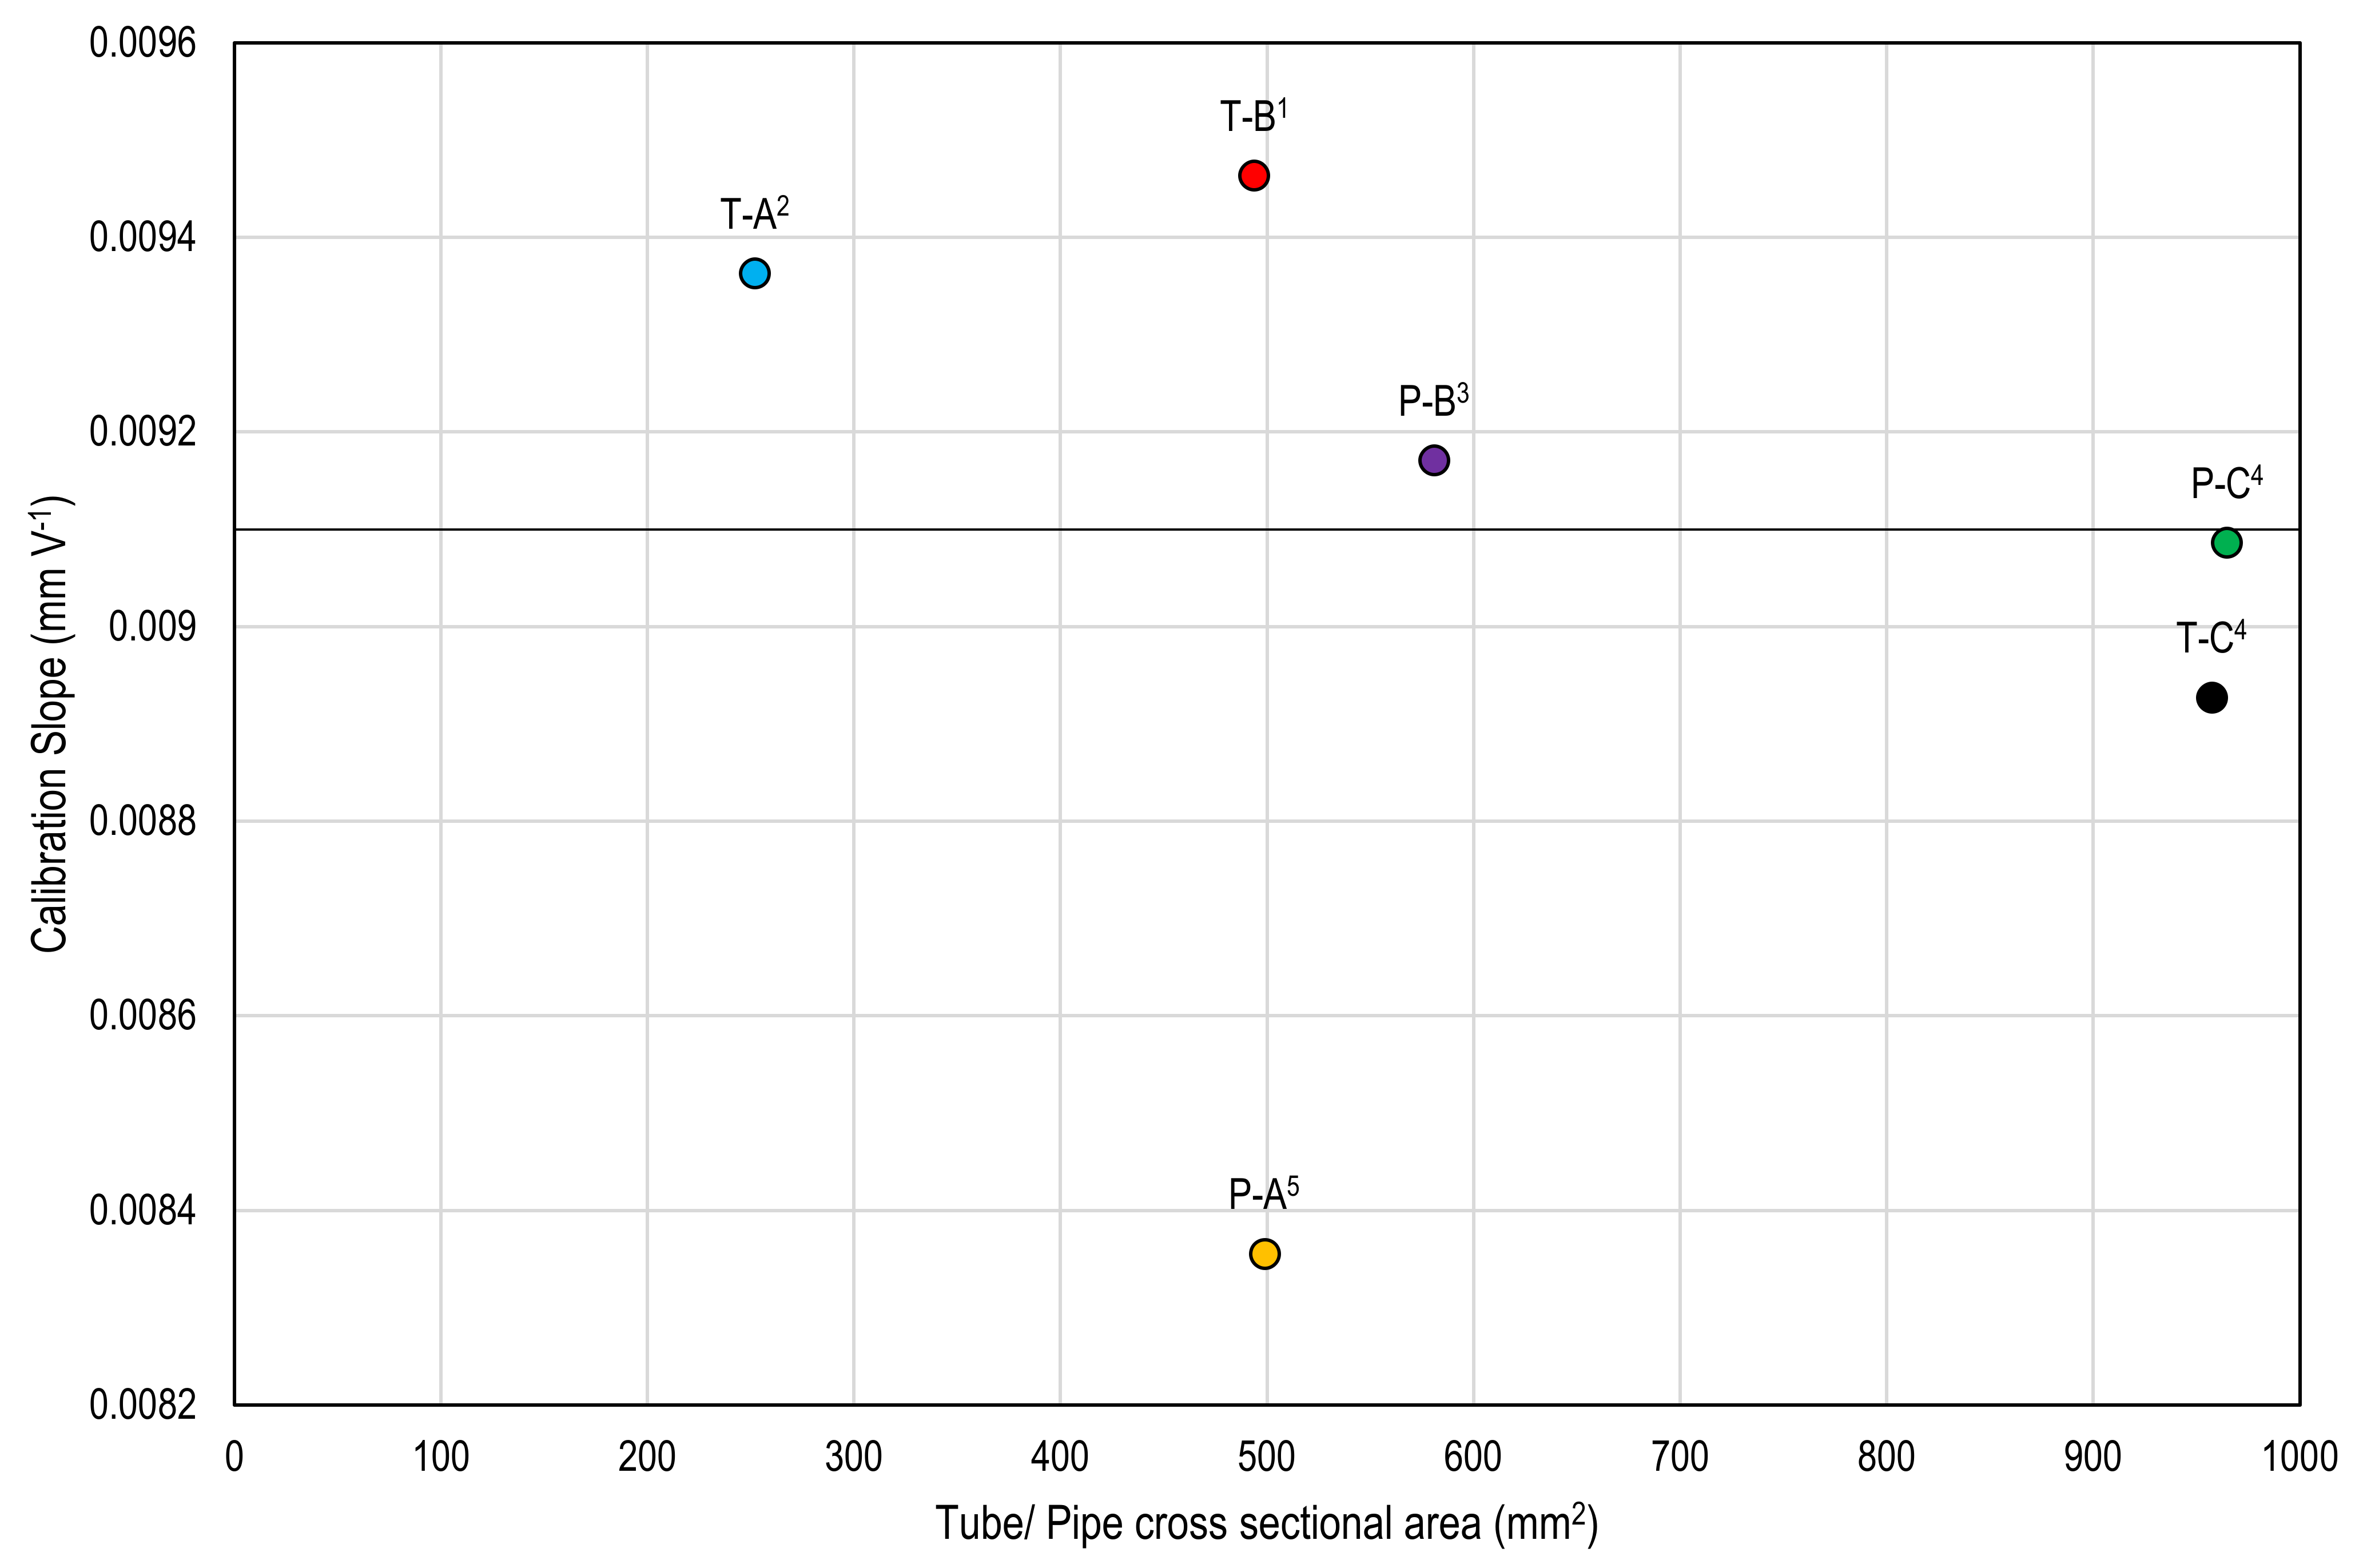
3. Results and Discussion

The calibration of all tubes and pipes were successful with all combinations showing a linear response, as seen in Figure 2 and Table 4. All pipes and tubes tested resulted in linear characteristics in relationship to the distance to the water surface, which is expected for intrinsically calibrated ultrasonic sensors [10]. The ANCOVA analysis showed that the slopes of the six linear regressions were significantly different, p < 0.05 as seen in Figure 3. The only pair of calibration that were not significantly different was the T-C and P-C p = 0.11, which notably have very similar CSA values. As all regression slopes were significantly different than P-B, the pipe for which the sensor is rated for, this demonstrates that the extrinsic factors under which an ultrasonic sensor is expected to perform can have a significant impact on the sensor’s response. This result support the justification for performing static calibrations of the ultrasonic sensor under operational conditions with each tube or pipe, which is a suggested practice for such ultrasonic sensors [10,16,18]. Based on the calibration data, the P-A is advisably not a well-suited vessel for liquid volume measurement using the ultrasonic sensor approach due to the farthest linear regression values from the sensor manufacturer’s calibration. The P-B and P-C have calibrations that are closest in values to the sensor manufacturer’s specifications, and thus have an advantage for liquid volume measurement. Similar studies have shown the use of ultrasonic sensors to be well fitted and accurate for the liquid level in similar type of containers, though with much larger diameters relative to the sensors’ cone pattern [4].
The operational performance data show how well the calibration, described previously, can be applied to new data for each tube and pipe, as seen in Figure 4. The exception was P-A, which was excluded due to catastrophic issues with the ultrasonic sensor failing to read any distances in the pipe. This is likely an issue with the sensor’s cone angle interacting with the geometry of the pipe to cause errors in the sensor’s readings resulting in the failure to measure. As the sensor is not rated for such diameter of pipe, it can be assumed that this interaction is not accounted for in the sensor’s intrinsic calibration.
Based on the average residual value, T-B is the top performing option with no bias or non-normality noted in the residuals, while P-B has a slightly higher average residual value with no bias or non-normality observed. The other options exhibit some type of pattern or abnormality in the residuals that raise concerns about their operational performance.
Based on the results of the calibration and the operational performance, it is evident that the use of this ultrasonic distance sensor in conjunction with tubes or pipes that are narrower than its cone angle violates some type of assumption in the intrinsic calibration conducted by the manufacturer and used to produce the sensor’s analog output. Such ultrasonic sensors require an intrinsic calibration for the preconditioning of the analog signal [16]. These results show that while the sensor worked well in the 27 mm pipe, it stills requires a calibration in the installed environment to maximize accuracy.
The relative expanded (coverage factor = 2; ~95% confidence level) uncertainty ranged from 10.2 to 10.5 mL depending on the tube/pipe for volumes ranging from 350 to 25 mL, respectively, as seen in Figure 5. Two major factors were identified as contributing the majority of the uncertainty: sensor accuracy and uncertainty in CSA. The sensor accuracy is equivalent to ± 11 mm of measurement, which is determined via the intrinsic calibration. Without selecting a different sensor or evaluating over-sampling methods, this source of uncertainty cannot feasibly be reduced in the system. The uncertainty in CSA increases with area linearly due to the tolerances from the pipe and tube manufacturers as the tolerances were inconsistent between manufacturers. Thus, the larger the tube or pipe, the large the uncertainty in the measurements. Addressing the CSA uncertainty in the future is the only feasible option for reducing the uncertainty in measurement. Utilizing a higher tolerance pipe or tubing would be the best approach. However, the overall holding capacity must be factored in as it will impact the system performance overall.

4. Conclusions

An ultrasonic distance sensor was calibrated for water level sensing to three square tubes and three pipes ranging from larger to smaller than the pipe the sensor manufacturer rated it for in the end use of water volume measuring. While all calibrations were successful showing linear characteristics and had high R2 values (R2 > 0.999), P-A (25.2 mm, smaller than rated size of 27 mm) had the slope that was farthest from the sensor manufacturer’s specifications. This pipe also created significant issues for the sensor to read distances in following the calibration data collection and thus was not tested further. The operational performance of the sensor indicated that T-B and P-B had the highest accuracy based on the resulting residuals. The calibration and operational performance data indicate that using these vessels that are narrower than the sensor’s cone angle violate assumptions in its intrinsic calibration that are resulting in the varying results noted here. This is likely due to the fact that the tubes and pipes created different extrinsic factors that lead to the errors noted. These calibration and operational performance results support the need to extrinsically calibrate an ultrasonic distance sensor. The relative uncertainty ranges from 2.9 to 42%, depending on the tube or pipe across a volume range of 350–25 mL. The largest factors impacting the uncertainty are the sensor accuracy and the CSA uncertainty. The larger the tube or pipe, the higher the uncertainty in the volume. Based on the results of this study, the top options for liquid volume measurement with the specific ultrasonic sensor used in this study are T-B (22.23 mm width smaller than the rated 27 mm pipe) and P-B (27 mm, same as the sensor manufacturer’s rating). The use of a different ultrasonic distance sensor would require a re-evaluation of all tubes and pipes tested as it would most likely have different extrinsic factors than the sensor used in this study.

Author Contributions

Conceptualization, B.C.S., R.W.B. and M.J.D.; methodology, B.C.S.; software, B.C.S.; validation, B.C.S.; formal analysis, B.C.S.; resources, M.J.D.; writing—original draft preparation, B.C.S.; writing—review and editing, B.C.S., R.W.B. and M.J.D.; supervision, R.W.B.; project administration, M.J.D.; funding acquisition, M.J.D. All authors have read and agreed to the published version of the manuscript.

Funding

This research received no external funding.

Data Availability Statement

Not applicable.

Acknowledgments

The authors would like to thank Cole Schafer for assistance with the construction of the experimental set-up, data collection, and developing digital visualizations of the experimental set-up.

Conflicts of Interest

The authors declare no conflict of interest.

References

  1. Gil, E.; Badiola, J. Design and Verification of a Portable Vertical Patternator for Vineyard Sprayer Calibration. Appl. Eng. Agric. 2007, 23, 35–42. [Google Scholar] [CrossRef]
  2. Oliveira, J.L.D. Behavior, Welfare, Production and Bioenergetics of Laying Hens in Alternative Housing Systems. Ph.D. Thesis, Iowa State University, Ames, IA, USA, 2019. [Google Scholar]
  3. Azimi, A.H.; Carpenter, T.G.; Reichard, D.L. Nozzle Spray Distribution for Pesticide Application. Trans. ASAE 1985, 28, 1410–1414. [Google Scholar] [CrossRef]
  4. Fisher, D.K.; Sui, R. An Inexpensive Open-Source Ultrasonic Sensing System for Monitoring Liquid Levels. Agric. Eng. Int. CIGR J. 2013, 15, 328–334. [Google Scholar]
  5. Krishnan, P.; Williams, T.H.; Kemble, L.J. Spray Pattern Displacement Measurement Technique for Agricultural Nozzles Using Spray Table. Trans. ASAE 1988, 31, 0386–0389. [Google Scholar] [CrossRef]
  6. Balasundram, S.K.; Golhani, K.; Shamshiri, R.R.; Vadamalai, G. Precision Agriculture Technologies for Management of Plant Diseases. In Plant Disease Management Strategies for Sustainable Agriculture through Traditional and Modern Approaches; Sustainability in Plant and Crop Protection; Ul Haq, I., Ijaz, S., Eds.; Springer International Publishing: Cham, Switzerland, 2020; pp. 259–278. ISBN 978-3-030-35955-3. [Google Scholar]
  7. ISO: 5682-1:2017; Equipment for Crop Protection Spraying—Equipment Part 1: Test Methods for Sprayer Nozzles. ISO: Geneva, Switzerland, 2017.
  8. Carpenter, T.G.; Reichard, D.L.; Ozkan, H.E.; Holmes, R.G.; Thornton, E. Computerized Weighing System for Analyses of Nozzle Spray Distribution. Trans. ASAE 1988, 31, 0375–0379. [Google Scholar] [CrossRef]
  9. Johnson, C.D. Process Control Instrumentation Technology, 7th ed.; Prentice Hall: Columbus, OH, USA, 2003; ISBN 0-13-060248-5. [Google Scholar]
  10. Kelemen, M.; Virgala, I.; Kelemenová, T.; Miková, Ľ.; Frankovský, P.; Lipták, T.; Lörinc, M. Distance Measurement via Using of Ultrasonic Sensor. J. Autom. Control 2015, 3, 71–74. [Google Scholar]
  11. Hauptmann, P.; Hoppe, N.; Püttmer, A. Application of Ultrasonic Sensors in the Process Industry. Meas. Sci. Technol. 2002, 13, R73–R83. [Google Scholar] [CrossRef]
  12. Paul, J.D.; Buytaert, W.; Sah, N. A Technical Evaluation of Lidar-Based Measurement of River Water Levels. Water Resour. Res. 2020, 56, e2019WR026810. [Google Scholar] [CrossRef]
  13. Mirzaei, F.M. Extrinsic and Intrinsic Sensor Calibration. Ph.D. Thesis, University of Minnesota, Minneapolis, MN, USA, 2013. [Google Scholar]
  14. Yeong, D.J.; Velasco-Hernandez, G.; Barry, J.; Walsh, J. Sensor and Sensor Fusion Technology in Autonomous Vehicles: A Review. Sensors 2021, 21, 2140. [Google Scholar] [CrossRef] [PubMed]
  15. Beltrán, J.; Guindel, C.; de la Escalera, A.; García, F. Automatic Extrinsic Calibration Method for LiDAR and Camera Sensor Setups. IEEE Trans. Intell. Transp. Syst. 2022, 23, 17677–17689. [Google Scholar] [CrossRef]
  16. Cao, M.; Si, X.; Zhang, H.; Ma, F.; Ji, P.; Yao, H. Calibration of Ultrasonic Transducer Based on Ultrasonic Logging Instrument for Shaft Sinking. Sensors 2022, 22, 6867. [Google Scholar] [CrossRef] [PubMed]
  17. Yatsyshyn, S.; Nazarkevych, I.; Mastylo, R. Calibration of the Ultrasonic Sensor-Range Finder by the Laser Interferometer. Meas. Equip. Metrol. 2020, 81, 10–17. [Google Scholar] [CrossRef]
  18. Doebelin, E.O. Measurement Systems: Application and Design, 5th ed.; McGraw-Hill: New York, NY, USA, 2004; ISBN 0-07-243886-X. [Google Scholar]
  19. JetBrains. PyCharm 2022.1.2 [Computer Software]; JetBrains: Prague, Czech Republic, 2022. [Google Scholar]
  20. Pedregosa, F.; Varoquaux, G.; Gramfort, A.; Michel, V.; Thirion, B.; Grisel, O.; Blondel, M.; Prettenhofer, P.; Weiss, R.; Dubourg, V.; et al. Scikit-Learn: Machine Learning in Python. J. Mach. Learn. Res. 2011, 12, 2825–2830. [Google Scholar]
  21. SAS. JMP 2022 [Computer Software]; SAS: Cary, NC, USA, 2022. [Google Scholar]
  22. Gates, R.S.; Casey, K.D.; Xin, H.; Burns, R.T. Building Emissions Uncertainty Estimates. Trans. ASABE 2009, 52, 1345–1351. [Google Scholar] [CrossRef] [Green Version]
Figure 1. (1a) Experimental set-up sketch, (1b) picture of experimental set-up with (A) DSO and (B) ultrasonic sensor. All tubes and pipes are labeled with specifications provided in Table 1.
Agriengineering 05 00019 g001
Figure 2. Linear regression of height of water added (x axis) vs. change in voltage from the sensor (y axis) of each tube and pipe. The black line represents the manufacturer’s calibration values.
Agriengineering 05 00019 g002
Figure 3. Cross-section area of tube/pipe (x axis) versus the calibration slope (y axis). Points not connected by the same letter are statistically significant, p < 0.05. The black line represents the manufacturer’s provided slope.
Agriengineering 05 00019 g003
Figure 4. Residual values from the operational performance data set.
Agriengineering 05 00019 g004
Figure 5. Absolute and relative uncertainty associated with the liquid volume measurements from each tube and pipe from the operational performance data.
Agriengineering 05 00019 g005
Table 1. Tubes and pipes selected to evaluate the ultrasonic sensor on.
Tube (T)/Pipe (P)Inside Width/Diameter
(mm)
Cross Sectional Area (CSA; mm2)Model, Manufacturer
T-A15.88252.028516K35, Evonik CY RO LLC, Parsippany, NJ, USA
T-B22.23493.958516K37, Evonik CY RO LLC, Parsippany, NJ, USA
T-C30.96957.6685095K76, Westlake Compounds LLC, Houston, TX, USA
P-A25.20498.7648925K93, McMaster-Carr, Elmhurst, IL, USA
P-B27.00581.072809N18, McMaster-Carr, Elmhurst, IL, USA
P-C35.05964.9748925K94, McMaster-Carr, Elmhurst, IL, USA
Table 4. Calibration statistics, all the curves’ R2 was >0.999.
Tube/PipeRMSE (V)SE of the Regression (V)SE of the Calibration (mm)
T-A1.14×10−21.40×10−21.50
T-B9.52×10−31.04×10−21.10
T-C6.92×10−37.21×10−30.60
P-A5.61×10−36.06×10−30.73
P-B7.67×10−37.96×10−30.87
P-C6.92×10−35.46×10−30.60
Disclaimer/Publisher’s Note: The statements, opinions and data contained in all publications are solely those of the individual author(s) and contributor(s) and not of MDPI and/or the editor(s). MDPI and/or the editor(s) disclaim responsibility for any injury to people or property resulting from any ideas, methods, instructions or products referred to in the content.

