1. Introduction
In modern agricultural management strategies, especially in precision-agriculture (PA) systems, sowing is one of the key factors influencing crop establishment and yield. Usually, before sowing, various tillage methods and types of machinery are used to prepare the soil, according to soil characteristics, farming techniques and crop needs, to destroy weeds and pests and improve the structural conditions of the arable layer, so as to maximize the efficiency of seed planters, and enhance seed germination and the growth of seedling roots. In the most advanced farming management typologies, maximizing arable farming outputs—in terms of crop yield, machinery efficiencies and reduction in operating costs—directly depends on topsoil quality. When defining and assessing the textural characteristics of arable layers, soil fractions over 2 mm in diameter (gravel and stones) are usually excluded because they are considered inert fractions.
However, an excessive presence of coarse fractions or stones in the soil’s arable layers hinders or is incompatible with the operational requirements of modern cultivation techniques and machinery (i.e., minimal tillage, precision sowing), which require fields without obstructions and topsoil of fine earth to work at their best [
1,
2,
3].
This work focuses on sowing to verify if the vibration and noise arising during such operation significantly change at varying soil conditions according to the stoniness disturbance degree on soil workability. The importance of vibration on the seed metering performance has been also highlighted for the design of a seed metering device and entire seeder, as well as the determination of operation speed [
4,
5].
1.1. Sowing Efficiency Issues: Precision Seeders
In the panorama of digital and precision farming machinery, seeders are a key tool for optimizing crop results. According to different sowing requirements, various types of precision seeders have been developed to meet the needs resulting from the geographical environment, farm scale, mechanization level and crop type of different countries, for both tilled and untilled soils [
6,
7].
Across their different types and structural and operational characteristics, such machines maximize sowing efficiency in terms of costs and time savings. Moreover, precise seed positioning along the row and at the proper sowing depth avoids seed wastage and fosters optimal crop growth.
Precision seeders are generally semi-portable machines consisting of a variable number of independent planter units fixed to the frame. Each element, therefore, constitutes a complete sowing unit, consisting of a hopper, distribution and damping devices, seed covers and a compaction device. In some cases, they can be combined with equipment for complete and minimal tillage or equipped with simple implements suitable for opening the furrow for depositing the seed in the firm soil (sod seeding).
Under optimal soil conditions, mechanical seeders operate at speeds between 5 and 7 km h
−1 with power requirements varying between 1.5 and 2.0 kW per row. Pneumatic seeders can operate at speeds of up to 10–12 km h
−1, ensuring good uniformity of distribution, albeit with higher power requirements, typically 4–5 kW per row [
8]. The planters are suitable for precision planting under a working speed of 6.9 km h
−1 [
9]. The most recent ISOBUS [
10] models, with electrically driven seeding units, tractor auto-guidance system and global navigation satellite system (GNSS) positioning, can operate at speeds of up to 15 km h
−1 with high levels of precision [
11]. Various authors have evaluated the operational performance of different seeders in different areas and for different crops. However, neither bibliographic references nor technical documentation report correlations between machinery performances and soil condition, assuming that the soil is optimal for the performances of the described machines [
12,
13,
14,
15]. On the contrary, the type and structural conditions of the soil on which sowing occurs heavily affect the operational efficiency of seeders in terms of waving, humidity, and seedbed preparation methods: the presence of skeleton in the arable soil layer is widespread in a great part of the world’s arable lands [
16,
17].
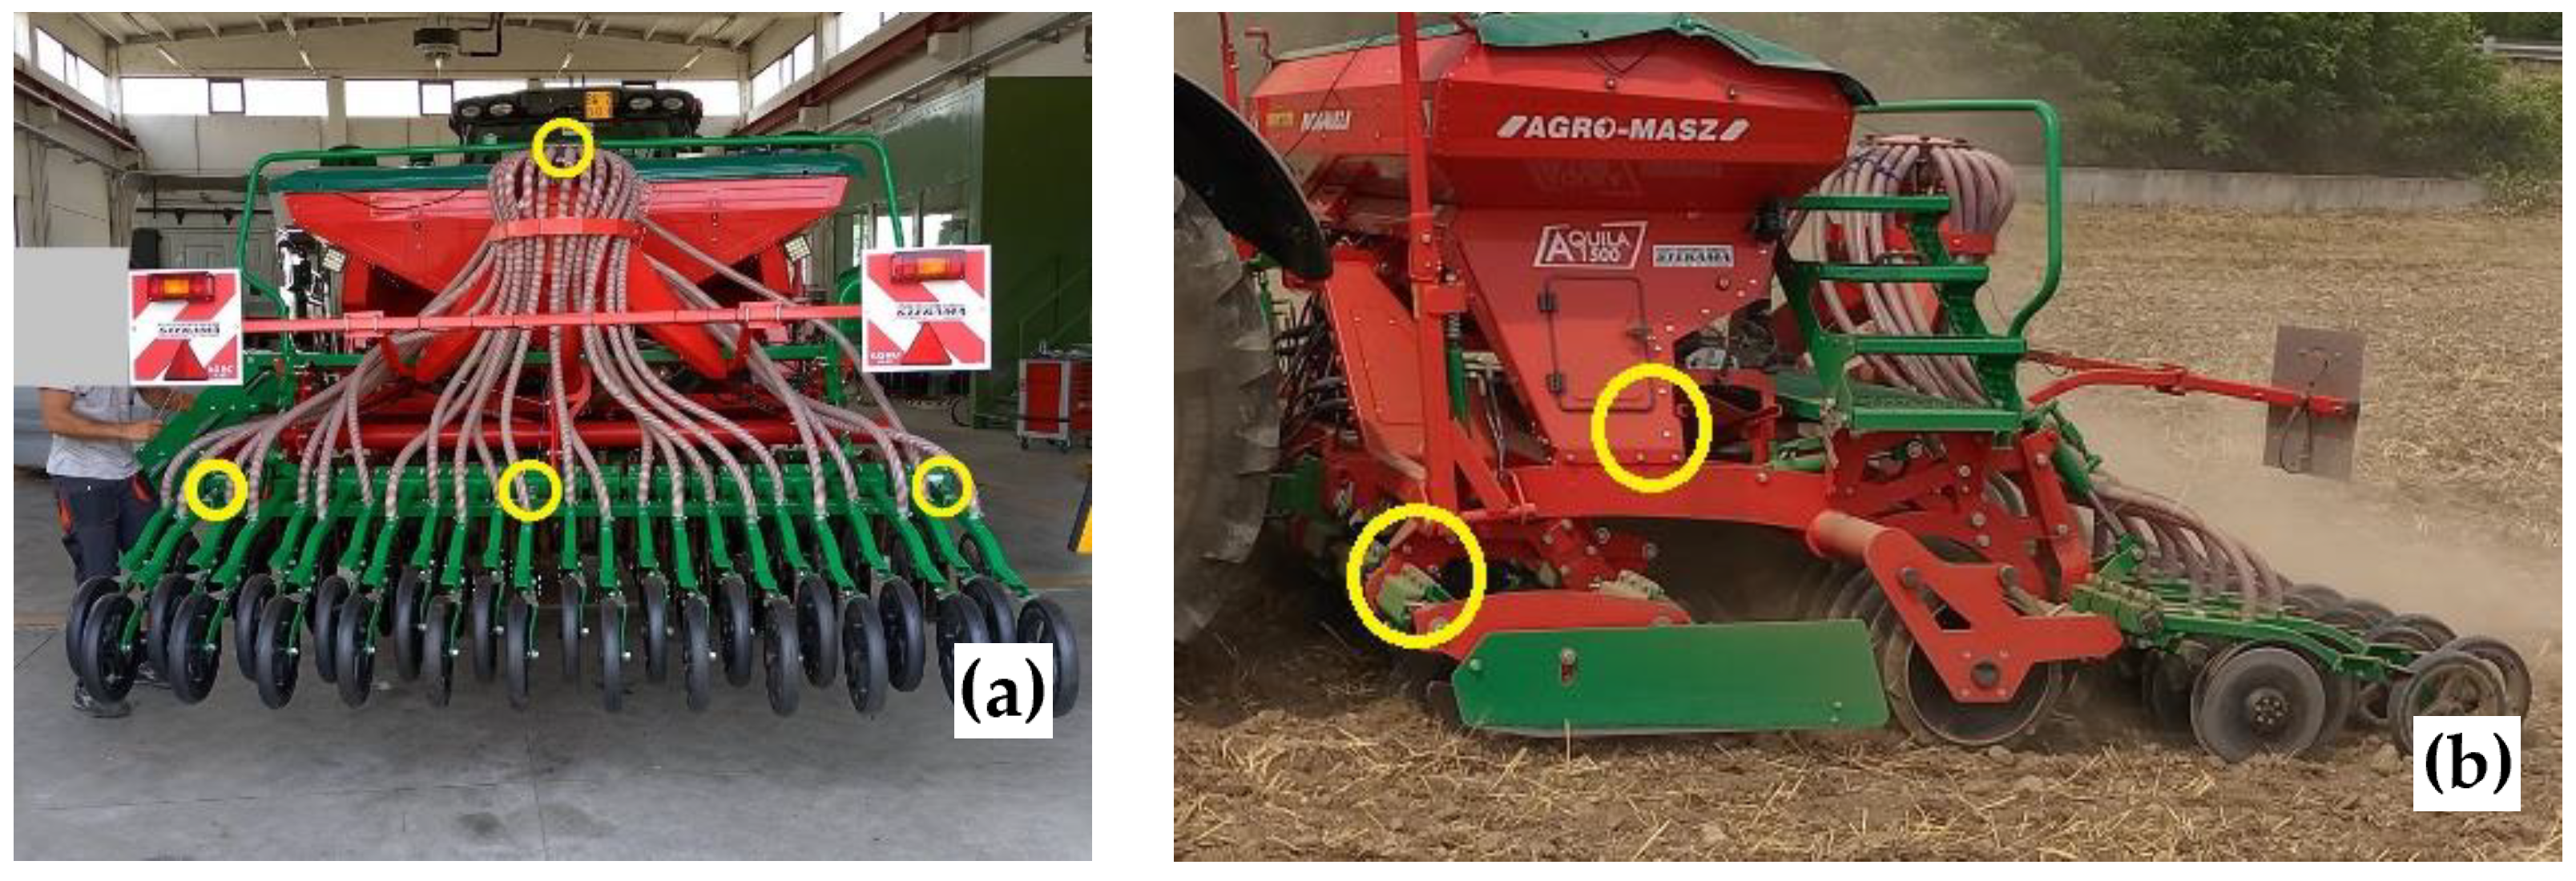
One of the main factors characterizing the efficiency of a seeder in terms of work rate, with the related costs for the tractor, operator, and fuel consumption, is the maximum allowable forward speed. Apart from technical considerations, such speed can depend on soil composition. For example,
Figure 1a reports operation on soil with high skeleton which allowed a maximum speed of 5.6 km h
−1.
Figure 1b reports the performance of the same tractor and seeder during an experimental sowing experience at various forward speeds on soil without skeleton, correctly sowing at 11.5 km h
−1. In this last case, the limit was the maximum power of the tractor used.
Research on sowing quality associated with high speeds [
18,
19] report operational limits due to excessive lateral soil throw, reduction in furrow backfill and interactions between adjacent furrows. In addition, they showed potential for new opener technology to increase operating speeds, increasing the timeliness of sowing, grain-yield potential and lowering total seeding time per season [
20,
21], encouraging the approach to technical improvements in the implement specific to particular soil conditions.
1.2. The Stony-Soils Disturbance Degree
The type and amount of coarse fractions define the workability class of soils as a function of the degree of disturbance (DD) caused to cultivation machinery (
Figure 2) [
22]. Soil stoniness can severely impair the efficiency of this machinery, in particular of seeders, in terms of both sowing effectiveness and structural integrity, even for those equipped with the most advanced vibration-damping systems and downforce control of sowing elements [
23].
Understanding the effect of soil conditions on sowing performance in terms of precision and work rate requires the possibility of monitoring the parameters correlated with the operation.
The monitoring of some parameters is already adopted in rotating machines for the diagnostic analysis of the correct functioning. For example, vibrations and noise could be specific signals that indicate abnormal functioning [
24]. Focused engineered sensors measuring vibrations have been developed for measurements on a hay-handling machine and have confirmed the capability of the online monitoring system to diagnose malfunctions. The proposed measuring system could also be used to improve the durability of agricultural machinery [
25].
A purpose-designed array of instruments has been developed to install accelerometers and microphones for evaluating grain losses in key points of combined harvesters [
26]. With this aim, this study focuses on the possibility of evaluating whether the level of vibration/acceleration or the noise of seeder units upon their impact with soil could be a signal correlated to the seeding quality or mechanical protection of the machine when operating on stony soils. Reducing vibration at a seeder distributor element to optimize sowing quality (uniform distribution) has also been developed as a patent [
27].
This work aims to verify whether vibrations and noise during sowing can be measured and acquired and can identify significant changes in soil conditions according to the stoniness degree of disturbance on soil workability.
The results could also be discussed alongside the recent development of the ISOBUS function tractor implement management system (TIM). TIM is an ISOBUS-based agricultural technology system which enables the implement to control tractor functions such as, for example, forward working speed.
2. Materials and Methods
2.1. Soil Geoelectric Analysis/Test Plots
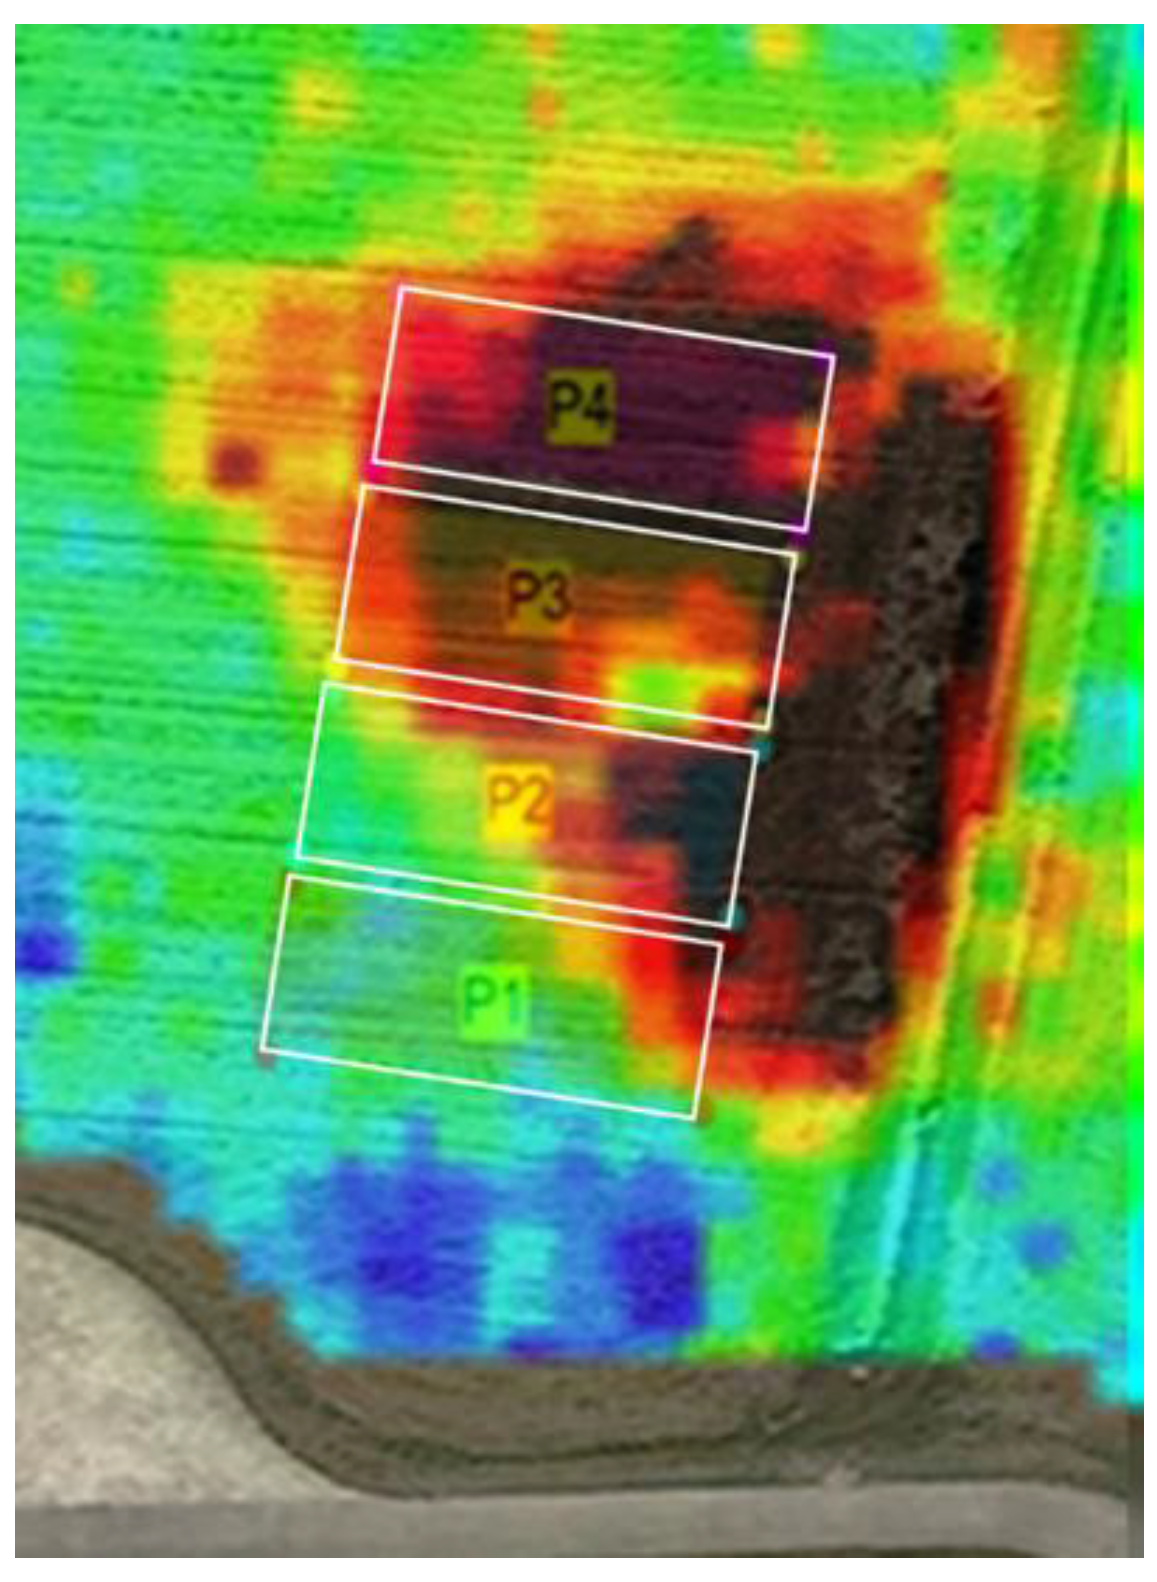
At the Council for Agricultural Research and Economics (CREA) experimental farm in Treviglio, Bergamo, Italy (45°31′14″ N; 9°35′27″ E; +128 m asl), in a soil classified as Calcic Skeletic Mollic Umbrisol, with neutral-sub alkaline pH, according to the International Union of Soil Science (IUSS) classification [
28], a geoelectric analysis followed by the application of a classification algorithm on the 0–1 m deep soil’s resistivity values resulted in the zoning of three homogeneous macro areas (
Figure 3) [
29].
Profile No. 4 is representative of soil class “A”, consisting of soils with a depth of about 60 cm, with a medium sandy texture, characterized by a surface layer of about 20 cm of dark-brown color, with skeleton (25–35%) consisting of pebbles and gravels, of moderate subangular polyhedric, fine and medium structure and with fine pores. On the surface, there is a relatively abundant presence of pebbles. From a depth between 20 cm to about 60 cm, there is a brown-color layer, with abundant medium and large skeleton (50–60%) with weak fine subangular polyhedric structure and fine and medium pores. At depths over 60 cm, the skeleton is very abundant (>70%), consisting of pebbles and gravel.
Profile No. 1 represents soil class “C”, with soils with a depth of about 100 cm, medium to silty texture, characterized by a surface layer of about 20 cm of dark-brown color, with 10–15% skeleton consisting of small and medium gravel; fine and medium polyhedric structure; and abundant fine pores. From 20 to about 700–800 mm deep, there is a brown/olive-brown layer with a frequent (25–35%) medium and large skeleton. It has medium and large angular polyhedric structures and fine pores. Over 700–800 mm deep the skeleton is abundant (35–50%), consisting of pebbles and gravel.
Two test plots of 10 × 20 m surface area were chosen (P1 and P3) as the plots to carry out deep burial stone reclamation digging the soil up to 1 m deep (
Figure 4a). The dug soil was then sieved (
Figure 4b), gradually discharging in the trenches the stones retained by the grid (
Figure 4c); then, the filling of the trenches with the sieved fine earth, including skeletal fractions up to 40 mm (classes Y and Z) was completed (
Figure 4d); levelling and compacting the layer of fine earth was performed with repeated passages of the crawler excavator (
Figure 4e).
Two other contiguous plots of the same area of undisturbed soil were delimited as control tests (P2 and P4) (
Figure 5) [
30].
As a result, a clear improvement in the topsoil appearance was obtained without changing the plane of the field (
Figure 6).
2.2. Georadar Survey
The results of the described stone reclamation system on soil profile were evaluated by performing the Ground Penetrating Radar (GPR) mapping of the experimental plots using a GSSI UtilityScan RLT3 with 350 MHz HyperStacking antenna (Geophysical Survey Systems Inc., Nashua, NH, USA;
Figure 7) [
31].
2.2.1. The Ground-Penetrating Radar Technology
GPR is a non-invasive geophysical technique [
32] which employs radio waves, typically in the 10 to 3000 MHz frequency range, to map features buried in the ground. This nondestructive method detects the reflected signals from subsurface structures. When the signal hits a target or a boundary between materials having different permittivity values, it may be reflected from the surface and then detected by the GPR device. GPR is a convenient methodology for the imaging of subsurface features. It is an efficient investigation tool for studying the variations in the soil [
33,
34,
35]. This technology can be used in agriculture to estimate the spatial pattern of lithological subsurface layers and reveal layer discontinuities [
36]. This technique provides significant advantages over traditional methods such as soil cores or excavation.
2.2.2. Ground Penetrating Radar Survey
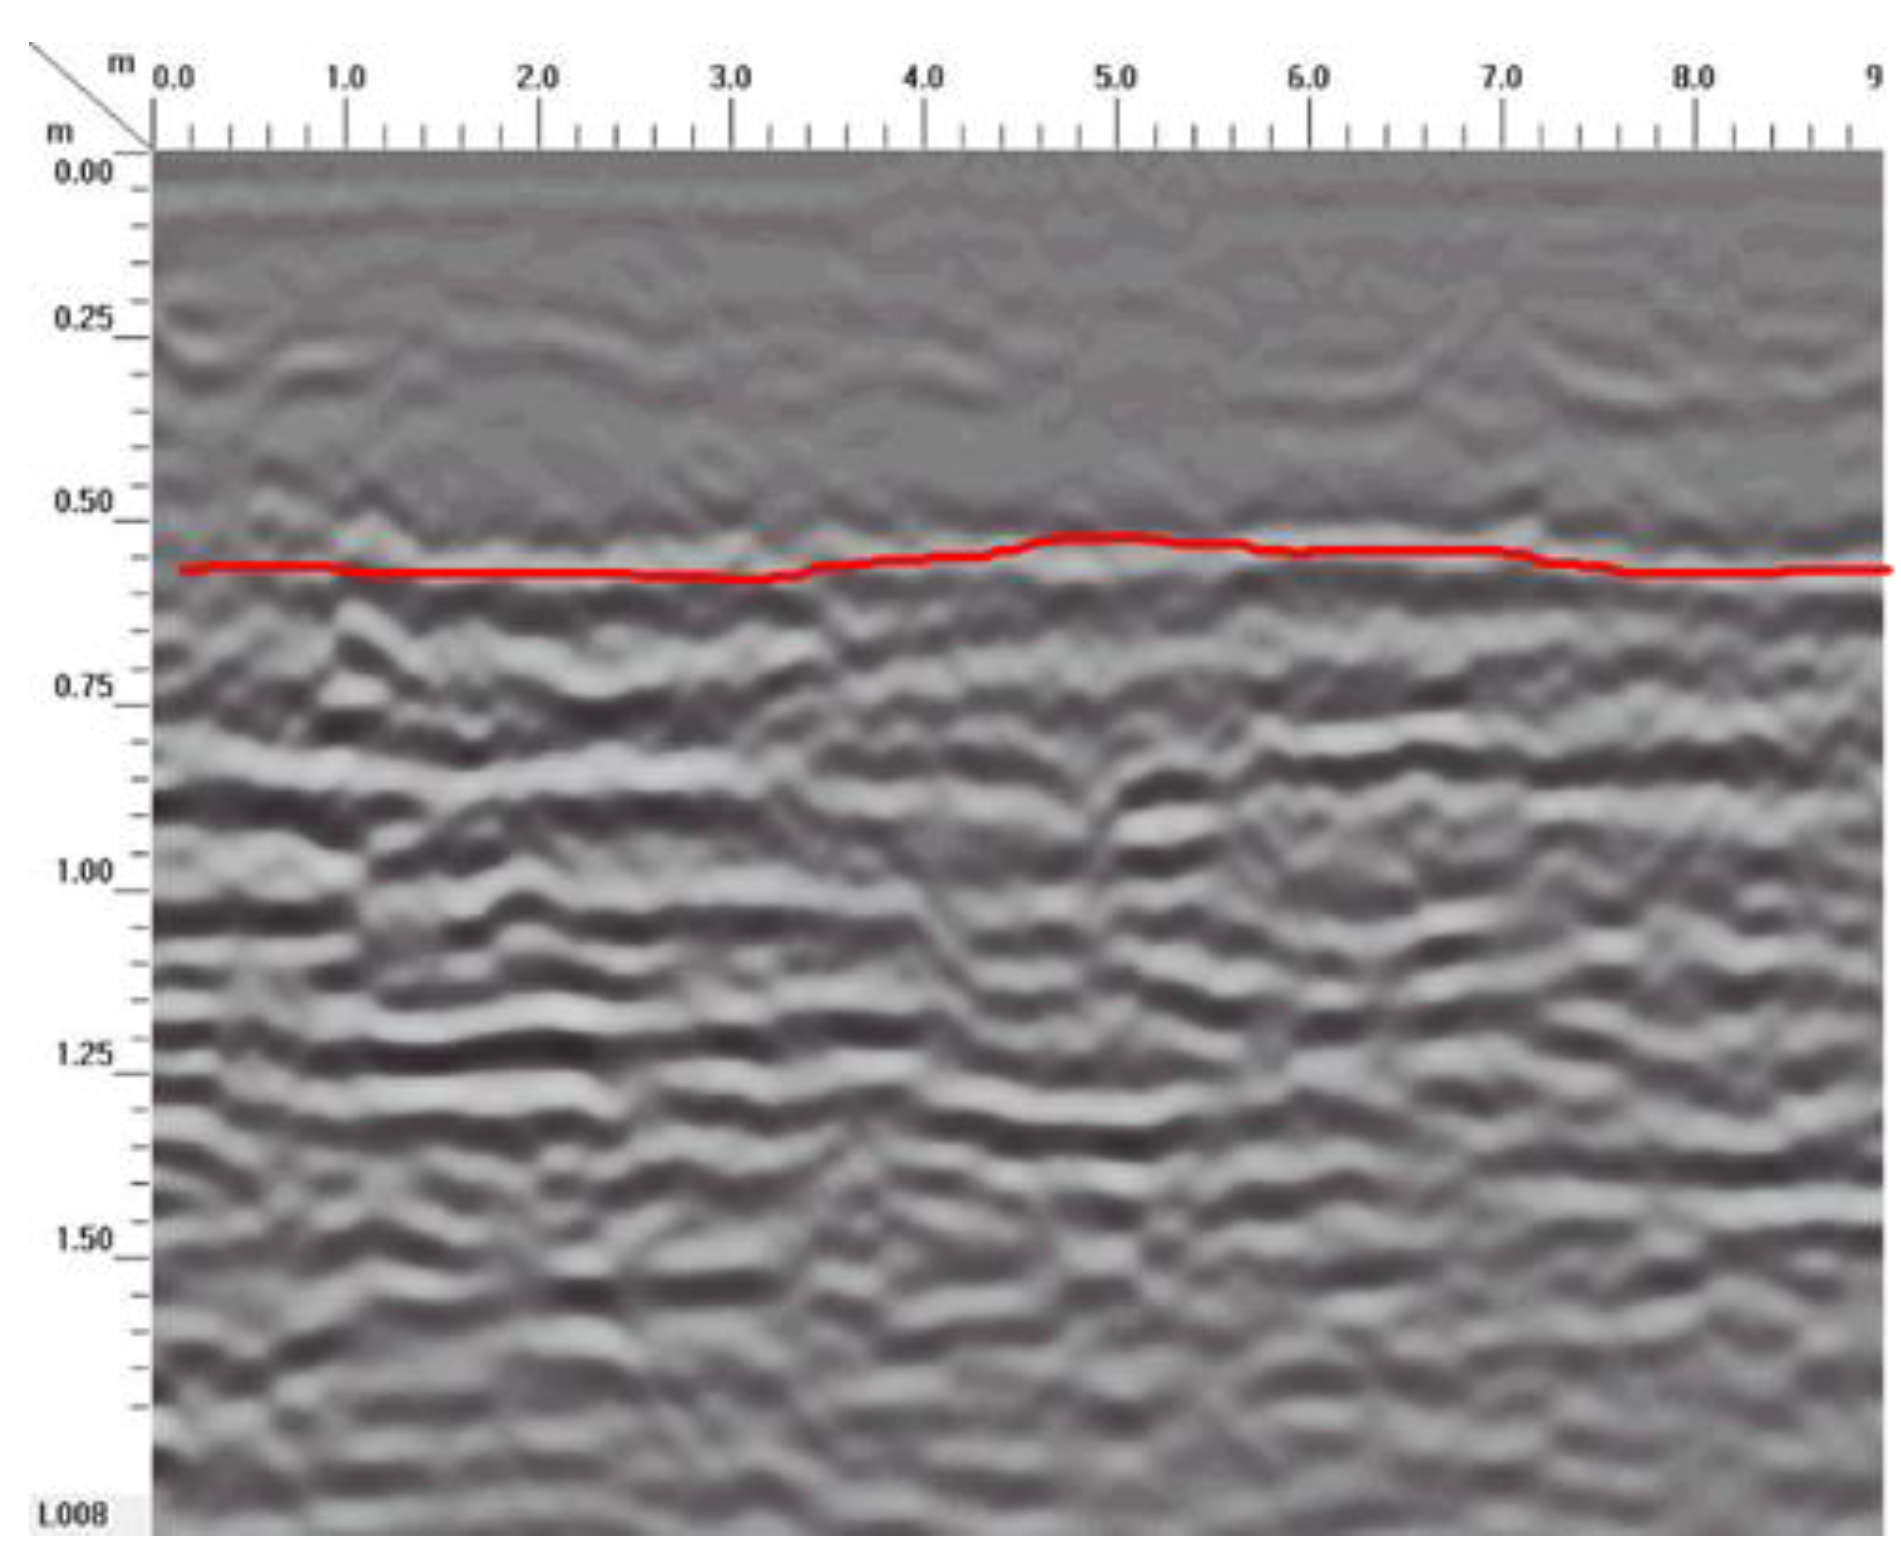
The GPR survey has proven able to detect the difference between two different contents of the soil. The survey was carried out in the 4 areas mentioned hereafter: A (P1, P3: reclaimed) and B (P2 and P4: undisturbed). The difference between A and B is related to the first shallow layer (60 cm depth). Soil A is more homogeneous than soil B because the stones have been removed and buried under the arable layer.
Twenty-two GPR profiles were collected inside the A and B areas by recording GPR traces (inline sampling) every 1 cm, with the maximum depth of investigation being 1.65 m (83 ns in terms of time window).
It has always been possible to detect the difference between soil A and soil B in the acquired profiles. The low backscatter of the signal is due to the lack of agglomerations and stones in the reclaimed areas (A) (
Figure 8); meanwhile, in non-reclaimed areas (B), the signal has greater backscatter and attenuation along the depth axis (
Figure 9).
2.3. The Machines Used
On all plots, a preliminary seedbed preparation was carried out by harrowing with a combined tiller (
Figure 10) at an approx. depth of 20 cm for the rupture of the soil crust and the burial of the previous crop residues.
The machines used were chosen to ensure the data record matched the chosen plots. For this reason, geo-positioning and auto-guidance systems were necessary to precisely ensure the three longitudinal passages.
The chosen tractor was a 117-kW nominal power tractor with continuously variable transmission (CVT) equipped provided with commercial PA technologies, consisting of a navigation system: GNSS receiver; real time kinematic (RTK) antenna, a terminal unit (VT), and a drive-wheel electric system for auto-guidance. The seeder was a 4.0 ISOBUS, pneumatic, 3 m wide, with 24 planter units, combined with disks (
Figure 11).
2.4. Survey Methods
The considered factors are:
Plot: 4, 2 reclaimed (B1; B2) and 2 undisturbed (NB1; NB2);
Accelerometer position: 1 to 5;
Axis of solicitation of the accelerometers: x; y; z.
The method involved three passes per plot at 1.25 ms−1 (4.5 km h−1). The forward speed was established based on the experience of the operator as the maximum allowable in the worst-case plot scenario, and was kept constant in all the plots.
The acquired signals resulted in the three axes of the accelerometer (x = longitudinal; y = lateral; z = vertical) for all the 5 sensors and the microphone’s sound pressure level. With this setting, the analyzed factors resulted in 16 channels. The frequency of acquisition was 1 kHz for the accelerometers and 50 kHz for the microphone.
Regarding noise, it will be reported as sound pressure level (SPL) and expressed in decibel (dB) unit. In order to consider the sound perceived by the human ear, the A-weighted decibel (dBA) was adopted. Since it is assumed that the sound pressure levels may be higher than 85 dBA, indicating a noisy environment, it is believed that the C-weighted decibel (dBC) may be more suitable for the purpose of the study. For this reason, in addition to the commonly adopted dBA, approach, the measurements will also be analyzed in dBC. Regarding acceleration, the analysis included root mean square (RMS), maximum and minimum acceleration.
Consequently, the measurements made were:
Accelerations: 3 (rep) × 5 (positions) × 4 (plots) × 3 (axis) × 3 (RMS, max, min) = 540;
Noise: 3 (rep) × 4 (plots) × 2 (weighted dB) = 24 for a total of 564 values.
2.5. Instruments
The study focused on the measurement of acceleration and sound pressure.
The sensors used were accelerometers and microphones. The sensors, software and acquisition system are shown in
Table 1.
The accelerometers used were all triaxial: three were positioned on the distribution elements of the machine, i.e., one on the left (position 1), one in the middle (position 2) and one on the right (position 3) (
Figure 12a,b). Another was positioned on the main frame of the seeder (position 4), and the last one was placed on the pivoting roller (position 5).
The microphone was positioned in the horizontal position on the ladder railing and pointed toward the back of the machine.
3. Data Analysis
The data acquired were processed with Minitab 17 statistical software [
37] using the analysis of variance (ANOVA), which applied a generalized linear model (GLM) [
38]. The plot (NB/B), the sensor position on the frame (1 to 5), and the acquisition axes (x, y, and z) were assumed to be fixed factors, while the root mean square (RMS) of the accelerations and the maximum and the minimum values of the time histories were the dependent variables. The Levene test (
p < 0.05) [
39] evaluated the homogeneity of the dataset’s variances before the variance analysis.
4. Results
The results as root mean square (RMS) are reported in
Table 2.
The highest accelerations were found at the roller and ranged from 0.3 g in the destoned soil to 0.59 g in the undisturbed plots with a high skeleton level. The lowest accelerations, as expected, were at the frame, where the differences were less clear.
The mean acceleration value at the elements on the stony soils resulted in about double the destoned one.
Interestingly, the highest values were not found exclusively at the vertical axis, but all three axes were essential for the study. This aspect was observed, above all, at the pivoting roller (position 5), which appeared to be the most interesting: the longitudinal stress has the highest value (position 5; x axis).
The application of the analysis of variance (ANOVA) not only on the RMS values but also on the maximum and minimum values of the acquired time histories indicated the possibility of using acceleration to define the sowing parameters (
Table 3).
The plot, the sensor position, and the kind of sensor were all found to be significant factors (p < 0.05). Moreover, the data should be considered attentively as it is very interesting to note that their interaction was also significant. All the five accelerometers recorded significant differences. The accelerometer at the frame was the one with the smallest difference while that at the roller recorded the most differences. Regarding the accelerations of the distributors, measured as RMS, although these were the lightest elements, they were not those with the highest RMS acceleration, probably because they were fixed to the frame. As expected, the ANOVA analysis of the peak accelerations, both maximum and minimum, also gave significant results, confirming the different behaviors of the seeder when changing the plots. However, it must be noted that, in this case, it could be challenging to use this signal for monitoring in continuous mode and active optimization.
The results of the phonometric survey are reported in
Table 4.
In this case, too, a significant confirmed difference in noise value was found between the different plots. Both dBA and dBC gave significant results with very high differences (6 dBA and dBC). Therefore, both values could be adopted for monitoring the seeding. In this case, there is no signal problem as the software was already set up to provide the drive signal as both dBA and dBC. However, the results are of interest because it must be considered that noise is also the main feedback for the operator to decide the correct forward speed or the quality of the seeding.
5. Discussion
The question of the quality and speed of sowing is widely debated and current. The same sowing speed affects the outcome of the sowing. An increase in speed leads to a high degree of soil disturbance, inaccurate laying of the seed and suboptimal closure of the furrow. The issue was addressed by considering mainly two aspects: the properties of the soil and the technical and mechanical structure of the seeder.
In the literature, the issue is of particular interest in the fields of minimum tillage and soils with a high degree of stony disturbance. Many agricultural soils have variable percentages of coarse fractions in their arable layer, which interfere with crop growth and machine working. In addition, different techniques are available for destoning such as (i) collection and removal, (ii) on-site stone crushing, and (iii) stone burial. All these methods are expensive.
In addition, the further advent of geo-positioning, self-driving and isobus technologies have highlighted how the workability of the soil is a bottleneck for such machines. The limit highlighted by the operators is in the mechanical stress on the implement, which limits the operating speed to one third of the maximum possible.
With this aim, this study was performed to investigate whether it was possible to use noise and/or vibration values to monitor sowing performance in stony soils.
Four soil plots of two different disturbance degrees were prepared and an experimental sowing was carried out. The chosen forward speed of this experiment was 4.5 km h−1, chosen as the maximum allowable speed on a stony plot by the operator.
Sowing trials on reclaimed and undisturbed plots showed that the noise and acceleration measured and acquired significantly differed when changing the soil conditions according to the stoniness degree of disturbance (DD) on soil workability.
Results confirmed that both noise and acceleration were significantly correlated with soil DD, to the point of being able to hypothesize their use as indicators to optimize mechanical operation.
Moreover, modern tractors with a global navigation satellite system (GNSS), auto guidance and ISOBUS seeder could also work at 15 km h−1. This highlights not only the three-fold higher field efficiency of the machines but also the correct way of using the engine of high-powered tractors, whose power is limited by the maximum allowable speed. Therefore, the economic considerations about destoning could enable a new approach considering not only the current growing scarcity of further farming land, but also the opportunities offered by new digital technologies. For example, it is possible to imagine providing information on the correct forward sowing speed to the operator by means of acoustic or visual signals on the display or directly to the tractor’s electronic control unit. The experiment also pointed out the capability of purpose-designed sensors (i.e., accelerometers) and their most interesting measurement axis. Moreover, use of the Tractor Implement Management technologies (TIM) system could optimize the operational efficiency of precision seeders in terms of working rate. TIM enables automatic operation, similarly to an on-the-go sensor, at the most suitable forward speed compatible with the structural characteristics of the machine depending on the levels of acceleration or noise induced in real time by the characteristics of the soil on which the machine operates, simultaneously reducing the risks of wear or breakage, and the related costs due to downtime and repairs. TIM’s main concept is to enable bidirectional communication between tractor and implement, i.e., a transfer of control in both directions, to automatically control the main operational functions of the tractor.
Author Contributions
Conceptualization, P.T., M.C., E.P. and C.B.; methodology, P.T., M.C., E.P. and A.F.; software, M.B. and M.P.; validation, P.T., M.C. and M.B.; formal analysis, M.C., M.B., M.P. and N.C.; investigation, P.T., M.C., M.B. and M.P.; resources, M.C. and C.B.; data curation, P.T., M.C., M.B., A.F. and M.P.; writing—original draft preparation, P.T., M.C., M.B. and M.P.; writing—review and editing, P.T., M.C., M.B., M.P. and C.B.; supervision, P.T., M.C., M.B. and C.B.; funding acquisition, M.C. and C.B. All authors have read and agreed to the published version of the manuscript.
Funding
This research was funded by the Italian Ministry of Agriculture (MiPAAF) under the AgriDigit Programme, DDL n. 2111-B/2015.
Acknowledgments
The authors would like to thank, for their technical support: Gianluigi Rozzoni, and Ivan Carminati (CREA, Treviglio, Bergamo, Italy).
Conflicts of Interest
The authors declare no conflict of interest.
References
- Colzani, G.; Cammilli, A.; Pirrone, S. Stato Di Pietrosità Dei Terreni E Lavorazioni Agricole State of Stoneiness of Soils and Agricultural Workability. L’Informatore Agrar. 1989, 42, 61–64. [Google Scholar]
- He, D.; Lu, C.; Tong, Z.; Zhong, G.; Ma, X. Research Progress of Minimal Tillage Method and Machine in China. AgriEngineering 2021, 3, 633–647. [Google Scholar] [CrossRef]
- Jiang, S.; Wang, Q.; Zhong, G.; Tong, Z.; Wang, X.; Xu, J. Brief Review of Minimum or No-Till Seeders in China. AgriEngineering 2021, 3, 605–621. [Google Scholar] [CrossRef]
- Manquan, Z.; Yongwen, H.; Yueqin, L. Measurement and analysis on vibration characteristics of pneumatic seed metering device of no-till seeder. Trans. Chin. Soc. Agric. Eng. 2012, 28 (Suppl. S2), 78–83. [Google Scholar] [CrossRef]
- Xue, A.; Sheng, W.; Hongyan, D.; Chen, Y.; Yongchang, Y. Test on effect of the operating speed of maize-soybean interplanting seeders on performance of seeder-metering devices. Procedia Eng. 2017, 174, 353–359. [Google Scholar] [CrossRef]
- Yang, L.; Yan, B.; Cui, T.; Yu, Y.; He, X.; Liu, Q.; Liang, Z.; Yin, X.; Zhang, D. Global Overview of Research Progress and Development of Precision Maize Planters. Int. J. Agric. Biol. Eng. 2016, 9, 9–26. Available online: https://ijabe.org/index.php/ijabe/article/view/2285/1179 (accessed on 1 July 2022).
- Sharaby, N.; Doroshenko, A.; Butovchenko, A.; Legkonogih, A. A comparative analysis of precision seed planters. E3S Web Conf. Innov. Technol. Environ. Sci. Educ. 2019, 135, 1–19. [Google Scholar] [CrossRef]
- Gasparetto, E.; Pessina, D. Seminatrici. Dispense del Corso di Meccanica Agraria (Lecture Notes of the Agricultural Mechanics course). Istituto di Ingegneria Agraria, Unimi. 1998. Available online: http://web.tiscali.it/profpessina/semina/seminatrici.htm (accessed on 1 July 2022).
- MaterMacc Precision Planters. Available online: https://www.matermacc.it/eng/products (accessed on 1 July 2022).
- ISO 11783-1:2017; Tractors and Machinery for Agriculture and Forestry—Serial Control and Communications Data Network—Part 1: General Standard for Mobile Data Communication. International Organization for Standardization: Geneva, Switzerland, 2017.
- Maschio Gaspardo. Seminatrici di Precisione (Precision Sowing Machines). Available online: https://www.maschio.com/it/web/italia/seminatrici-di-precisione (accessed on 1 July 2022).
- Staggenborg, S.A.; Taylor, R.K.; Maddux, L.D. Effect of Planter Speed and Seed Firmers on Corn Stand Establishment. Appl. Eng. Agric. 2004, 20, 573–580. [Google Scholar] [CrossRef] [Green Version]
- Brandelero, E.M.; Adami, P.F.; Modolo, A.J.; Murilo Mesquita Baesso, M.M.; Adelar, J.F. Seeder Performance under Different Speeds and its Relation to Soybean Cultivars Yield. J. Agron. 2015, 14, 139–145. [Google Scholar] [CrossRef]
- Liu, L.; Yang, H.; Ma, S. Experimental Study on Performance of Pneumatic Seeding System. Int. J. Agric. Biol. Eng. 2016, 9, 84–90. Available online: https://www.researchgate.net/publication/311439603 (accessed on 1 July 2022).
- Nielsen, R.L. Planting Speed Effects on Stand Establishment and Grain Yield of Corn. J. Prod. Agric. 1995, 8, 391–393. [Google Scholar] [CrossRef] [Green Version]
- European Commission: European Soil Data Center. Stony Soils Distribution in Western Europe. Available online: https://esdac.jrc.ec.europa.eu/public_path/Cfrag.png (accessed on 1 July 2022).
- Flint, A.L.; Childs, S. Physical Properties of Rock Fragments and Their Effect on Available Water in Skeletal Soils. In Erosion and Productivity of Soils Containing Rock Fragments; Nichols, J.D., Brown, P.L., Grant, W.J., Eds.; John Wiley and Sons: Hoboken, NJ, USA, 1984; Volume 13. [Google Scholar] [CrossRef]
- Badua, S.A.; Sharda, A.; Strasser, R.; Ciampitti, I. Ground speed and planter downforce influence on corn seed spacing and depth. Precis. Agric. 2021, 22, 1154–1170. [Google Scholar] [CrossRef]
- Da Silveira, J.C.M.; Fernandes, H.C.; Modolo, A.J.; De Lima Silva, S.; Trogello, E. Furrow depth, soil disturbance area and draft force of a seeder-fertilizer at different seeding speeds. Rev. Ceres Vicosa 2011, 58, 293–298. [Google Scholar]
- Barr, J.B.; Desbiolles, J.M.A.; Fielke, J.M. Minimising soil disturbance and reaction forces for high speed sowing using bentleg furrow openers. Biosyst. Eng. 2016, 151, 53–64. [Google Scholar]
- Barr, J.B.; Desbiolles, J.M.A.; Fielke, J.M.; Ucgul, M. Development and field evaluation of a high-speed no till seeding system. Soil Tillage Res. 2019, 194, 104337. [Google Scholar] [CrossRef]
- Colzani, G.; Cammilli, A.; Pirrone, S. Grado di disturbo alla lavorabilità dei terreni pietrosi (Degree of disturbance to the workability of stony soils). L’Informatore Agrar. 1989, 44, 39–43. [Google Scholar]
- Pessina, D.; Facchinetti, D. Rateo variabile per una semina perfetta e sostenibile (Variable rate for perfect and sustainable sowing). L’Informatore Agrar. 2022, 19, 36–39. [Google Scholar]
- Tiboni, M.; Remino, C.; Bussola, R.; Amici, C. A Review on Vibration-Based Condition Monitoring of Rotating Machinery. Appl. Sci. 2022, 12, 972. [Google Scholar] [CrossRef]
- Mystkowski, A.; Kociszewski, R.; Kotowski, A.; Ci Ezkowski, M.; Wojtkowski, W.; Ostaszewski, M.; Kulesza, Z.; Wolniakowski, A.; Kraszewski, G.; Idzkowski, A. Design and Evaluation of Low-Cost Vibration-Based Machine Monitoring System for Hay Rotary Tedder. Sensors 2022, 22, 4072. [Google Scholar]
- Yılmaz, D.; Gökduman, M.E. Development of a measurement system for noise and vibration of combine harvester. Int. J. Agric. Biol. Eng. 2020, 13, 104–108. [Google Scholar]
- International Application Published under the Patent Cooperation Treaty (PCT). System and Method for Controlling Vibration on Agricultural Implement. WIPO Patent WO 2014/108722 A1, 17 July 2004. [Google Scholar]
- IUSS Working Group WRB. World Soil Resources Reports 2015, No. 106; FAO: Rome, Italy, 2015. [Google Scholar]
- Brambilla, M.; Romano, E.; Toscano, P.; Cutini, M.; Biocca, M.; Ferré, C.; Comolli, R.; Bisaglia, C. From Conventional to Precision Fertilization: A Case Study on the Transition for a Small-Medium Farm. AgriEngineering 2021, 3, 438–446. [Google Scholar] [CrossRef]
- Toscano, P.; Cutini, M.; Cabassi, G.; Pricca, N.; Romano, E.; Bisaglia, C. Assessment of a Deep Burial Destoning System of Agrarian Soils Alternative to the Stone Removal and On-Site Crushing. AgriEngineering 2022, 4, 156–170. [Google Scholar] [CrossRef]
- Codevintec. Available online: https://www.codevintec.it/media/strumentiPdf/gs-2004-utilityscan-eng-lo_KILux_it.pdf (accessed on 1 July 2022).
- Daniels, D.J. Ground Penetrating Radar, 2nd ed; The Institution of Electrical Engineers: London, UK, 2004. [Google Scholar]
- Davis, J.L.; Annan, A.P. Ground Penetrating Radar for high resolution mapping of soil and rock stratigraphy. Geophys. Prosp. 1989, 37, 531–551. [Google Scholar]
- Lombardi, F.; Lualdi, M. Step-Frequency Ground Penetrating Radar for Agricultural Soil Morphology Characterization. Remote Sens. 2019, 11, 1075. [Google Scholar]
- Zhang, J.; Lin, H.; Doolittle, J. Soil layering and preferential flow impacts on seasonal changes of GPR signals in two contrasting soils. Geoderma 2014, 213, 560–569. [Google Scholar]
- Allred, B.; Daniels, J.J.; Ehsani, M.R. Handbook of Agricultural Geophysics, 1st ed; CRC Press: Boca Raton, FL, USA, 2008. [Google Scholar]
- Minitab 17. Statistical Software. State College, Pa.: Minitab, Inc. 2010. Available online: www.minitab.com (accessed on 4 July 2022).
- Hastie, T.J.; Pregibon, D. Generalized linear models. In Statistical Models in S; Chambers, J.M., Hastie, T.J., Eds.; Wadsworth & Brooks/Cole: Pacific Grove, CA, USA, 1992; Chapter 6. [Google Scholar]
- Levene, H. Contributions to Probability and Statistics: Essays in Honor of Harold Hotelling; Stanford University Press: Redwood City, CA, USA, 1960; pp. 278–292. [Google Scholar]
| Publisher’s Note: MDPI stays neutral with regard to jurisdictional claims in published maps and institutional affiliations. |
© 2022 by the authors. Licensee MDPI, Basel, Switzerland. This article is an open access article distributed under the terms and conditions of the Creative Commons Attribution (CC BY) license (https://creativecommons.org/licenses/by/4.0/).


 ,
, 


