3.2. Physicochemical Properties
Moisture is one of the important criteria for evaluating the quality of honey. Too much water in honey causes the formation of yeasts (resulting in the formation of ethyl alcohol and carbon dioxide). The product is fermented under the influence of natural oxidation to form acetic acid and water, creating a sour taste [
25]. In addition, the moisture value is also shown to have a close correlation with the dry matter content (a measure to determine the total content of inorganic and organic substances, including molecular, ionized, microparticles, or suspension) in honey.
The results of moisture analysis in honey samples are presented in
Table 4. In general, the moisture content of honey ranged from 10.78–23.96%. Melaleuca honey had the highest moisture content of 23.71%, and longan flower honey showed the lowest moisture content of 10.78%. Except for samples of longan flower honey, melaleuca flower honey and rambutan flower honey, the others were evaluated with moisture content below 20%, which is the maximum acceptable limit according to the Codex standard for honey [
26]. The moisture content of longan flower honey and lychee flower honey in Vietnam had values of 10.78 ± 0.35% and 15.45 ± 0.33%, respectively, which were lower than those collected in Thailand (20.11. ± 1.16% and 19.97 ± 0.85%) [
10]. While Indonesian rubber honey had a relatively high moisture content (22.5–30%), the moisture content of rubber honey in Vietnam experienced a lower value of 16.86 ± 0.21% [
23]. When compared with the control sample, which is manuka honey, it was found that Vietnamese honey samples had almost higher moisture content (except for longan honey samples). However, in general, the obtained analytical results showed similarities with previous studies on honey from countries with similar climate and soil conditions to Vietnam. The moisture content of honey was reported to range from 17.86 to 19.06% in Malaysia, 17.8 to 21.7% in Thailand, and from 18 to 26% in Indonesia [
27,
28,
29]. The difference in moisture content of honey was influenced by various factors such as the time of extraction, the maturity of the hive, and the climatic conditions [
21]. At the same time, the moisture value showed a significant influence on the dry matter content (°Brix), which was a tool to determine the presence of organic and inorganic matter in honey products. The TSS value of Vietnamese honey showed the lowest value, with 70.99% for rambutan flower honey and 84.04% for mint flower honey. This result was consistent with the previous record of Mexican honey (65.42–85.42) and Brazilian honey (79.4–83.4) [
3,
12]. Many previous studies indicated that the low moisture levels of honey were more resistant to the fermentation process, thereby the shelf life of the honey product was enhanced [
30,
31]. The results of the moisture value could be a useful tool for beekeepers and honey producers to have appropriate methods to optimize the preservation and storage of products.
Honey is primarily acidic, largely due to its gluconic acid content, which is formed by the action of glucose oxidase (GOx) during the separation and conversion to glucose [
32]. In particular, free acidity is an indicator of interest when evaluating the quality of any honey. Free acidity represents the presence of organic acids and some other compounds in honey (lactones, esters and inorganic ions) [
33]. This index also indicates the presence of chemical components that can donate large amounts of H
+ atoms, such as proteins, phenolic acids and vitamin C [
34]. In addition, it is also a factor to help evaluate the quality and freshness of honey as the increase of this index is proportional to the time when the fermentation process of sugars into organic acids occurs. The results of the assessment of free acid content in honey in Vietnam are presented in
Table 3. The free acidity value of Vietnamese honey samples ranged from 12.79 to 48.21 meq/kg. Longan flower honey had the lowest acidity value of 12.79 meq/kg, while melaleuca honey showed the highest value of 48.21 meq/kg. Compared to manuka honey, most Vietnamese honey had the same or lower acidity.
Meanwhile, the free acidity values of coffee flower honey (35.850 meq/kg), melaleuca flower honey (48.21 meq/kg), rambutan honey (42.25 meq/kg), and honey acacia bee (41.17 meq/kg) were significantly higher than the control sample. In general, the free acidity of each analyzed sample was not greater than 50 meq/kg. This result was within the allowable limit (<50 meq/kg) according to the international honey standard (Codex Alimentarius) and the law of the European Union (<40 meq/kg). Previously, Paulic et al. (2020) also noted that the free acid content in honey samples collected in Romanian ranged from 16–31.6 meq/kg [
34]. Ömer Erturk et al. (2018) reported the free acidity value of honey samples collected in Turkey from 8.8–12.3 meq/kg [
11]. For example, when compared with longan flower honey and longan flower honey of Thailand (17.60 meq/kg and 27.84 meq/kg), the acidity value of Vietnamese honey showed lower values (12.79 meq/kg and 20.29 meq/kg) [
10]. The differences in free acidity values between different types of honey as well as between different countries could be greatly influenced by flower origin or by differences in honey harvesting time [
35]. Similar to the moisture value, the data on the free acid level was also an effective indicator for the producer to be more proactive in controlling the quality of honey products.
HMF is an important indicator used to evaluate the purity and freshness of honey. HMF, which is usually present in trace form in fresh honey, is an active ingredient produced from fructose (the sugar with the highest percentage in honey). This compound is gradually formed during storage, and its formation is faster due to heating or ageing. The HMF value is also influenced by a number of other factors such as pH, temperature, time of heat exposure of honey, storage conditions and flower source. Thus, the HMF value is an indicator to identify the freshness of honey and the quality of storage conditions [
12]. The results of HMF content, shown in
Table 3, showed that the HMF value of Vietnamese honey had a minimum level of 12.37 mg/kg (rubber leaf honey) and a maximum of 58.58 mg/kg for lychee honey. In particular, honey samples, including longan flower honey, mint flower honey, coconut flower honey, rubber leaf honey, Melaleuca flower honey, mangrove flower honey and acacia flower honey, were considerably valuable with HMF < 40 mg/kg. In contrast, the others exhibited very high HMF values (<80 mg/kg). It can be seen that all Vietnamese honeys showed the HMF levels within the allowable limits of the Codex Alimentarius Committee—the world food standard (under WHO) (<80 mg/kg—for countries in the tropical regions). HMF values in the range of 4 to 58 mg/kg and 10 to 30.8 mg/kg were reported in the evaluation of Brazilian honey and Romanian honey, respectively [
12,
34]. The HMF values of Vietnamese honey showed a statistically significant difference (
p < 0.05) among the analysed groups. This may be due to differences in flower source, harvest time and storage method of each production unit.
Monosaccharides (simple sugars—reducing sugars) make up the majority of the honey composition. Specifically, glucose and fructose account for more than 65% of total soluble solids, while the others are oligosaccharides (disaccharides, trisaccharides, tetrasaccharides—poly sugars). The results, shown in
Table 3, showed that acacia flower honey had the lowest reducing sugar content at 58.90%, and longan flower honey had the highest value at 88.60%. The results of total sugar content in longan flower honey in this study were lower than those in a previous study (87.35%) [
22]. The total sugar content was comparable to some Guinean honey (59–71%), Brazilian honey (67.6–72.4%) and Pakistani honey (61.7–72.4%) [
36,
37,
38].
Ash content is a quality criterion that can indicate the mineral content of honey and its botanical and geographical origin. The percentage of ash content of all honey samples was distributed from 0.18% to 0.64%, with a statistically significant difference (
p < 0.05). All honey in this study showed a value of <0.6%, complying with the Codex Alimentarius Commission—the World Food Standard (WHO). Overall, this result was consistent with previous reports that ash content could be used as a marker to distinguish honeys from different floral sources [
5]. In addition, it also aids in the detection of abnormalities and defects in honey processing.
3.3. Colour
Colour is a sensory property that determines the consumer’s choice of a honey product as they are immediately observable. This is also a parameter to evaluate the applicability of honey in the industry. Because lighter-coloured honeys are often used for direct consumption, darker-coloured honeys are usually used in industry due to their high nutritional value. Usually, light-coloured honeys are considerably more expensive than dark-coloured honeys [
38]. However, it has been noted that honey with a dark colour and strong flavour is preferred by people in European countries. Meanwhile, consumers in North American countries prefer honey that is lighter in colour and has a white tone because of its lighter, less intense flavour [
39]. The colour of 11 honey types evaluated by using the CIE Lab colour system method is shown in the data in
Table 5 and
Figure 1.
Apparently, the colour of honey varied from pale yellow to dark amber or black. It has been suggested that honey samples with L* > 50 will be considered light honey and those with L* ≤ 50 will be dark [
26]. The L* value represents the brightness of the sample with the value range from 0 (black) to 100 (complete whiteness). A positive b* value indicates the yellowness of the product, and a positive a* value indicates the redness. According to these colour indicators, it can be seen that the honey in this study is classified as dark honey because the L* index was from 20.87–49.96. The range of a* index was from 3.66–16.88 and the 7.41–40.47 range was assigned to b* index. In general, 7 out of 11 honey types from Vietnam exhibited yellow colour as the b* value was greater than 30. Meanwhile, melaleuca flower honey and rambutan flower honey showed L* values of 20.87 and 22.75, respectively, indicating darker colour than the others. It can be seen that Vietnamese honey showed significant variation in colour compared to previous studies on Iranian honey (L*: 18.95–21.42; a*: −0.003–0.4 and b*: 0.447–1.62), Indian honey (L* = 26.3–36.8; a* = 0.1–4.9 and b* = 3.07–14.7) and Turkish honey (L* = 27.011, a* = 2.647 and b* = 0.436) [
26,
38,
40]. Coffee flower honey (L* = 41.5; a* = 11.64 and b* = 38.45), lychee honey (L * = 35.3; a* = 16.88 and b* = 30.31) and acacia flower honey (L* = 29.03; a* = 21.17 and b* = 21.25) of Vietnam were more bright and dark yellow compared to honey collected in Guatemala with values of L* = 3.32, a* = 1.55 and b* = 1.77 for coffee flower honey, L* = 4.20; a* = 2.85 and b* = 3.08 for lychee honey, and L* = 11.97; a* = 5.19 and b* = 24.18 for acacia honey [
4]. The colour of Vietnamese acacia honey had a relatively similar colour index compared to Serbian and Romanian acacia honey [
5,
34].
Many studies have shown that honey with a darker colour has a better antioxidant effect than those with a lighter colour [
41]. Although the commercial honey samples in this study were recognized from a single flower source, more than 50% of honey from a specific flower was technically adequate to give the recognition of that honey type. The rest of other honey compositions from different origins (<50%) can be acceptable, leading to the difference in visual colour, and phytochemical constituents in commercial honey. The honey colour is highly influenced by the origin of the flower and its composition (organic and inorganic). The content of HMF, phenolic, pollen and minerals are significant factors that possibly determine the visual colour of honey [
42,
43]. Harvesting method, storage time, storage temperature, and climatic conditions also contributed to a wide variety of honey colour.
3.4. Total Phenolic and Flavonoid Content
The two most common compounds are phenolic acids (non-flavonoids) and flavonoids. Based on the carbon chain classification, 16 types of phenolic compounds have been shown to be present in honey (Gallic acid, vanillic acid, syringic acid, quercetin, caffeic acid, syringic acid, epicatechin,
p-coumaric acid, ferulic acid, rutin) [
15]. Phenolic compounds are among the most important compounds that affect not only the organoleptic characteristics but also the functional properties of honey.
The results of the analysis of the total phenolic content of commercial honey in Vietnam are presented in
Table 6. The TPC of Vietnamese honey varies from 11.61 mgGAE/100 g (HD5) to 67.14 mgGAE/100 g (HK10). Statistically significant differences were observed in the majority of different honey samples. Acacia flower honey has the largest TPC (67.14 mgGAE/100 g), followed by rambutan flower honey (65.98 mgGAE/100 g), melaleuca flower honey (63.32 mgGAE/100 g) and coffee flower honey (57.81 mgGAE/100 g). These honey samples all had higher TPC content than Manuka honey (45.05 mgGAE/100 g), indicating that they have good antioxidant potential. Daniela Pauliuc et al. (2020) reported in their study that the TPC of honey in Romania ranges from 18.9 mgGAE/100 g to 23.7 mgGAE/100 g (mint honey) [
34]. In a study of four native honeys in Malaysia, Moniruzzaman (2013) reported that sourwood honey had the highest TPC (58.03 mgGAE/100 g), followed by longan honey (56.35 mgGAE/100 g) and the lowest, especially rubber honey (14.45 mgGAE/100 g) [
29]. The total phenolic content of lychee honey (China), coffee flower honey (Guatemala) and acacia flower honey (Hungary) was recorded by Nagai’s research group (2017) as 85.2, 54.6 and 24.3 mgGAE/100 g, respectively [
4].
Similar to phenolic compounds, the flavonoids of honey are gradually becoming a criterion to help evaluate quality, distinguish plant origin, detect adulteration and evaluate their biological effects [
39]. The main flavonoids found in honey are pinocembrin, apigenin, campferol, quercetin, pinobanksin, luteolin, galangin, hesperetin and isorhamnetin [
34]. Flavonoids are best known for their mechanism of scavenging free radicals by neutralizing the radical reactive element. Therefore, honey with high TFC will show it has potential in antioxidant capacity and has a very effective use value.
As can be seen, the TFC of Vietnamese honey presented in
Table 6 has a spectrum of values ranging from 9.79 to 75.54 mgQE/100 g. Rambutan flower honey showed the highest value of 75.54 mgQE/100 g, followed by melaleuca flower honey (65.12 mgQE/100 g), acacia flower honey (57.80 mgQE/100 g), lychee flower (31.85 mgQE/100 g). The TFC value of manuka honey (44.09 mgQE/100 g) is 1.7 times lower than that of rambutan flower honey (with the highest TFC value) and 4.8 times higher than that of lychee honey (with the highest TFC value). There was a similarity in the TFC results of Vietnam mint honey (22.56 mgQE/100 g) compared with the previous report of Pauliuc (2020) when evaluating the same honey produced in Romania (25.73 mgQE/100 g) [
34]. The TFC result of acacia honey in this study (57.80 mgQE/100 g) was higher than that of honey in Malaysia (2.96–5.81 mg QE/100 g), Iran (2.71 mg QE/100 g) and China (9.14–12.17 mg QE/100 g) [
39,
44,
45]. Besides, rubber leaf honey also has a higher TFC than the study in Malaysia (1.17 mgQE/100 g) [
46]. In addition, the TFC of Vietnamese honey recorded a higher value than that of Turkey (TFC from 1.3–2.8 mgQE/100 g), Romania (0.91–15.33 mgQE/100 g) and Tunisia (9.58–22.45 mgQE/100 g) [
47,
48,
49].
The presence and variability of TPC and TFC in honeys are influenced by the plant origin, geographical factors and climatic conditions of the region. The report of the research team in China has shown a significant difference in TPC values between honeys of the same plant origin but in different geographical locations [
45]. Research by Neupane et al. on honey in Nepal has shown that honey harvested at low altitudes (800–1500 m) has lower phenol content than honey harvested at heights of 1500 m and above [
50]. An assessment of the effects of climate on honey in Kenya found a significant difference between honey produced in hot climates (35.47 mgQE/100 g) and climates with high moisture content (29.19 mg QE/100 g). Differences were also observed in TPC of honey produced in high rainfall regions (141.71 mg GAE/100 g) with honey collected in low rainfall, hot and humid climates (116.17 mg GAE/100 g) and in semiarid areas (98.37 mg GAE/100 g) [
51]. The differences between the phytochemical values reported in the reports suggest that the phenolic composition of honey acts as an effective and potential factor in the desire to compare, differentiate and trace the origin of honey.
3.5. Polyphenol Compositions
With a presence above 0.8%, polyphenol components are thought to play a role in the antioxidant capacity of honey. A close correlation between the free radical scavenging activity and the content of phenolic components was also reported. In addition, many studies have recognised phenolic acids for their ability to use these components to evaluate the quality and classify honey according to its botanical origin. The characteristics and quantity of polyphenols vary according to harvest season, climatic conditions and influencing factors during processing.
In the studied honey samples, the 13 analysed polyphenol components were mostly found in all honey samples at different concentrations (
Table 7 and
Figure 2). Gallic acid was found to have the highest value (12.50 mg/100 g) in longan flower honey, while the lowest value was found in coconut flower honey (1.03 mg/100 g). Furthermore, it was found that the control honey (manuka) had a much lower gallic acid content (0.28 mg/100 g) than the other honey samples. Compared with other types of honey, acacia honey has a high content of catechin (104.4 mg/100 g), chlorogenic acid (140.70 mg/100 g), epicatechin gallate (18.9 mg/100 g) and salicylic acid (129.25 mg/100 g). In large quantities, salicylic acid was also observed in coffee flower honey (228.13 mg/100 g) and rambutan flower honey (131.02 mg/100 g). Caffeic acid and kaempferol dominated the polyphenol composition of coffee flower honey with the highest values of 281.44 and 11.36 mg/100 g, respectively. This result shows that the caffeic acid composition is suitable for use as a distinguishing marker for coffee flower honey. This result shows the relevance and prominence of coffee flower honey when compared with the report of the Combarros-Fuertes research group (2019) which only recorded low content of caffeic acid and kaempferol on other honeys in Spain [
6]. Melaleuca honey and rambutan flower honey have the highest rutin, apigenin and quercetin content, while apigetrin predominates in lychee honey although it is found in all types of honey. Previous studies have mentioned that gallic acid is a component responsible for the antioxidant activity of honey. However, the geographical origin of honey has a great influence on the gallic acid content [
17]. Chronogenic and caffeic acid have been reported to be phenolic acids found abundantly in honey and have the potential for antibacterial function [
52].
3.6. Antioxidant Activity
Antioxidants are compounds that protect cells from damage caused by free radicals. These substances capture, stabilize, or neutralize reactive oxygen species (ROS) before they reach cells. In plant cells, chloroplasts are the main source of ROS production, whereas, in animals, mitochondria are the starting point of ROS. Here, single oxygens (
1O
2), superoxide (O
2), hydrogen peroxide (H
2O
2), hydroxyl radicals (HO) and hypochlorous acid (HOCl) were generated [
53]. Normally, these free radicals carry out the phosphorylation and signalling processes to the cell. However, increasing the chain reaction damages biomolecules and throws off the balance between prooxidant and antioxidant substances, causing a phenomenon known as oxidative stress [
54]. This phenomenon causes damage to cells, leading to the formation of a number of cardiovascular diseases, cancer and ageing. One of the solutions proposed to limit this process is the addition of exogenous antioxidant compounds from fruits, vegetables and other sources from the plant or animal kingdom. Accordingly, phenolic compounds are believed to be able to effectively scavenge free radicals by donating hydrogen atoms, electrons or metal cations as well as based on their association with acids and organic sugars [
55]. In honey, phenolic compounds play an important role in their antioxidant activity. Predicting the antioxidant activity of honey is not very effective using a single test method because the oxidation reactions of honey are very complex. Therefore, it is necessary to use at least two or more methods to increase the reliability of the test as recommended by Pentós [
56]. In this study, DPPH and ABTS free radical scavenging methods were used to evaluate the free radical scavenging ability of commercial honey in Vietnam.
The results presentId in Table”8 sh’w that the DPPH free radical scavenging activity presented according to IC
50 values ranges from 89.10 to 1285.24 mg/mL. Theoretically, a lower IC
50 value represents a better free radical scavenger hunt. In the group that may have good DPPH free radical scavenging ability, melaleuca honey has the lowest IC
50 value (89.10 mg/mL) among the remaining domestic honey samples. Next is acacia flower honey (102.95 mg/mL), rambutan flower honey (207.48 mg/mL) and coffee flower honey (300.96 mg/mL). Manuka honey has a higher IC
50 value (97.59 mg/mL) than Melaleuca honey (89.10 mg/mL), which indicates that the antioxidant effect of melaleuca honey is better than that of manuka honey. A statistically significant difference (
p < 0.05) also shows the diversity in DPPH free radical scavenging capacity as well as predicts the difference between phenolics composition in honey of different origins. A study in Turkey showed that the DPPH free radical scavenging ability of honey in this country has an IC
50 value of 20.05–152.40 mg/mL, in which chestnut honey has the best free radical scavenging capacity [
57]. In the report of Nascimento (2017), honey in Brazil has a DPPH reduction efficiency ranging from 25.45 to 294.26 mg/mL [
7]. In another record, the antioxidant activity of dark and light honey in south eastern Portugal was recorded with an average value of 68.17 and 27.24 mg/mL [
52]. In general, most honey in Vietnam has a higher IC
50 value than those found in other plant species.
For the free radical scavenging effect of honey based on the ABTS test, the antioxidant capacity was recorded by formulating a calibration curve with vitamin C. The results shown in
Table 8 show that the lowest IC
50 value obtained is 11.05 mg/mL (melaleuca honey), and the highest value is 149.49 mg/mL (longan flower honey). The obtained results show a fluctuation of IC
50 value between different types of honey. In particular, it was found that melaleuca flower honey (11.05 mg/mL) and acacia honey (11.98 mg/mL) have the ability to eliminate 50% of free radicals, almost equivalent to manuka honey. This shows that the antioxidant effect of this honey is extremely potent. In addition, the results also show that these two types of honey have more effective free radical scavenging capacity when compared with previous reports of acacia honey (44.37 mg/mL) and wild carrot honey (202.26 mg/mL) originated from Germany [
58]. The mean IC
50 determined in the ABTS test was observed to be significantly lower than the mean IC
50 determined in the DPPH test. This can be explained because the DPPH radical is only capable of reacting with lipophilic antioxidants, while the ABTS
+ radical is able to react with both hydrophilic and lipophilic states of the antioxidant [
59]. In general, it is not correct to directly compare the free radical scavenging capacity of one honey with previous data referring to another, because the reaction conditions, experimental set-up, and sample properties of each study are different. However, based on ongoing and ongoing evaluations, it can be confirmed that phenolic compounds play an important role in the antioxidant activity of honey. Although not a major source of antioxidants in the human diet, honey shows very well its potential as a supplement in the search for a variety of nutrients source of antioxidants. Above all, the pleasantly sweet taste of honey makes it easier for users to accept consumption in cases where they cannot receive antioxidants from plants.
3.7. Antibacterial
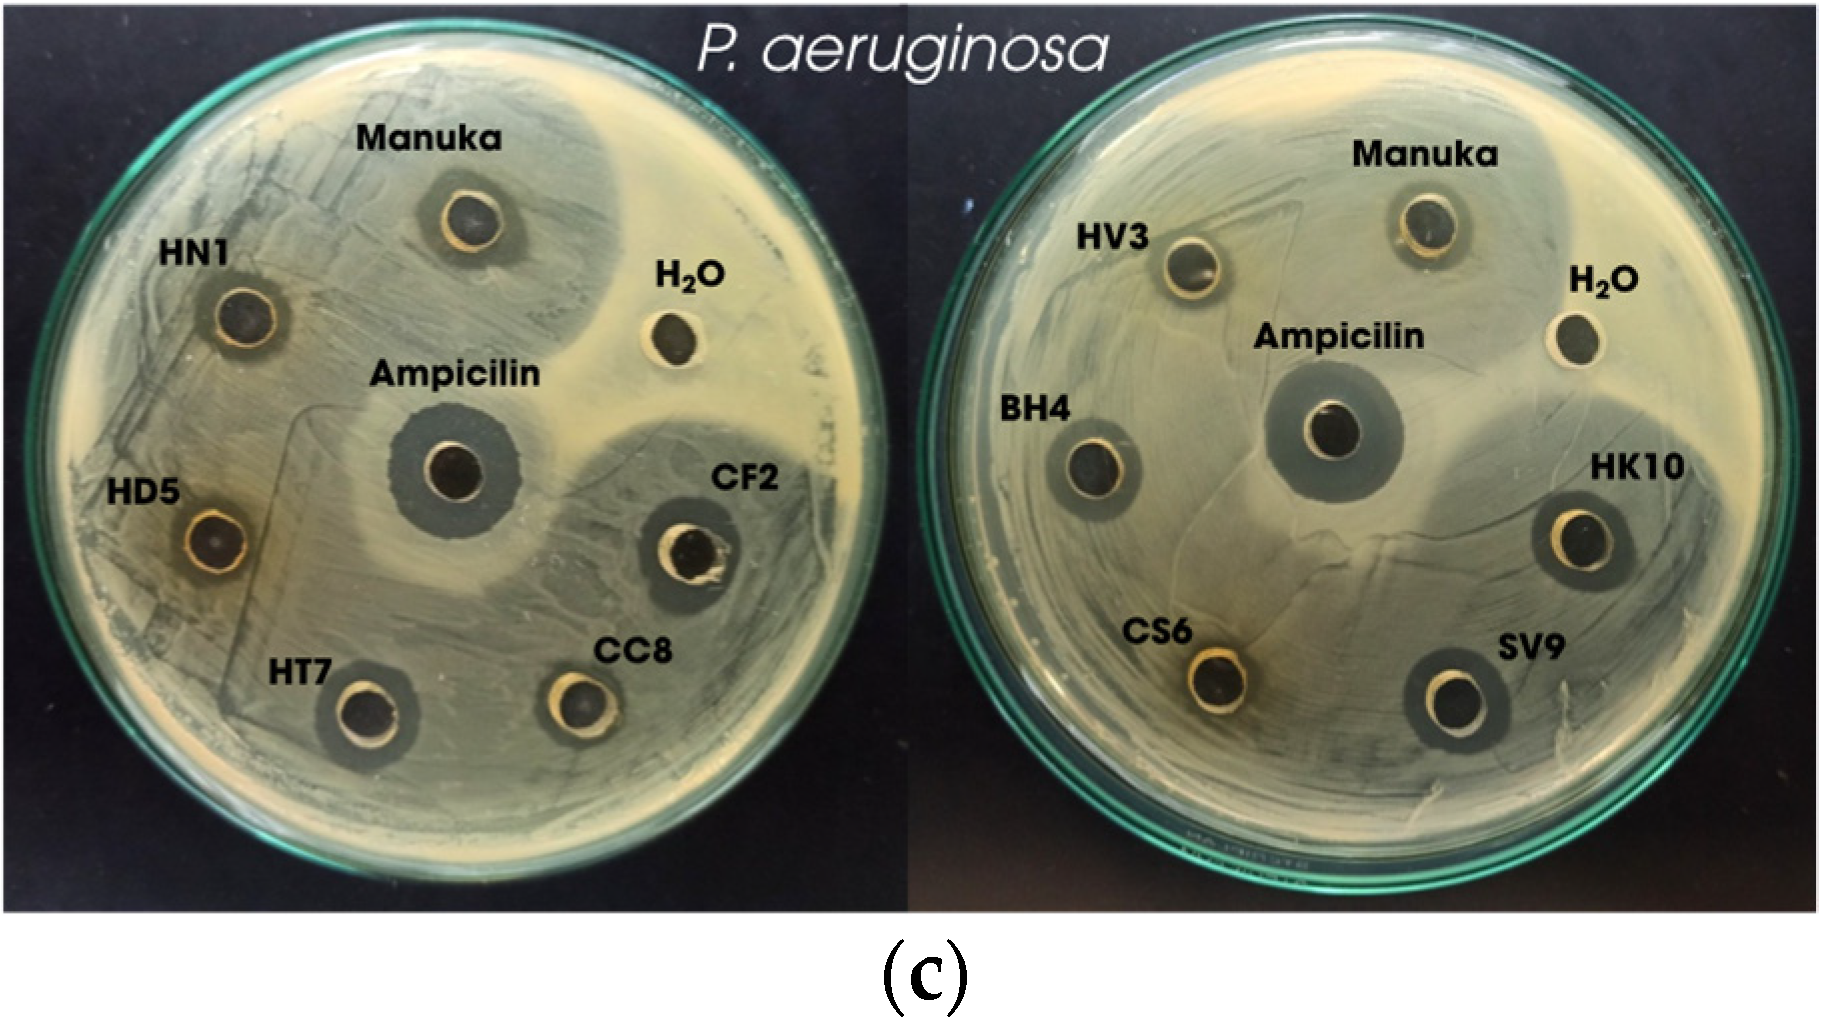
Honey is a natural product containing large amounts of phytochemical compounds such as phenolics and flavonoids with many beneficial biological health effects, including its antibacterial activity. To evaluate the antibacterial power of honey, a good diffusion test was performed to measure the zones of inhibition produced using different concentrations of honey samples against different pathogenic microorganisms. The results of the antibacterial ability assessment of honey in Vietnam are presented in
Table 9 and
Figure 3.
Observing the results, it can be seen that most of the honey samples showed moderate resistance to
E. coli,
P. aeruginosa and
S. aureus bacteria (<15 mm). For
E. coli and
P. aeruginosa, longan honey showed the best inhibition of bacteria (14 mm and 11.33 mm), while rubber honey recorded resistance to the activity of both these bacteria is weakest (10.66 mm and 9.00 mm). At the same time, the results of recording the activity of honey on
S. aureus showed that mint honey showed the most effective activity against this bacterium (11.66 mm). In contrast, rubber leaf honey has the weakest antibacterial ability of all the tested samples (9.00 mm). What is interesting to be pointed out in this study is that the majority of honey samples in Vietnam have the ability to inhibit bacteria almost similar to manuka honey. The difference in bacterial inhibition zone values is explained by the influence of osmotic effects, pH, the presence of hydrogen peroxide components and phytochemicals. In addition, it has been suggested that phenolics, flavonoids and methylglyoxal compounds are the main contributors to the antibacterial properties of honey [
60]. At the same time, there are also reports that the difference in plant origin and geographical factors such as humidity and temperature is one of the reasons for the difference in resistance to bacteria between different types of honey [
61]. The results are similar to the study reported by Kalidasan (2017) that recorded the antibacterial ring diameters of commercial honey samples on
E. coli and
S. aureus strains with values of 17 and 22 (mm), respectively [
62]. Yap (2014) conducted an evaluation of honey in Malaysia and recorded the optimal antibacterial ring diameter on strains of
E. coli and
S. aureus with values from 4.00 to 6.00 (mm) [
61]. In a study on honey in India, a perfect inhibitory effect on all three strains of
E. coli,
P. aeruginosa and
S. aureus was reported at 31–45 (mm) [
63]. Overall, the results show that Vietnamese honey is a good potential therapeutic resource for health problems caused by common bacterial strains.
3.8. Correlation
The relationship between the physicochemical composition of honeys in Vietnam is shown in
Figure 4. The correlation matrix image presents the relationship from less intimate to more intimate by the colour range from blue (−1) to red (+1). In which the positive or negative correlation between the components is expressed through the Pearson correlation coefficient (R). The results show that moisture has a very high positive correlation with free acid content (R = 0.834, red), TPC (0.764, orange), TFC (R = 0.689, orange) and the correlation inverse to Brix (R = −0.719, blue). The results are similar to the report of Harisun (2019) which noted an inverse correlation between humidity and Brix (R = −0.719); however, did not find any relationship between moisture and TPC and TFC on honey in Johor [
64]. Pentós et al. reported a positive correlation between water content and TPC (R = 0.877) when evaluated on Polish honey [
56]. The negative correlation between moisture and Brix in this study is consistent with previous reports explaining that low dissolved solids content is a consequence of high moisture levels in honey [
64]. Considering that, there is a very strong positive correlation between TPC and TFC (R = 0.901, red). This result is consistent with previous records of honey in Australia (R = 0.866), Tunisia (R = 0.915) and Malaysia (R = 0.958) [
29,
41,
48].
The negative correlation between TPC and L* (R = −0.836, blue) in this study is similar to that reported in Polish honey (R= −0.941); however, it is opposite to that reported previously on the positive relationship when evaluated on honey in Tunisia (R = 0.964) [
48]. This diversity difference shows that the amount and composition of polyphenols in honey varies and differs depending on the plant origin of the honey. The results show that, L* value is positively correlated and TPC and TFC values are negatively correlated with antioxidant capacity for both DPPH and ABTS free radical scavenging methods in this study. In particular, the results obtained in two tests, DPPH and ABTS, are presented in terms of the ability to capture 50% of free radicals, that is, the smaller the IC
50 value, the higher the antioxidant capacity. Based on that, it can be seen that the correlation value between TPC-DPPH (R = −0.870) and TPC-ABTS (R = −0.811) shows that TPC has a high correlation with DPPH free radical scavenging activity and ABTS. Similar results were also observed in honey from Tunisia (R = −0.945), Brazilian honey (R = −0.8918) [
48,
65]. However, not all studies show a strong positive correlation. For example, Raneh’s report noted that no correlation was found between TPC and DPPH and ABTS when evaluating Tualang and Kelulut honey in Malaysia [
66]. Overall, most of the results suggest that the antioxidant capacity of honey is largely influenced by the phenolic compounds it contains.
3.9. Principal Component Analysis (PCA)
Principal component analysis (PCA) assessed the differences between honey types. This multivariate analysis helps to find critical data structures as well as observed trends and magnitudes between honey types based on physicochemical properties, phenolic compounds, antioxidant activity and antibacterial ability to serve as a basis to distinguish honey from different geographical locations (
Figure 5a,b). Lines are drawn from the centre point to the respective partitions of each principal component. Accordingly, the closer the distance between the lines and the sample points, the closer the relationship between them.
Figure 5a depicts 61.51% of the variation in the data set of quality indicators, in which PC1 is the most important component when it explains 46.68% of the variation and PC2 accounts for 14.83%. The dispersion of ingredients showed variables closely related to PC1 including °Brix, total sugar, L*, total acid and moisture. The variables that dominate PC2 are HMF, °Brix, ash and water activity. The results showed that honeys including HN1, HV3, BH4, HD5, CS6, SV9 and manuka were characterized by positive values of PC1 and PC2. Specifically, the variables °Brix, total sugar, ash L* and water activity are the factors that make these honeys different. This result is in contrast to the previous report of Marijana B. Sakač (2019) that the variable L* can be used to distinguish acacia honey [
5]. This result shows that the colour difference of honey is also influenced by the growing conditions and geographical location of the plants. It is observed that lychee honey (HV3) exhibits its strong characterization with ash value. For the remaining honeys, HK10 and CC8 are characterized by positive values of PC1 and PC2. In contrast, with acid and moisture values, CF2 and HT7 were affected by negative values of PC1 and PC2, respectively.
The influence of the parameters including total phenolic and flavonoid content (TPC and TFC), antioxidant activity, antibacterial activity and phenolic components on the specificity of honeys in this study is observed in
Figure 4b. Accordingly, the PCA-biplot of the IC
50 value recorded DPPH and ABTS free radical scavenging activity towards the negative region of both PC1 and PC2. There, the presence of honeys such as HN1, HV3, BH4, HD5 and SV9 showed that they were not characterized by their antioxidant capacity. Gallic acid is a phenol shown to have effective biological activities such as antioxidant, anticancer (against prostate and cervical cancer cells) and antibacterial [
16]. This study also showed a close relationship between gallic acid and the ability to inhibit bacteria such as
S. aureus,
E. coli and
P. aeruginosa expressed through the interaction site located in the positive region of PC2 and the negative region of PC1. In this region, samples HN1, HV3 and BH4 showed a relatively close correlation with gallic acid content and antibacterial ability. Considering that coffee flower honey (CF2) and acacia flower honey (HK10) have a very close correlation with components including caffeine, kaempferol, catechin, chlorogenic acid and salicylic acid. Similarly, small gaps of variables including TFC, apigenin, quercetin and rutin can be observed for melaleuca honey (HT7). This opens up a new approach that can give coffee flower honey, acacia honey and melaleuca honey an accurate identification mark to make product traceability more convenient.

 ,
, 


