1. Introduction
Smart urban planning relies on technology and data to enhance efficiency and address multidimensional sustainability, resource management, and community engagement challenges [
1]. AI technologies play a crucial role in this, aiding traffic management, air pollution control, and energy efficiency [
2]. The integration of artificial and human intelligence is vital for tackling urbanization issues and fostering sustainable development [
3].
Decision models like DEX improve smart urban development by offering transparent and objective evaluations that consider environmental, social, and technological factors [
4]. This approach merges architectural ambitions with smart city objectives, advancing the use of decision-support systems for creating sustainable urban environments.
A & UD competitions have sparked innovation historically, giving rise to landmarks, such as the Eiffel Tower and the Sydney Opera House. These competitions, more common in Europe due to the different political and economic contexts, are integral to architectural and urban development, influencing national architectural policies [
5]. They encourage diverse design solutions, judged against a wide range of criteria, including functionality, environmental impact, and legal compliance.
An independent jury of experts, including architects, urban designers, and government representatives, selects the winning designs. This selection process, aiming to be transparent and objective, often faces challenges due to the subjective nature of architectural evaluation [
6,
7]. The reliance on intuition can make decisions seem opaque Kahneman [
8], highlighting the need for analytical tools like Multi-criteria Decision Modeling (MCDM) to ensure fairness, Howard [
9].
Our research aims to achieve the following:
The DEX method, detailed in
Section 3.2, employs symbolic variables and decision rules for evaluating urban design solutions, offering a sophisticated tool that enhances assessment accuracy and transparency in A & UD decision making. This qualitative approach is particularly suited to urban design competitions where it can articulate desired solution characteristics effectively.
The case study gains further relevance from instances where competition outcomes did not align with the established criteria, indicating that the best solutions were not consistently selected. This situation underscores the imperative for a more reliable and transparent decision-making mechanism that can better identify and champion the most appropriate and innovative designs. By integrating the DEX method, a qualitative Multi-criteria Decision Modeling (MCDM) approach, into the evaluation process, there is potential for a significant improvement. This method is designed to reduce subjective bias and enhance objectivity, ensuring that A & UD competitions can meet their stated goals effectively. The application of the DEX method within CAD software environments, as advocated by this study, aims to refine the assessment process, promoting fairness and efficiency in selecting solutions that fulfill the complex requirements of modern urban development.
1.1. Background and Related Work
Information about past and current A & UD competitions is incomplete, insufficient, and often not collected and compared [
11,
12]. Architectural and urban design competitions are valuable tools for both education and professional practice in the field of architecture [
1]. They also serve as a rich source of empirical data for research, shedding light on the complexities of architectural practice and the societal changes it reflects [
13]. In the context of urban design, competitions play a crucial role in shaping public spaces and the built environment, offering a platform for professionals to propose diverse solutions [
11,
14]. However, there are challenges in ensuring the quality and development of these competitions, particularly in terms of project selection and the creation of specifications [
15,
16]. The positive qualities of A & UD competitions around the world have been confirmed many times [
17].
A range of studies have identified key challenges in architectural and urban design competitions, including fairness, transparency, and consistency in the process [
9,
12,
18]. These challenges are particularly pronounced in the context of dialogue-based competitions where the need for continuous learning and rational decision making is emphasized [
14,
19]. The assessment of architectural quality in these competitions is also a complex issue, influenced by contextual factors and the judgment of jury members [
20]. Furthermore, the need for fairness in the design of computer-based performance assessments, particularly in ensuring task comparability and difficulty, has been highlighted [
15,
21]. The negative aspects occur at two levels. The first set of problems relates to the implementation of evaluation, and the second is ethical concerns. Torres, Froncek [
22,
23] both highlight the potential for ethical dilemmas in stakeholder selection and participation, with Froncek specifically noting the role of stakeholders’ perceptions of justice in mediating these negative effects. Simons [
24] further underscores the complexity of ethical decision making in evaluation, emphasizing the need to balance various social, personal, and political factors. Bamberger [
25] extends this discussion to international settings where the involvement of stakeholders and respect for local customs and values are particularly salient ethical issues. The negative aspects include transparency in the selection of participating teams (in the case of closed competitions), the disclosure of the client’s wishes to the participating teams, and financial compensation compared to the amount of work, the composition of the jury, and the objectivity of the evaluation of alternative project solutions [
26].
1.2. International Experience with Architectural and Urban Design Competitions
Architectuur Lokaal, a non-profit foundation based in the Netherlands, focuses on fostering transparent procurement processes for A & UD across Europe [
27]. Its 2017 report, “Competitive Culture in Europe 2013–2016”, aimed to compare the competitive cultures in different European countries, identifying both differences and similarities [
28].
The report found significant variation in A & UD competition cultures, including how competitions are segmented, jury and participant approaches to spatial issues, development of spatial alternatives, and jury decision-making and evaluation processes [
28]. It noted the impact of central oversight organizations (like chambers or associations) on competition culture, emphasizing that their presence does not guarantee transparency or fairness, particularly concerning non-member participation.
Jury operations, including meetings and decision making, are facilitated by a competition administrator, with the jury chair or vice chair (in their absence) leading. Legal frameworks prescribe the jury’s composition, including member selection and expert representation, which experts have critiqued for influencing competition conduct. The reliance on public funding for A & UD competitions also significantly affects their execution.
In the private sector, legal constraints may affect the awarding of competition projects, with juries sometimes altering prize distributions, requiring unanimous agreement. The evaluation criteria for submissions are predefined, focusing on human evaluation, decision making in design, types of decision problems in spatial solution design, and the relevant subjective and objective criteria.
1.3. A & UD Competitions as an (Interdisciplinary) Research Topic
Historical analyses of architecture and urban design (A & UD) competitions have been scarce, with few attempts to observe or evaluate the selection processes [
29]. Collins explored legal and architectural judgments in the early 1970s without delving into their scientific implications [
30]. Spreiregen highlighted the dual purpose of competition: selecting the best solution and the executor [
12]. Most of the literature on A & UD competitions focuses on the diversity of entries and jury deliberations [
5,
31] or discusses the competitions’ aims and challenges historically [
11,
12], assessing the impact on the profession [
5,
14]. However, the perspectives of clients and future users are often overlooked [
32,
33].
A & UD competitions have recently emerged as a subject of interdisciplinary research, aiming to advance the profession [
18,
20]. Studies typically examine the decision-making processes and the competitions’ contributions to architectural quality [
16,
34,
35,
36], emphasizing the jury’s expertise and consensus-building as critical to selecting winners. The theory of communication functions is proposed as a method to enhance the evaluation and understanding of competition entries, offering new insights into the negotiation and dialogue involved [
13,
36].
The growing interest in A & UD competitions is reflected in the increase in scientific conferences and research, treating competitions as rich sources of data and insights into architectural and urban design. This research not only enriches educational content but also serves as a platform for examining social, technical, and organizational changes within the field.
1.4. A & UD Competition Decision Making with the Help of Technology
The integration of technology in A & UD competitions, particularly through Building Information Modeling (BIM), represents a significant shift in how decisions are made, projects are evaluated, and competitions are organized. BIM, a comprehensive process for creating and managing information on a construction project across its life cycle, incorporates multidisciplinary data to craft a digital representation of the asset from inception to operation [
37]. This technology has revolutionized the architecture and construction industries by introducing new materials, concepts, and ICT-based communication, although its acceptance varies among professionals Sørensen [
38].
Research in engineering and construction has explored multi-criteria methods for system evaluations, often focusing on economic [
39,
40] and environmental considerations [
41,
42]. The MIVES method [
43], for instance, utilizes value functions for sustainable evaluation in construction, reducing subjectivity in decision making for industrial buildings and spatial interventions. It has been applied to environmental assessments, infrastructure projects, and emergency shelter siting after natural disasters, employing multi-criteria decision making (MCDM) and multi-attribute utility theory (MAUT) to weigh options through the analytic hierarchy process (AHP) [
44,
45,
46,
47,
48,
49].
In Slovenia, multi-criteria methods have informed decisions on construction projects, including the location of the NSRAO landfill using the DECMAK and DEX programs [
50] and tunnel design and management [
51]. The Slovenian Ministry of Environment and Spatial Planning utilized a DEX-based multi-criteria evaluation for the Port of Koper urban design competition [
52]. Previous research proposed new methods for evaluating A & UD projects transparently and objectively, comparing MCDM methods like the PMI and ABACON, and testing hierarchical approaches like the Kepner–Tregoe (K-T) and hierarchical MAUT methods. This research highlighted the suitability of the MAUT method for A & UD competitions due to its flexibility, repeatability, and modularity, facilitating its integration with digital simulation tools in CAD environments [
53,
54].
1.5. Integrating the DEX Model in Smart City Urban Design: Enhancing Decision Making for Sustainable and Livable Environments
According to the study on multi-criteria methods [
53], the use of multi-criteria decision-making methods is a direct way to rank competing spatial project solutions. This method makes it easy to prepare and apply and allows a consistent and uniform evaluation of the spatial project alternatives based on the selected criteria for evaluation. In addition, a proposed input data preparation method provides tools to measure relevant quantitative data from 3D models of competing project alternatives directly, simplifying and accelerating the analysis and evaluation. The study concludes with key findings that emphasize the transformative impact of the DEX method on A & UD competitions. It validates that DEX significantly improves objectivity and transparency in evaluating design proposals and overcomes the subjective biases associated with traditional jury evaluations. The research suggests that the integration of DEX into the CAD environment simplifies the decision-making process and enables a more dynamic and interactive evaluation. The study not only argues for a paradigm shift in the evaluation of A & UD competitions but also proposes a scalable model applicable to wider smart urban planning and policymaking, potentially redefining the future of urban development.
How effective is the integration of the DEX (Decision EXpert) decision-modeling method into the evaluation process of A & UD competitions in enhancing decision-making transparency, objectivity, and efficiency?
2. Materials and Methods
In the realm of A & UD competitions, it is paramount to recognize that every instance presents its own unique set of conditions and challenges. This uniqueness stems from a multitude of factors including the competition’s geographical location, cultural context, intended function of the structure, and specific goals set forth by the organizers. Such diversity necessitates a tailored approach for each competition, underscoring the inherent complexity and uniqueness of each case.
Despite this variability, a core set of criteria emerges as indicators that transcend the specific details of individual competitions. These universal criteria often encompass aspects such as sustainability, innovation, aesthetic appeal, cost-effectiveness, and integration with the surrounding environment. They serve as a foundational framework upon which the evaluation of submissions can be based, providing a common language for assessing architectural proposals.
Conversely, alongside these shared criteria, there are specific requirements unique to each competition that reflect its objectives and context. These might include, for example, a focus on heritage preservation in a historic district, or the integration of smart technology in a new development. Such criteria are tailored to elicit responses that address the nuanced needs of the project at hand.
The criteria, whether universal or specific, function as indicators within the evaluation process. They are tools for measurement and comparison, designed to guide the judgment of the jury in identifying proposals that most effectively meet the competition’s goals. However, the application of these criteria is far from straightforward. The complexity arises from the need to balance a broad range of considerations, from the practical to the visionary, in a way that aligns with the competition’s objectives while also pushing the boundaries of architectural innovation.
Understanding the intricate balance between universal and specific criteria, and the role they play in the complex ecosystem of A & UD competitions, is crucial. This nuanced approach to criteria selection and application underscores the sophisticated nature of A & UD competitions, highlighting the challenges involved in evaluating diverse and innovative design proposals. It is through this lens that we can appreciate the multifaceted nature of A & UD competitions where each case is a unique convergence of universal aspirations and specific, contextual demands.
2.1. Multi-Criteria Decision-Modeling Methods
Multi-criteria Decision Modeling (MCDM) is a general approach that deals with structuring and solving decision problems that involve multiple and conflicting criteria Greco [
55]. MCDM provides methods and means to obtain preference information from one or more decision makers and represent it in the form of a decision model. The model is used to evaluate decision alternatives concerning multiple criteria and aggregate these partial scores in the final assessment of each alternative. Based on this, the alternatives can be ranked, and the best alternative can be selected. In addition, various algorithms, such as the sensitivity of “what-if” analysis algorithms, can be used with the model to reason about and explain the evaluation results.
There are a variety of MCDM methods (including PIM, ABACON, K-T, and MAUT mentioned above) that differ in how they represent evaluation criteria and aggregation rules and how they obtain preference information from decision makers. The readers are referred to Greco et al. [
55], Ishizaka and Nemery [
56], Kulkarni [
57], Sharma [
58], Hawgood [
59], Kepner and Tregoe [
60], and Keeney and Raiffa [
61] for an overview of MCDM methods.
It should also be noted that the vast majority of MCDM methods define the decision model (or some of its parts) by a linear aggregation function of the following form:
where it and w_i are numbers representing the criteria values and their weights, respectively, and n is the number of criteria in the given context (the entire model or its parts). The larger the weight, the more influential the corresponding criterion. The variables are often referred to as attributes, hence the terms multi-attribute decision modeling (MADM) and multi-attribute models.
2.2. DEX: A Qualitative MCDM Method
The DEX method is a qualitative multi-criteria modeling method [
62,
63]. Its main feature is that it uses symbolic attributes instead of numeric ones. The allowed values of these attributes are represented by words, such as tall, old, new, diverse, branched, appropriate, and so on. It should be emphasized that symbolic attributes cannot be counted in the same way as numeric ones, which also affects the so-called utility or aggregation functions, that is, functions that aggregate the values of multiple input attributes in the final evaluation of decision alternatives. Instead of the weight sums of the MAUT and similar methods (see Equation (1)), aggregation functions in DEX are defined using decision tables: collections of elementary “if–then” decision rules [
63].
DEX models are hierarchical: a model consists of a hierarchy (usually a tree) of attributes. Each attribute represents an observed property of decision alternatives. Attributes higher in the hierarchy depend on attributes at lower levels. The final attributes (“leaves” of the hierarchy) represent properties observed directly at each alternative. Alternatives are evaluated by a bottom-up aggregation of these input properties toward the end nodes to the top (or “root”) attribute, which represents the overall evaluation result.
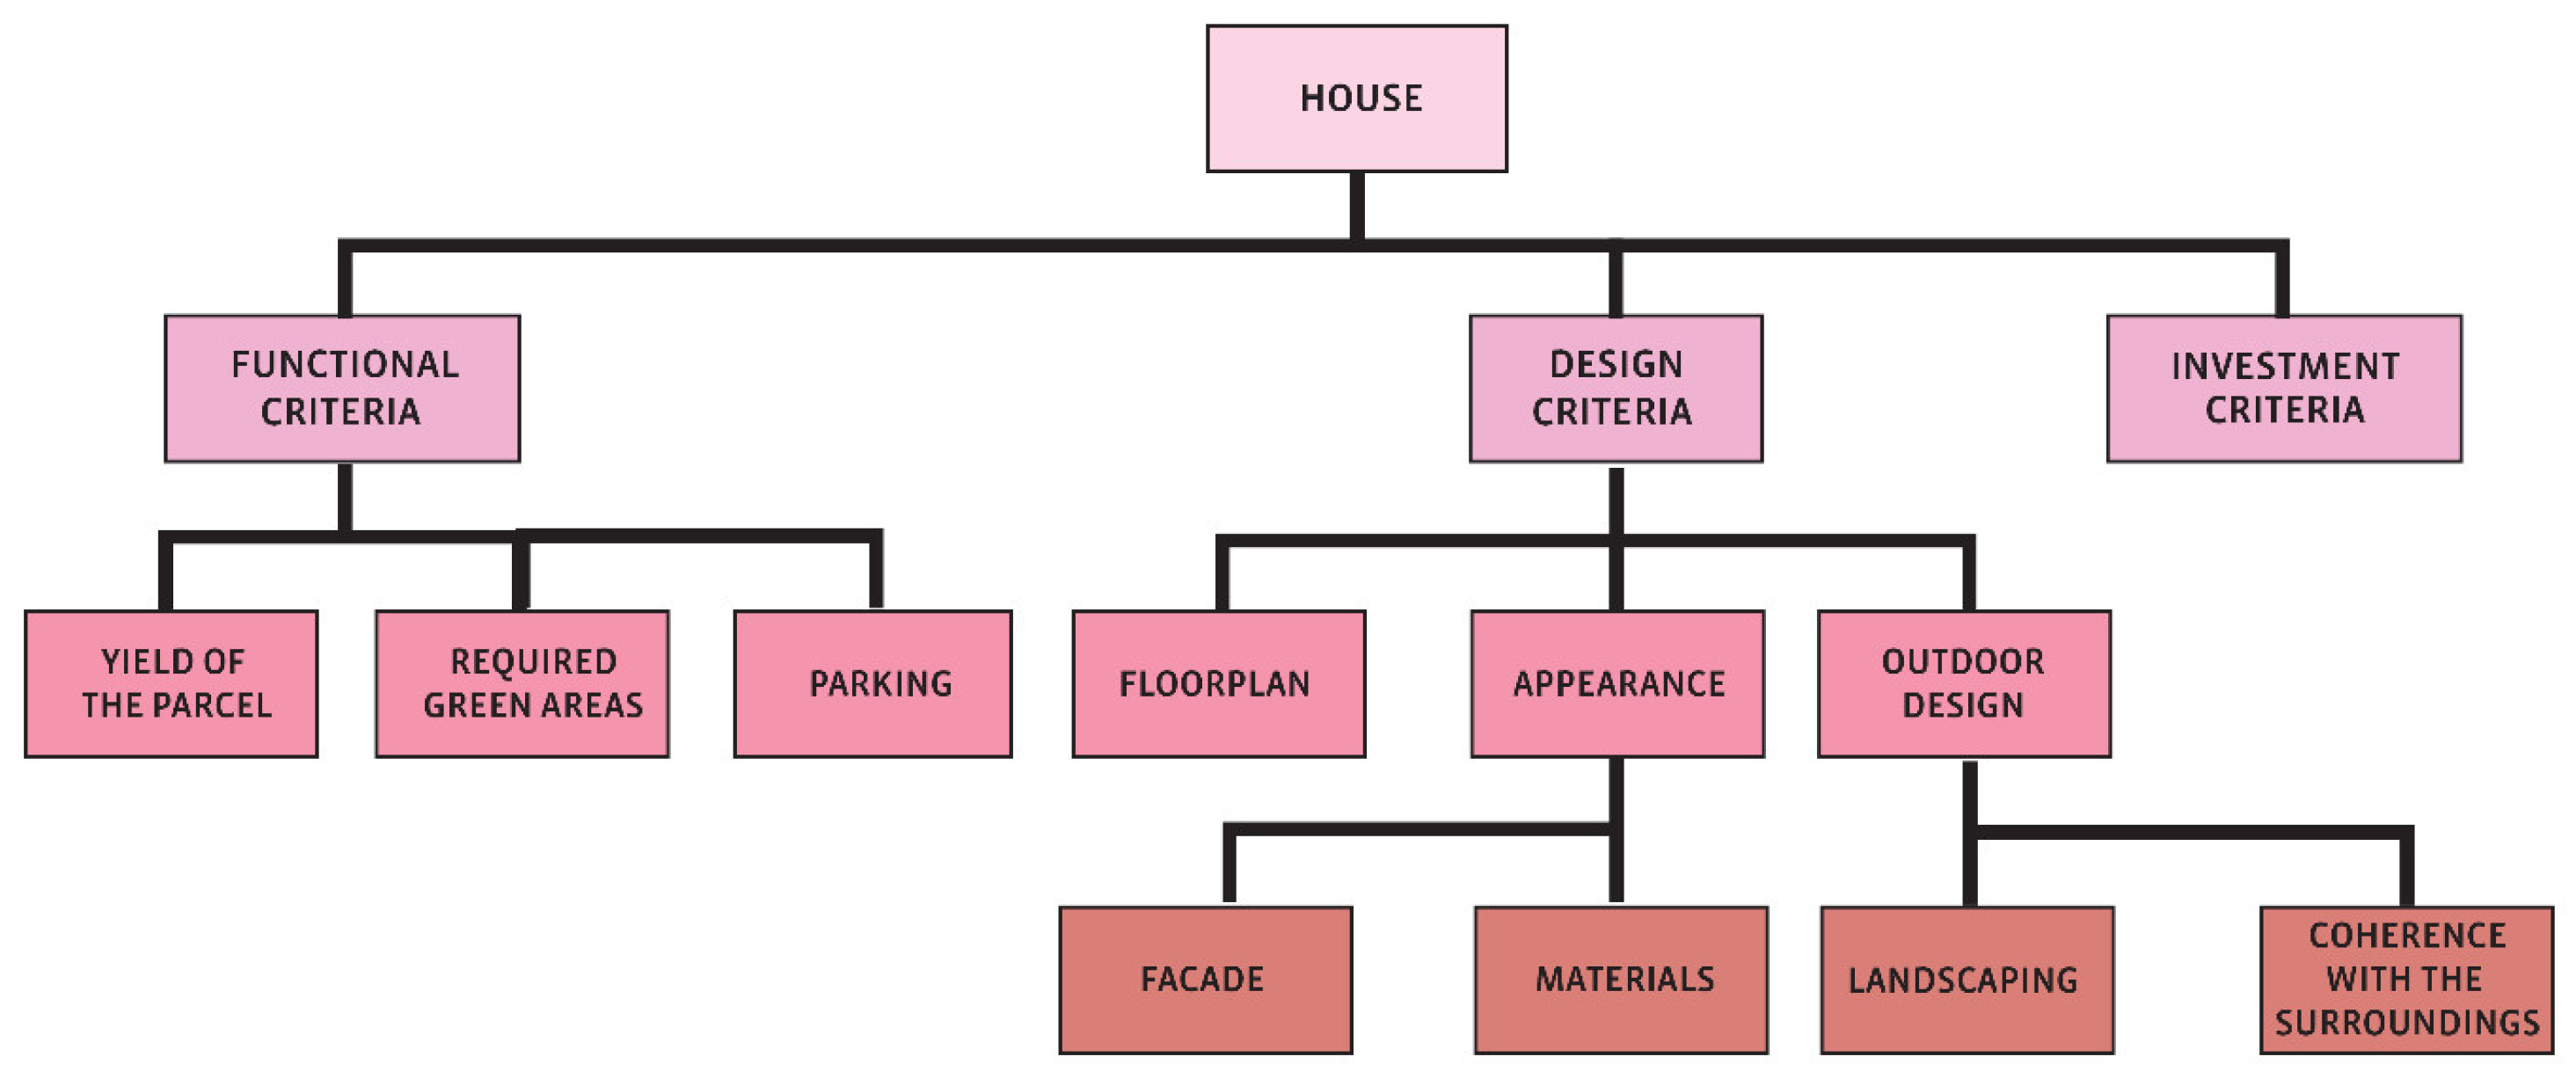
Figure 1 shows an example of such a hierarchy, aimed at the evaluation of houses. The root attribute HOUSE is subdivided into three subtrees: FUNCTIONAL CRITERIA, DESIGN CRITERIA, and INVESTMENT CRITERIA. Two of these are further decomposed, yielding six attributes at the next level: YIELD OF THE PARCEL, REQUIRED GREEN AREAS, PARKING, FLOORPLAN, APPEARANCE, and OUTDOOR DESIGN. The latter two are further decomposed, yielding the leaves FAÇADE, MATERIALS, LANDSCAPING, and COHERENCE WITH THE SURROUNDINGS.
These attributes are defined as follows:
FUNCTIONAL CRITERIA is a subset of the quantitative criteria associated with the legal criteria specified by the state and local (municipal) spatial planning acts.
YIELD OF THE BUILDING PARCEL, according to the Decree on the Spatial Order of Slovenia [
64], is the plot utilization factor as the quotient of the gross floor area of all above- and below-ground floors of the building and the area of the building plots.
REQUIRED GREEN AREAS: The factor of required green areas, according to the Decree on the Spatial Order of Slovenia (ibid.), is a construction factor that results from the ratio between the built-up area and the total area of the building plot. The part of the plot that is not built on must be greened, and sometimes even the number of trees is prescribed.
PARKING: The parking criterion is the ratio between the number of parking spaces and the number of housing units. The number of guaranteed covered parking spaces and outdoor parking spaces varies from case to case and is determined by various ordinances and laws in Slovenia.
DESIGN CRITERIA is a group of qualitative criteria that have the greatest weight in the evaluation of the project solution. Their evaluation is subjective and, therefore, often controversial or unclear. For this reason, they are usually divided into several subcategories.
FLOORPLAN decides the quality and flexibility of the floorplan design of an individual building or individual (residential) units.
The appearance of a building is crucial to its acceptance within a community and for the “pride” it inspires in its inhabitants.
FAÇADE and the materiality of the façade membrane, harmony with the surroundings, and the overall appearance of the building or house in this case.
MATERIALS evaluates the maintenance and durability of materials used throughout the building.
OUTDOOR DESIGN is defined as landscape aesthetics, the horticulture of a site, and the specific landscape features and plants therein. It includes practical and environmental aspects of landscape design.
DESIGN OF EXTERIOR SURFACES evaluates the design quality of common and public green or paved land.
COHERENCE WITH SURROUNDINGS evaluates the harmony between the new building and the surrounding space according to uniform principles.
INVESTMENT CRITERIA focuses on the investment data, from which it is possible to derive various relations between the price of the investment and the number of residential units, the price of the individual parts of the building (common areas, garage, and green areas), and, finally, the prices of the individual (residential) units concerning the overall competitive solution or similar offers.
For each of the attributes described above, the model also prescribes the value scale, that is, the set of allowed qualitative values that can be assigned to each attribute. Each value is represented by a word. Thus, the DEX method is limited to the use of symbolic attributes. This type of evaluation is closer to human decision making because people are naturally inclined to use symbolic evaluations instead of numbers.
Value scales in the DEX attributes are small and typically consist of up to five values. For example, the value scales of the top four attributes in
Figure 1 are defined as follows:
HOUSE: unacceptable, acceptable, good, excellent.
FUNCTIONAL CRITERIA: fulfilled, unfulfilled.
DESIGN CRITERIA: appealing, average, poor.
INVESTMENT CRITERIA: acceptable, adequate, poor, unacceptable.
The aggregation of values is defined in the DEX method in terms of decision rules grouped in a decision table.
Table 1 shows an example of a decision table located at the top of the tree (
Figure 1) that aggregates the values of FUNCTIONAL, DESIGN, and INVESTMENT CRITERIA into the value of HOUSE. Each row of the table contains the so-called elementary decision rule that defines the value of HOUSE for some combinations of values of the three subordinate criteria. For example, elementary rule number 4 states that if FUNCTIONAL CRITERIA = fulfilled and DESIGN CRITERIA = appealing and INVESTMENT CRITERIA = poor, then HOUSE = good. The remaining rules then define the value of HOUSE for other input value combinations.
A DEX decision table is a qualitative equivalent of the quantitative aggregation function (Equation (1)). Instead of numerical aggregation using weights, a decision table defines the aggregation function point by point.
For each internal node of a DEX model, a decision table, such as the one in
Table 1, must be defined. Thus, in addition to the HOUSE table shown in
Table 1, the model from
Figure 1 contains five additional decision tables corresponding to the attributes FUNCTIONAL CRITERIA, DESIGN CRITERIA, INVESTMENT CRITERIA, APPEARANCE, and OUTDOOR DESIGN. These decision tables are not shown here.
The development of DEX models Is supported by software called DEXi [
65]. DEXi helps the model designer graphically represent the structure of attributes, define their value scales, and especially define decision tables that would have been very tedious if defined “manually”. DEXi prepares the table structure, monitors the consistency of the decision rules and the completeness of the decision table during its creation, and automatically fills in rule values that can be derived from other rules already defined (ibid.). After developing the model and defining decision alternatives, DEXi also evaluates the alternatives and provides various interactive decision analytic tools: comparison of alternatives, plus–minus-1 analysis, selective explanation, and option generation.
2.3. Architectural and Urban Design Simulation and Use of CAD Tools
Architects use CAD (computer-aided design) programs for their work, adapted to different scales, accuracy, and data formats. There is always a need to simulate the proposed project solutions and the environment. With increasing computing power and a combination of data processing techniques, the limits of software use at different scales are slowly disappearing. Whereas BIM systems focus on developing objects with the greatest geometric accuracy, geographic information systems (GISs) are used to analyze objects that already exist around us in the most abstract way [
66]. For example, the most common GIS software, ESRI ArcGIS, which has always worked with large spatial datasets in a wider geographical area (region, country, or world), is gradually integrating detailed three-dimensional and BIM project program functions.
The selection of the most suitable software requires support for three-dimensional modeling; the ability to analyze three-dimensional models; the ability to read different data formats, especially the ability to read different GIS databases; broad support for both the software and the user; and a relatively easy way to change settings and add properties to the program without having to write any code. Given the complex requirements and available criteria, the choice is slim. We reviewed the available software and identified its main strengths and weaknesses through a SWOT analysis (ibid.). This allows us to select programs in which simulation can be performed to evaluate spatial solutions.
For this study, we had to choose a specific CAD software that allows coding without code so we could adapt it to our needs. We chose Rhinoceros 6 software [
10]. Rhinoceros 6 is a three-dimensional modeling program whose integral component is the Grasshopper plug-in. Grasshopper is a visual programming language (VPL) interface that allows modules to be combined without coding. With Grasshopper, it is possible to apply multi-criteria models to analyze and make decisions in a 3D modeling setting and deal with spatial data.
The plug-ins for Rhinoceros 6 also allow the analysis and transfer of spatial data into a three-dimensional modeling environment, which becomes the core where all data and programs meet and complement each other. The modeling algorithm obtained is modular, and we can add or subtract additional or evaluation criteria, superfluous or desired, as needed. It is important to emphasize that the modeling algorithm can be turned on during the design process itself, and depending on the values obtained, it encourages the designer to optimize spatial solutions at any stage of the design process.
2.4. Using DEX in the CAD Environment
This research aims to apply the DEX method directly in the CAD environment. For this purpose, it is necessary to find a way to establish a method for evaluation with symbolic parameters in a virtual three-dimensional space using the available visual programming tools. The CAD solution should also provide algorithms for the evaluation and analysis of decision alternatives.
A visual programming environment based on the Rhinoceros 6 platform and the Grasshopper plugin is a widely used design method in which custom elements (modules) have mathematical properties or can be given certain properties to form rules or graphic elements. These elements are entered into the database of the parametric program, which can design, modify, analyze, or evaluate new designs based on commands, rules, and mathematical laws. The rules determine how the elements are used and modified, and how they affect each other. The Grasshopper tool is used to create algorithms based on the selected criteria, the results of which define the decision-making processes based on the decision models developed.
Crucial to the functionality of the decision model developed is to prepare all input data (the building information and the DEX model) and implement it in Rhinoceros 3D/Grasshopper software, which integrates and visualizes these data in the CAD environment based on the methodology developed. For evaluating spatial solutions using DEX models, the same criteria as for the competition jury can be used and included in the evaluation model, with the possibility of developing and adding new criteria or removing previous ones as needed.
We applied the proposed DEX/CAD approach to the usage case of the closed, public, project-based, open, anonymous, single-stage A & UD competition announced in 2012 by ZAPS (the Chamber of Architecture and Spatial Planning of Slovenia) for residential blocks with outdoor facilities at the Polje III site in Ljubljana. The subject of the A & UD competition was the arrangement of subsidized rental apartments on a neighborhood scale with a simultaneous arrangement of an appropriate number of indoor and outdoor parking spaces on a plot of 9167 m
2. The area within the building line (area of the building plots) is 8487.50 m
2. The tender documents for the competition for Polje III, Ljubljana 6 [
67], list all the starting points for the design. The solutions must consider the prescribed building factor of 30%. The composition of the building volumes, the height dimensions, and the arrangement of the open spaces must be in harmony with the surrounding buildings and facilities. The project solutions must consider that the construction of a residential building intended exclusively for the beneficiaries for rent is planned in the following ratio:
Two-thirds of the apartments shall be subsidized rentals.
One-third of the apartments shall be intended for disabled people.
An underground garage is to be provided for the housing program of the building complex. The solutions must also provide the following number of parking spaces:
Two residential parking spaces, including visitor parking (i.e., one parking space in the garage + one parking space on the ground floor).
One parking space per three residential units + 10% for visitors (of which one parking space per three residential units in the garage and the remaining 10% on the ground floor).
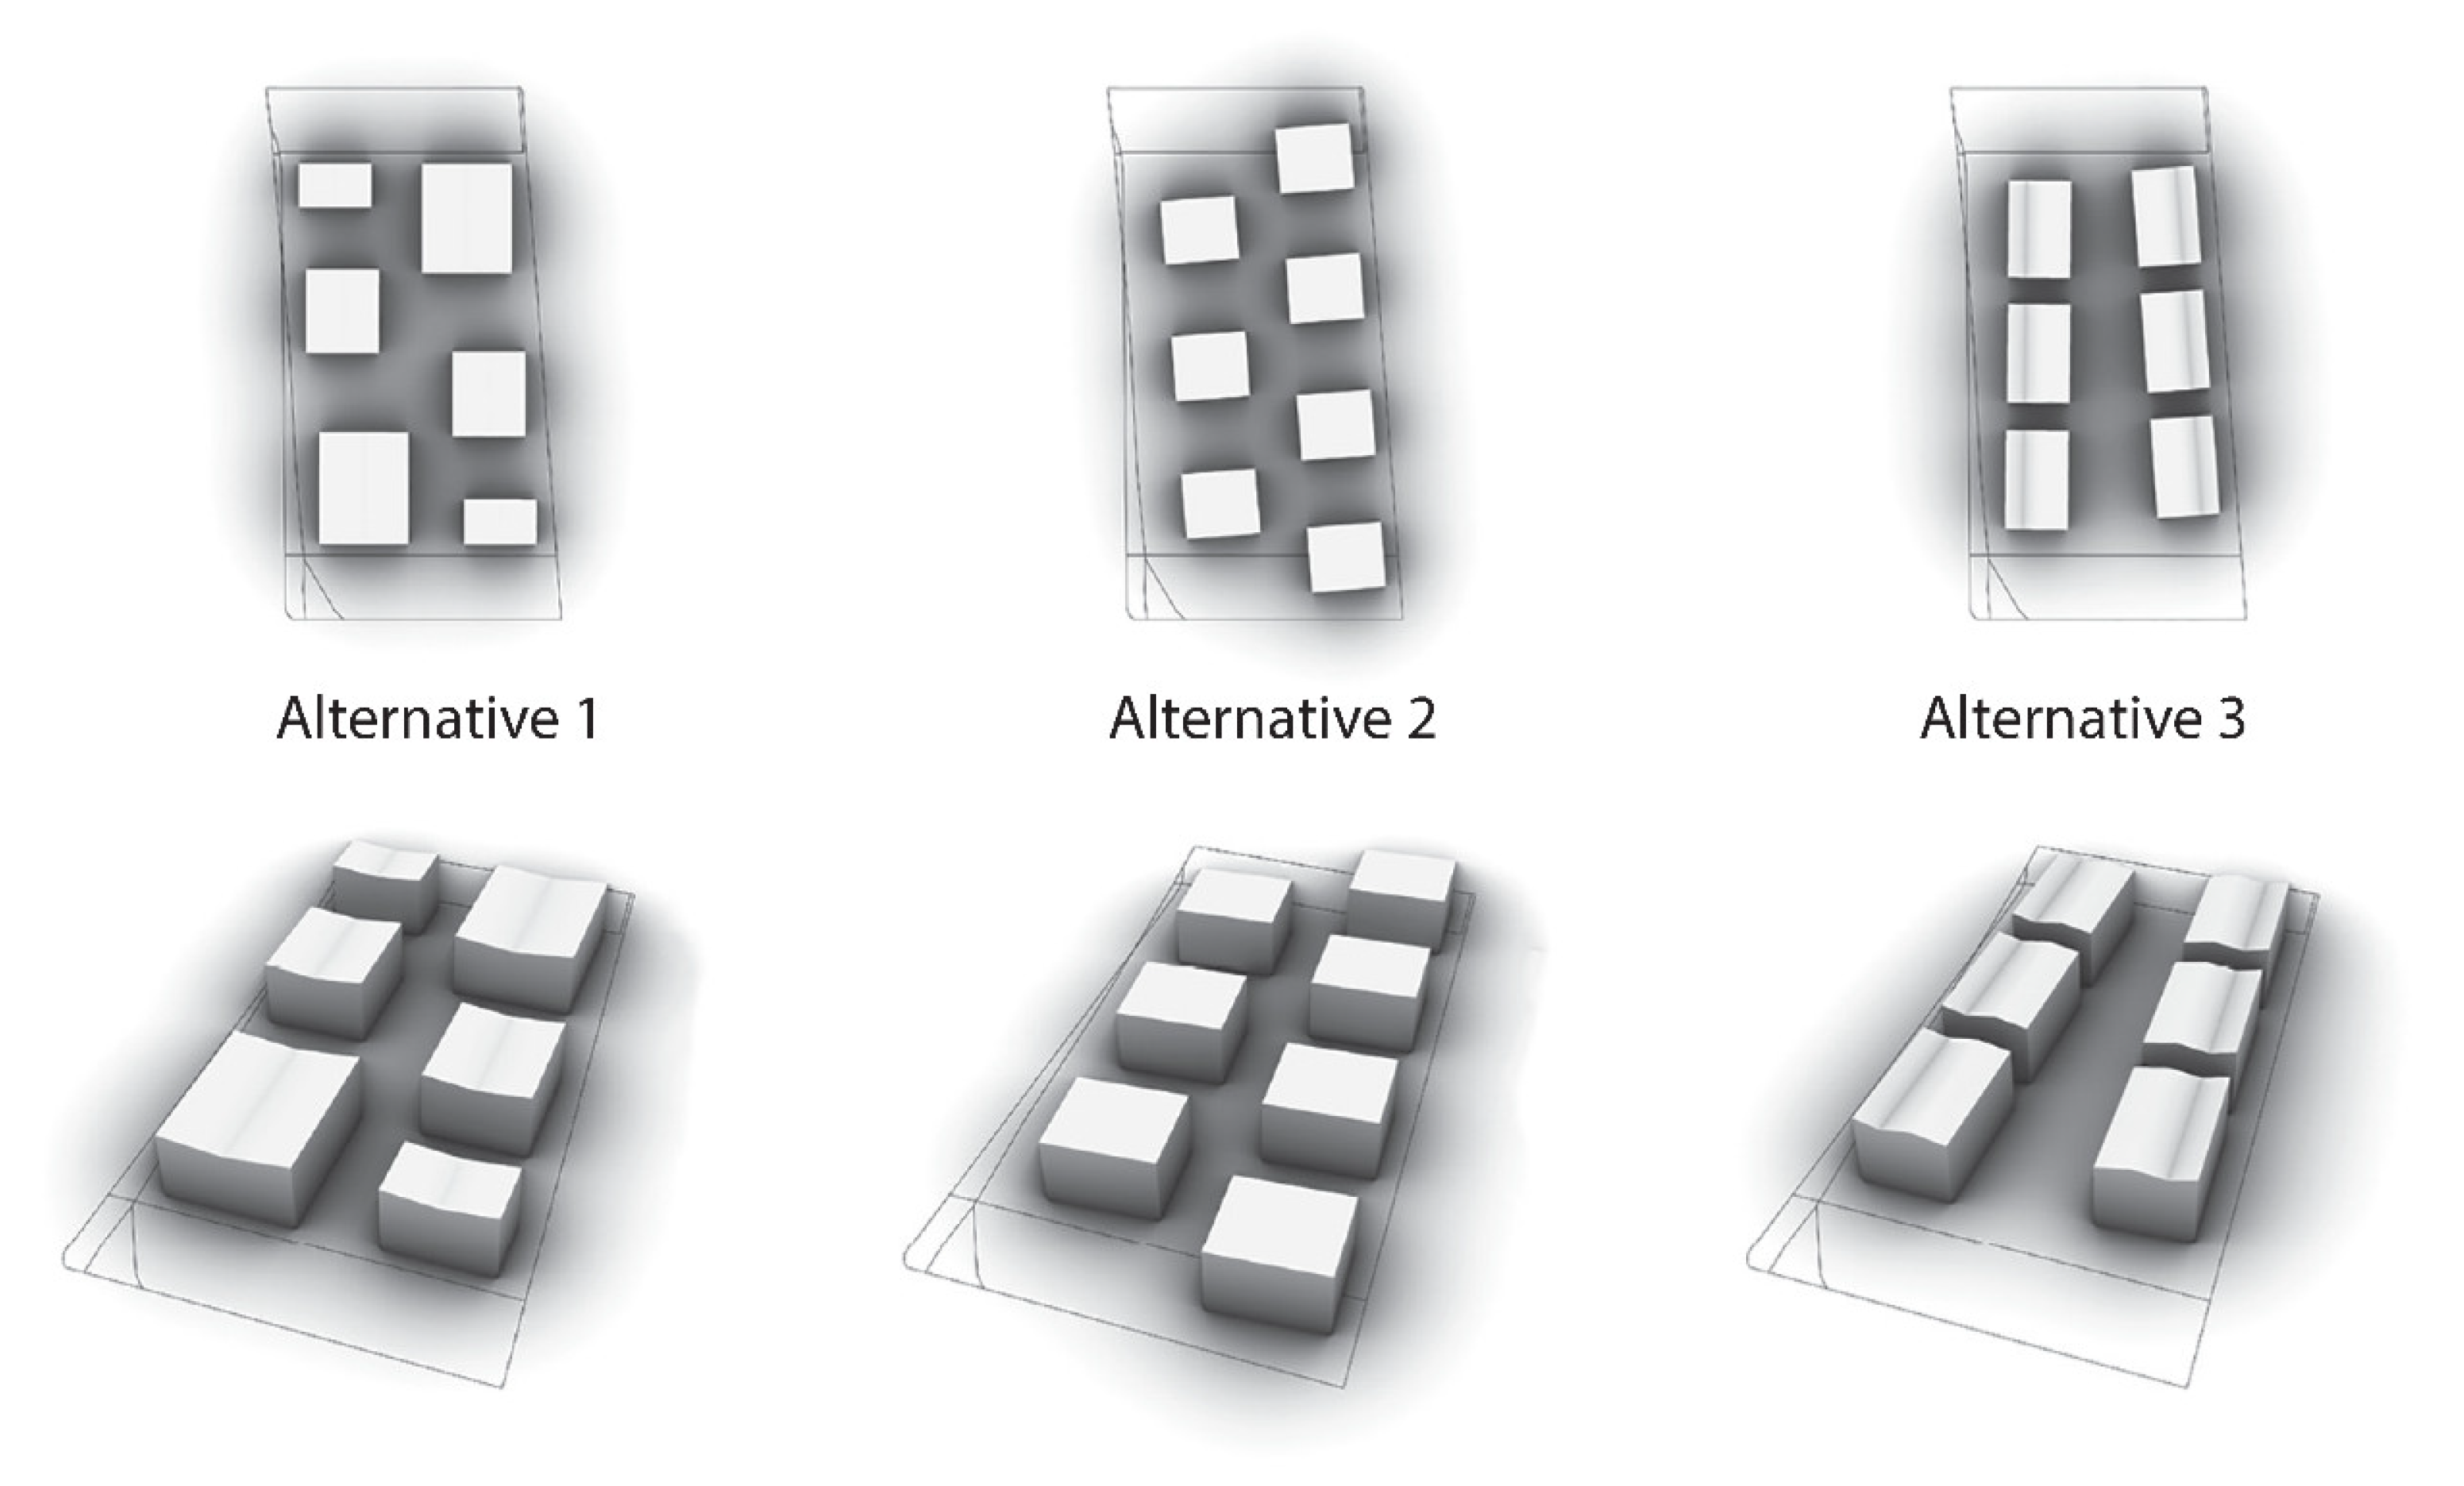
In our case, we considered three alternatives (
Figure 2):
Alternative 1: This is a real estate development project with ninety-eight residential units in six buildings. The project includes 212 parking spaces, of which 114 are covered and 98 are outdoors, for an average of 2.16 parking spaces per residential unit. The total cost of the project is EUR 15,448,253, with an average price per residential unit of EUR 157,635. The cost of the garages is EUR 3,853,928; for the outdoor facilities, EUR 1,963,366; and for the apartments, EUR 9,603,959. The functional criteria for the first alternative have an area ratio of 1.08. An area coverage (maximum 0.3) is 0.268. The area index is 3.449, and the density is 274.
Alternative 2: The second alternative is a development project with 119 residential units in 7 buildings. The plans call for 206 parking spaces with an average of 1.73 spaces per residential unit. There are 107 covered parking spaces and 99 are outdoors. The total price of the project is EUR 14,590,272. The average price per residential unit is EUR 122,607. The cost of the garage is EUR 3,779,410, the cost of the outdoor facilities is EUR 2,026,890, and the cost of the apartments is EUR 8,783,972. The second alternative meets the functional criteria with an area ratio of 0.98, an area coverage (maximum 0.3) of 0.245, an area index of 2.99, and a density of 332.
Alternative 3: The third development project is developed in 6 buildings with 138 residential units. There are 194 parking spaces with an average of 1.4 parking spaces per residential unit. There are 113 covered parking spaces and 81 outdoors. The total price of the project is EUR 16,230,830. The average price per residential unit is EUR 117,614. The cost of the garage is EUR 3,921,885. The cost of the outdoor facilities is EUR 1,905,424, and the cost of the apartments is EUR 10,403,521. The third alternative meets the functional requirements with an area ratio of 1.16, a coverage of 0.29 (with a maximum of 0.3), an area index of 3.42, and a density of 333.
Data from architecture or urban models can also be efficiently gathered through integrating BIM tools with the Grasshopper plugin, allowing for direct connections between Rhino and several BIM applications, including Graphisoft’s ArchiCAD and Autodesk’s Revit, facilitating seamless data collection.
3. Results
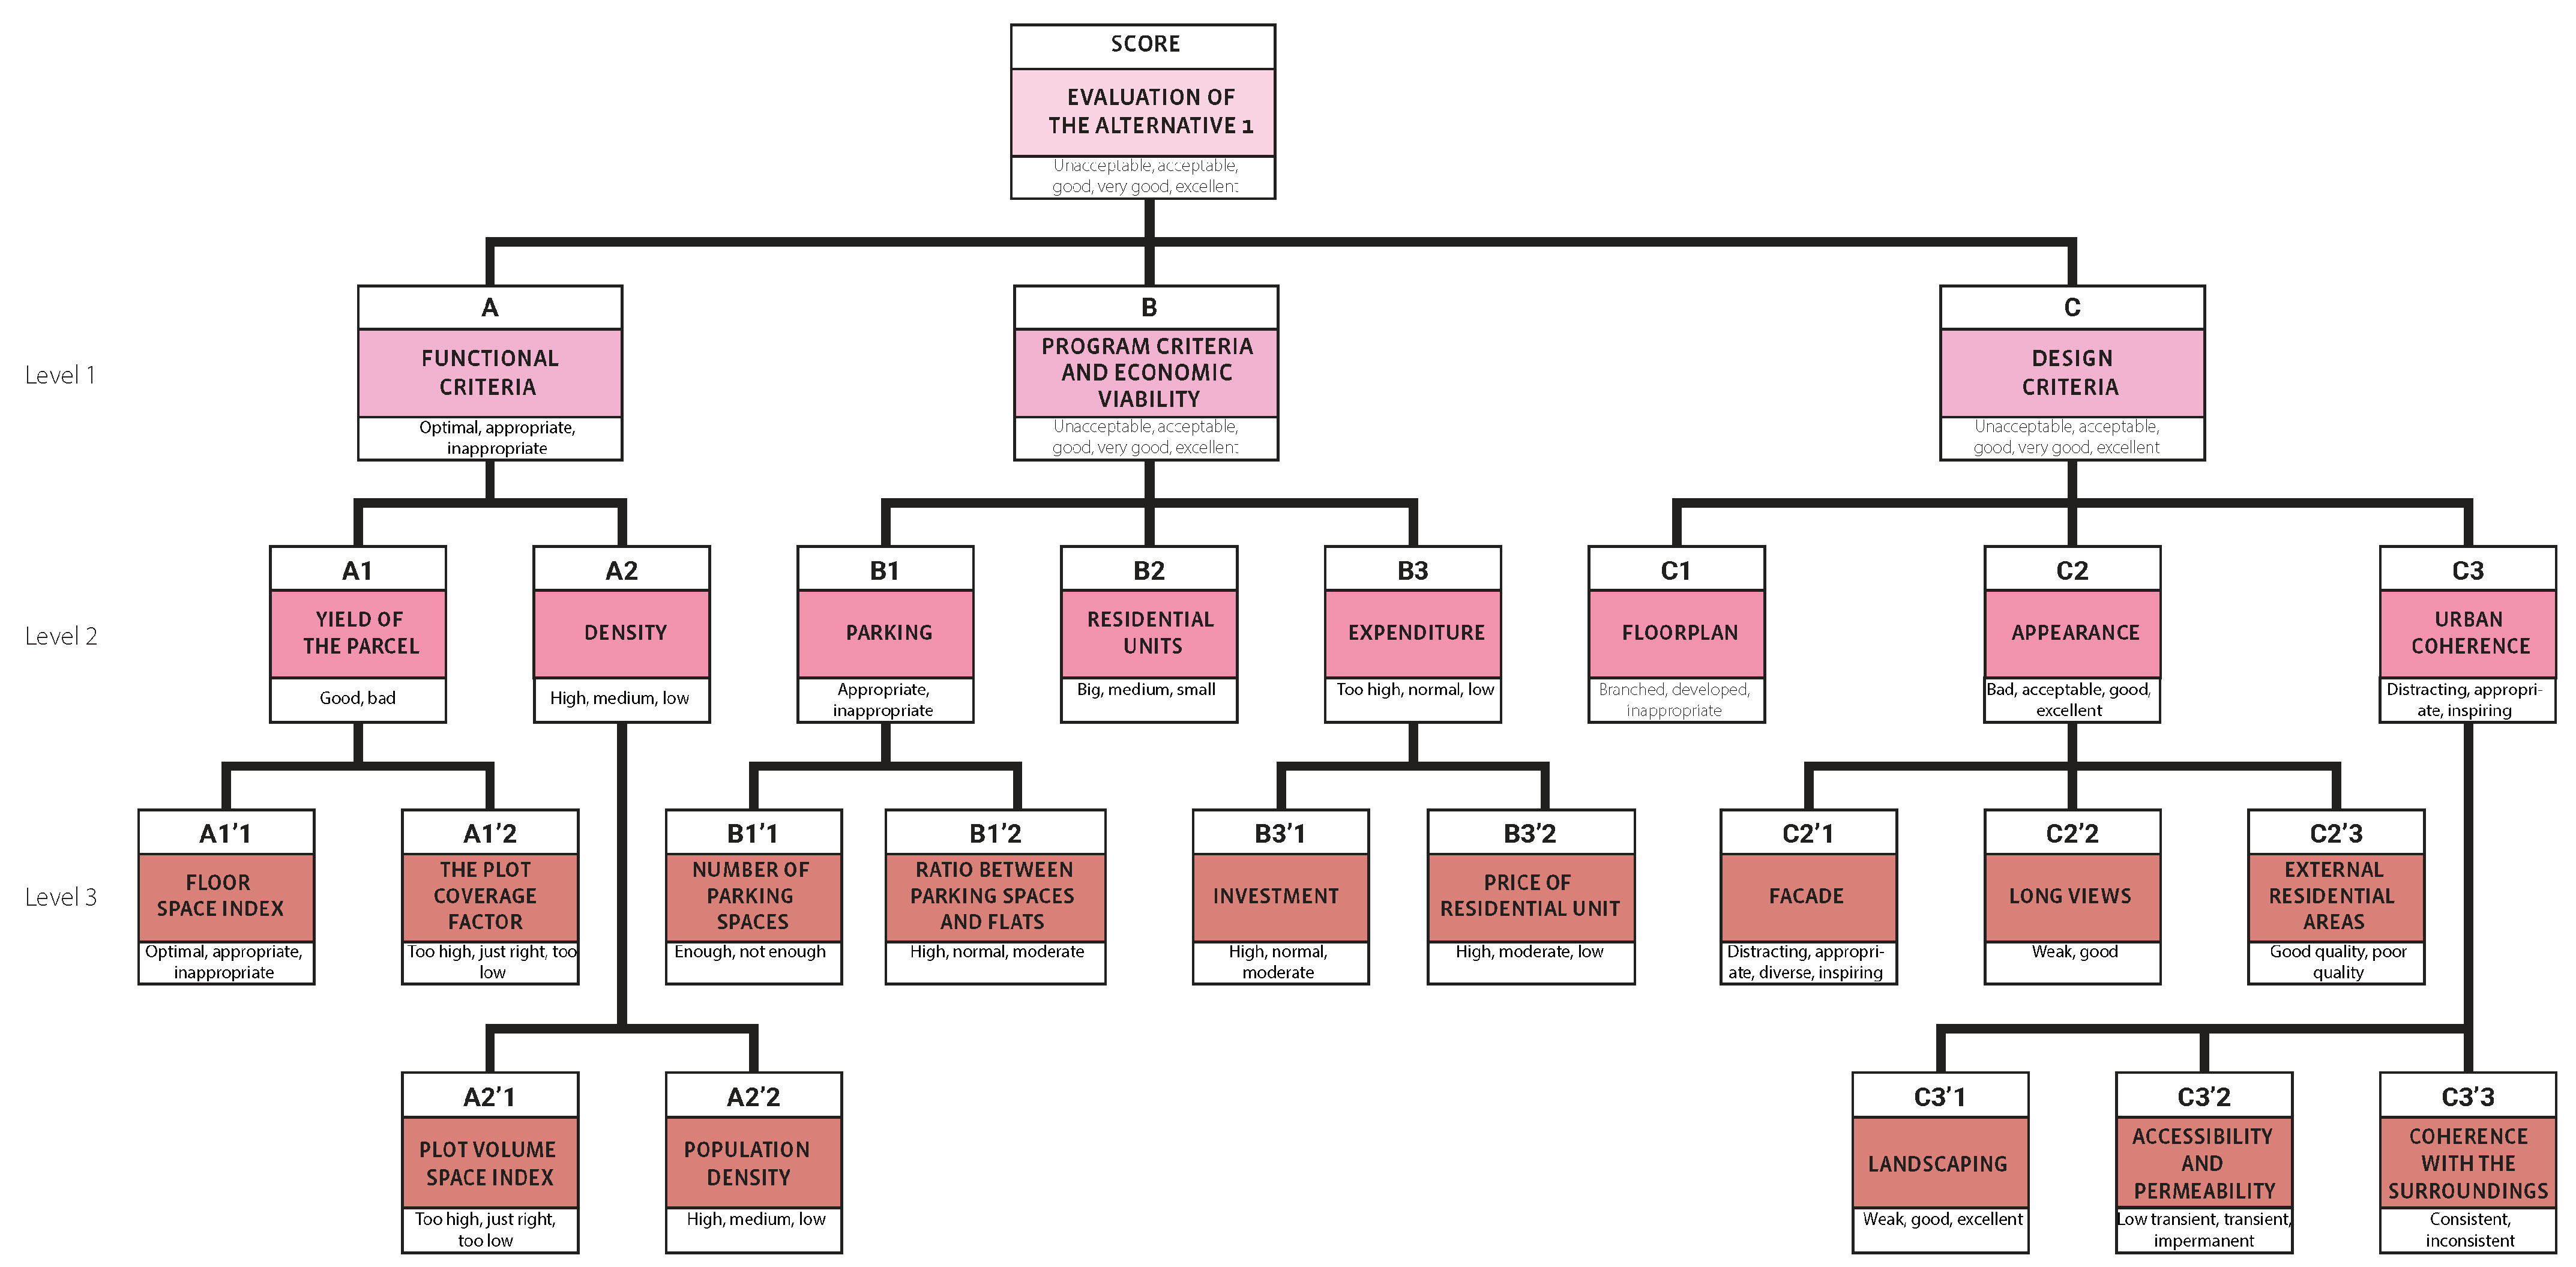
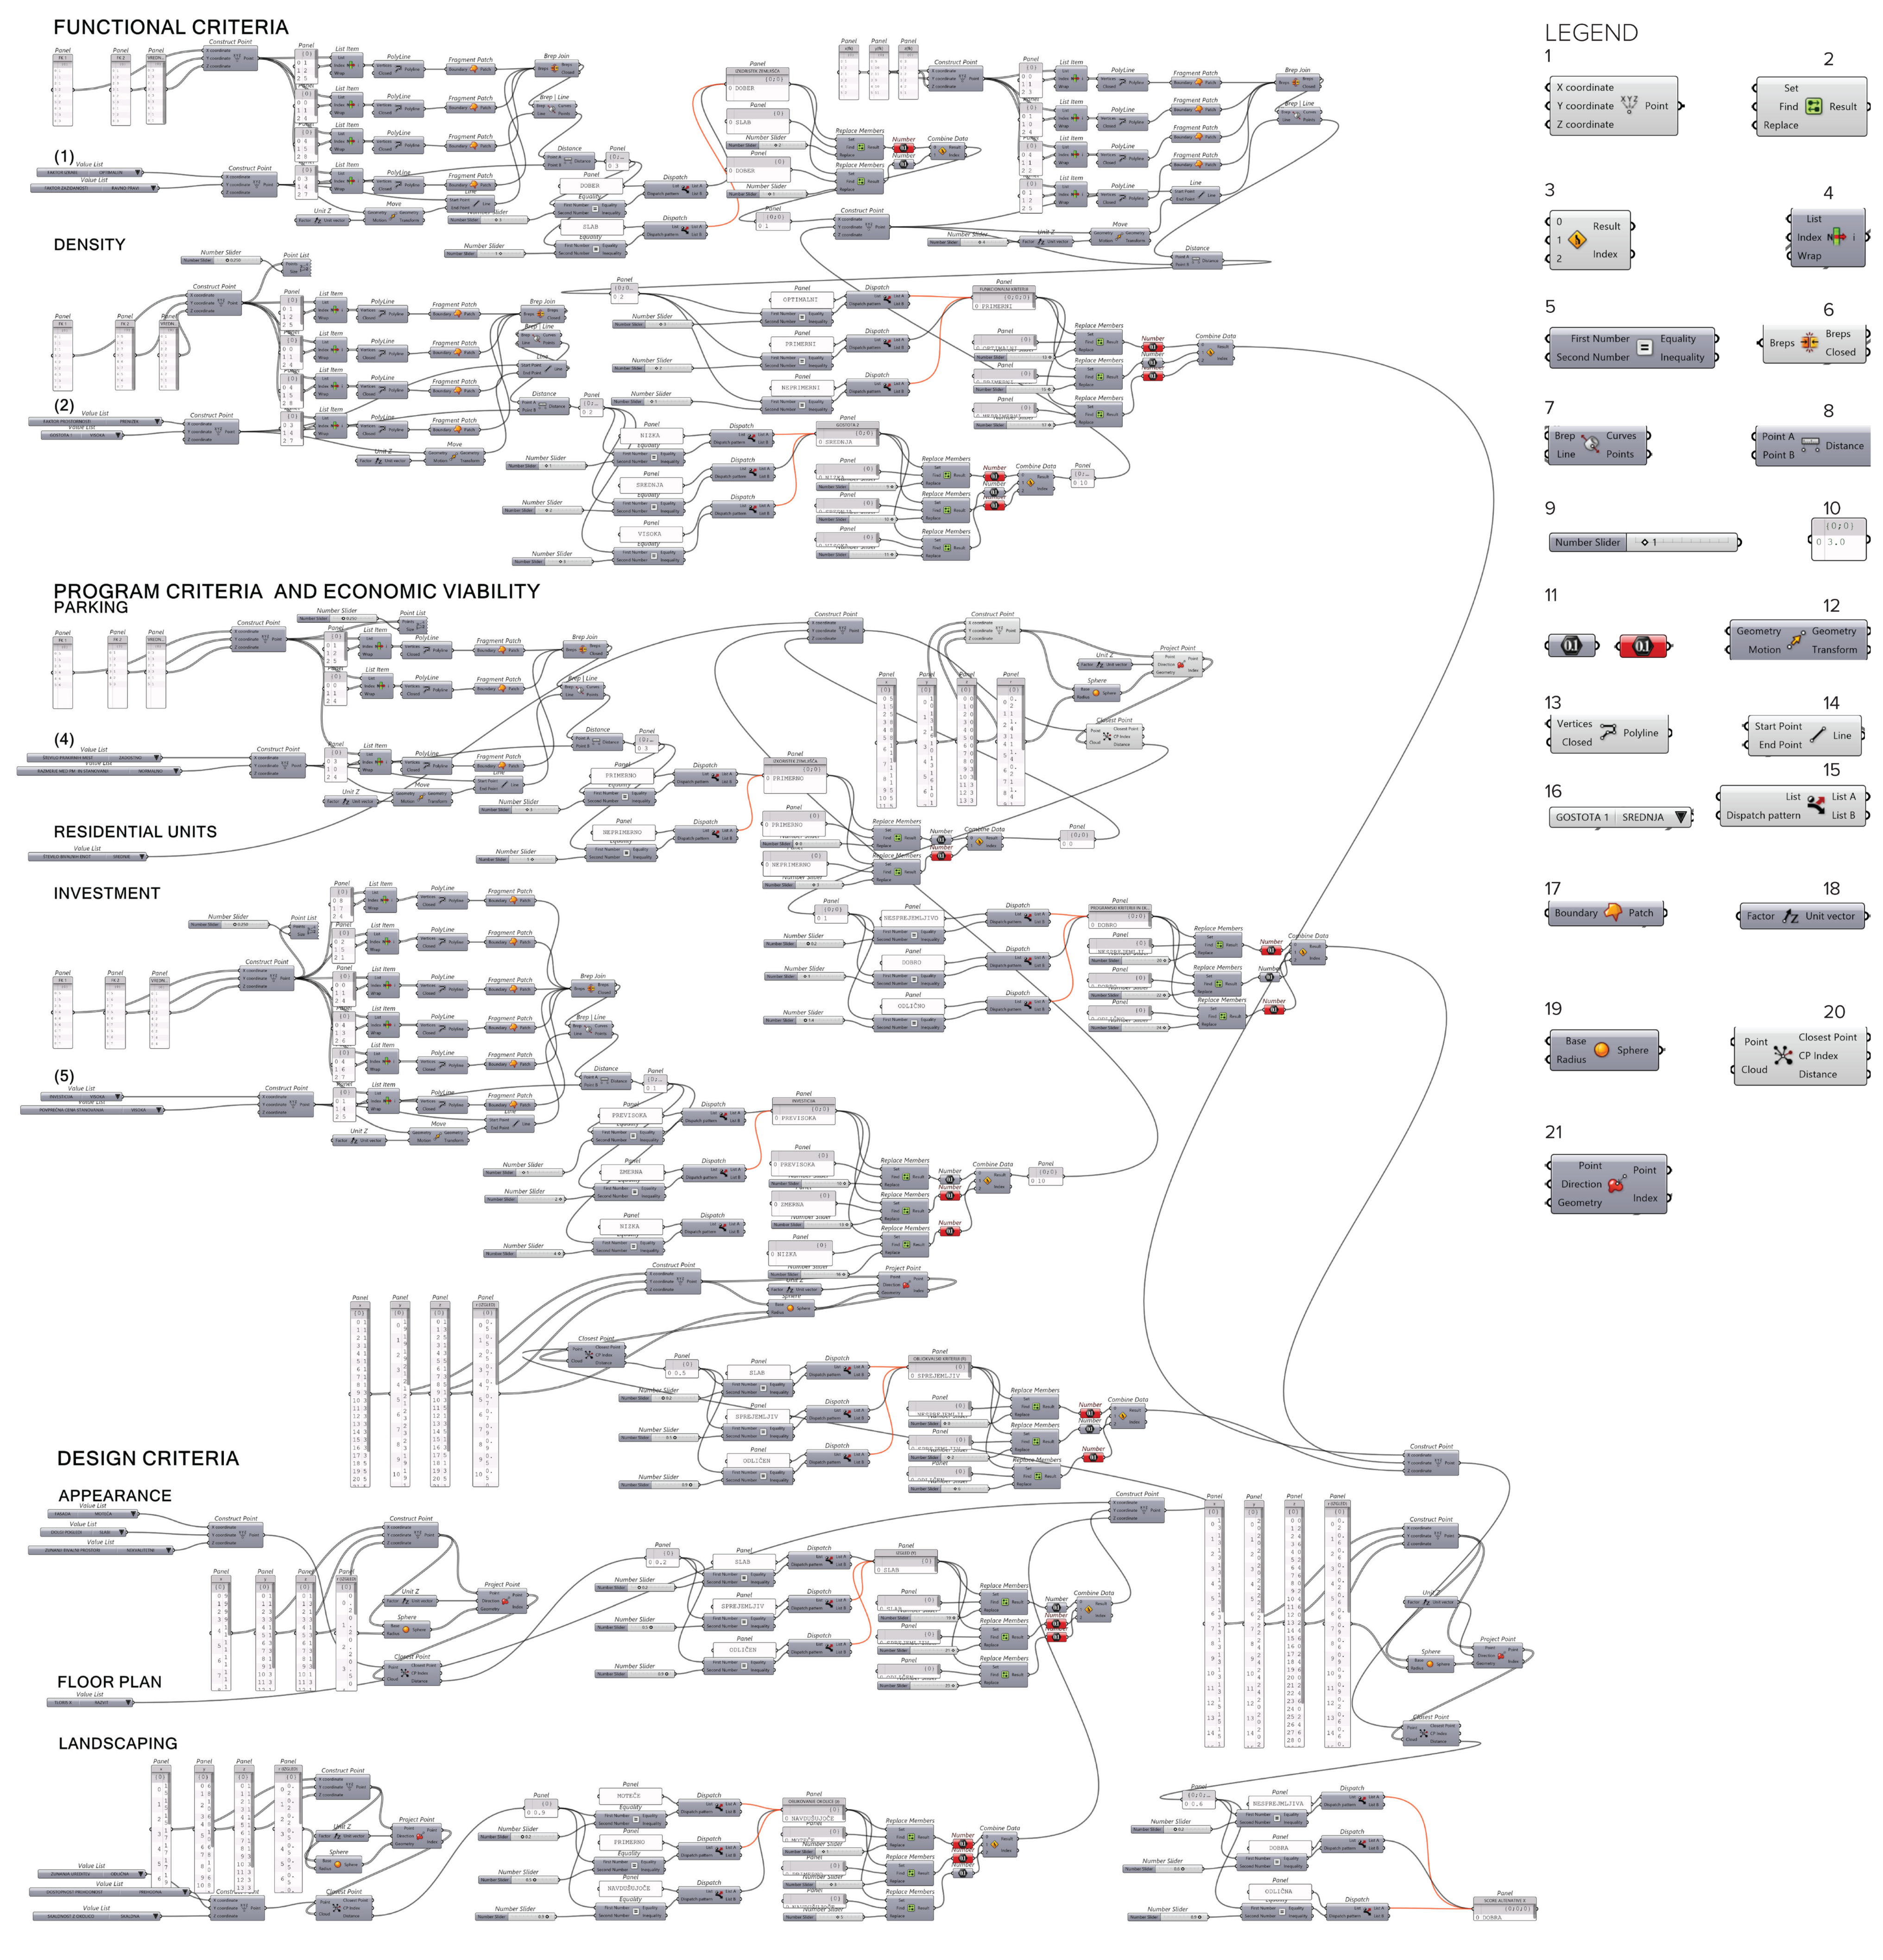
We have developed a DEX model; the structure of the model tree is shown in
Figure 3. This model is an extended version of the example shown in
Figure 1. The original division of the criteria into three main groups (functional, design, and cost criteria) was retained, but the division and combination of criteria and sub-criteria were changed and adapted to the specific design competition. In the extended model, additional functional criteria not previously mentioned (Group A in
Figure 1) are (A1′1) the floor space index or the ratio between the total floor area of a building and the total plot area and (A1′2) the plot coverage factor density or the ratio between the building floor area and the total plot area. These two criteria are usually specified by law. The (A2) density group may or may not always be required by law. It refers to the volumetric density of new buildings on the building plot and, in this case, is further subdivided into two criteria: (A2′1) the plot volume space index or the ratio of building volume to plot area and (A1′2) the population density, which indicates the density of inhabitants per given unit area, in this case, m
2.
The program and economic viability of the criteria group (B) are further subdivided into (B1) parking, with two additional criteria: (B1′1) the number of parking spaces and (B1′2) the ratio between parking spaces and flats. Criterion (B2) shows whether the number of residential units is adequate. The third group, (B3) expenditure, consists of two subsets of criteria: (B3′1) the investment price of the entire development, which is usually measured per m2 of built-up area, and (B3′2) the price of the residential unit, a metric that shows the hidden costs a buyer must pay when purchasing a single residential unit.
The new criteria in the C2 group (C2′2) are long views, indicating the habitability of the residential units and the quality of the design of the external residential areas (C2′3). The last group, (C3) urban coherence, represents the seamless integration of the new development into the urban environment and is divided into (C3′1) landscaping, indicating the quality of the designed outdoor spaces; (C3′2) accessibility and permeability, indicating whether the new development is adequately integrated into the neighborhood for pedestrians and other non-motorized road users; and (C3′3) coherence with surroundings, which measures the overall design appearance. The new DEX model was translated into the Rhinoceros/Grasshopper environment. The representation included the criteria structure (
Figure 3) and decision tables (
Figure 4 and
Supplementary Materials). The final representation of the model in Rhinoceros/Grasshopper is shown in
Figure 5.
To facilitate implementation, the maximum number of lower-level criteria for each attribute is three. Otherwise, the decision tables become too complex to implement in the CAD environment.
3.1. Aggregation of Two Criteria
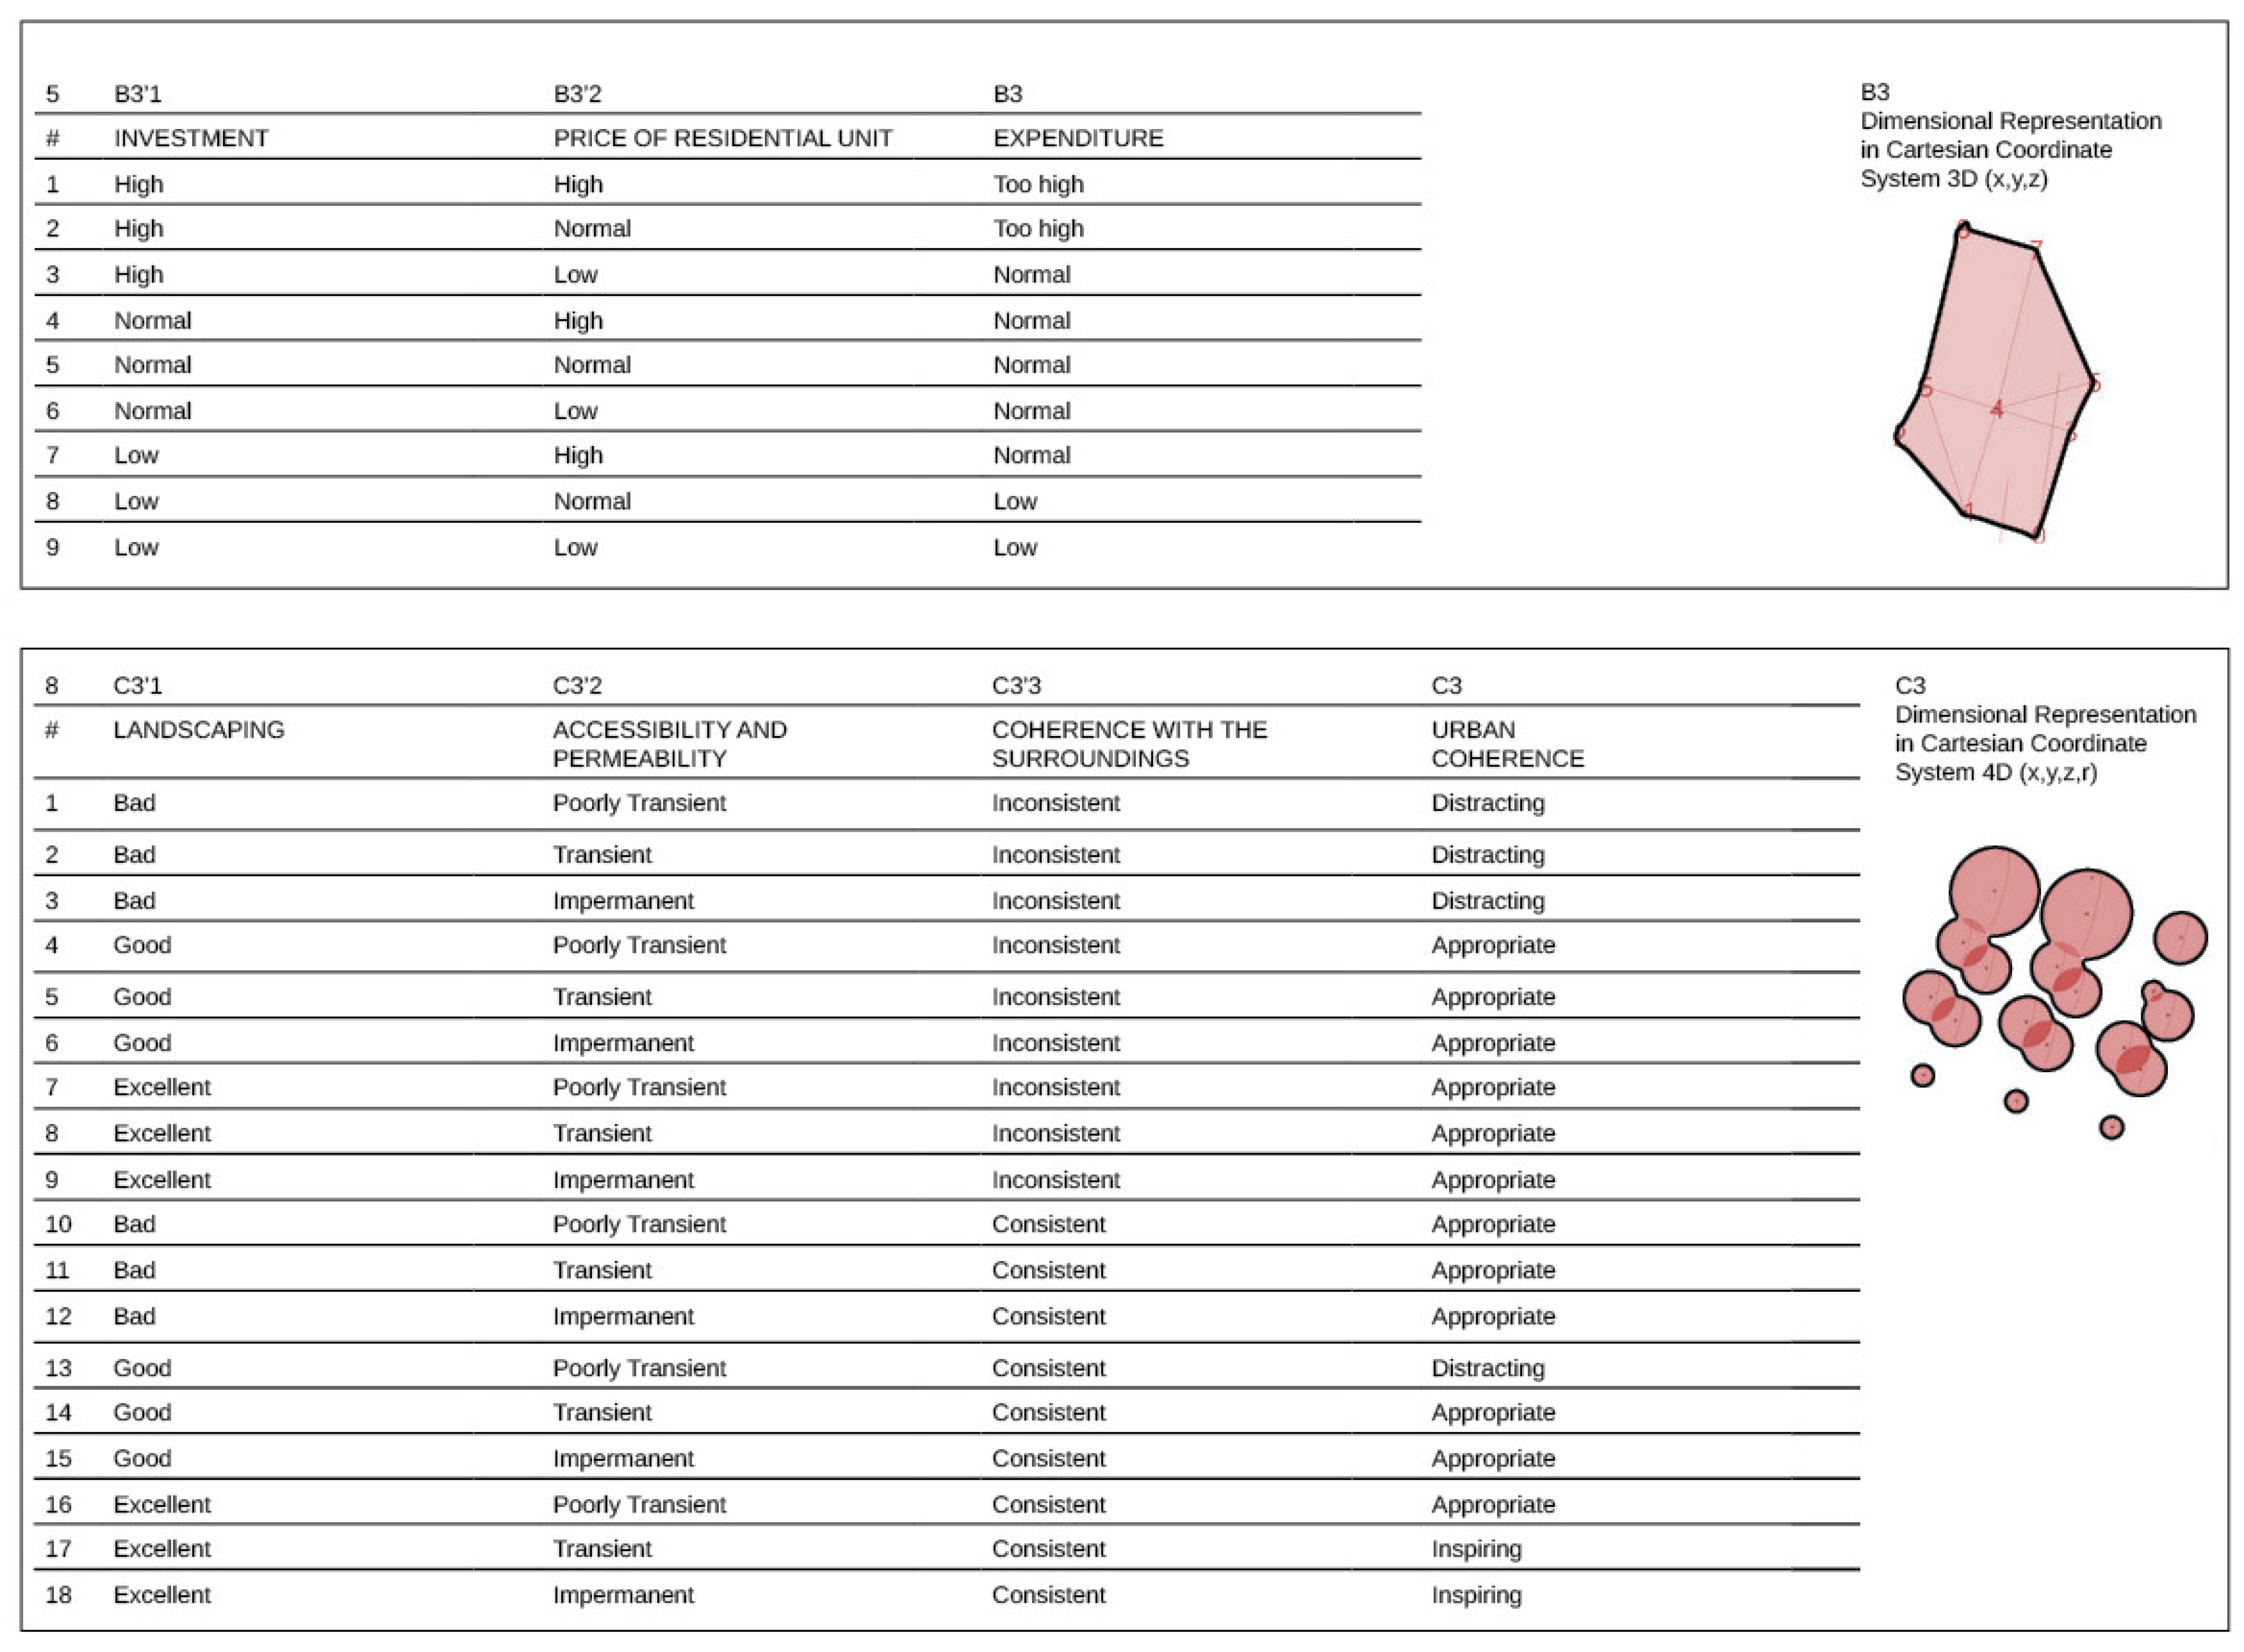
For groups of criteria in which we aggregate two subordinate criteria—for example, the aggregation of B3′1, B3′2, and B3 (
Figure 4, top)—we can graphically depict the situation in three dimensions. We represent the values of subordinate criteria on the x and y axes and the result of aggregation on the z axis. We represent qualitative DEX values with integer numbers. For example, the values of attribute B3 in
Figure 2 and
Figure 3 (high, normal, and low) are mapped to 1, 2, and 3, respectively. Consequently, we implement the aggregation algorithm in Grasshopper, as shown in
Figure 6: the diagram displays a discrete aggregation function defined only at points that match those of the 3D environment. Intermediate values do not apply in this case and are only shown to help the user perceive the function.
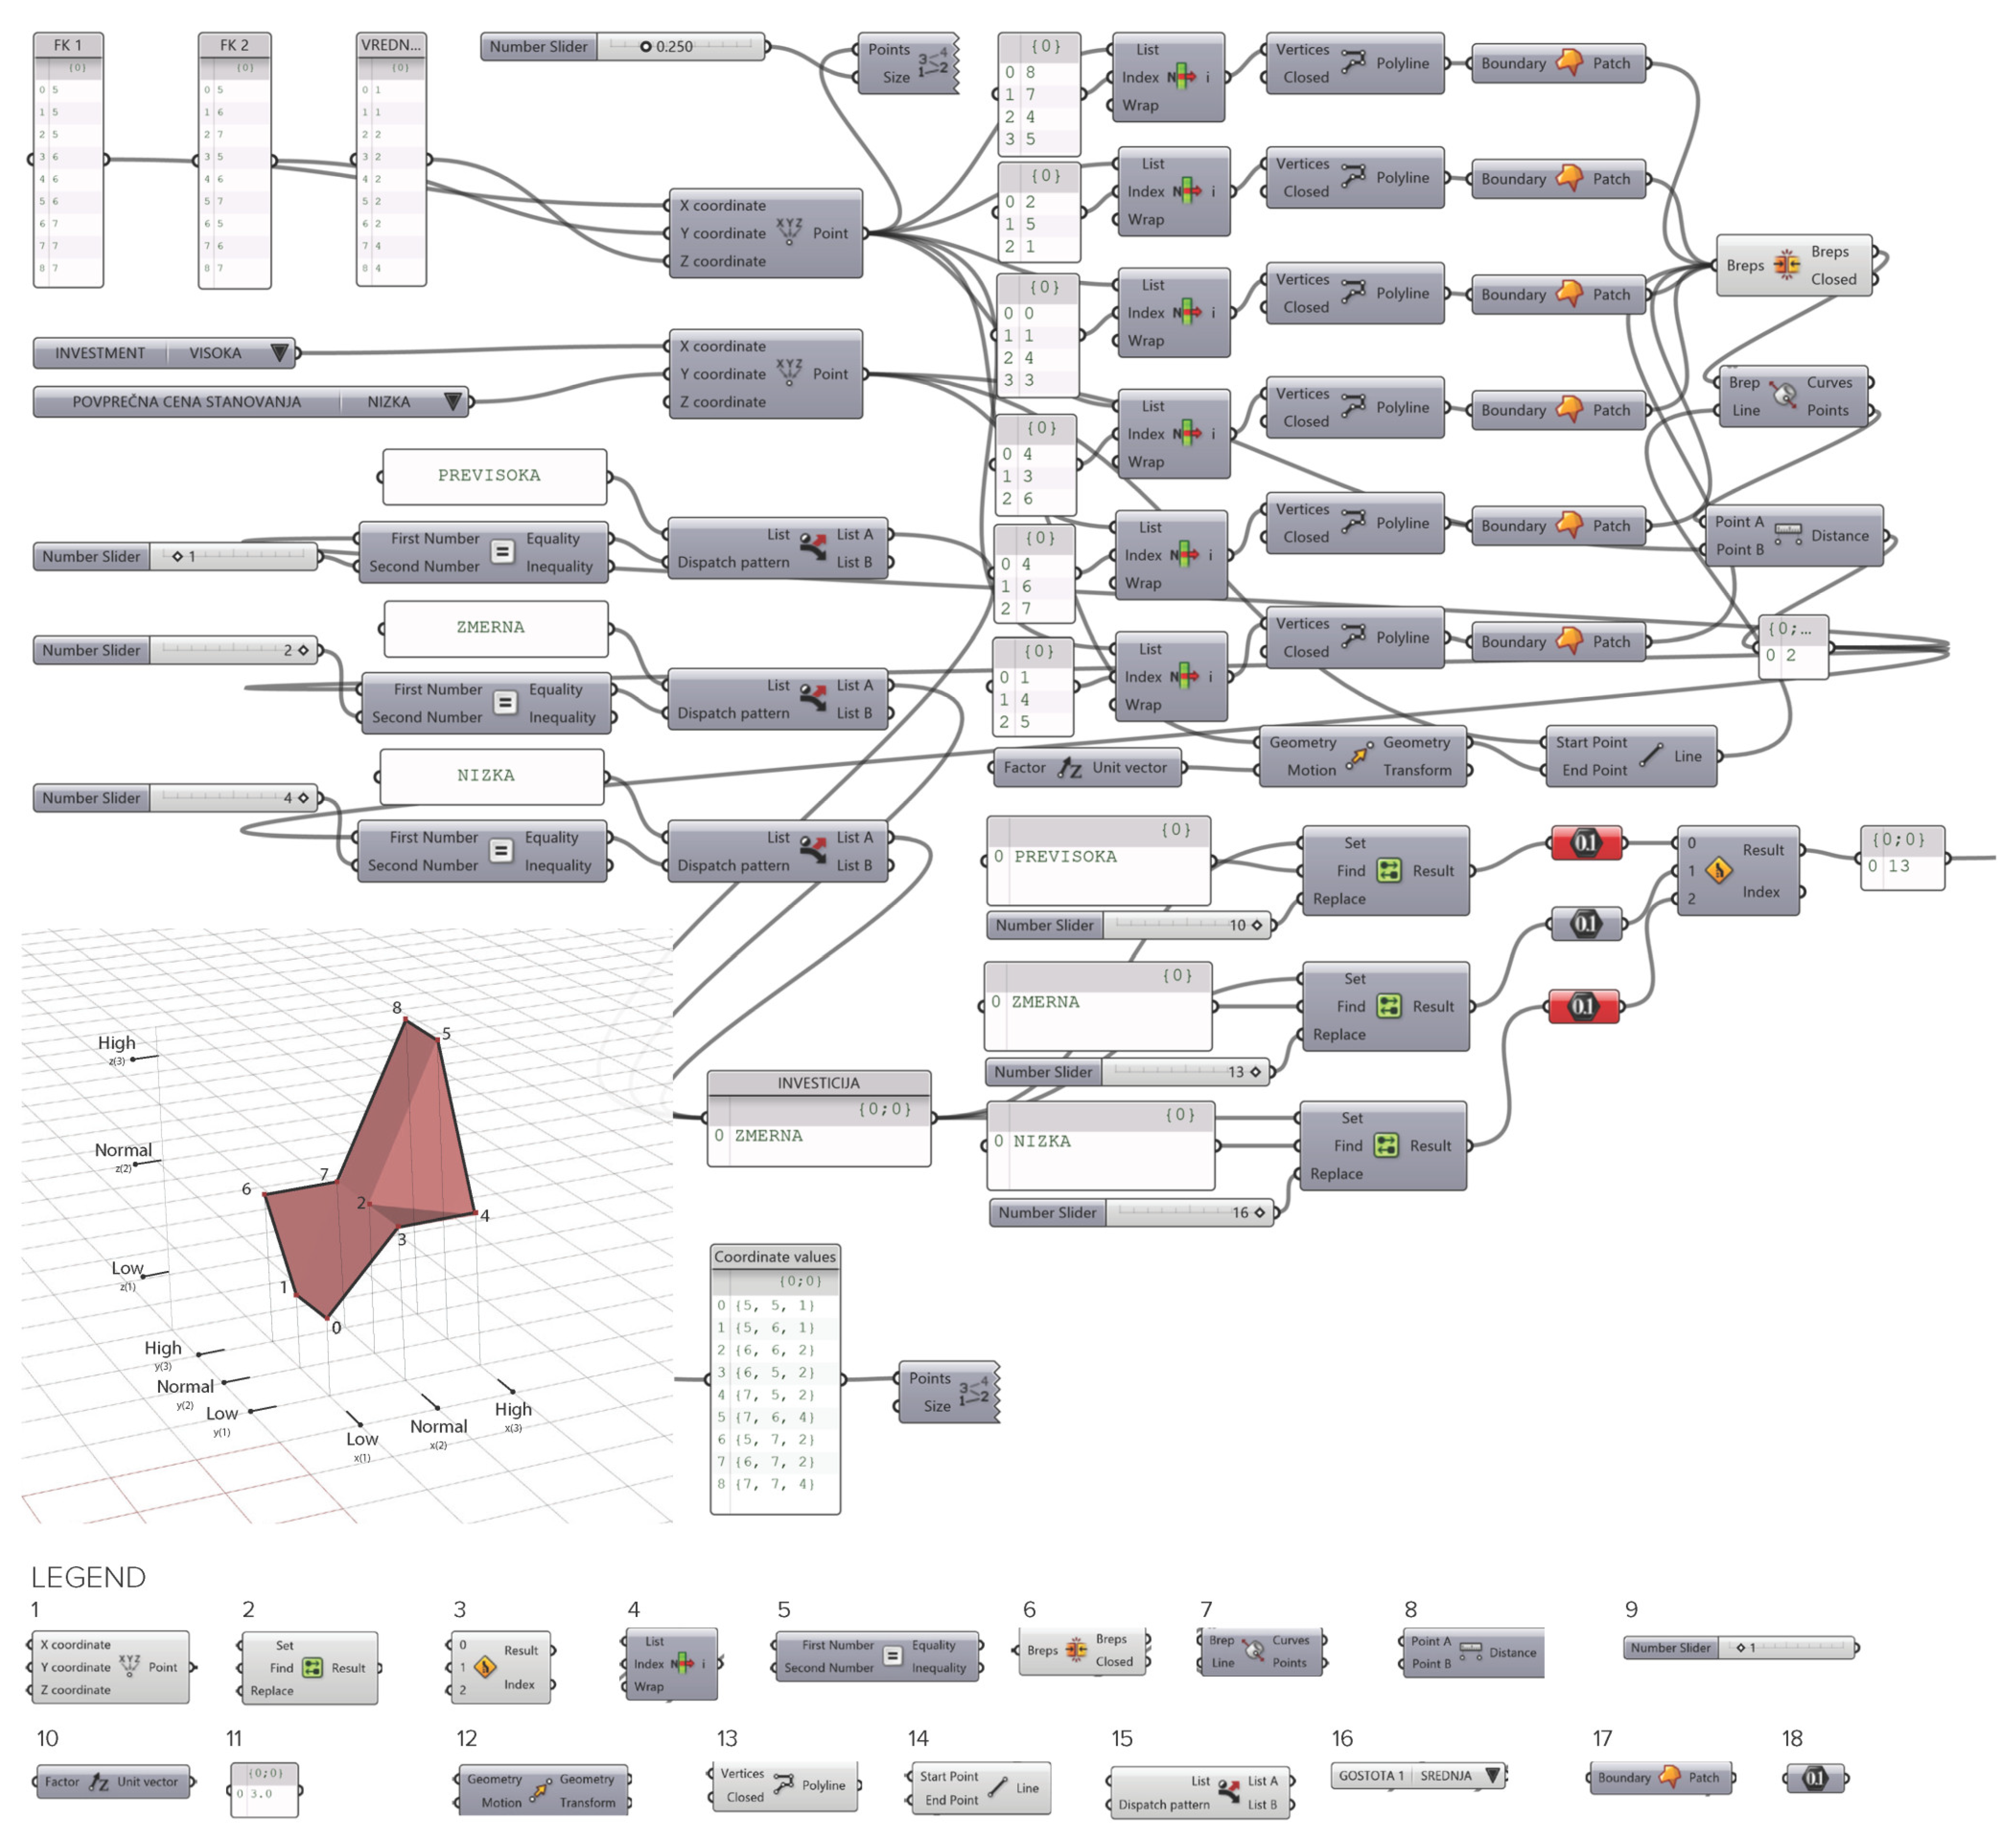
3.2. Aggregation of Three Criteria
The representation of a decision table with three subordinate criteria (
Figure 4, bottom) is more difficult because it represents a function in four dimensions; (x, y, z, r) à (v). Here, we take the first three dimensions (x), (y), and (z) as the basis of the three-dimensional coordinate system and then represent the fourth dimensionI) in terms of the radius of the sphere shown. For example, to represent the point (3, 2, 2, 3) à 16, we position the sphere of radius proportionalI (r) = 2 on the coordinates (x) = 3 and (y) = 2 and the height of (z) = 2. The implementation of this principle in Grasshopper is shown in
Figure 7, with an example of a graphic display.
3.3. Evaluation of Project Alternatives
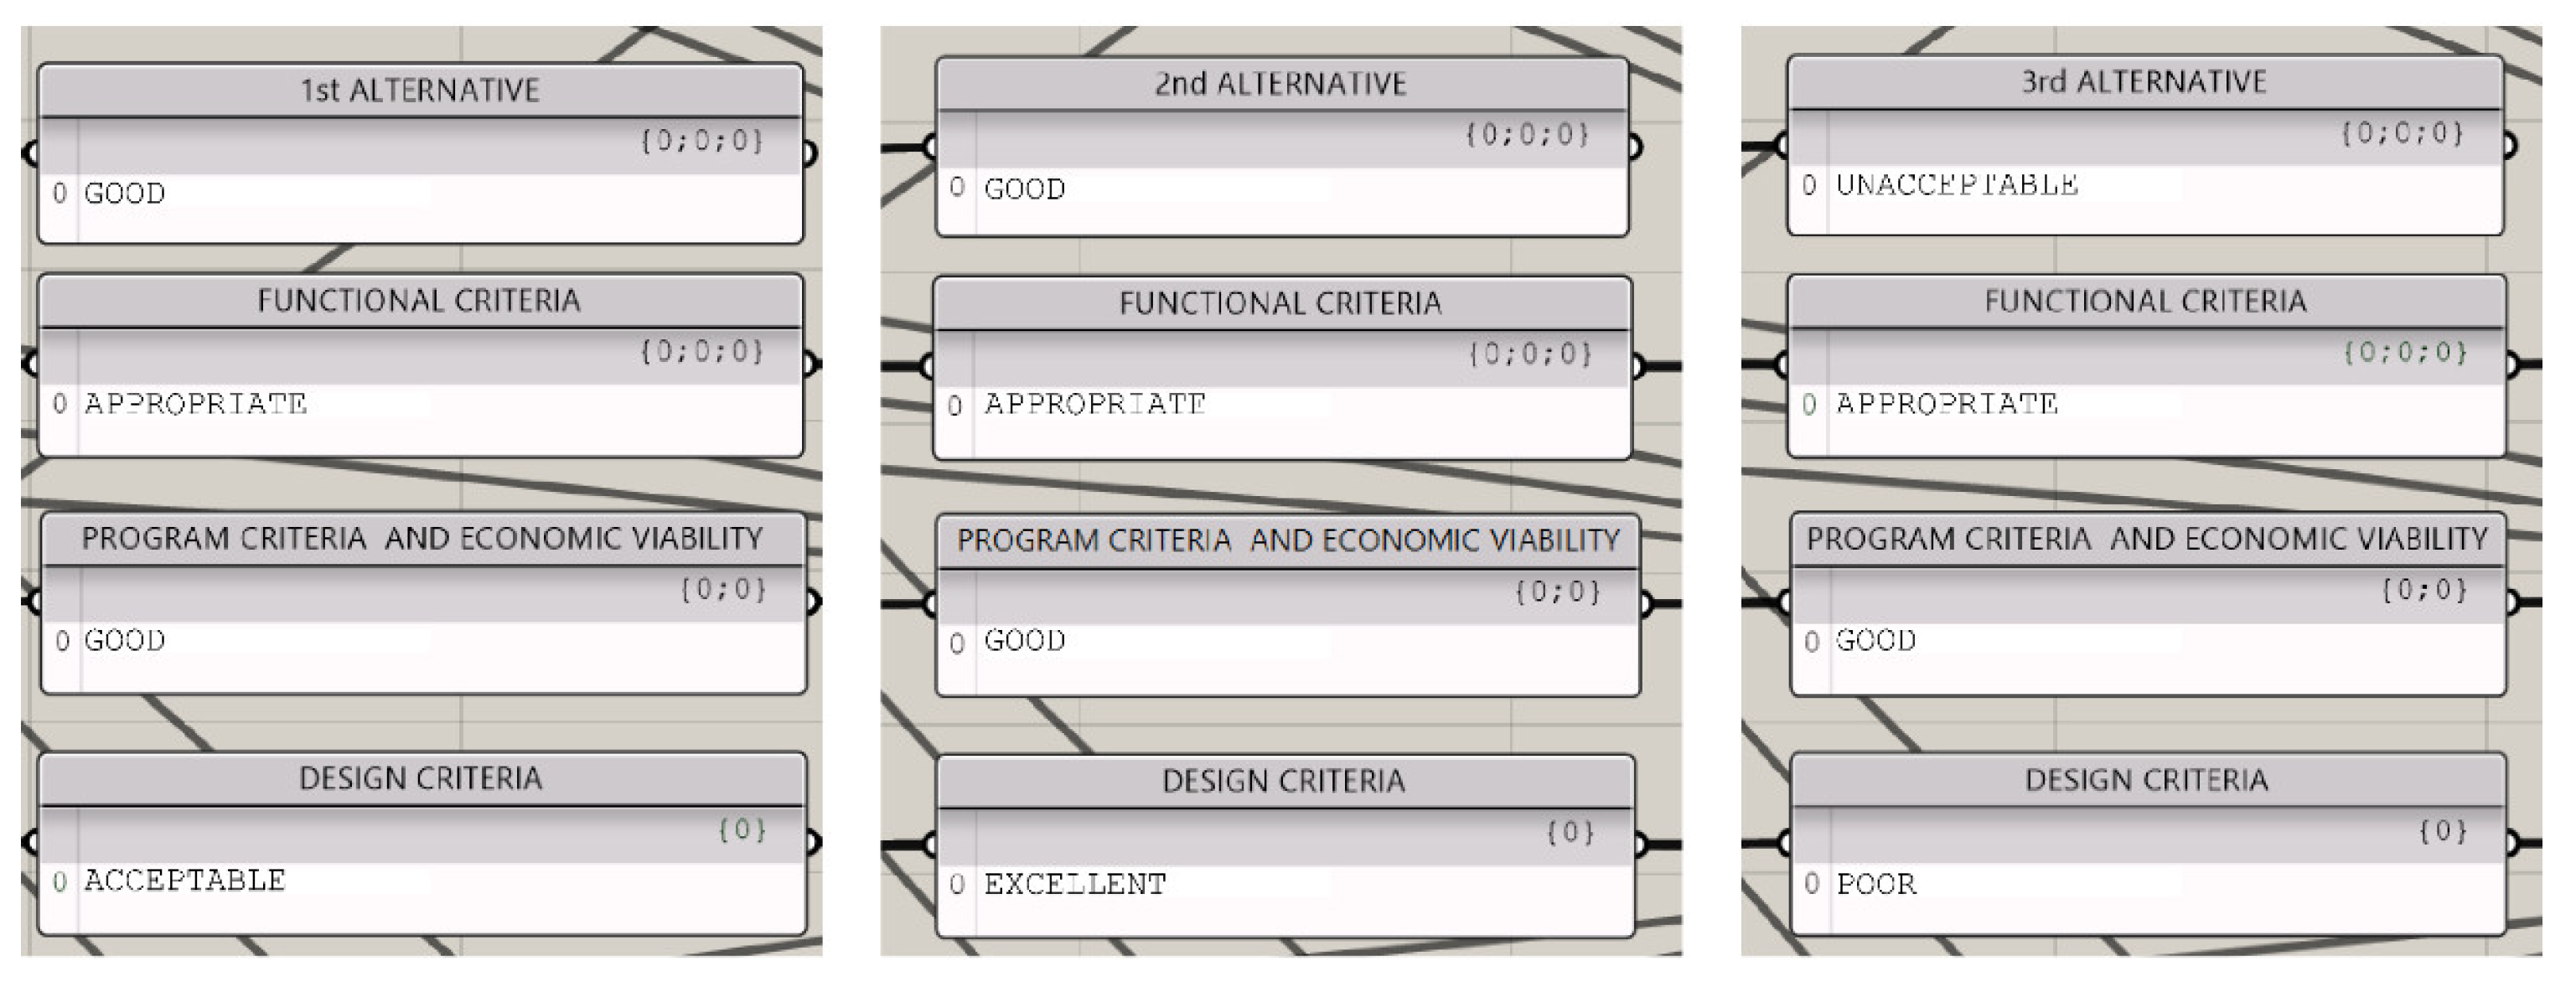
After the successful implementation of all components of the DEX model in Rhinoceros/Grasshopper, the evaluations of all the alternatives are obtained in the form of symbolic values (e.g., good, or bad).
The results for the top attribute in the DEX model are as follows: Alternative 1 = good, Alternative 2 = good, and Alternative 3 = unacceptable (
Figure 8). It is important to note that, in addition to top-level values, all values corresponding to the inner attributes in the DEX model are also determined. These are generally very important in providing a more detailed profile of each alternative. In this way, the decision maker(s) can understand the evaluation process, compare alternatives, and evaluate their specific properties. Thus,
Figure 8 shows evaluations of the three alternatives in the first level of the tree from
Figure 3, that is, functional criteria, program criteria, economic viability, and design criteria.
If we exclude Alternative 3, which is considered unacceptable primarily because of its poor design criteria, we are left with the first two alternatives, whose final scores were good. Looking at the scores from the earlier level of evaluation, we see that the alternatives are the same in terms of functional and programmatic criteria but differ in terms of design, with Alternative 1 receiving a score of good and Alternative 2 receiving a score of excellent.
4. Discussion
Evaluating alternatives in A & UD competitions by developing an approach to use the DEX method for the jury evaluation process within the tools that architects use daily with the combination of A & UD simulation tools and multi-criterion decision systems proved to be successful. This method collects input data, reads qualitative criteria from 3D models of competing project solutions in combination with decision models with great accuracy, and clarifies the evaluation process. The classification of competing project solutions becomes consistent, transparent, and traceable. The research process showed that it is possible to integrate the evaluation method into professional design tools in everyday A & UD work. Compared to the simple multi-criterion modeling methods we have previously studied [
53], the DEX method is superior.
The main advantage of the DEX method is its ease of use for the evaluator. The evaluator symbolically evaluates only the most basic criteria into which the spatial problem is broken down and leaves everything else to the algorithm. However, defining the modeling algorithm, determining all the combinations, and evaluating them is complex. It is also difficult to extend the algorithm during the decision-making process. In addition, there are limitations on the number or combination of more than three individual criteria in subordinate groups.
Another good feature of evaluating spatial solutions is that we break down the most basic aspects/criteria and evaluate only those. All the relationships and evaluations of the criteria combinations are listed in a table (
Supplementary Materials) so that, when we evaluate each criterion, we immediately obtain the final solution along with an overview of the decision rules that led to it.
In addition to its advantages, the DEX method also has some disadvantages, at least from the point of view of evaluating spatial solutions in a three-dimensional modeling environment. The best project solution cannot be derived directly from the results obtained (
Figure 8). One must delve into the method or otherwise evaluate the relationships between the various combinations, which is difficult for a non-specialist in the case of a broad application. This caveat can be changed by increasing the number of symbolic ratings per alternative from three (unacceptable, good, and excellent) to five (inadequate, adequate, good, very good, and excellent) to provide a wider range for evaluating solutions. However, this also entails a significant increase in possible combinations, which is time-consuming, opaque, and sometimes difficult to implement.
Another difficulty with the DEX method is its complexity and consequently its relatively difficult implementation in Rhinoceros/Grasshopper. Although the use of DEX models in the CAD environment is feasible, as confirmed by this study, it involves quite a lot of work and requires a good knowledge of the DEX method, Rhinoceros, and Grasshopper. This could be greatly facilitated by the development of software tools for the automatic translation of DEX models into the CAD environment. Not only would this speed up the process but it would also place more emphasis on the tasks of evaluating, analyzing, justifying, and explaining the alternatives which are among the primary tasks of A & UD competition juries.
The DEX model can be utilized in the context of smart cities. Smart cities aim to improve citizens’ quality of life using technology and data-driven decision making [
68,
69]. Urban design decisions, such as selecting A & UD projects through competitions, play a significant role in shaping smart cities [
70]. The DEX model offers a structured and transparent framework for evaluating different design alternatives based on various criteria relevant to smart cities, such as sustainability, accessibility, technology integration, and quality of life [
71]. This would enable more informed decision making on A & UD projects that are aligned with the goals of smart cities. The DEX model is flexible and can be customized according to the criteria tree and decision rules for different smart city contexts. By integrating semantic decision making into smart city frameworks, architects, urban planners, and decision makers can systematically evaluate various A & UD proposals and infrastructure projects, ensuring that they meet the multifaceted requirements of sustainability, functionality, and community well-being. This integrated approach can facilitate more transparent decision-making processes, ultimately contributing to the creation of smarter and more livable urban environments.
5. Conclusions
This study advances the integration of the DEX (Decision EXpert) method within the CAD (Computer-Aided Design) environment for evaluating A & UD competitions, particularly using Rhinoceros/Grasshopper. Our findings indicate that DEX significantly enhances evaluation processes, offering a structured, objective framework conducive to smart urban development. This method departs from traditional jury evaluations by employing symbolic decision making, thus simplifying the assessment of complex criteria and making the process more transparent.
Through a detailed case study on the Polje III site in Ljubljana, we demonstrated DEX’s capacity to evaluate diverse criteria essential for smart cities, from sustainability to technological integration. The method’s hierarchical, symbolic analysis aids in thoroughly comparing designs helping decision makers identify entries that align with competition goals.
However, challenges, such as the manual translation of DEX models into CAD tools and the need for extensive knowledge of both areas, were identified. These could be mitigated by developing automated translation tools and streamlining the integration of decision support systems into design practices.
Future enhancements could include the integration of artificial intelligence (AI) to leverage data from DEX evaluations for predicting optimal designs, potentially revolutionizing smart urban planning by facilitating sustainable, responsive design processes.
In summary, our research confirms the DEX method’s utility in making A & UD competition evaluations more objective and transparent, paving the way for its adoption in smart city planning. By overcoming current implementation challenges and exploring AI integration, the DEX method promises to be a vital tool in developing sustainable, livable urban spaces.


