

Unveiling the Socio-Economic Fragility of a Major Urban Touristic Destination through Open Data and Airbnb Data: The Case Study of Bologna, Italy
 , , , , and
Abstract
:1. Introduction
2. Literature Review about Airbnb
3. Context Description
4. Materials and Methods
4.1. Real Estate Market in Bologna and Its Characteristics
4.2. Connoting Fragilites in Urban Contexts: The Fragility Indicators
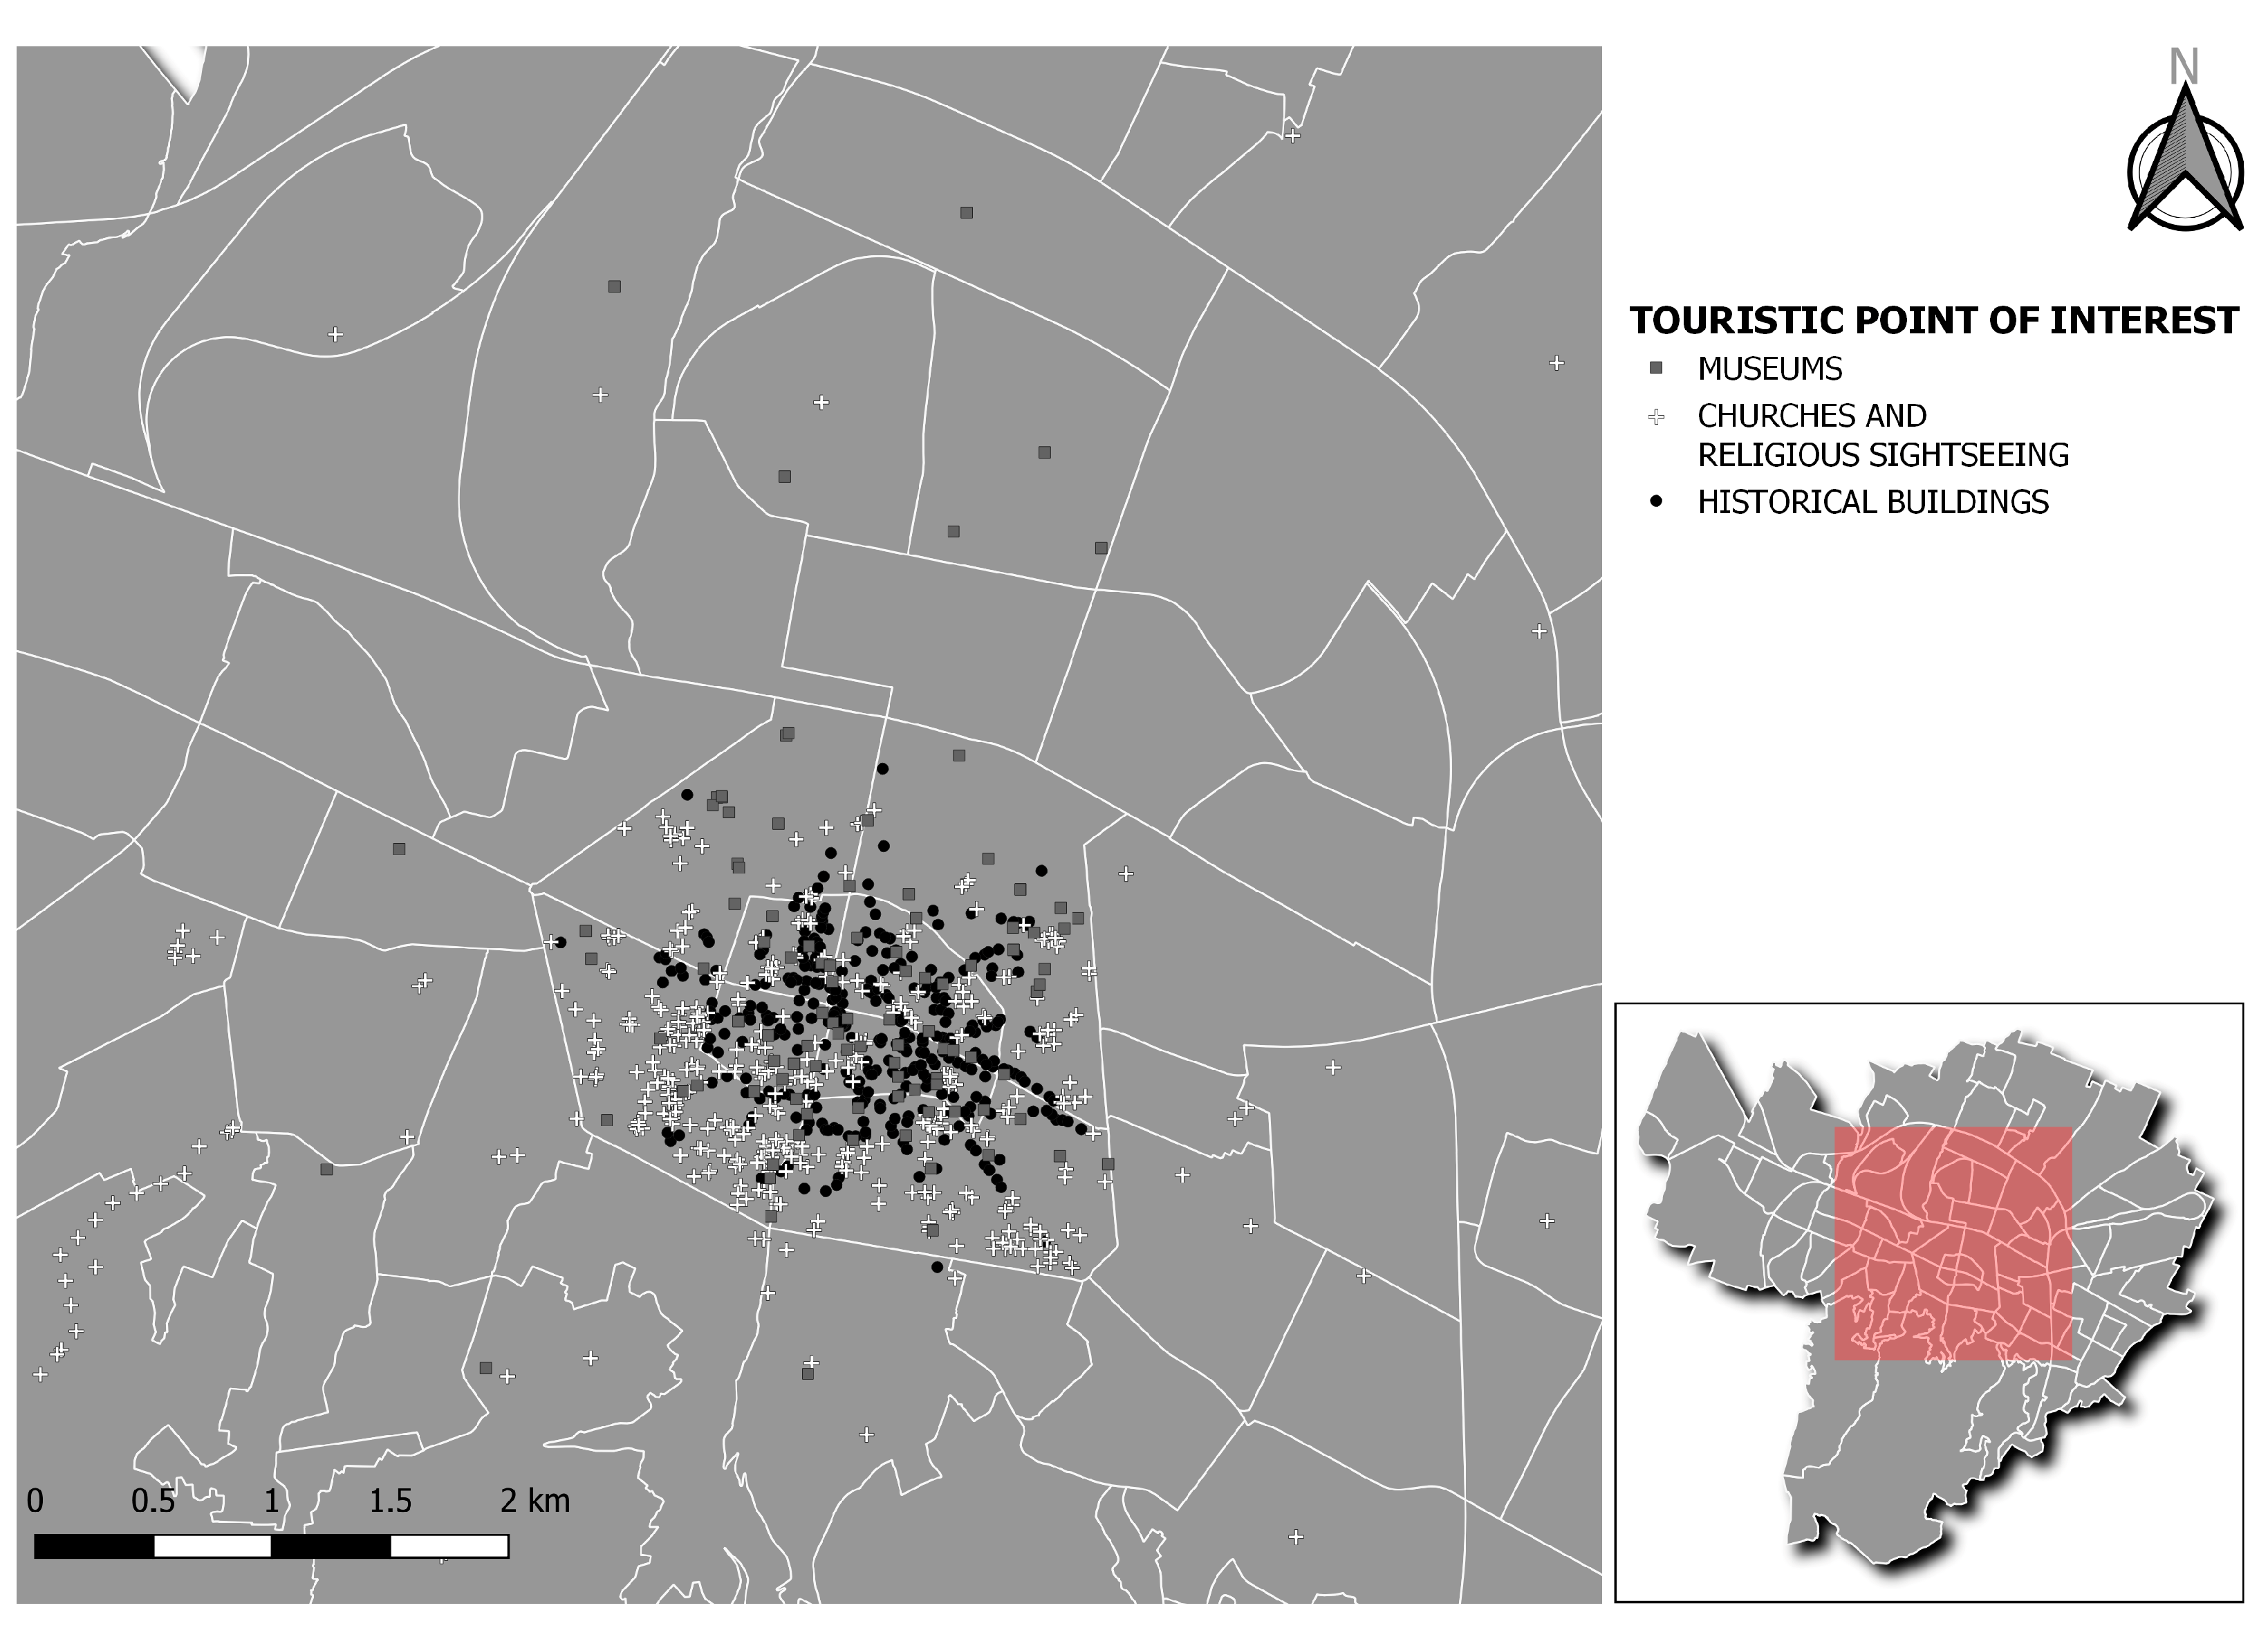
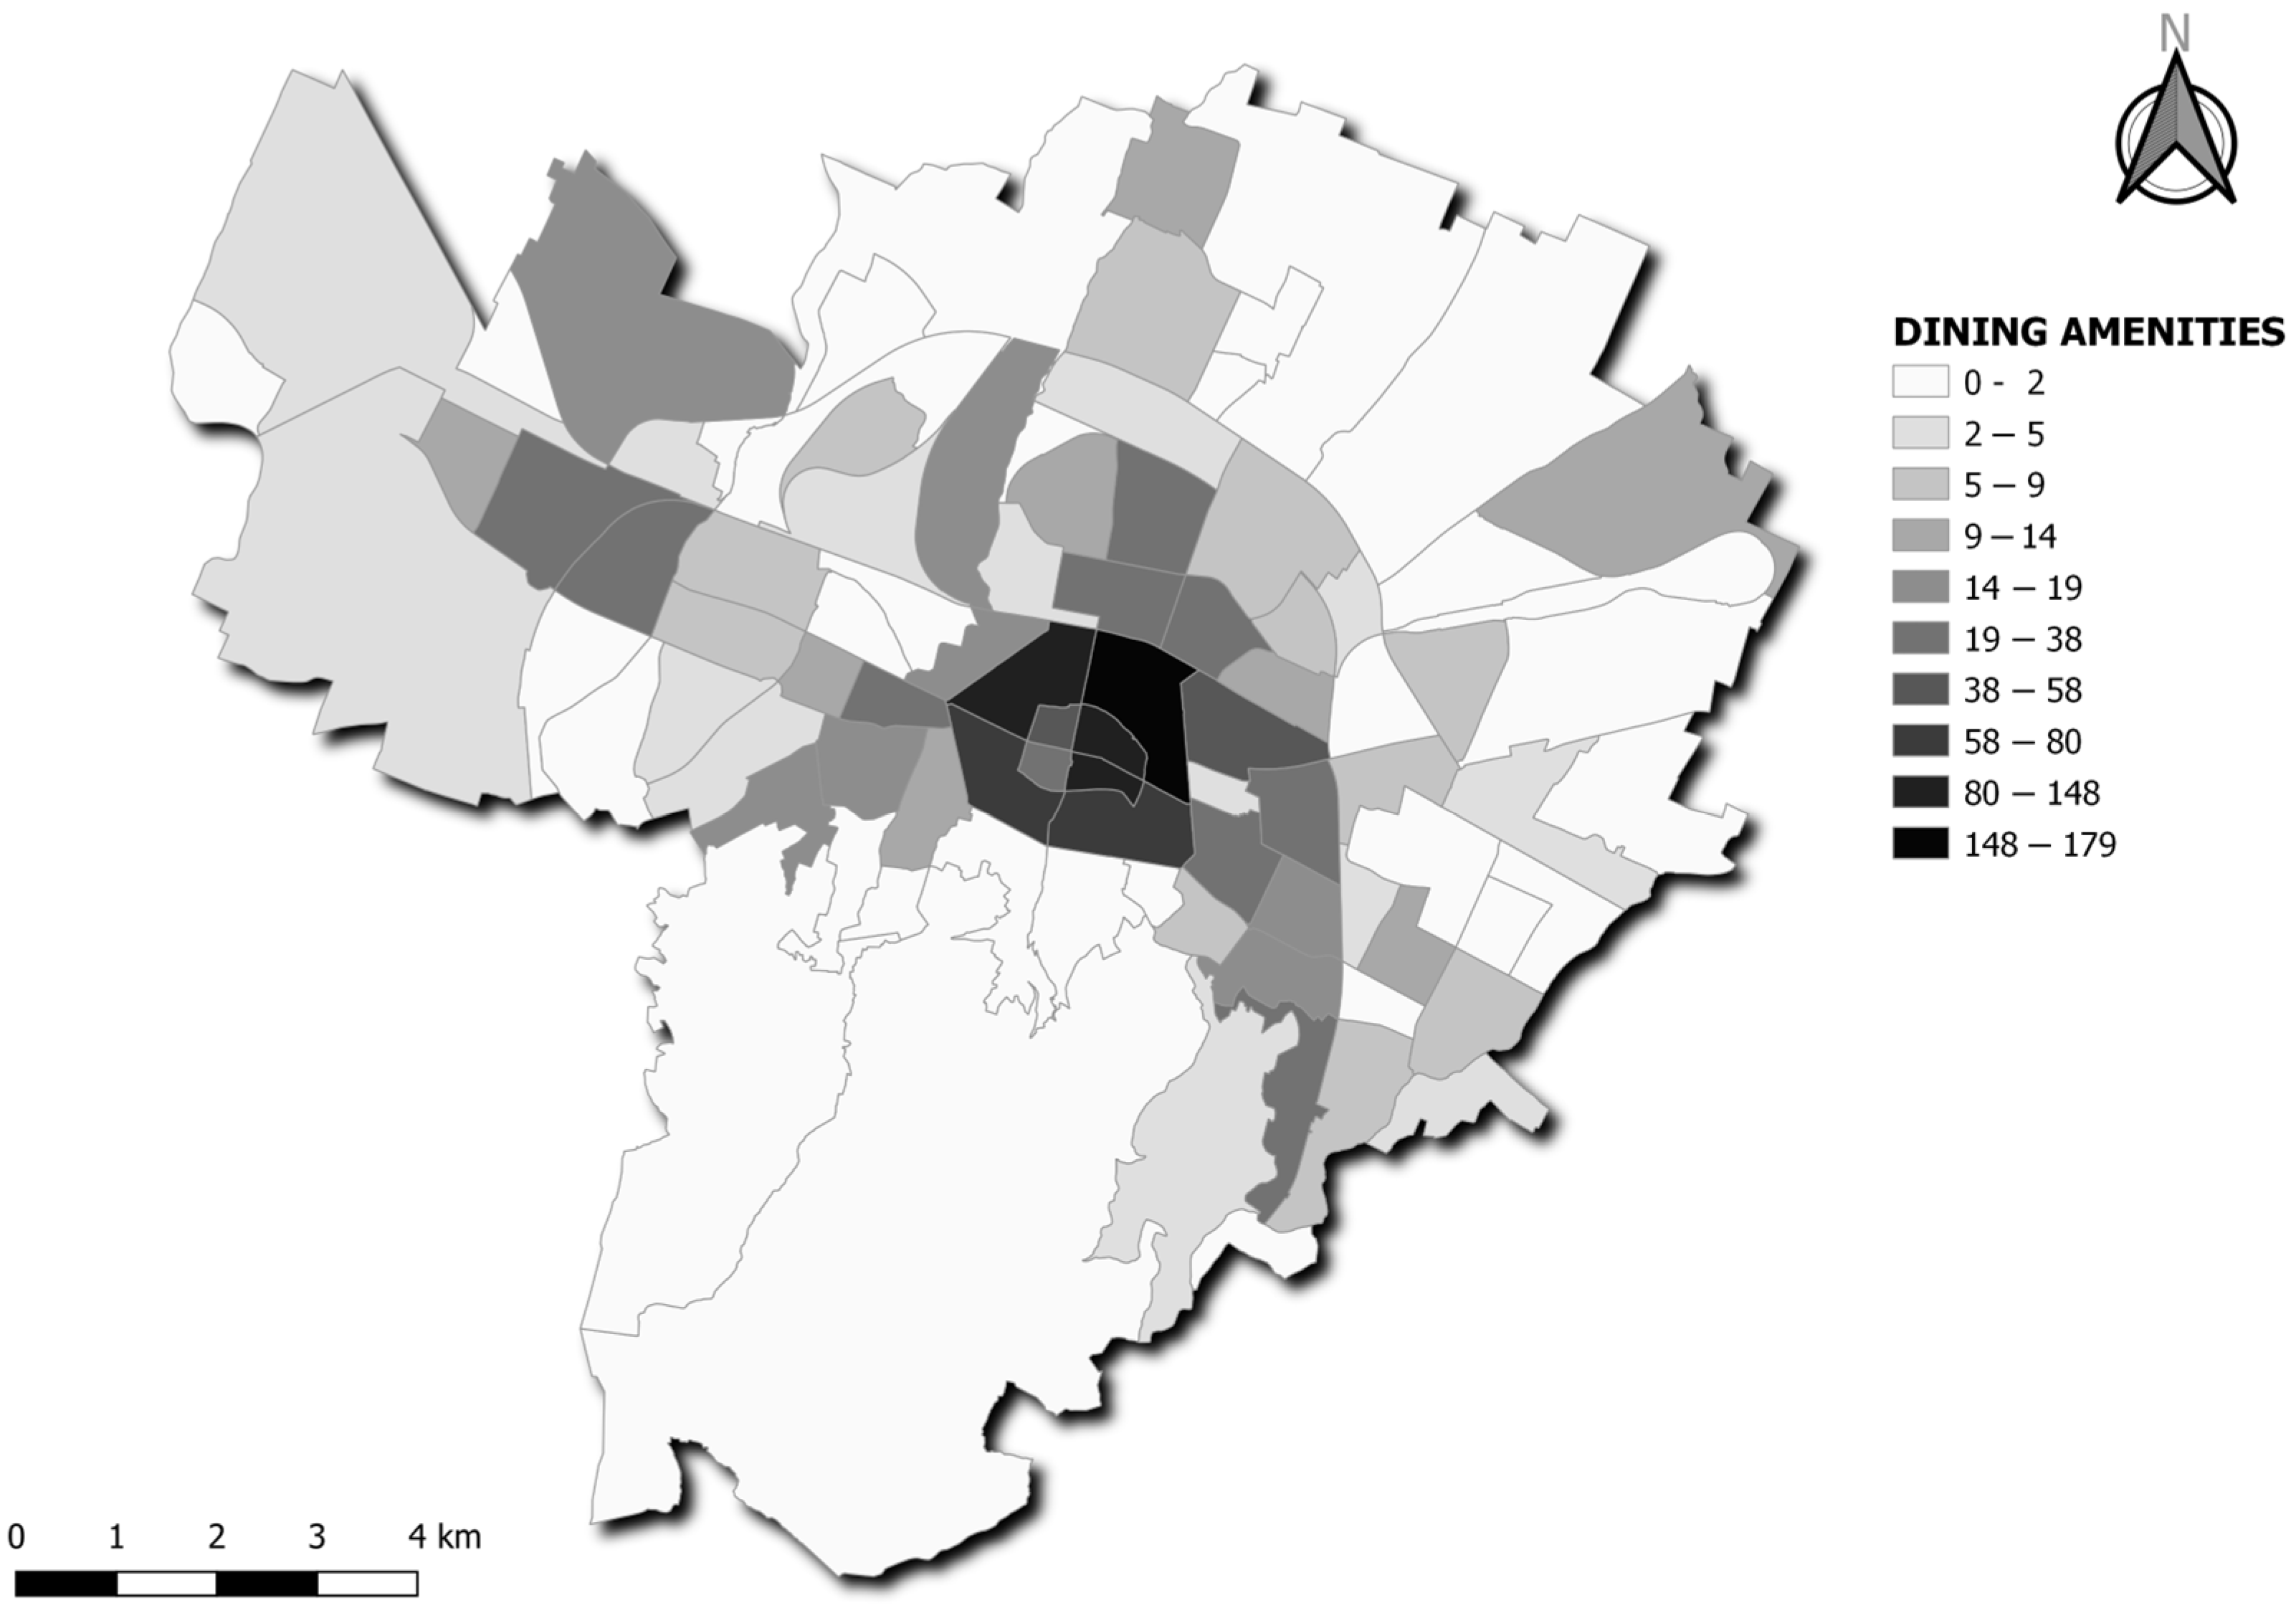
4.3. Quantifying the Presence of Non-Traditional Accomodations across Bologna, the Airbnb Dataset, and Listing Distribution
4.4. Spatial Analysis and Data Geoprocessing
4.5. Data Analysis
5. Results and Discussions
5.1. MLR—Demographic Fragility Indicator (DF)
5.2. MLR—Social Fragility Indicator (SF)
5.3. MLR—Economic Fragility Indicator (EF)
5.4. MLR—Number of Airbnb Listings (NA)
6. Conclusions
Author Contributions
Funding
Data Availability Statement
Conflicts of Interest
References
- Conti, S.; Dias, Á.; Pereira, L. Perceived City Sustainability and Tourist Behavioural Intentions. Smart Cities 2023, 6, 692–708. [Google Scholar] [CrossRef]
- Anguera-Torrell, O.; Cerdan, A. Which commercial sectors coagglomerate with the accommodation industry? Evidence from Barcelona. Cities 2021, 112, 103112. [Google Scholar] [CrossRef]
- García-Hernández, M.; De la Calle-Vaquero, M.; Yubero, C. Cultural heritage and urban tourism: Historic city centres under pressure. Sustainability 2017, 9, 1346. [Google Scholar] [CrossRef]
- Ignaccolo, C.; Zheng, Y.; Williams, S. Tourism Morphometrics in Venice: Constructing a Tourism Services Index (TSI) to unmask the spatial interplay between tourism and urban form. Cities 2023, 140, 104369. [Google Scholar] [CrossRef]
- Gunter, U.; Önder, I. Determinants of Airbnb demand in Vienna and their implications for the traditional accommodation industry. Tour. Econ. 2018, 24, 270–293. [Google Scholar] [CrossRef]
- Goethe, J.C. Viaggio in Italia, 1786–1788; Sansoni: Florence, Italy, 1959. [Google Scholar]
- Niblett, M.; Beuret, K. Why Travel?: Understanding Our Need to Move and How It Shapes Our Lives; Policy Press: Bristol, UK, 2021. [Google Scholar]
- McCartney, G.J. Hosting a recurring mega-event: Visitor raison d’être. J. Sport Tour. 2005, 10, 113–128. [Google Scholar] [CrossRef]
- Roult, R.; Auger, D.; Lafond, M. Formula 1, city and tourism: A research theme analyzed on the basis of a systematic literature review. Int. J. Tour. Cities 2020, 6, 813–830. [Google Scholar] [CrossRef]
- Altin, L.; Ahas, R.; Silm, S.; Saluveer, E. Megastar concerts in tourism: A study using mobile phone data. Scand. J. Hosp. Tour. 2022, 22, 161–180. [Google Scholar] [CrossRef]
- Smith, A. Events and Urban Regeneration: The Strategic Use of Events to Revitalise Cities; Routledge: Abingdon, UK, 2012. [Google Scholar]
- Ashworth, G.; Page, S.J. Urban tourism research: Recent progress and current paradoxes. Tour. Manag. 2011, 32, 1–15. [Google Scholar] [CrossRef]
- Larraz, B.; García-Gómez, E. Depopulation of Toledo’s historical centre in Spain? Challenge for local politics in world heritage cities. Cities 2020, 105, 102841. [Google Scholar] [CrossRef]
- Bertocchi, D.; Camatti, N.; Giove, S.; van der Borg, J. Venice and overtourism: Simulating sustainable development scenarios through a tourism carrying capacity model. Sustainability 2020, 12, 512. [Google Scholar] [CrossRef]
- Zanini, S. Tourism pressures and depopulation in Cannaregio: Effects of mass tourism on Venetian cultural heritage. J. Cult. Herit. Manag. Sustain. Dev. 2017, 7, 164–178. [Google Scholar] [CrossRef]
- Sánchez-Franco, M.J.; Aramendia-Muneta, M.E. Why do guests stay at Airbnb versus hotels? An empirical analysis of necessary and sufficient conditions. J. Innov. Knowl. 2023, 8, 100380. [Google Scholar] [CrossRef]
- Brauckmann, S. City tourism and the sharing economy–potential effects of online peer-to-peer marketplaces on urban property markets. J. Tour. Futures 2017, 3, 114–126. [Google Scholar] [CrossRef]
- Leigh, J.; Webster, C.; Ivanov, S. Future Tourism: Political, Social and Economic Challenges; Routledge: Abingdon, UK, 2012. [Google Scholar]
- Oskam, J.; Boswijk, A. Airbnb: The future of networked hospitality businesses. J. Tour. Futures 2016, 2, 22–42. [Google Scholar] [CrossRef]
- Gutiérrez, J.; García-Palomares, J.C.; Romanillos, G.; Salas-Olmedo, M.H. The eruption of Airbnb in tourist cities: Comparing spatial patterns of hotels and peer-to-peer accommodation in Barcelona. Tour. Manag. 2017, 62, 278–291. [Google Scholar] [CrossRef]
- Edelman, B.G.; Luca, M. Digital discrimination: The case of Airbnb. com. In Harvard Business School NOM Unit Working Paper; Harvard Business School: Boston, MA, USA, 2014. [Google Scholar]
- Adamiak, C. Mapping Airbnb supply in European cities. Ann. Tour. Res. 2018, 71, 67–71. [Google Scholar] [CrossRef]
- Ding, K.; Niu, Y.; Choo, W.C. The evolution of Airbnb research: A systematic literature review using structural topic modeling. Heliyon 2023, 9, e17090. [Google Scholar] [CrossRef]
- Guttentag, D. Airbnb: Disruptive innovation and the rise of an informal tourism accommodation sector. Curr. Issues Tour. 2015, 18, 1192–1217. [Google Scholar] [CrossRef]
- Guttentag, D. Progress on Airbnb: A literature review. J. Hosp. Tour. Technol. 2019, 10, 814–844. [Google Scholar] [CrossRef]
- Kwok, L.; Tang, Y.; Yu, B. The 7 Ps marketing mix of home-sharing services: Mining travelers’ online reviews on Airbnb. Int. J. Hosp. Manag. 2020, 90, 102616. [Google Scholar] [CrossRef]
- Gurran, N.; Phibbs, P. When tourists move in: How should urban planners respond to Airbnb? J. Am. Plan. Assoc. 2017, 83, 80–92. [Google Scholar] [CrossRef]
- Novy, J.; Colomb, C. Urban tourism as a source of contention and social mobilisations: A critical review. Travel Tour. Age Overtourism 2021, 6–23. [Google Scholar] [CrossRef]
- Marine-Roig, E.; Huertas, A. How safety affects destination image projected through online travel reviews. J. Destin. Mark. Manag. 2020, 18, 100469. [Google Scholar] [CrossRef]
- Liu, D.; Gratton, C. The Impact of Mega Sporting Events on Live Spectators’ Images of a Host City: A Case Study of the Shanghai F1 Grand Prix. Tour. Econ. 2010, 16, 629–645. [Google Scholar] [CrossRef]
- Xu, Y.; Xue, J.; Park, S.; Yue, Y. Towards a multidimensional view of tourist mobility patterns in cities: A mobile phone data perspective. Comput. Environ. Urban Syst. 2021, 86, 101593. [Google Scholar] [CrossRef]
- Qian, C.; Li, W.; Duan, Z.; Yang, D.; Ran, B. Using mobile phone data to determine spatial correlations between tourism facilities. J. Transp. Geogr. 2021, 92, 103018. [Google Scholar] [CrossRef]
- Shan, L.; He, S.; Wan, C. Unraveling the dynamic Airbnb-gentrification interrelation before and after the COVID-19 Pandemic: Evidence from Beijing, China. Cities 2023, 137, 104270. [Google Scholar] [CrossRef]
- Hoffman, L.M.; Heisler, B.S. Airbnb, Short-Term Rentals and the Future of Housing; Routledge: Abingdon, UK, 2020. [Google Scholar]
- Schor, J.B. Does the sharing economy increase inequality within the eighty percent?: Findings from a qualitative study of platform providers. Camb. J. Reg. Econ. Soc. 2017, 10, 263–279. [Google Scholar] [CrossRef]
- OECD. States of Fragility 2022; OECD: Paris, France, 2022. [Google Scholar]
- OECD. States of Fragility 2016: Understanding Violence; OECD: Paris, France, 2016. [Google Scholar]
- Rabiei-Dastjerdi, H.; Matthews, S.A. Who gets what, where, and how much? Composite index of spatial inequality for small areas in Tehran. Reg. Sci. Policy Pract. 2021, 13, 191–205. [Google Scholar] [CrossRef]
- Guillaumont, P.; Guillaumont Jeanneney, S. State Fragility and Economic Vulnerability: What Is Measured and Why? 2009. Available online: https://core.ac.uk/download/pdf/6559686.pdf (accessed on 31 July 2023).
- Arcagni, A.; Barbiano di Belgiojoso, E.; Fattore, M.; Rimoldi, S.M. Multidimensional analysis of deprivation and fragility patterns of migrants in Lombardy, using partially ordered sets and self-organizing maps. Soc. Indic. Res. 2019, 141, 551–579. [Google Scholar] [CrossRef]
- Alizadeh, T.; Farid, R.; Sarkar, S. Towards understanding the socio-economic patterns of sharing economy in Australia: An investigation of Airbnb listings in Sydney and Melbourne metropolitan regions. In Disruptive Urbanism; Routledge: Abingdon, UK, 2020; pp. 53–71. [Google Scholar]
- Ayouba, K.; Breuillé, M.; Grivault, C.; Le Gallo, J. Does Airbnb disrupt the private rental market? An empirical analysis for French cities. Int. Reg. Sci. Rev. 2020, 43, 76–104. [Google Scholar] [CrossRef]
- Corriere di Bologna Le misure del Comune e dell’Università Contro Gli Affitti Brevi e Favorire Quelli Lunghi: Nasce Anche la Clausola Anti-discriminazione da Far Rispettare nei Contratti. 2022. Available online: https://corrieredibologna.corriere.it/bologna/politica/22_luglio_20/bologna-affitti-patto-anti-airbnb-contributi-canoni-concordati-fondi-studenti-7ed602b0-085b-11ed-af9d-cfd200bca4da.shtml (accessed on 31 July 2023).
- La Repubblica Alloggi a Bologna, il Rettore: “Case Introvabili Adesso Basta ai B&B, i Genitori dei Ragazzi Sono Disperati”. 2022. Available online: https://bologna.repubblica.it/cronaca/2022/10/18/news/emergenza_alloggi_bologna_il_rettore_case_introvabili_adesso_basta_ai_bb_i_genitori_dei_ragazzi_sono_disperati-370538442/ (accessed on 31 July 2023).
- Bolognatoday Case Introvabili e Appartamenti Affittati in due Giorni: Benvenuti Nella Giungla Bolognese. 2023. Available online: https://www.bolognatoday.it/cronaca/mercato-immobiliare-affitti-aumento.html (accessed on 31 July 2023).
- Bolognatoday Un Posto sul Divano a 450€/mese. Mercato Degli Affitti alla Deriva. 2023. Available online: https://www.bolognatoday.it/attualita/affitti-annunci-bologna-case-studenti.html (accessed on 31 July 2023).
- Ependi, U.; Rochim, A.F.; Wibowo, A. An Assessment Model for Sustainable Cities Using Crowdsourced Data Based on General System Theory: A Design Science Methodology Approach. Smart Cities 2023, 6, 3032–3059. [Google Scholar] [CrossRef]
- Rabiei-Dastjerdi, H.; McArdle, G.; Matthews, S.A.; Keenan, P. Gap analysis in decision support systems for real-estate in the era of the digital earth. Int. J. Digit. Earth 2021, 14, 121–138. [Google Scholar] [CrossRef]
- Janssen, M.; Charalabidis, Y.; Zuiderwijk, A. Benefits, adoption barriers and myths of open data and open government. Inf. Syst. Manag. 2012, 29, 258–268. [Google Scholar] [CrossRef]
- Veljković, N.; Bogdanović-Dinić, S.; Stoimenov, L. Benchmarking open government: An open data perspective. Gov. Inf. Q. 2014, 31, 278–290. [Google Scholar] [CrossRef]
- OpenStreetMap. Available online: https://www.openstreetmap.org (accessed on 31 July 2023).
- insideairbnb.com—Bologna Dataset. Available online: http://insideairbnb.com/bologna/ (accessed on 31 July 2023).
- Hati, S.R.H.; Balqiah, T.E.; Hananto, A.; Yuliati, E. A decade of systematic literature review on Airbnb: The sharing economy from a multiple stakeholder perspective. Heliyon 2021, 7, e08222. [Google Scholar] [CrossRef]
- Dogru, T.; Hanks, L.; Mody, M.; Suess, C.; Sirakaya-Turk, E. The effects of Airbnb on hotel performance: Evidence from cities beyond the United States. Tour. Manag. 2020, 79, 104090. [Google Scholar] [CrossRef]
- Guttentag, D.A.; Litvin, S.W.; Smith, W.W. To Airbnb or not to Airbnb: Does Airbnb feel safer than hotels during a pandemic? Int. J. Hosp. Manag. 2023, 114, 103550. [Google Scholar] [CrossRef]
- Roelofsen, M. Exploring the socio-spatial inequalities of Airbnb in Sofia, Bulgaria. Erdkunde 2018, 72, 313–328. [Google Scholar] [CrossRef]
- Reichle, P.; Fidrmuc, J.; Reck, F. The sharing economy and housing markets in selected European cities. J. Hous. Econ. 2023, 60, 101914. [Google Scholar] [CrossRef]
- He, J.; Li, B.; Wang, X.S. Image features and demand in the sharing economy: A study of Airbnb. Int. J. Res. Mark. 2023; in press. [Google Scholar] [CrossRef]
- Schäfer, P.; Braun, N. Misuse through short-term rentals on the Berlin housing market. Int. J. Hous. Mark. Anal. 2016, 9, 287–311. [Google Scholar] [CrossRef]
- van Holm, E.J. Evaluating the impact of short-term rental regulations on Airbnb in New Orleans. Cities 2020, 104, 102803. [Google Scholar] [CrossRef]
- Chang, H. Does the room sharing business model disrupt housing markets? Empirical evidence of Airbnb in Taiwan. J. Hous. Econ. 2020, 49, 101706. [Google Scholar] [CrossRef] [PubMed]
- Cheung, K.S.; Yiu, C.Y. Touristification, Airbnb and the tourism-led rent gap: Evidence from a revealed preference approach. Tour. Manag. 2022, 92, 104567. [Google Scholar] [CrossRef]
- Ki, D.; Lee, S. Spatial distribution and location characteristics of Airbnb in Seoul, Korea. Sustainability 2019, 11, 4108. [Google Scholar] [CrossRef]
- Accetturo, A.; Lamorgese, A.R.; Mocetti, S.; Pellegrino, D. Housing supply elasticity and growth: Evidence from Italian cities. J. Econ. Geogr. 2021, 21, 367–396. [Google Scholar] [CrossRef]
- Picascia, S.; Romano, A.; Teobaldi, M. The airification of cities: Making sense of the impact of peer to peer short term letting on urban functions and economy. In Proceedings of the Annual Congress of the Association of European Schools of Planning, Lisbon, Portugal, 11–14 July 2017. [Google Scholar]
- Rabiei-Dastjerdi, H.; McArdle, G.; Hynes, W. Which came first, the gentrification or the Airbnb? Identifying spatial patterns of neighbourhood change using Airbnb data. Habitat Int. 2022, 125, 102582. [Google Scholar] [CrossRef]
- Helgadóttir, G.; Einarsdóttir, A.V.; Burns, G.L.; Gunnarsdóttir, G.Þ.; Matthíasdóttir, J.M.E. Social sustainability of tourism in Iceland: A qualitative inquiry. Scand. J. Hosp. Tour. 2019, 19, 404–421. [Google Scholar] [CrossRef]
- Yang, J.; Ryan, C.; Zhang, L. Social conflict in communities impacted by tourism. Tour. Manag. 2013, 35, 82–93. [Google Scholar] [CrossRef]
- Cocola-Gant, A.; Gago, A. Airbnb, buy-to-let investment and tourism-driven displacement: A case study in Lisbon. Environ. Plan. A Econ. Space 2021, 53, 1671–1688. [Google Scholar] [CrossRef]
- Guttentag, D.A.; Smith, S.L. Assessing Airbnb as a disruptive innovation relative to hotels: Substitution and comparative performance expectations. Int. J. Hosp. Manag. 2017, 64, 1–10. [Google Scholar] [CrossRef]
- Guttentag, D.; Smith, S.; Potwarka, L.; Havitz, M. Why tourists choose Airbnb: A motivation-based segmentation study. J. Travel Res. 2018, 57, 342–359. [Google Scholar] [CrossRef]
- Sthapit, E.; Jimenez-Barreto, J. Exploring tourists’ memorable hospitality experiences: An Airbnb perspective. Tour. Manag. Perspect. 2018, 28, 83–92. [Google Scholar] [CrossRef]
- Bilancio Demografico Mensile. Available online: https://demo.istat.it/app/?l=it&a=2023&i=D7B (accessed on 31 July 2023).
- Basi Territoriali del Comune di Bologna. Available online: http://inumeridibolognametropolitana.it/node/772 (accessed on 31 July 2023).
- Buzar, S.; Hall, R.; Ogden, P.E. Beyond gentrification: The demographic reurbanisation of Bologna. Environ. Plann. A 2007, 39, 64–85. [Google Scholar] [CrossRef]
- Lomonaco, A.; Maggio, M. Living in a rental in Bologna between housing dynamics and migration trends. Multidimens. Hous. Deprivation 2022, 106–120. Available online: https://cris.unibo.it/retrieve/800640c7-b335-47a6-8ef0-ff9c6256cc41/Living%20in%20a%20rental%20in%20Bologna%20between%20housing%20dynamics%20and%20migration%20trends%20.pdf (accessed on 31 July 2023).
- Popolazione Residente per Luogo di Nascita al 31 Dicembre—Serie Storica. Available online: http://www.inumeridibolognametropolitana.it/dati-statistici/popolazione-residente-luogo-di-nascita-al-31-dicembre-serie-storica (accessed on 31 July 2023).
- Battistini, R.; Passarini, F.; Marrollo, R.; Lantieri, C.; Simone, A.; Vignali, V. How to Assess the Carbon Footprint of a Large University? The Case Study of University of Bologna’s Multicampus Organization. Energies 2023, 16, 166. [Google Scholar] [CrossRef]
- Battistini, R.; Nalin, A.; Simone, A.; Lantieri, C.; Vignali, V. How do University Student Cyclists Ride? The Case of University of Bologna. Appl. Sci. 2022, 12, 11569. [Google Scholar] [CrossRef]
- Pilz, J. Interfacing Geostatistics and GIS; Springer: Berlin/Heidelberg, Germany, 2009. [Google Scholar]
- ll Mercato Immobiliare Residenziale a Bologna—Dati al 31.12.2022. Available online: http://www.inumeridibolognametropolitana.it/studi-e-ricerche/ll-mercato-immobiliare-residenziale-bologna-dati-al-31122022 (accessed on 31 July 2023).
- Il Patrimonio Immobiliare in Complesso. Available online: http://www.inumeridibolognametropolitana.it/studi-e-ricerche/il-patrimonio-immobiliare-complesso-3 (accessed on 31 July 2023).
- Quotazioni Medie al Metro Quadro Delle Abitazioni Nelle Zone OMI. Available online: http://inumeridibolognametropolitana.it/dati-statistici/quotazioni-medie-al-metro-quadro-delle-abitazioni-nelle-zone-omi (accessed on 31 July 2023).
- Direzione Centrale Servizi Estimativi e Osservatorio Mercato Immobiliare Il Mercato Immobiliare Residenziale. Statistiche Regionali—Emilia-Romagna. In Agenzia delle Entrate; 2023. Available online: https://www.agenziaentrate.gov.it/portale/documents/20143/5340519/SR2023_Emilia_Romagna.pdf/ba0b039e-bbc6-9ebe-f2ef-c439e327a741 (accessed on 31 July 2023).
- Mazziotta, M.; Pareto, A. Comparing Two Non-Compensatory Composite Indices to Measure Changes over Time: A Case Study. Stat. Stat. Econ. J. 2015, 95, 44–53. [Google Scholar]
- ISTAT. Rapporto BES 2015. Il Benessere Equo e Sostenibile in Italia; ISTAT: Roma, Italy, 2015. [Google Scholar]
- Lo Studio Sulla Fragilità nel Comune di Bologna. Available online: http://www.inumeridibolognametropolitana.it/notizie/lo-studio-sulla-fragilita-nel-comune-di-bologna-versione-interattiva (accessed on 31 July 2023).
- Guardigli, L.; Bragadin, M.A.; Della Fornace, F.; Mazzoli, C.; Prati, D. Energy retrofit alternatives and cost-optimal analysis for large public housing stocks. Energy Build 2018, 166, 48–59. [Google Scholar] [CrossRef]
- Horn, K.; Merante, M. Is home sharing driving up rents? Evidence from Airbnb in Boston. J. Hous. Econ. 2017, 38, 14–24. [Google Scholar] [CrossRef]
- Zhang, Z.; Chen, R.J. Assessing Airbnb logistics in cities: Geographic information system and convenience theory. Sustainability 2019, 11, 2462. [Google Scholar] [CrossRef]
- Open Data Bologna. Available online: https://opendata.comune.bologna.it/pages/home/ (accessed on 31 July 2023).
- Bazzoli, N. The commercial transformation of Bolognina and its implications in the neighborhood gentrification process. In Proceedings of the RC21 Conference,“The Ideal City: Between Myth and Reality. Representations, Policies, Contradictions and Challenges for Tomorrow’s Urban Life”, Urbino, Italy, 27–29 August 2015. [Google Scholar]
- San-Jose, L.; Garcia-Merino, J.D.; Retolaza, J.L. Social value in the orange economy: Social accounting applied to museums. Mus. Manag. Curatorship 2023, 38, 231–253. [Google Scholar] [CrossRef]
- Evans, G. From Cultural Quarters to Creative Clusters–Creative Spaces in the New City Economy; Institute of Urban History: Stockholm, Sweden, 2009. [Google Scholar]
- Boeing, G. Measuring the complexity of urban form and design. Urban Des. Int. 2018, 23, 281–292. [Google Scholar] [CrossRef]


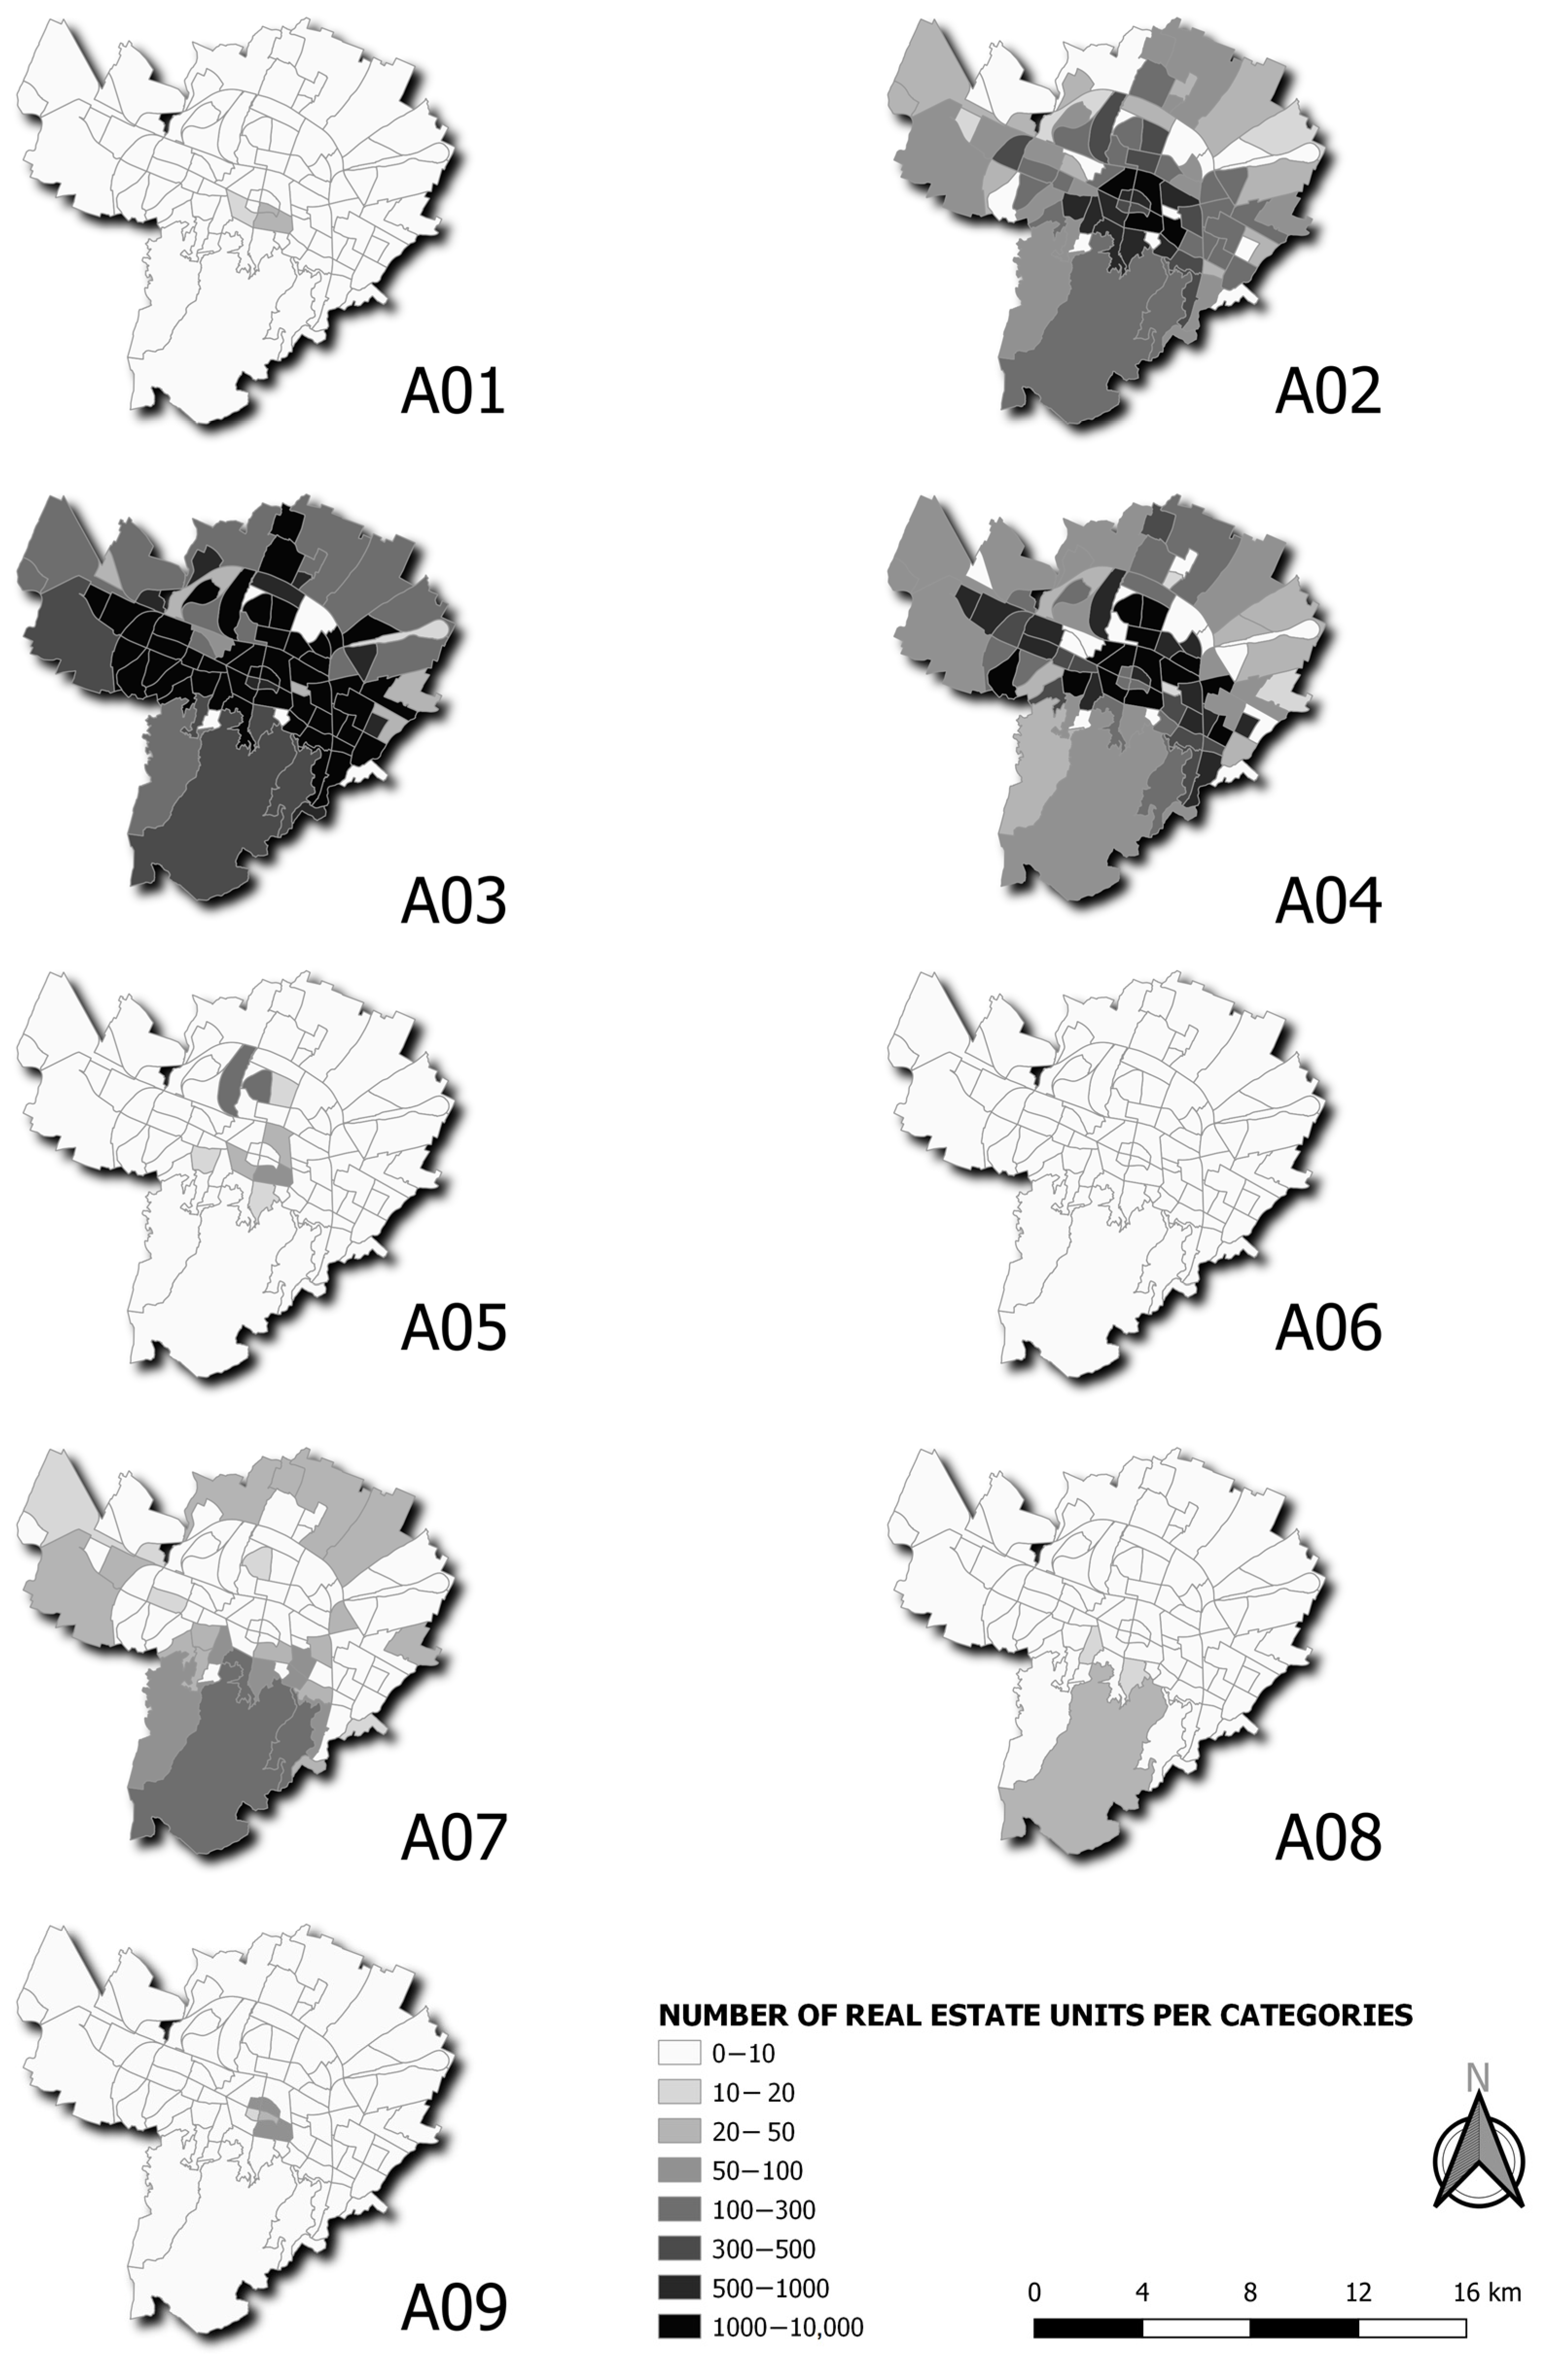
| Real Estate Categories | Description | Number of Real Estate Buildings in Bologna |
|---|---|---|
| A01 | Real estate units belonging to buildings located in prestigious areas with construction, technological and finishing characteristics of a higher level than that of residential buildings | 80 |
| A02 | Real estate units belonging to buildings with construction, technological and finishing characteristics of a level that meets the local market demands for residential buildings | 22,623 |
| A03 | Real estate units belonging to buildings with economy characteristics both for the materials used and for the finishing, and with technological systems limited to the indispensable ones only | 163,560 |
| A04 | Real estate units belonging to buildings with modest-level construction and finishing characteristics. Limited supply of facilities although essential | 39,621 |
| A05 | Real estate units belonging to buildings with very low-level construction and finishing characteristics. Usually not equipped with exclusive sanitation facilities | 483 |
| A06 | Rural estate units | 14 |
| A07 | Cottages or detached house buildings, with courtyard areas cultivated or not as gardens | 1589 |
| A08 | Villas or manors, meant as those properties characterized essentially by the presence of a park and/or garden, built in urban areas intended for such constructions or in prestigious areas with construction and finishing characteristics, of a higher than ordinary level | 69 |
| A09 | Castles and eminent palaces which, due to their structure, the distribution of internal spaces, and built volumes, are not comparable with the standard units of the other categories | 233 |
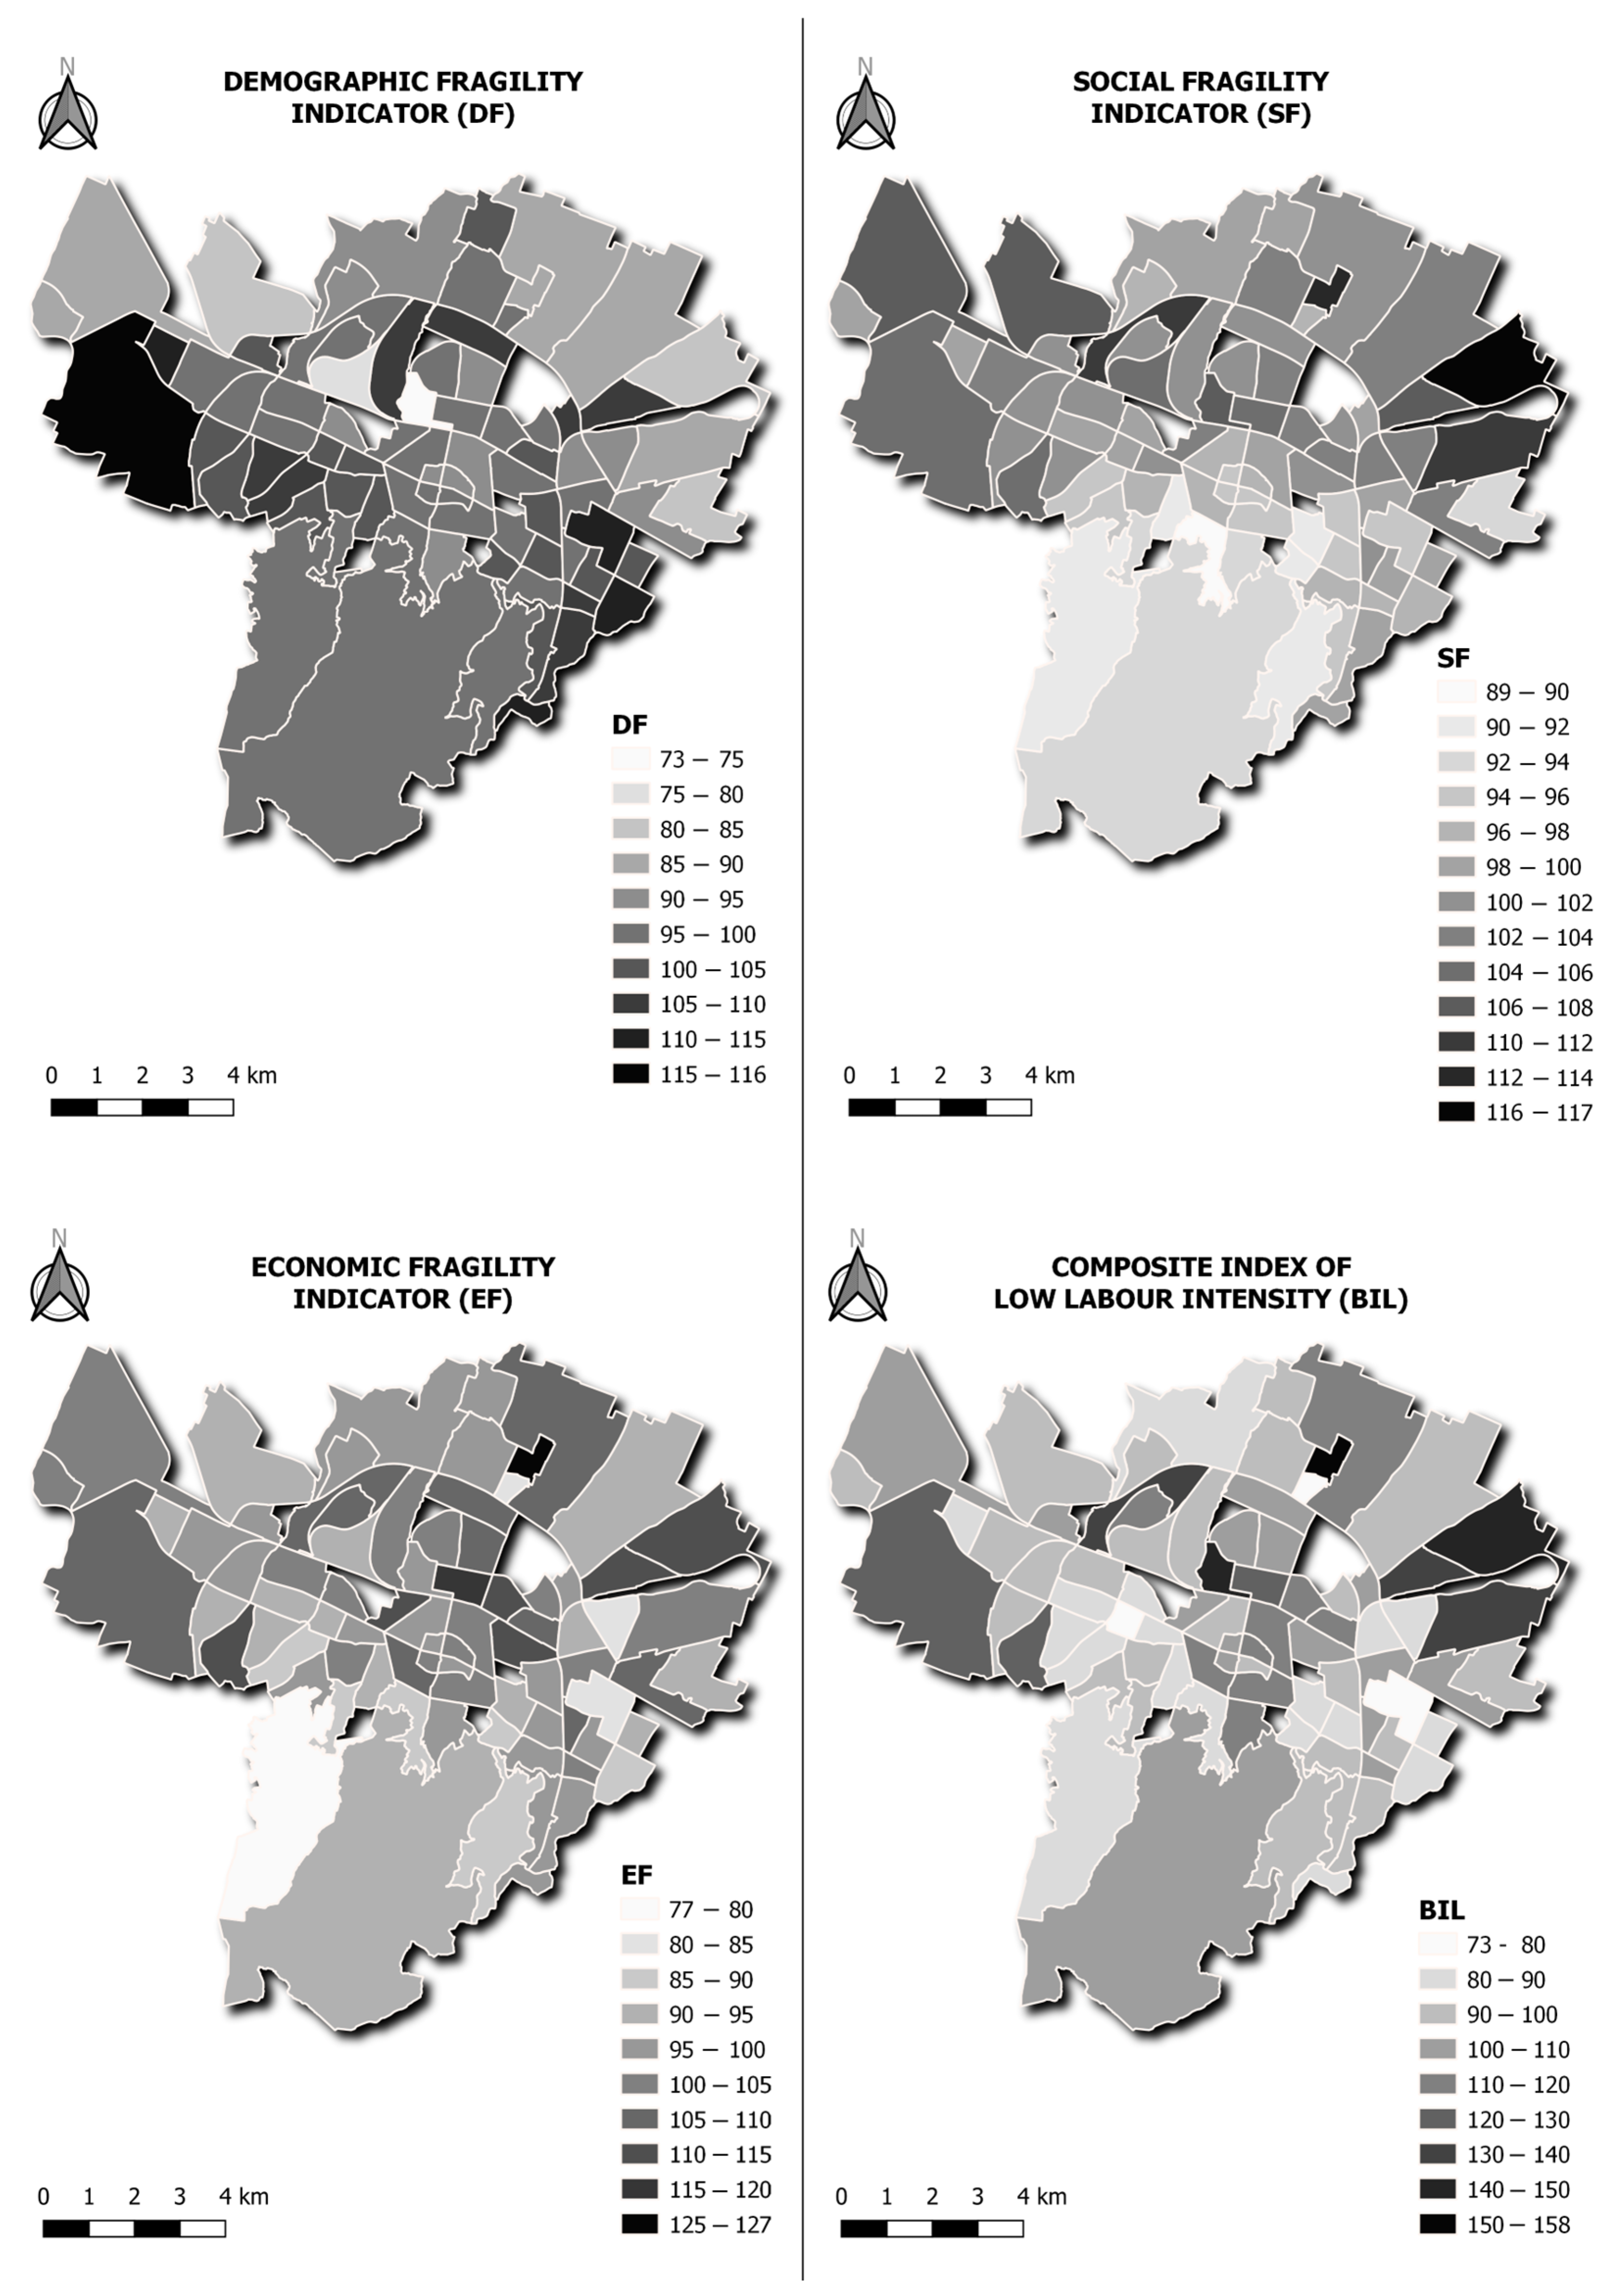
| Fragility Indicator | Analytical Sub-Indicators |
|---|---|
| Demographic fragility |
|
| Social fragility |
|
| Economic fragility |
|
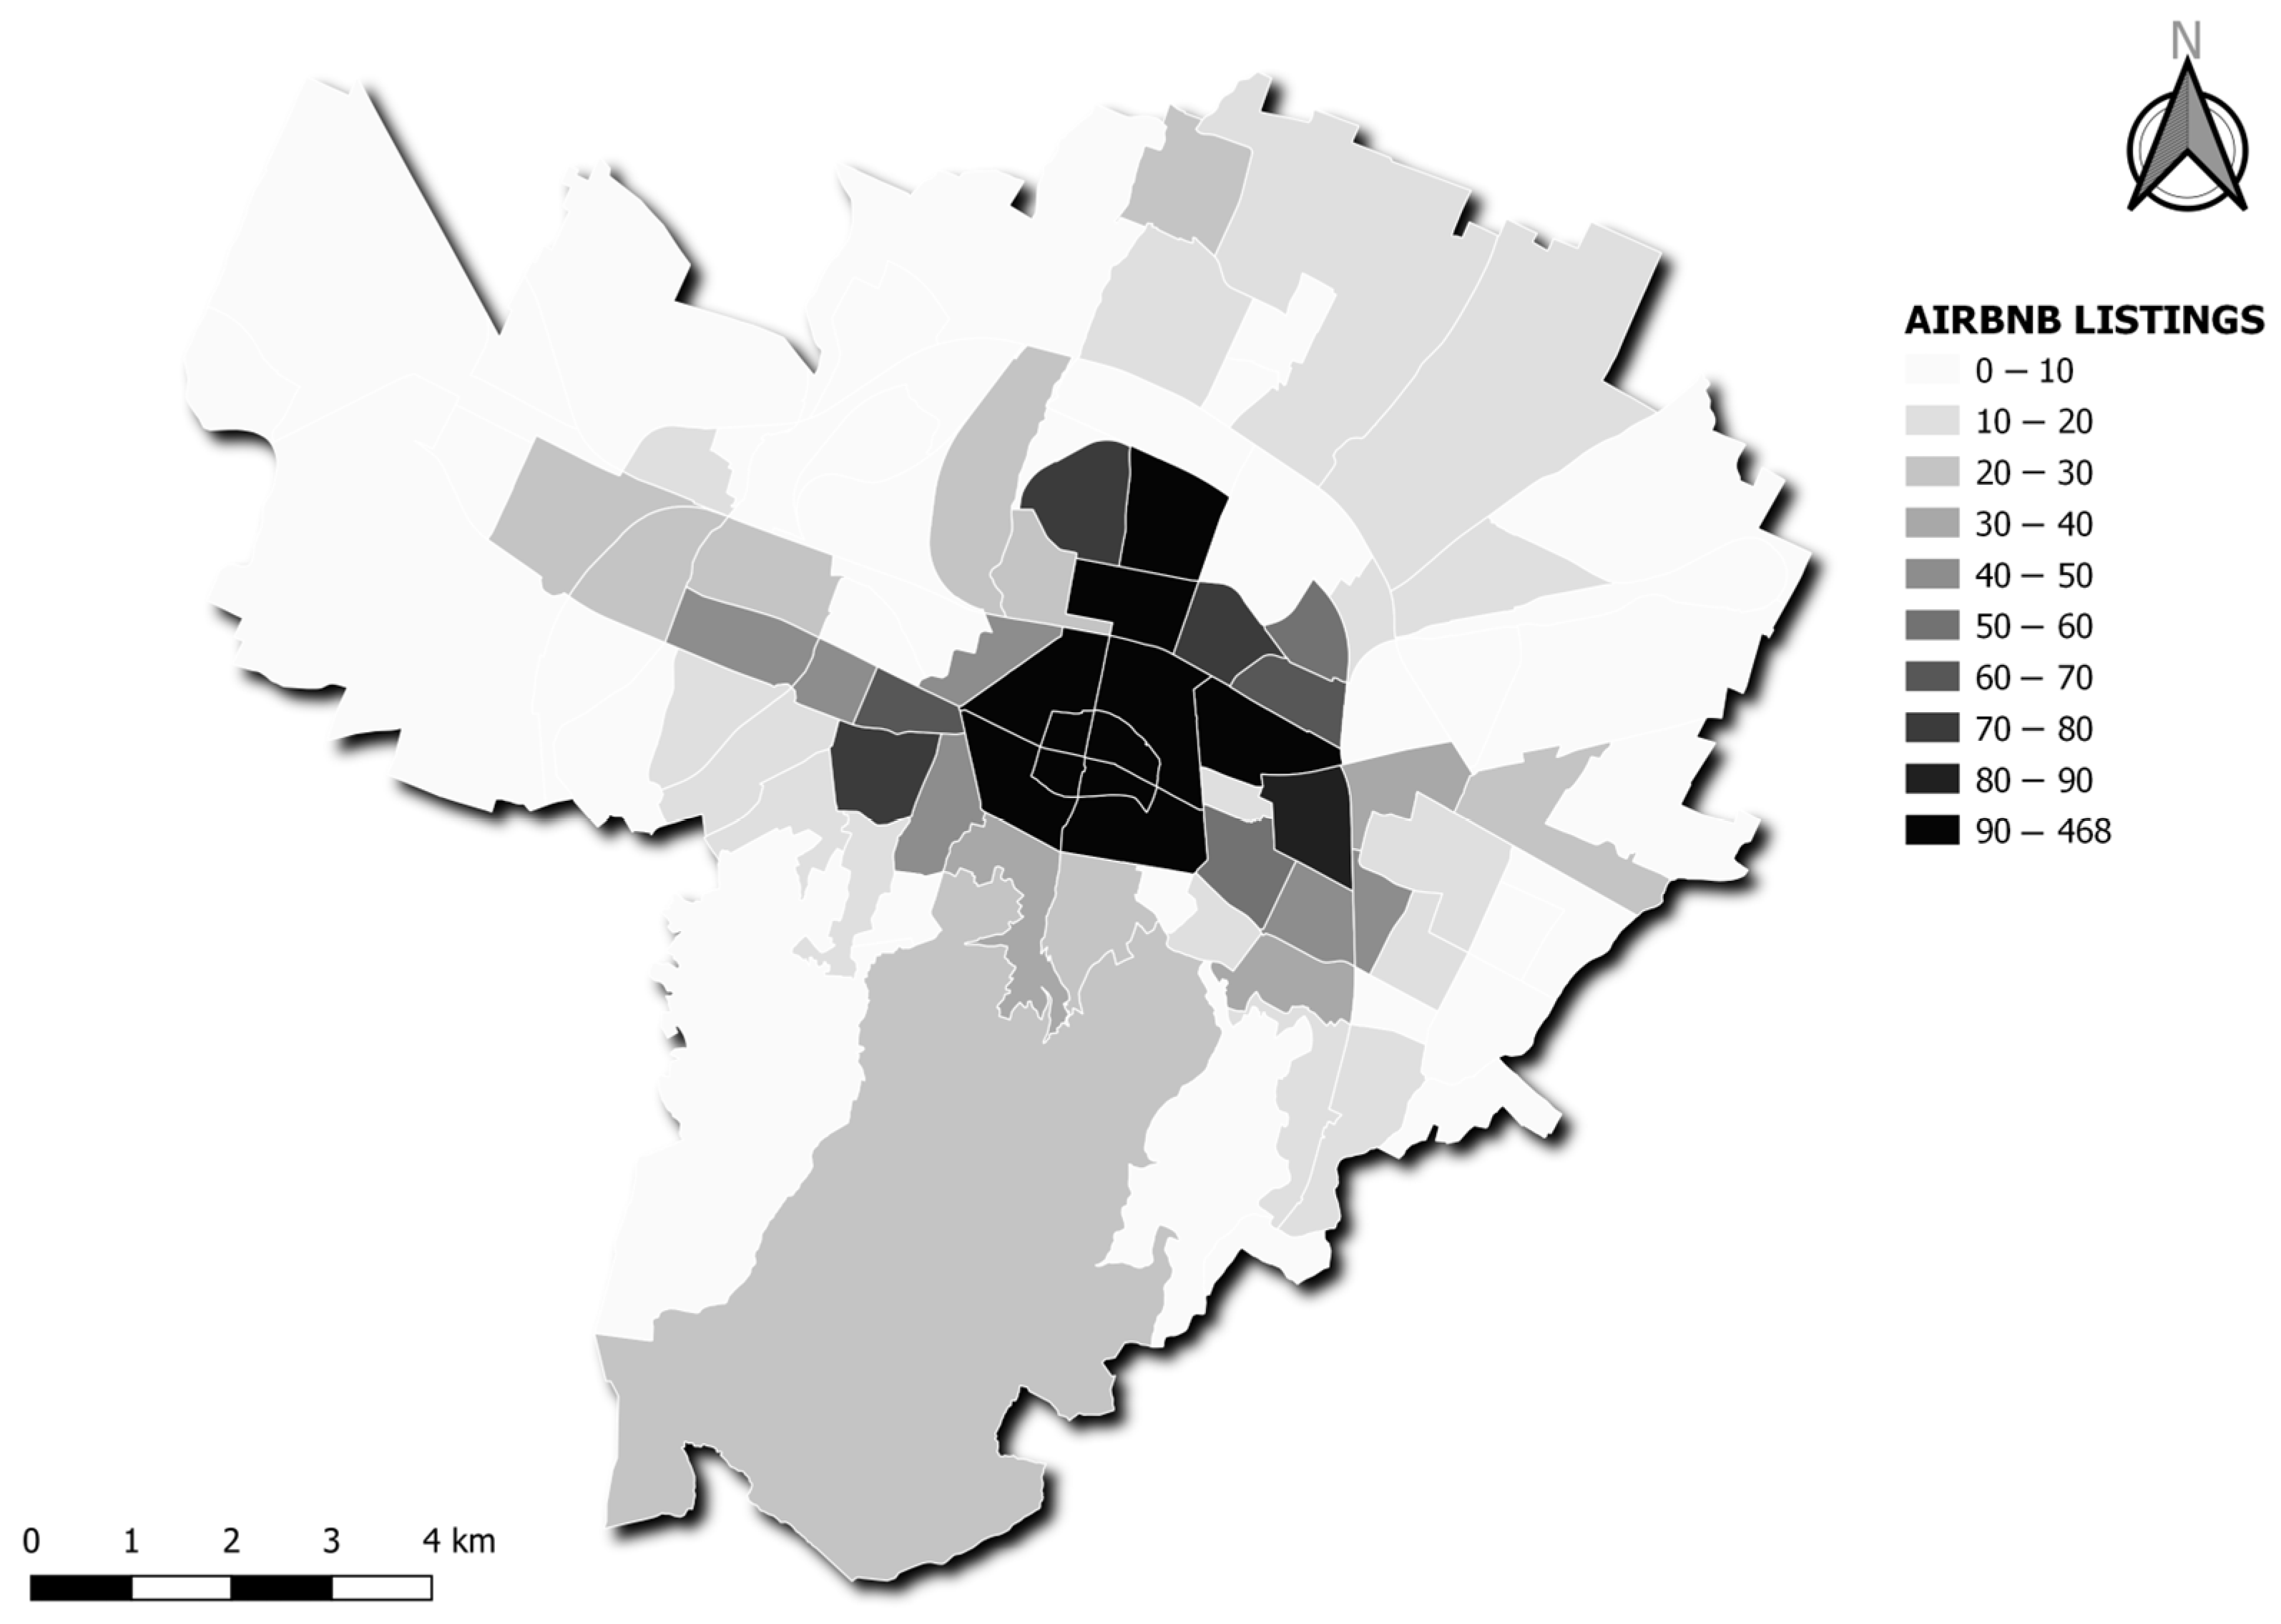
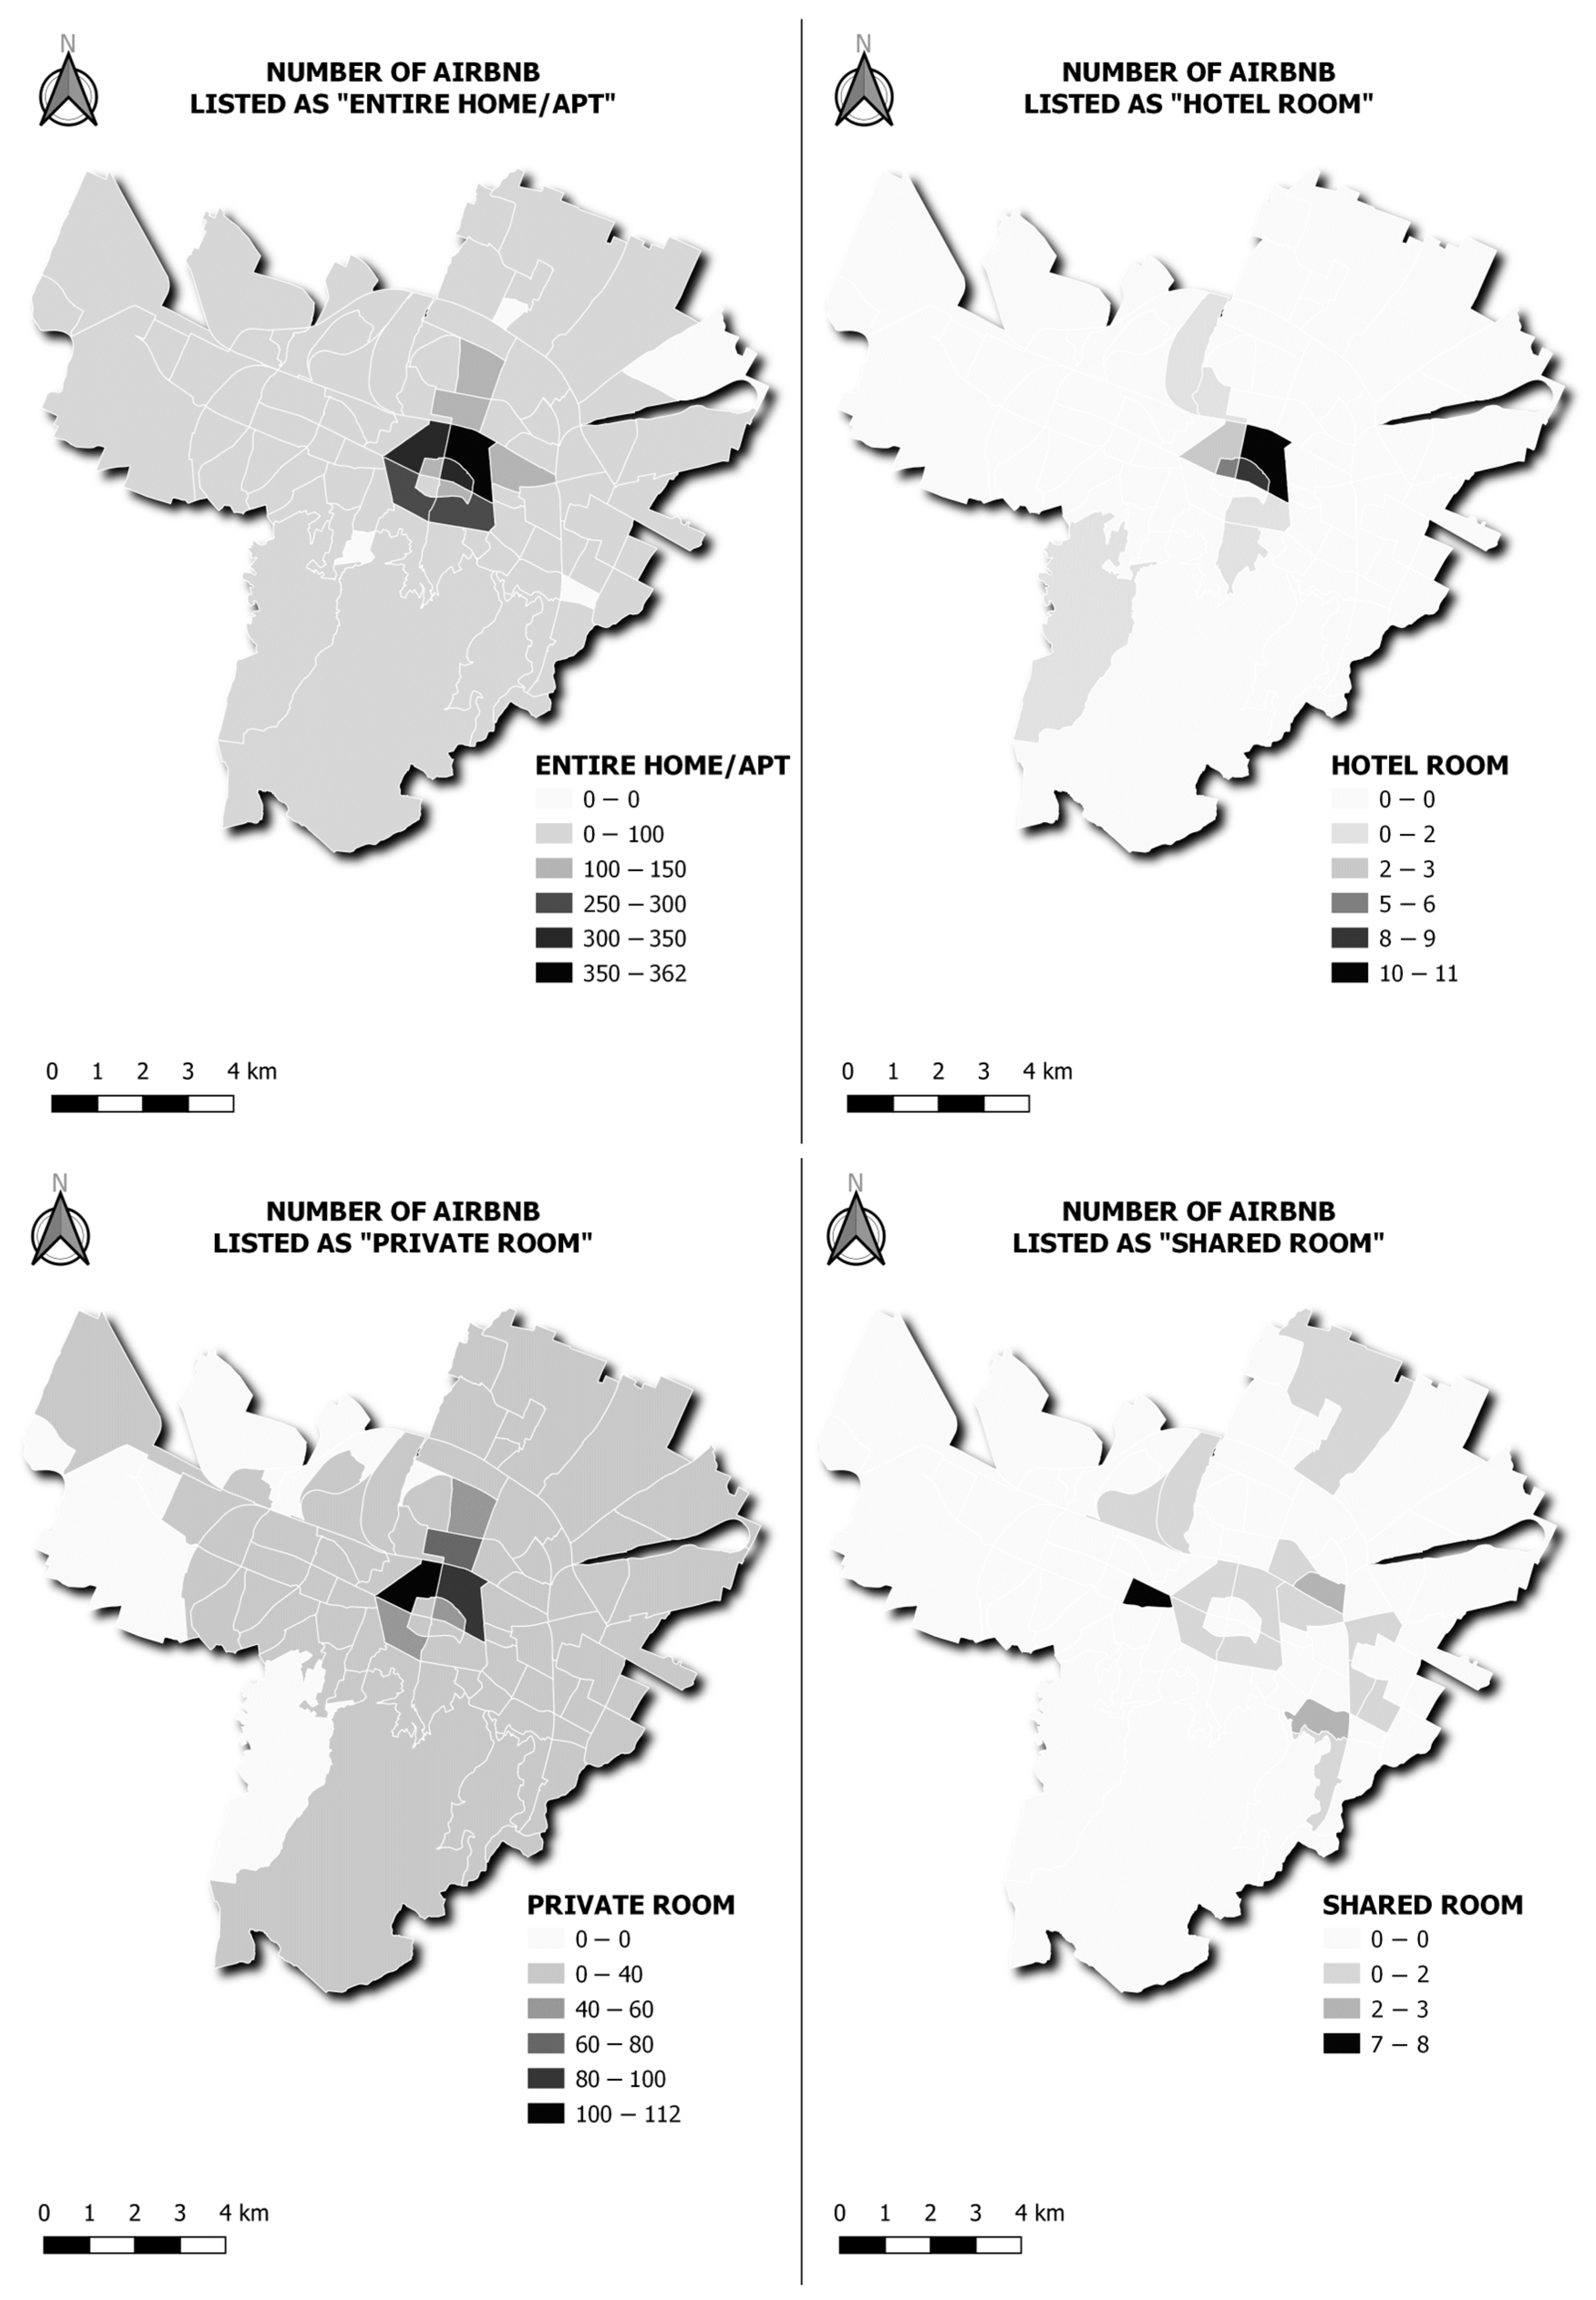
| Characteristic | Value |
|---|---|
| Room type: Entire home/apartment | 3257 (74.1%) |
| Room type: Hotel room | 34 (0.8%) |
| Room type: Private room | 1074 (24.4%) |
| Room type: Shared room | 28 (0.6%) |
| Short-term rentals (no more than 30 nights admitted) | 4351 (99%) |
| Long-term rentals (more than 30 nights admitted) | 42 (1%) |
| Minimum nights: 1 night | 2083 (47.4%) |
| Minimum nights: 2 nights | 1332 (30.3%) |
| Minimum nights: 3 nights | 643 (14.6%) |
| Minimum nights: 4–7 nights | 234 (5.3%) |
| Number of Airbnb hosts with a single listing | 1840 (41.9%) |
| Number of Airbnb hosts with more than one listing | 2553 (58.1%) |
| Average nights booked for each listing | 74 |
| Average price per night (EUR) | 139 |
| Average monthly income (EUR) | 8216 |
| Regressor | MLR—DF | MLR—SF | MLR—EF | MLR—NA |
|---|---|---|---|---|
| Number of Airbnb listings (NA) |  | | | |
| Airbnb availability on yearly basis (AY) | | |||
| Number of historical civil buildings (NH) | | |||
| Number of historic churches (NC) | | | | |
| Number of museums (NM) | | | ||
| Average price (EUR) per square metre (AP) | | | | |
| Real estate unit A01 | | | | |
| Real estate unit A02 | | | | |
| Real estate unit A03 | | | | |
| Real estate unit A04 | | | ||
| Number of dining amenities (ND) | | |||
| Resident population (RP) | | |||
| Demographic Fragility (DF) | | |||
| Social Fragility (SF) | | |||
| Economic fragility (EF) | | |||
| Composite index of Low Labour Intensity (BIL) | |
| Dependent variable: | DF | R-squared: | 0.397 | |||
| No. observations: | 4364 | Adj. R-squared: | 0.396 | |||
| Df model: | 4363 | F: | 409.930 | |||
| Durbin-Watson: | 1.995 | |||||
| Coeff. (std.) | t | p | ||||
| Constant | 92.760 | 200.657 | 0.000 | |||
| NA | −0.917 | −41.991 | 0.000 | |||
| NC | 0.313 | 13.052 | 0.000 | |||
| A01 | 0.058 | 2.471 | 0.014 | |||
| A02 | 0.383 | 18.275 | 0.000 | |||
| A03 | 0.600 | 27.897 | 0.000 | |||
| A04 | −0.308 | −12.193 | 0.000 | |||
| AP | 0.114 | 7.452 | 0.000 | |||
| Dependent variable: | SF | R-squared: | 0.837 | |||
| No. observations: | 4364 | Adj. R-squared: | 0.837 | |||
| Df model: | 4363 | F: | 3731.023 | |||
| Durbin-Watson: | 1.880 | |||||
| Coeff. (std.) | t | p | ||||
| Constant | 117.873 | 627.151 | 0.000 | |||
| NA | 0.119 | 10.496 | 0.000 | |||
| A01 | −0.091 | −8.811 | 0.000 | |||
| A02 | −0.338 | −31.595 | 0.000 | |||
| A03 | −0.153 | −13.823 | 0.000 | |||
| A04 | 0.242 | 20.375 | 0.000 | |||
| AP | −0.869 | −108.788 | 0.000 | |||
| Dependent variable: | EF | R-squared: | 0.644 | |||
| No. observations: | 4364 | Adj. R-squared: | 0.644 | |||
| Df model: | 4363 | F: | 1126.385 | |||
| Durbin-Watson: | 1.909 | |||||
| Coeff. (std.) | t | p | ||||
| Constant | 110.787 | 232.576 | 0.000 | |||
| NA | 1.031 | 41.288 | 0.000 | |||
| NM | −0.710 | −32.293 | 0.000 | |||
| NC | −0.300 | −15.641 | 0.000 | |||
| A01 | 0.326 | 16.830 | 0.000 | |||
| A02 | −0.621 | −41.716 | 0.000 | |||
| A03 | 0.534 | 37.049 | 0.000 | |||
| AP | −0.329 | −28.368 | 0.000 | |||
| Dependent variable: | NA | R-squared: | 0.927 | |||
| No. observations: | 3880 | Adj. R-squared: | 0.927 | |||
| Df model: | 3879 | F: | 4917.024 | |||
| Durbin-Watson: | 1.842 | |||||
| Coeff. (std.) | t | p | ||||
| Constant | 335.230 | 8.402 | 0.000 | |||
| AY | −0.013 | −2.889 | 0.004 | |||
| ND | 0.654 | 65.912 | 0.000 | |||
| NH | −0.117 | −14.045 | 0.000 | |||
| NC | 0.129 | 20.671 | 0.000 | |||
| NM | 0.208 | 17.791 | 0.000 | |||
| RP | 0.219 | 31.316 | 0.000 | |||
| DF | −0.018 | −2.988 | 0.003 | |||
| SF | −0.049 | −6.249 | 0.000 | |||
| EF | −0.072 | −7.060 | 0.000 | |||
| BIL | 0.101 | 10.617 | 0.000 | |||
Disclaimer/Publisher’s Note: The statements, opinions and data contained in all publications are solely those of the individual author(s) and contributor(s) and not of MDPI and/or the editor(s). MDPI and/or the editor(s) disclaim responsibility for any injury to people or property resulting from any ideas, methods, instructions or products referred to in the content. |
© 2023 by the authors. Licensee MDPI, Basel, Switzerland. This article is an open access article distributed under the terms and conditions of the Creative Commons Attribution (CC BY) license (https://creativecommons.org/licenses/by/4.0/).
Share and Cite
Nalin, A.; Cameli, L.; Pazzini, M.; Simone, A.; Vignali, V.; Lantieri, C. Unveiling the Socio-Economic Fragility of a Major Urban Touristic Destination through Open Data and Airbnb Data: The Case Study of Bologna, Italy. Smart Cities 2023, 6, 3138-3160. https://doi.org/10.3390/smartcities6060140
Nalin A, Cameli L, Pazzini M, Simone A, Vignali V, Lantieri C. Unveiling the Socio-Economic Fragility of a Major Urban Touristic Destination through Open Data and Airbnb Data: The Case Study of Bologna, Italy. Smart Cities. 2023; 6(6):3138-3160. https://doi.org/10.3390/smartcities6060140
Chicago/Turabian StyleNalin, Alessandro, Leonardo Cameli, Margherita Pazzini, Andrea Simone, Valeria Vignali, and Claudio Lantieri. 2023. "Unveiling the Socio-Economic Fragility of a Major Urban Touristic Destination through Open Data and Airbnb Data: The Case Study of Bologna, Italy" Smart Cities 6, no. 6: 3138-3160. https://doi.org/10.3390/smartcities6060140