Article

From Traffic Congestion to Sustainable Mobility: A Case Study of Public Transport in Odesa, Ukraine

1
Odesa Automobile and Road Vocational College, Odesa Polytechnic National University, 65044 Odesa, Ukraine
2
Odesa Polytechnic National University, 65044 Odesa, Ukraine
3
Department of Civil Engineering, Ghent University, 9000 Ghent, Belgium
4
Department of Geography, Ghent University, 9000 Ghent, Belgium
5
Department of Geography, University of Tartu, 51014 Tartu, Estonia
*
Author to whom correspondence should be addressed.
Smart Cities 2023, 6(3), 1398-1415; https://doi.org/10.3390/smartcities6030067
Submission received: 21 January 2023 / Revised: 2 May 2023 / Accepted: 16 May 2023 / Published: 19 May 2023

Abstract

:
Consistent and reliable information on passenger traffic is considered crucial for the efficient operation of the public transport (PT) network. The PT network is used to improve public services and thus attract more passengers. This study evaluated the passenger traffic in Odesa, Ukraine, due to the inefficient urban transport system. The main aim of this study was to make PT better by examining passenger distribution on traffic routes and specifying characteristics of PT travel influencing individual satisfaction. The metric-tabular method was used to collect data and examine the number of incoming and outgoing passengers at each bus stop. The results of the passenger and PT analysis provide valuable recommendations for optimizing future routes. It is beneficial for transport companies to implement such recommendations so that inefficient transport on the route can be reduced by either reforming the route network or choosing the optimal number of buses. According to the findings of this study, understanding PT services is the most important determinant of PT adoption. The main implications of the findings are of particular interest to policymakers who develop policies in the field of passenger transport and also to transport scientists and students.

1. Introduction

A comprehensive and efficient transport infrastructure is crucial for well-functioning economies and the development of regions and cities [1,2,3,4]. Changes in mobility needs during the 20th century also mean changes in business conditions and an increasing population [5,6]. In the past, people’s mobility was limited to their settlements, cities, and urban regions, whereas in recent years, it has increased to continents and intercontinental areas [7]. In recent years, the transport system has gradually influenced the behavior of passengers when using these services [5,8,9]. Currently, the growth of business activities and the working population has led to a rapid increase in the demand for both the number of trips and the improvement of the quality of travel [6,9,10]. The pressure on the transport systems and logistics of cities and urban agglomerations is increasing [1,11]. In the 21st century, these trends are also important because of their ability to address changes in customer shopping behavior, the mobility needs of individuals, and the fundamental development of modern information and communication technologies [1,5,9].
Urbanization is continuously increasing, which poses numerous challenges (e.g., congestion, demand for parking space, and longer commutes) to the transport system that must be addressed [12,13,14]. Public passenger transport performs an important role in the social infrastructure of a city and regions as a whole [1,15,16]. The rise in the number of privately owned vehicles has resulted in an overloaded street-road network in many cities, reducing the mobility of the population due to traffic congestion, increasing road safety costs, and harming the environment [17,18]. Therefore, the task of increasing attractiveness and increasing demand for public passenger transport is acute for transport sector designers [19]. Proper management of passenger traffic on routes enables transport companies to meet people’s transport needs while making a profit [7,15]. Travel databases provide managers with useful insights about the variability of flow across time, including short and medium-to-long-term trends (such as seasonality) and client preferences and habits. This information can inform the design of various aspects of the transport system, including network planning, capacity allocation, scheduling, fleet management, and more [20]. Using a travel database can track customer preferences and the most frequent travel dates for accommodations or resorts. All information in a database can be applied to assist in marketing a company.
In 2007, it was statistically estimated that more than 50% of the world’s population lives in cities [21]. According to this trend of urban population growth, 6 in 10 people will live in cities by 2030, and this trend will reach 7 in 10 by 2050 [22]. Today, more than ever, issues of optimal performance, quality of life, and sustainable growth are important in cities, and traffic systems perform a key role in urban development. The optimal share of the traffic system with the expansion of the urban population is only achievable through the acquisition of technology, organization, adaptation, and complementarity of transport systems in meeting transport demand [23]. The development of urban transport modes has a direct and significant impact on user comfort, and understanding the credibility of the system and traffic control [15]. Note that a transport system needs to be reliable, punctual, and regular. It should be regular in order to ensure that the time between service runs is consistent. It should be punctual to ensure that the service schedule is met and that the average delay stays below a certain threshold. Additionally, the number of runs that experience a delay larger than a set amount should be kept below a given threshold. Finally, the system should be reliable with a low number of canceled runs compared to the total number of scheduled runs. One of the most important factors of sustainable development in cities is access to transport systems [24,25]. In addition to the technical and surface aspects, the economic conditions of the region, people’s expectations, and environmental sustainability must be taken into account [25,26]. To ensure road safety for people, safe infrastructure must be provided for sustainable transport. If safety levels are low, vehicles should be speeded down, and road safety training should be provided from an early age [27]. Urban planners concerned with transport systems must have technical knowledge and show ingenuity and innovation. In addition, the perception of transport depends on the performance of local government units in cities [28].
Governments in large cities are paying more attention to urban passengers and improving public transport (PT). Many features have been suggested to define the quality of PT. These features may be approximately classified as physical or perceptual. Physical features are evaluated without the intervention of PT users, and assumptions are created about the effects on PT users. In contrast, PT user responses must be observed to measure perceptual features [29,30]. The most common PT physical quality features include reliability, frequency, speed, accessibility, price, information provision, ease of transfers/interchanges, and vehicle condition. The perceptually quality features contain comfort, safety, convenience, and aesthetics. In order to improve the quality of PT services, automated urban PT control systems are designed to manage and regulate passenger transport on urban paths [1,7,13,15,31]. Automated transport is a system in which the driver of a vehicle (aircraft, train, ship, bus, car, etc.) is completely or partially replaced by an outstanding system consisting of computers, sensors, communication equipment, etc. [32]. There are significant passenger information systems at the national level across Europe (e.g., Belgium, Denmark, Germany, and France), but their cooperation is not extensive [33]. Transport plans can increase user satisfaction in a variety of ways, including more cost-effective PT, integration of active transport in facilities, mass schemes, support for neighborhood-based sustainable transport infrastructure, strengthening car groups, and eliminating driving [34]. In addition, “time” is an important factor in satisfying transport users. Time spent waiting for buses is a major part of users’ total transport time. Passengers want to make sure their bus arrives soon, preferably in less than 15 min [35,36]. So, transport programs need active participation in providing accurate timing of PT. By reducing the time wasted by PT users, their motivation to use PT services increases [37].
Any traveler information system depends on a variety of information systems, from the monitoring of transport substructure networks and PT services to PT processes and regulations [25]. PT service providers using local data must be directly compatible with the national travel information system [38,39]. Recently, in the city of Odesa, as in other cities of Ukraine, the structure of demand for passenger transport has changed significantly due to the continuous development of the city. New transport hubs were formed from the growth of new residential areas, shopping and entertainment centers, and tourist, sports, and business centers [40]. However, one of the important tasks of the Odesa transport network in the field of urban commuter transport is to improve the effectiveness of transport companies by forming a market for transport services and capital and creating a competent and active owner [41]. Bus, tram, and trolley networks were established in 2019 to meet the needs of Odesa residents for passenger transport in the city. In Odesa, the annual passenger traffic is estimated at more than 298.3 million [42].

Literature Review

A number of studies conducted by Gao et al. [43], Jing et al. [44], Li et al. [45], Pazoysky et al. [46], and Uimonen et al. [47] have been examined for the problem of distribution of passenger traffic across the urban network.
The number of passengers based on each vehicle entering and leaving each bus stop serves as the baseline for evaluating the origin-destination matrix in their works. The findings of Enoch et al. [48] suggested that the local passenger transport system is about to switch to ‘shared mobility’ and that the PT system must evolve consistently to keep its important role along with the vital role of governments in overseeing the transition. According to the study by Brumercikova and Bukova [49] on the influence of selected factors on public passenger transport, the number of inhabitants, the average and minimum monthly wage, and the unemployment rate have a large effect on the number of passengers. As the number of inhabitants and the average and minimum wages increase, the number of passengers transported decreases. Conversely, when the unemployment rate is higher, the number of people carried is also higher. In terms of using people’s skills, unemployment is currently at an all-time low status, and wages are rising [50]. Moreover, the average fuel price does not affect the number of passengers transported by PT [51]. The results of the study by Poliak et al. [16] showed that PT is a financial drain on public budgets. In the European Union (EU), PT does not have a favorable status in the transport modal. In the 1990s, PT in Central and Eastern Europe had a dominant position in the transport modal. Today, its modal share is declining, especially in bus transport, due to the increase in individual car traffic. In addition, the occurrence of global shocks, such as COVID-19, can have long-term effects on travel behavior. In particular, the peak demand for PT is lower now than in the pre-COVID situation, and the effect can last for several years in the future. The effects are as lasting as possible, and in particular, the peak demand for PT is lower than when the disease has never spread. Thereupon, research on the role of attitude change [52], the formation of new common behavior [53], new social norms and practices [52], welfare effects, and the role of information and communication technologies is important [35,51,54,55,56,57].
A review of previous studies [16,50] indicates a research gap in assessing passenger transport potential and providing recommendations for improvement. The contribution of the present study is to evaluate the passenger transport potential and to provide some suggestions to further improve it in Odesa city. Accordingly, this study can perform an effective role in providing a suitable solution to improve the transport situation in high-traffic areas of Odesa city and worldwide. Passenger traffic varies according to the time of day, days of the week, months and seasons of the year, the activity location system, and the supply of PT services in terms of network, lines, and timetables; this is the general structure of transport system as introduced by Cascetta [58].
As Behrooz [59] stated, transport science is a multidisciplinary field that applies mathematical, statistical, and engineering methods to analyze and optimize transport systems. It encompasses a range of topics, including traffic flow modeling, transport planning, logistics and supply chain management, network analysis, and optimization. Some specific areas within transport science include route optimization, vehicle routing, traffic simulation, demand forecasting, and congestion pricing. The goal of transport science is to improve the efficiency, safety, sustainability, and overall performance of transport systems. In this regard, it is very important to consider all these factors while analyzing passenger transport potential. The purpose of the current study was to make PT better by examining passenger distribution on traffic routes and specifying characteristics of PT travel influencing individual satisfaction. According to the main objectives, this study tries to answer the following research questions:
(1)
Which characteristics of traveling by PT influence individual satisfaction?
(2)
To what extent do the effects of travel characteristics on various subgroups of PT users differ?

2. Transport and Passenger Satisfaction

2.1. Improving the Performance of the Urban Transport System

When developing an information model of the urban transport system, a significant increase in the number of transport facilities in the model does not lead to a significant improvement in the overall transport situation. This points to the need for a selective approach to the construction of transport facilities and the need for initial modeling of the consequences of their commissioning [9]. If scientific ideas, transport planning methods, and the growth of motorization and modeling are not used, changes in traffic flow, despite this construction, will lead to more transport problems and serious traffic problems in the future. The application of scientific methods and primary simulations will be of crucial importance in the choice of construction of means of transport. Saving financial resources will also be of great importance through the effective choice of means of transport. The replacement of old buses with newer, more efficient models can lead to reduced emissions and contribute to a more sustainable and environmentally friendly transport system. As mentioned, new buses can also improve the overall perception of public transport services, which can encourage greater use and potentially reduce congestion caused by private vehicles. In any case, to address congestion effectively, a combination of measures is needed. Some of these measures include increasing PT capacity through improved scheduling and frequency, incentivizing a modal shift from private transport to PT, optimizing public transport routes, and improving traffic management [9]. Therefore, it is essential to ensure the rhythm of transport of citizens on a specific and regular schedule.

2.2. Current Market Shares in PT and Passenger Satisfaction

In the EU, the current share of the PT market (trains, trolleybuses, buses, and coaches) is 16–17% of total passengers [60,61]. PT has a very significant market share as compared to other markets, although having a tiny share overall. According to a survey by the American Community Survey, the market share in the United States is 5% (2006–2010) [62]. The continuous improvement of quality since the 1950s reflected the progress of Europe and the difference from other countries with the improvement of transport conditions in many cities. PT companies and politicians in the EU have continued to invest in suitable, affordable, convenient, safe, and flexible PT [63]. Other factors in expanding the transport network are congested cities, population growth, and economic factors (e.g., limits on employment, heavy taxation, expensive cars, and PT subsidies) [64,65].
Through the statistical survey of European PT, Friman et al. [66] revealed that most PT trips are carried out by bus (56%). According to their findings, Member States with metro systems account for a large number of PT journeys (in 16 of the 28 Member States). Metro trips in Spain, France, and Austria, for example, account for more than a quarter of all trips [66]. The main groups using PT are households, women, and students without access to a private car [67]. According to Friman, Gärling, Ettema, and Olsson [66], PT use among young men has increased slightly in recent years. This declining trend in car use is supported by research conducted in this group. Friman, Gärling, Ettema, and Olsson [66] found that in some European countries, such as Germany, the use of PT has increased among those who have access to a private car.
The relationship between the services and products provided by the companies highlights and explains customer satisfaction and customer well-being [63,68]. In recent years, therefore, the measurement of satisfaction has been considered in the evaluation of the quality of PT. Ettema et al. [69] define travel pleasure as the effect felt during the cognitive appraisal of a journey, a frequently repeating trip (such as bus rides), or travel in general. Furthermore, travel pleasure has been demonstrated to have an indirect effect on overall mental health and life satisfaction, determining total well-being. Based on the findings of Friman et al. [66], an important distinction can be made between PT quality characteristics that are directly related to the user experience (understood characteristics) and aspects that exist without user involvement (physical characteristics). Factors that affect physical characteristics of monitoring and measurement, such as time, reliability, frequency, or speed, provide an overview and indication of service reliability and performance according to the plan [70]. It can therefore provide information for benchmarking PT services and guiding additional investment decisions. Nevertheless, the assessment of physical characteristics does not provide information about the procedure of system experiences and, thus user satisfaction. For example, Chowdhury and Ceder [71] confirmed the value of examining the physical characteristics of users’ experiences. In addition to measuring satisfaction with physical characteristics, observable characteristics that cannot be measured directly, such as comfort, punctuality, convenience, and aesthetics, should also be considered.

3. Materials and Methods
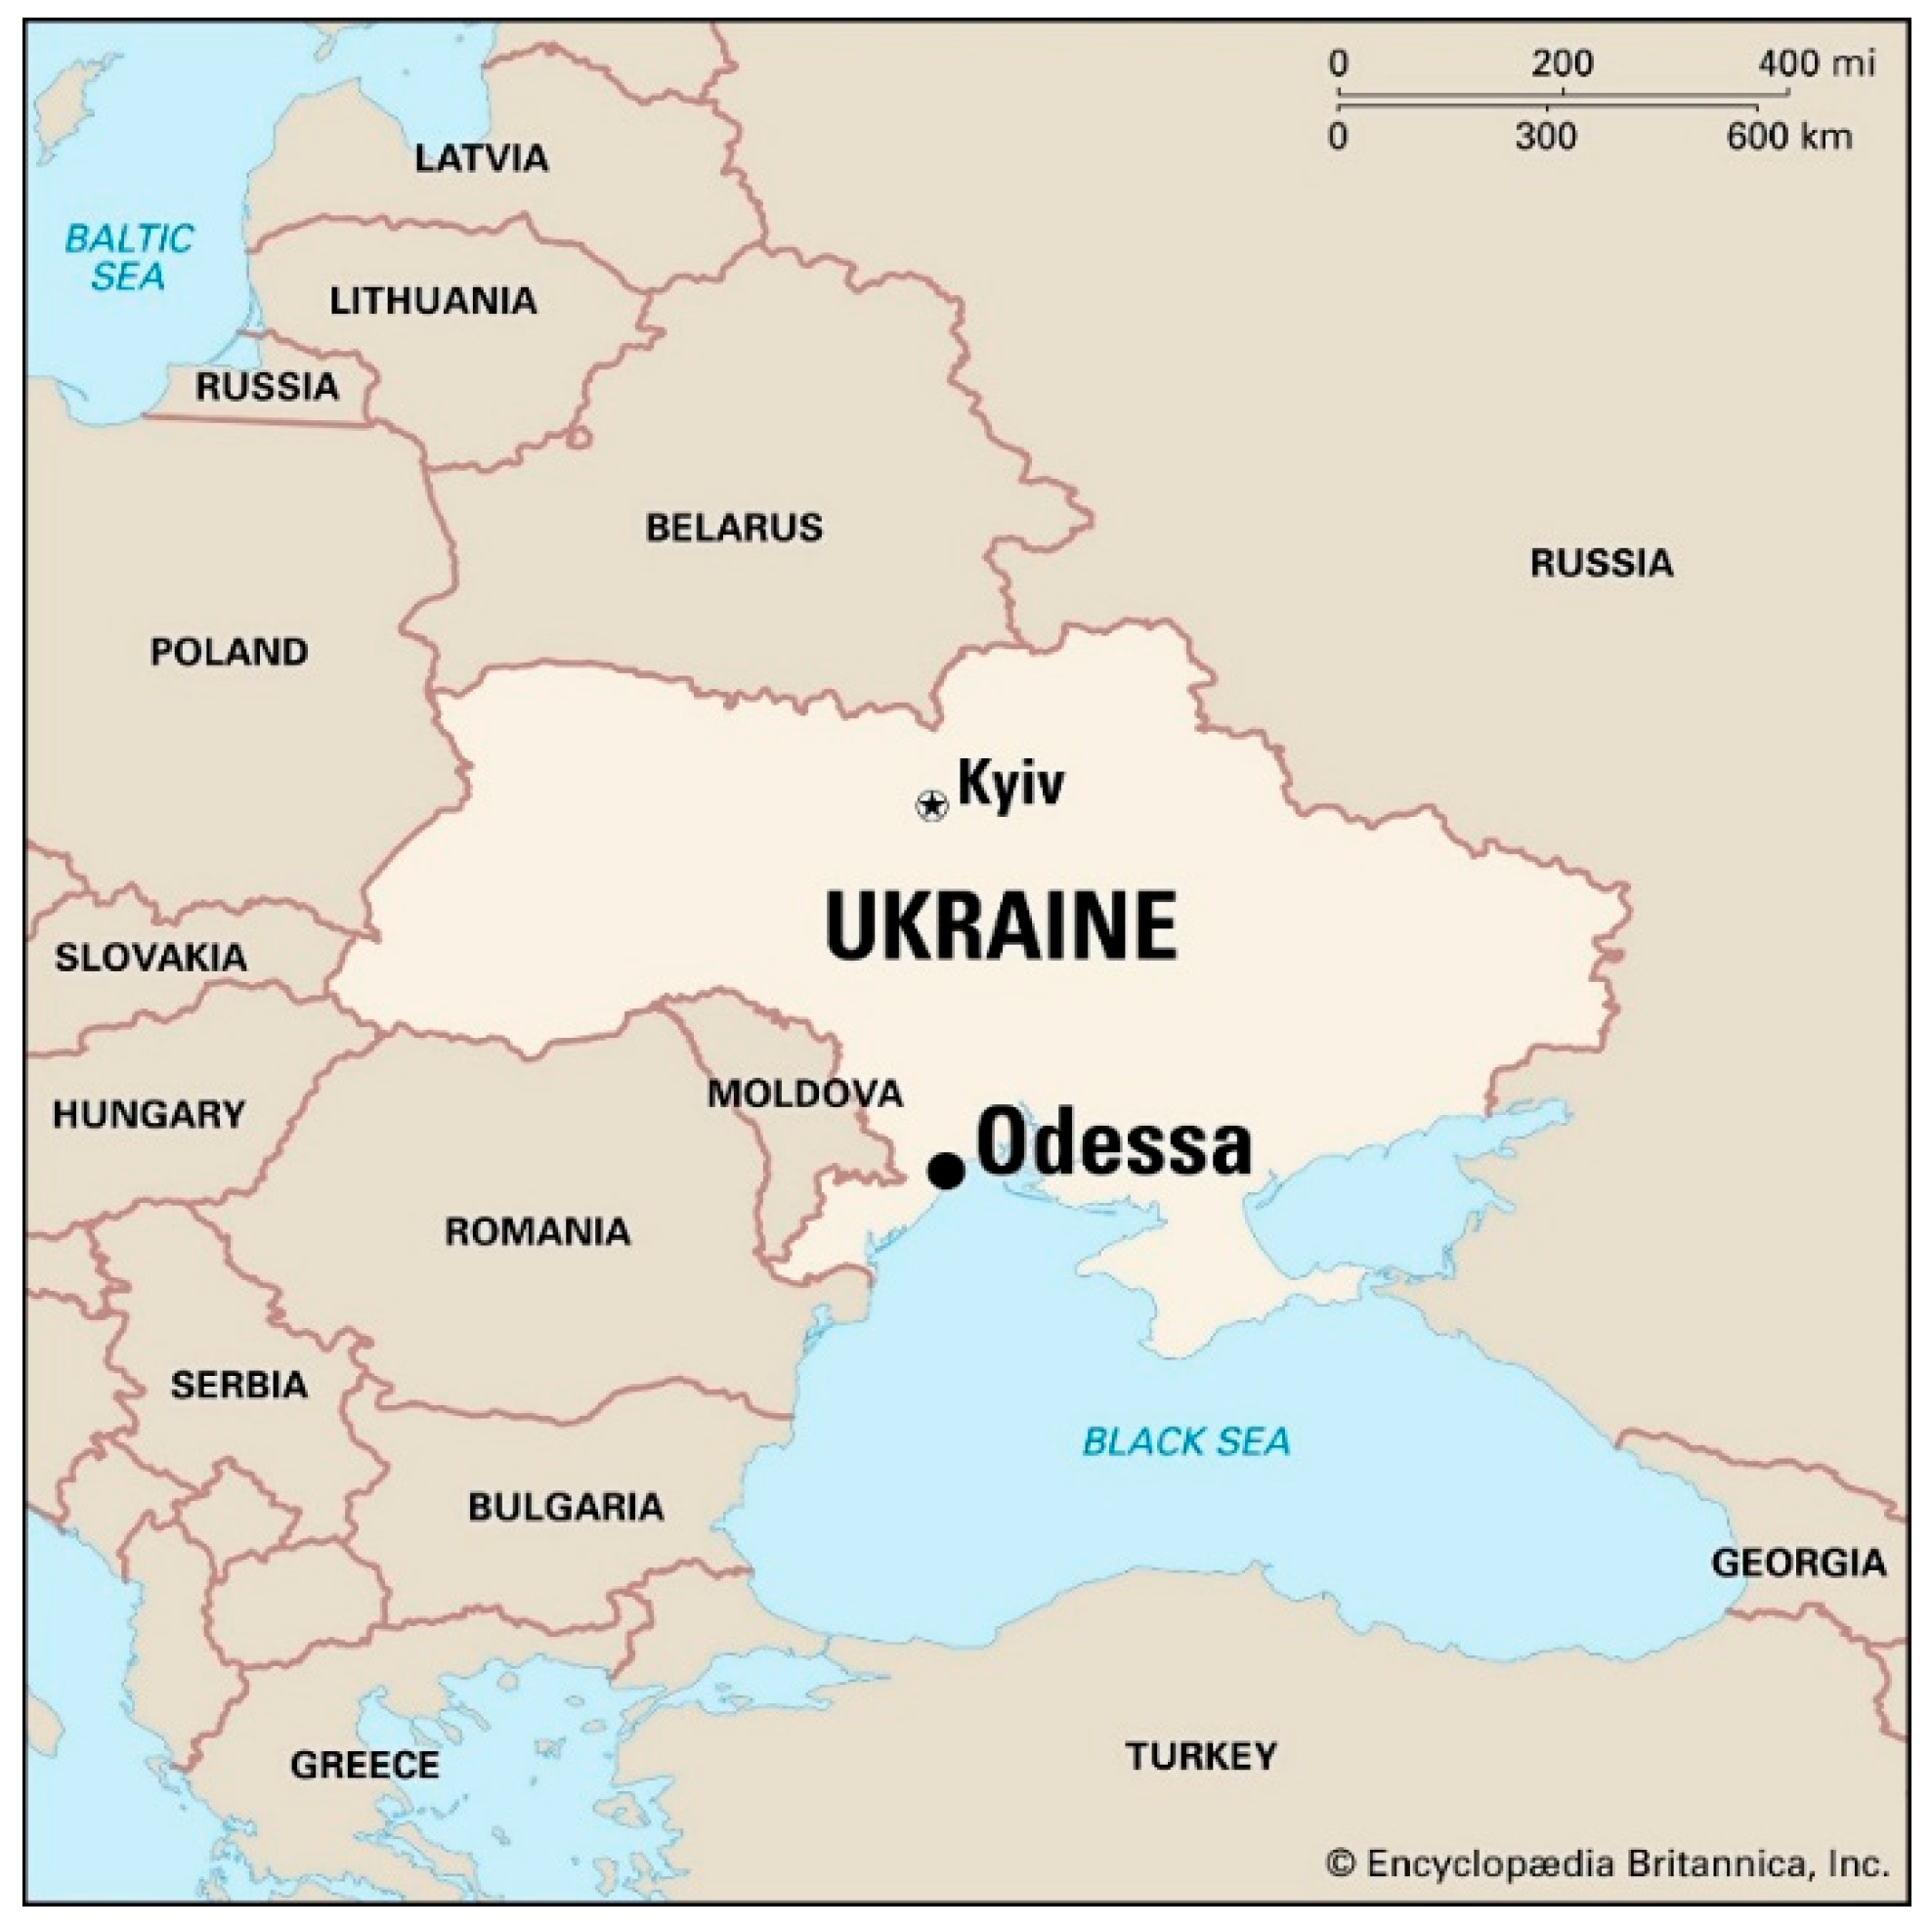
3.1. Study Area

In Ukraine, Odesa is the third most populous city with a seaport, important tourist centers, and transport centers located on the northwest coast of the Black Sea. Odesa has been a multi-ethnic city since its inception and has an administrative center in the Odesa Oblast province (Figure 1) [72,73,74]. In 1440, Odesa’s pioneer, a small Tatar town, was founded, and its original name was Hakubi. It was handed to the Ottoman Empire in 1529, following a period of Lithuanian administration, and remained in Ottoman hands until the empire’s collapse in the Russo-Turkish War in 1792. Queen Catherine the Great established the city of Odesa in 1794. Odesa was a free port from 1819 to 1858. In the twentieth century, Odesa was the main trading port in the Soviet Union and a naval base of the Soviet Union, and today, it holds the same prominent place in Ukraine [72,75,76].
Odesa was the fourth-largest Russian imperial city during the 19th century. Its historical architectural style was more Mediterranean, being influenced by French and Italian styles. Moreover, Odesa is an important tourist center with more than 150 major events every year. In addition to tourism, healthcare, and sports activities, Odesa’s oil terminal and related activities are also important industries. Odesa has a population of 1,016,515, compared to the broader population of the Oblast (about 2,396,442) [69].
The PT network in Odesa is an important part of the city’s infrastructure and serves as a key mode of transport for residents and visitors alike. The PT system consists of a mix of buses, trolleybuses, and trams, which operate on over 100 routes throughout the city (Odesa Public Transport, 2021). The system is managed by the city’s transport department and is subject to ongoing upgrades and improvements to better serve the needs of the community.
In recent years, the PT system in Odesa has faced a number of challenges related to increasing traffic congestion and a growing population. These challenges have prompted city officials and transport planners to explore new approaches to optimizing the PT system, including the use of data-driven analytics and advanced technologies. By using these tools, it may be possible to improve the efficiency, reliability, and overall quality of the PT system in Odesa, while also reducing congestion and improving the overall quality of life for residents and visitors. This is the mission of Odesa city transport to provide safe, reliable, affordable, and efficient public transport with quality customer service to the metropolitan area [1]. Infrastructural changes have occurred in recent years in the work of PT in this city. In this context, all existing street transport development and optimization programs (high-speed trams) have not been implemented [77]. Furthermore, no action had been taken to develop alternative methods of off-street transport (monorail, “seatramˮ). Moreover, the minibus network was one of the main insertions to the PT system, which was disorderly, and created in the market situations [78]. The schedule of departure of all buses from Monday to Friday is from 6:15 a.m. to 7:10 p.m., and on Saturdays, all buses work from 8:15 a.m. to 4:10 p.m.
This study and data collection were conducted in 2021 before what happened to Ukraine (and Odesa) on 24 February 2022, when Russia deployed its military forces.

3.2. Data Collection and Methods

According to the Ukrainian State Statistics Service, the population of Ukraine (excluding Crimea) was 41,442,615 in 2021 (Figure 2). Due to high mortality, immigration, and birth rates, the population of the nation has been declining since the 1990s. Since 1993, the population has fallen by more than 300,000 people each year on average. Environmental pollution, poor food, extensive smoking, severe alcoholism, and decreasing medical treatment all contribute to Ukraine’s high death rate.
In this study, the methods include interviews in 2021 using questionnaires, national surveys, self-reported trips and observations, and frequent selections using smart card data. In addition, technological advances have provided new tools for regulating and tracking experiences, such as applications downloaded onto travelers’ smartphones [80].
Table recognition, as an efficient and practical tool for providing data and two-dimensional relationship information, has been widely used in various studies [81]. Table recognition has attracted enormous research in the last two decades and has become an important task in understanding the structure of documents. Therefore, in this study, the data collection method was tabular based on table recognition adjustments [32]. Such recognition can simplify the integration of information and provide proof of operational features in recognition. The volume of data collection tools is increasing rapidly day by day, and many online applications, tools, and platforms have flourished in the technological age. Therefore, valuable data mining tools for effective management must be developed. One of the sub-areas that is considered in the field of information extraction is fetching and accessing data from tabular forms. In this way, table recognition is applied to illustrate the operation process in this study. This method has two columns of functions labeled D and I. To determine the integral of the form 𝑓(𝑥) 𝑔′(𝑥) 𝑑𝑥, f(x) is placed in column D, right after f(x) is separated in sequence, while g’(x) is placed in column I, right after it is followed by anti-derivatives. In many cases, the sequence (𝑥) 𝑔′(𝑥) 𝑑𝑥 is integral with alternating signs. In most programs, f(x) is a polynomial, so column D ends after many steps, and column integration (𝑥) 𝑔′(𝑥) 𝑑𝑥 yields. Any level of the procedure can be reduced when f(x) is not a polynomial, and the residual term acquired as the integral of the product of the two terms, i.e., f(k)(x) and g −k + 1(x), can be gotten straight from each other [82].
After determining the data collection method, the number of calculators depends on the number of bus entrances. In this research, all the bus routes are examined throughout the entire length. Accordingly, 33 routes were selected, covering almost the entire city. The scheme of the surveyed routes is presented in Figure 3.
Passenger transport is the total number of passengers carried per unit of time (usually 1–2 h) on the route. Therefore, it is necessary to determine the passenger capacity of the buses, then calculate how many are required to meet the transport demand. The number of transports required on the route is characterized by a coefficient indicating the ratio of transport required. This coefficient is a “load factor” that cannot be greater than one. Teo et al. [83] defined the load factor as the ratio between the average load and the total load capacity per ton. There must be a difference between the load factor for loaded trips (excluding empty trips) and the load factor for all trips (including empty trips) [66].

3.3. Evaluation for Table Recognition

Table identification requires segmenting table structures and collecting data from cells. Two techniques are evaluated and discussed in this section. Deng et al. [84] examined the image-to-text model on the data set in a study of the challenges of distinguishing a neuroscience table through the board. They also examined the model that obtained an assessment score of 40.33 for table structure recognition for identifying table structure. The model has issues when there are complicated structures with several columns; it is concluded (rows). Zhong et al. [85] applied the table recognition task to the analysis of tabular data in unstructured digital documents. The tree edit distance provided by Pawlik and Augsten [86] was used to determine similarity in accordance with the observation assessment criterion, which was successful. It is vital to remember that the presented methods cannot be directly compared because they employ various datasets and assessment standards.
Integration by the tabular method is a short way for the association to dissolve the integral issue fast, instead of using the long and boring procedure of mixing by the traditional system [87]. The benefit of the tabular integration method is that it can save a large amount of time in resolving the issue. It offers a solution justly precise compared to the integration way. This tabular method is rather fast to learn and simple to apply [87].
The integration tabular method can be used for any function that is the outcome of two moods, where one of the moods can be altered until it gets zero, and another one can be integrated at the same time several times [88]. Consider a function, f(x) = m(x).n(x), from given two moods, one of the moods, let us take it m(x), must be differentiated several times until it reaches zero, and the other one, n(x), must be integrated at the same time several times.
There are several approaches to the problem of structural segmentation of a table. The methodologies were categorized based on deep neural network architecture [89]. Different learning-based methods that have worked on recognizing table structure have advantages and limitations. Fully convolutional networks minimize the complexity of recognizing table structure [90]. This system works well on both PDF and scanned document images [91]. Graph neural networks utilize both spatial and textual features [92]. The distance-based weighting technique also solves the class imbalance problem for the cellular communication network [93].

4. Results and Discussion

Figure 4 shows that the characteristics of traveling by PT influence individual satisfaction. As shown in Figure 4, there were three characteristics of traveling by PT, including timeliness, saving fuel, and environmental benefits. The results indicate that most of the respondents (95% of individuals) emphasized timeliness, and this characteristic was very effective in choosing PT instead of a private car. In addition, 87% of respondents and 72% of individuals selected the priority of environmental benefit and saving fuels, respectively.
Timeliness and reliability are not the same things. While both are important factors in public transport, timeliness refers to the ability to arrive or depart at the scheduled time, while reliability refers to the consistency of service in terms of schedule adherence, vehicle availability, and other factors that affect service delivery. Therefore, it is important to consider both timeliness and reliability separately when evaluating public transport systems.
Figure 5 indicates schematic satisfaction based on tabular data. The results represent co-occurrence combinations of satisfaction options, and more than 95% of the dataset was selected by the individuals. As the results show, two co-occurrence combinations were found among three characteristics of traveling by PT in the tabular data. In addition, there will be a probability of achieving another satisfaction characteristic by more than 95% if one of the satisfaction characteristics occurs for the individuals. For instance, the co-occurrence combination of saving fuel and environmental benefit indicates that individuals who prioritized the saving fuel option emphasized the environmental benefit option with more than 95% probability, and vice versa. Other co-occurrence combinations in Figure 5 has a similar interpretation.
Schematic satisfaction among various subgroups is indicated in Figure 6. Based on the results, the group of bus users prioritized the two characteristics of timeliness and environmental benefit for using PT. In comparison, the group of bus operators emphasized all three characteristics of timeliness, environmental benefit, and fuel saving.
This study has a special emphasis on timeliness, which is one of the key elements in assessing the quality of bus services [94]. Both bus customers and bus operators stand to gain much from increased bus timeliness and service quality. For example, an increase in the number of passengers is a consequence of an improvement in the level of bus services. The PT is inherently beneficial to the environment as it decreases the number of people driving single-passenger vehicles. Increasing PT rides saves more fuel, reduces air pollution, and decreases the area’s carbon footprint. In addition, shorter waiting times at the terminals reduce the bus operator’s costs. Bus users determine their waiting time at the station by taking into account the fluctuation of the bus arrival time. Thus, if the bus does not arrive at the station on time, the bus users have to be at the stations much earlier than the scheduled time. Less time fluctuations in bus services lead to more satisfaction among users. In general, the three main factors that affect the satisfaction of modern users are user perception, service, and technology. By using these factors, positive and consistent experiences can be provided for users and build real user loyalty.
In addition, the characteristics and goals of the trip affect the behavior of bus users; for example, students and certain office staff usually arrive earlier. In general, the results of the research on bus routes are presented in Table 1. As Table 1 shows, the maximum number of passengers on the way on three routes is labeled 232, 197, and 168, with 154, 149, and 148 passengers, respectively. In addition, the length of the route on those three paths is 31.59, 23.19, and 34.27 km, respectively. The minimum number of passengers on the way on three routes is labeled 233 (with 40 passengers), 150 (with 40 passengers), and 117 (with 44 passengers), and the length of the routes on those paths is 13.74, 11.88, and 20.43 km, respectively. The number of passengers and the distance traveled are, therefore, positively correlated. The three routes (168, 121, and 146) were the longest, with lengths of 34.27, 33.71, and 32.34 km. Furthermore, the average number of passengers on those three ways is 122, 109, and 109, respectively. In contrast, the three routes (150, 203, and 110) were the shortest, with lengths of 11.88, 11.97, and 12.61 km. Moreover, the average number of passengers on those three ways is 48, 57, and 59, respectively.
Based on Table 1, routes 197 and 168 had the highest number of passengers (122 passengers for both routes). Then, routes 4 and 19 had the highest number of passengers (232 passengers for both routes) at each entrance and exit on bus routes in Odesa. Reducing the amount of time passengers must wait at bus stops can enhance bus performance scheduling, which can raise passengers’ happiness. It also lowers the cost of operating buses while increasing the number of people who utilize them.
The variation of the maximum number of passengers on different routes based on data collected on each route can be followed in Table 1. There is no significant correlation between route length and passenger demand. However, the longer the route, the greater the maximum number of passengers. Longer routes also have disadvantages, including being more vulnerable to seasonal changes and greatly increasing the likelihood of accidents and breakdowns. In addition, the three routes, 19, 27, and 31, had the largest number of passengers.
Passenger load on public transport is primarily driven by demand, which can be influenced by various factors, such as population density, employment centers, and residential patterns. In addition to demand, there are several supply factors that can affect passenger loads, such as the centrality of the route, the number of alternative services linking a given origin-destination pair, and the frequency of service. However, the length of the route alone does not fully explain the vulnerability of public transport to seasonality and disruptions. According to [95], factors, such as the lack of alternative services, the location and duration of disruptions, and the availability of real-time information, can significantly contribute to the vulnerability of the public transport system. Therefore, it is essential for transport planners and policymakers to consider both demand and supply factors, and the wider range of factors that can affect the performance and resilience of public transport systems. By adopting a comprehensive approach to public transport planning, we can aim to enhance the efficiency and reliability of services, increase passenger satisfaction, and ultimately promote the use of sustainable modes of transport.

4.1. Major Findings: Optimizing the PT Network

Several factors led to the optimization of the PT network in Odesa: (a) uneven and spontaneous development of the network of PT, which led to an increase in the level of dual routes around the network, especially in the central part of the city; (b) urban population dissatisfaction with the quality of services provided by transport companies, which in the context of the growth of motorization directed to an increase in individual transport on the path network; (c) increase in traffic congestion on the city road network, especially in the central part of the city; and (d) the accumulation of a large number of rolling stock of passenger vehicles with low wagon capacity. Thus, the PT system must be optimized and improved by removing the obstacles and disadvantages mentioned above. Efthymiou and Antoniou [65] studied the characteristics of PT required to attract users of personal vehicles. Their results show that improving the condition of the PT system is not enough, as it will not improve the characteristics and conditions offered by the vehicles. From this point of view, if a change of condition is to be achieved, the benefits of PT must be comparable to the benefits of passenger cars. In this respect, the city’s transport policy should aim at optimizing the conditions. The optimized condition can ensure the priority of PT development, increase its attractiveness to the population, increase the efficiency of transport, and improve the organization of PT traffic along the city’s highways. For this purpose, the PT network should be optimized, the fleet size related to the length of the line and whether or not the PT vehicles are separated from other vehicles should be counted, and the PT capacity related to the number of passengers and frequency should be calculated. Furthermore, PT should be centrally coordinated, and carriers of all forms of ownership should be effectively controlled. Sanchez-Atondo et al. [96] argued that for an integrated analysis of the transport system, it is essential to identify the opportunities it offers, so the variables of origin and destination, the cost and travel time between these variables, and the mode of transport are needed. In the case of these variables, Burian et al. [97] prove that time is an indirect cost that people imagine for mobilization and is, therefore, one of the main reasons for the choice of travel mode.
Measures, such as improving infrastructure and increasing capacity to reduce travel time, are offered by policymakers. An alternative way to reduce the negative effects is to design the PT system in such a way that passengers can use their travel time efficiently, thus saving time at work. Constraints on the housing market, which make it difficult for workers to live near their workplace, are one of the reasons for the long distances. For example, housing has become more expensive in city centers, where there are many jobs, causing workers to move to the suburbs with long commutes. Housing market policies can have a significant impact on travel time, especially for low-income workers, and thus on their public welfare, although this is not easy to achieve. In the literature, there may be policies that have specified important service factors for well-being when using PT. It is also very important to pay attention to the distinction between different groups of users. It has been found that commuters’ satisfaction with travel affects their average well-being and life satisfaction. During the journey, stress or anxiety can lead to poor mental well-being and quality of life. Travel and well-being are related, although in distinct ways, according to De Vos et al. [98]. Additionally, a person’s perspective on travel can directly affect how satisfied they are with their entire quality of life. People who reported having happy feelings when traveling had greater levels of life satisfaction, according to recent surveys on travel. Traveling allows people to engage in activities outside of the house, which can have a positive indirect effect on life satisfaction. According to studies, leisure and vacation destinations’ activities have an impact on a person’s ability to enjoy their trip and even their mental health.

4.2. Optimizing the Schedule of Urban Passenger Transport

The calculation of the number of rolling stock units is one of the most important tasks in optimizing the urban passenger transport schedule. To date, a large number of programs have been developed that allow for the optimization of the urban passenger transport timetable, taking into account the following factors: (i) changes in passenger transport during the day and (ii) the main centers where passenger transport is attracted, such as industrial enterprises, educational institutions, and others in the city of Odesa. In this case, for some objects that are not of great social importance (e.g., markets and trade complexes), the intervals can be extended, but this cannot be accepted by the PT users. It is necessary to smooth the traffic of all transport units of urban routes in order to organize convenient intervals for passengers depending on weekdays, holidays, and weekends and when solving problems with time intervals. Thus, a separate decision must be taken for each case, while this decision will most likely be taken in several iterations to achieve the best balance between the interests of the carrier and those of the PT users. At the same time, considering the extensive problem, it can be stated that the reduction in the number of rolling stocks on the line in the middle periods should be proportional to the reduction passenger transport in these periods. Thus, paying attention to issues, such as focusing on the target markets at one point and reducing the number of rollers, can be effective in optimizing the transport scheme.
These findings are in line with the results of Bogumil and Duque [15], Currie and Delbosc [99], Enoch et al. [48], Kos et al. [100], Shelat et al. [101], Malandri et al. [95], and Anable [102]. According to Anable [102], different psychological clusters must be served in various ways to optimize influence on choice behavior, and each cluster represents a combination of preferences and attitudes. Socio-demographic factors had a low effect on the travel characteristics of the mobility departments, so attitudes basically affect individual characteristics. Their findings clearly showed that the same behavior can occur for various reasons and that the same attitudes can cause different behaviors. The evaluation of PT performance can only be estimated by measuring the accuracy of the vehicles and the passengers’ experience of these services. According to the findings of Diana and Mokhtarian [103], potent users of a specified mode want to balance maximizing their “modal consumption” by reducing the use of this mode above average and increasing the use of the other mode. However, in the case of land travel budgets, willingness to travel is generally less related to the modal balance mix. Socio-economic characteristics of clusters cannot clarify the patterns discovered and confirm the matter of considering multifaceted issues in travel behavior research. In one study that was conducted by Currie and Delbosc [99], the travel chain behavior of Melbourne residents was investigated using evidence from a household travel survey. The findings of their study showed that the complexity of travel chains was steady, and the complexity of chains was larger for rail and tram than for car-based travel. These findings offer a less exposed outlook for public transport commuters in what is explained to be an increasingly complex travel future. PT network vulnerability assessment approaches are commonly based on quantifying the average delay caused to passengers by a disturbance [95]. In fact, Malandri, Mantecchini, Paganelli, and Postorino [95] evaluated the negative consequences of disturbances between passengers or existing differences. The results showed that disruptive scenarios that appeared similar in terms of average effects were even very different in terms of asymmetry of effects across users. According to Shelat, Huisman, and van Oort [101], almost all travel were mixed-mode for rather lengthy commutes, where transport is in the form of trains and bicycles and walking were the access and exit modes, respectively. In addition to the travel behavior for several user groups identified, transport authorities could use these experimental results to adjust policies to attract more passengers.

5. Conclusions

The results of this study show that the three main PT characteristics that affect users’ choices are timeliness, environmental benefit, and fuel savings. To address the first research question, it should be noted that timeliness is considered important by the majority of individuals. In addition, timeliness and environmental benefits are present in more than 95% of the priority statements. Moreover, environmental benefits and fuel savings are simultaneously important for 95% of the statements. To address the second research question, bus users and bus operators considered “timeliness and environmental benefit” and “timeliness, environmental benefit, and fuel saving” as equally important.
PT is a profitable business when deploying the service in the same way as it was designed and scheduled, minimizing cancellations and re-routings. Reliability performs an important role in determining the performance of a transport vehicle. One of the objectives of the Odesa National Passenger Transport Policy is to provide high-quality transport services to passengers traveling on a variety of national routes. Therefore, the analysis of the research results on the normal public passenger routes of the city has shown that increasing the number of buses on the studied routes does not fundamentally solve the problem. It is necessary to redistribute the routes, especially in the city center, in order to eliminate duplication. Allocating lanes for PT buses allows an increase in the number of transport units without creating additional difficulties for other road users. The results will be useful for the organization of passenger transport on bus routes. The present study was conducted in response to the search for an efficient transport policy.
The main implications of the findings are of particular interest to policymakers developing policies in the field of passenger transport, transport scientists, and transport students. Based on the main findings, the understanding of PT services is the most important determinant of PT adoption. In large cities, sustainable mobility requires a clear understanding of travel behavior, passenger needs, and expectations. Logical timetables can increase the popularity of PT systems and can be useful for the sustainability of transport systems. One of the most important PT plans is to determine bus timetables and routes. As mentioned before, this study proposes to optimize the public passenger transport network in each area and count the number of rolling stocks needed to meet the current demand. Furthermore, this study proposes the central coordination and effective control of public passenger transport. High-efficiency transport investments increase connectivity and reduce congestion. Hence, such investments improve economic prosperity. In this regard, there are relatively simple and inexpensive recommendations to make PT more attractive to customers and make them more efficient. It is recommended to increase vehicle speed, optimize stop design, reduce traffic congestion, prioritize public transport in traffic signs, and use real-time data. In general, it is recommended that future studies conduct a more comprehensive survey to obtain more accurate data and statistics with a view to designing more sophisticated models. For example, delays in bus transport have an impact on the behavior of bus users. In order to estimate the number of passengers transferring from one mode to another, we need to improve the model for the choice of transport mode. Furthermore, it should be investigated which measures can actually reduce bus delays and how the delays can be quantified. In order to improve bus services in congested areas, the mixed traffic lanes and the exclusive bus lanes can be used together.
Considering the individual satisfaction of PT and to address the first research question, we have identified several measures (e.g., improving the punctuality and quality of bus services) that require participation in transport programs. Therefore, the actions should be implemented in accordance with the user section and in relation to the trips, and this is the responsibility of the local transport planners. To address the second research question, it should be noted that the results of this study can be beneficial and used by transport operators to ensure that the quality of their services meets passengers’ expectations. In conclusion, for future studies, researchers and policymakers should note that the performance of the proposed paths has not been investigated. Therefore, the analysis of the program evaluation is essential for the future. Future research can follow the adopted methodology with respect to PT users in similar areas. Moreover, minimizing both passenger and operator costs as an optimization objective could be investigated in future studies.

Author Contributions

Conceptualization, S.M., D.L. and F.W.; methodology, S.M.; validation, S.M., D.L. and F.W.; formal analysis, S.M., D.L. and F.W.; resources, H.O., D.D. and V.S.; data curation, S.M.; writing—original draft preparation, S.M., D.L. and F.W.; writing—review and editing, S.M., D.L. and F.W.; supervision, H.O.; project administration, S.M., H.O., D.D. and V.S. All authors have read and agreed to the published version of the manuscript.

Funding

This research received no external funding.

Data Availability Statement

Data available on request due to restrictions.

Conflicts of Interest

The authors declare no conflict of interest.

References

  1. Bashynska, I.; Kovalova, O.; Malovichko, O.; Shirobokova, O. Risk management of innovative socially significant projects (on the example of urban passenger transport). Int. J. Adv. Res. Eng. Technol. 2020, 11, 294–305. [Google Scholar]
  2. McKay, T. South Africa’s Key Urban Transport Challenges. In Urban Geography in South Africa; Springer: Berlin/Heidelberg, Germany, 2020; pp. 189–207. [Google Scholar] [CrossRef]
  3. Rode, P.; Floater, G.; Thomopoulos, N.; Docherty, J.; Schwinger, P.; Mahendra, A.; Fang, W. Accessibility in cities: Transport and urban form. Disrupting Mobil. 2017, 239–273. [Google Scholar] [CrossRef]
  4. Sclar, E. Transforming Urban Transport; Davis, D., Altshuler, A., Eds.; Oxford University Press: New York, NY, USA, 2018; p. 336. ISBN 9780190875718. [Google Scholar]
  5. Chocholac, J.; Sommerauerova, D.; Hyrslova, J.; Kucera, T.; Hruska, R.; Machalik, S. Service quality of the urban public transport companies and sustainable city logistics. Open Eng. 2020, 10, 86–97. [Google Scholar] [CrossRef]
  6. Da Silva, F.J.G.; Gouveia, R.M. Global population growth and industrial impact on the environment. In Cleaner Production; Springer: Berlin/Heidelberg, Germany, 2020; pp. 33–75. [Google Scholar] [CrossRef]
  7. Dedík, M.; Čechovič, L.; Gašparík, J. Methodical process for innovative management of the sustainable railway passenger transport. Transp. Res. Procedia 2020, 44, 305–312. [Google Scholar] [CrossRef]
  8. Godil, D.I.; Sharif, A.; Afshan, S.; Yousuf, A.; Khan, S.A.R. The asymmetric role of freight and passenger transport in testing EKC in the US economy: Evidence from QARDL approach. Environ. Sci. Pollut. Res. 2020, 27, 30108–30117. [Google Scholar] [CrossRef]
  9. Majorova, Y.V.; Glebov, V.; Shevtsov, V.; Ahmedzyanov, V.; Kuliyeva, G. Modern Approaches to Improve the Performance of the Transport System of the City (on Moscow Case). In Proceedings of the International Session on Factors of Regional Extensive Development (FRED 2019), Irkutsk, Russia, 27 May–1 June 2019; Atlantis Press: Paris, France, 2020; pp. 126–130. [Google Scholar]
  10. Zhang, J.; Garrick, N.W.; Atkinson-Palombo, C.; Ahangari, H. How similar is China’s traffic safety pattern to industrialized countries in their early stage of motorization? An analysis of death registration data for large and small/medium cities. J. Transp. Saf. Secur. 2017, 9 (Suppl. S1), 83–102. [Google Scholar] [CrossRef]
  11. Oskarbski, J. Perspectives of Telematics Implementation in Tri-City Transport Systems Management and Planning. In Proceedings of the 11th International Conference on Transport Systems Telematics, TST 2011, Katowice-Ustron, Poland, 19–22 October 2011; Springer: Berlin/Heidelberg, Germany, 2011; pp. 233–240. [Google Scholar]
  12. Freeman, L.A.; Corbett, D.R.; Fitzgerald, A.M.; Lemley, D.A.; Quigg, A.; Steppe, C.N. Impacts of urbanization and development on estuarine ecosystems and water quality. Estuaries Coasts 2019, 42, 1821–1838. [Google Scholar] [CrossRef]
  13. Rajsman, M. Public urban passenger transport as important factor in the development of cities. J. Traffic Logist. Eng. 2014, 2. [Google Scholar] [CrossRef]
  14. Hernantes, J.; Maraña, P.; Gimenez, R.; Sarriegi, J.M.; Labaka, L. Towards resilient cities: A maturity model for operationalizing resilience. Cities 2019, 84, 96–103. [Google Scholar] [CrossRef]
  15. Bogumil, V.; Duque, M. Estimation of Passenger Load for Urban Passenger Transport on the Route. In IOP Conference Series: Materials Science and Engineering, Proceedings of the International Conference on Digital Solutions for Automotive Industry, Roadway Maintenance and Traffic Control (DS ART 2019; Cholpon-Ata, Kyrgyzstan, 1 November 2019, IOP Publishing: Bristol, UK, 2020; p. 12043. [Google Scholar]
  16. Poliak, M.; Poliakova, A.; Mrnikova, M.; Šimurková, P.; Jaśkiewicz, M.; Jurecki, R. The competitiveness of public transport. J. Compet. 2017, 9, 81–97. [Google Scholar] [CrossRef]
  17. Cooper, P.; Tryfonas, T.; Crick, T.; Marsh, A. Electric vehicle mobility-as-a-service: Exploring the “Tri-Opt” of novel private transport business models. J. Urban Technol. 2019, 26, 35–56. [Google Scholar] [CrossRef]
  18. Zahedi, S.; Batista-Foguet, J.M.; van Wunnik, L. Exploring the public’s willingness to reduce air pollution and greenhouse gas emissions from private road transport in Catalonia. Sci. Total Environ. 2019, 646, 850–861. [Google Scholar] [CrossRef] [PubMed]
  19. Hall, C.M.; Le-Klähn, D.-T.; Ram, Y. Tourism, Public Transport and Sustainable Mobilit; Channel View Publications: Bristol, UK, 2017. [Google Scholar] [CrossRef]
  20. Turoń, K.; Sierpiński, G.; Tóth, J. Support for pro-ecological solutions in smart cities with the use of travel databases–a case study based on a bike-sharing system in Budapes. In Smart and Green Solutions for Transport Systems: 16th Scientific and Technical Conference “Transport Systems. Theory and Practice 2019” Selected Papers 16; Springer: Cham, Switzerland, 2020; pp. 225–237. [Google Scholar]
  21. Un, D. Revision of World Urbanization Prospects; United Nations Department of Economic and Social Affairs: New York, NY, USA, 2018; Available online: https://population.un.org/wup/?_gl=1*1ubeos4*_ga*NTEwNDI5NTIzLjE2ODQzNzQ1MDU.*_ga_TK9BQL5X7Z*MTY4NDM3NDUwNS4xLjAuMTY4NDM3NDUwNS4wLjAuMA (accessed on 17 May 2023).
  22. Ritchie, H.; Roser, M. Urbanization. Our World Data 2018. [Google Scholar]
  23. Chow, J. Informed Urban Transport Systems: Classic and Emerging Mobility Methods toward Smart Cities; Elsevier: Amsterdam, The Netherlands, 2018; Available online: https://ourworldindata.org/urbanization (accessed on 17 May 2023).
  24. Fransen, K.; Neutens, T.; Farber, S.; De Maeyer, P.; Deruyter, G.; Witlox, F. Identifying public transport gaps using time-dependent accessibility levels. J. Transp. Geogr. 2015, 48, 176–187. [Google Scholar] [CrossRef]
  25. Ogryzek, M.; Adamska-Kmieć, D.; Klimach, A. Sustainable Transport: An Efficient Transport Network—Case Study. Sustainability 2020, 12, 8274. [Google Scholar] [CrossRef]
  26. Wong, S. The limitations of using activity space measurements for representing the mobilities of individuals with visual impairment: A mixed methods case study in the San Francisco Bay Area. J. Transp. Geogr. 2018, 66, 300–308. [Google Scholar] [CrossRef]
  27. Sun, W.; Bocchini, P.; Davison, B.D. Resilience metrics and measurement methods for transport infrastructure: The state of the art. Sustain. Resilient Infrastruct. 2020, 5, 168–199. [Google Scholar] [CrossRef]
  28. Marks-Bielska, R.; Kurowska, K. Institutional efficiency of communes in Poland in respect of space management. Int. Multidiscip. Sci. GeoConference SGEM 2017, 17, 521–528. [Google Scholar]
  29. Paulley, N.; Balcombe, R.; Mackett, R.; Titheridge, H.; Preston, J.; Wardman, M.; Shires, J.; White, P. The demand for public transport: The effects of fares, quality of service, income and car ownership. Transp. Policy 2006, 13, 295–306. [Google Scholar] [CrossRef]
  30. Redman, L.; Friman, M.; Gärling, T.; Hartig, T. Quality attributes of public transport that attract car users: A research review. Transp. Policy 2013, 25, 119–127. [Google Scholar] [CrossRef]
  31. Ferreira, M.C.; Dias, T.G.; e Cunha, J.F. Is Bluetooth low energy feasible for mobile ticketing in urban passenger transport? Transp. Res. Interdiscip. Perspect. 2020, 5, 100120. [Google Scholar]
  32. Sojol, J.I.; Piya, N.F.; Sadman, S.; Motahar, T. Smart bus: An automated passenger counting system. Int. J. Pure Appl. Math. 2018, 118, 3169–3177. [Google Scholar]
  33. Benga, G.C.; Savu, D.; Savu, S.V.; Olei, A.; Iacobici, R.I. Assesment of Trends in Inland Waterway Transport within European Union. Adv. Eng. Forum 2019, 34, 247–254. [Google Scholar] [CrossRef]
  34. Storme, T.; Casier, C.; Azadi, H.; Witlox, F. Impact Assessments of New Mobility Services: A Critical Review. Sustainability 2021, 13, 3074. [Google Scholar] [CrossRef]
  35. Grover, V.; Chiang, R.H.; Liang, T.-P.; Zhang, D. Creating strategic business value from big data analytics: A research framework. J. Manag. Inf. Syst. 2018, 35, 388–423. [Google Scholar] [CrossRef]
  36. Van Lierop, D.; Badami, M.G.; El-Geneidy, A.M. What influences satisfaction and loyalty in public transport? A review of the literature. Transp. Rev. 2018, 38, 52–72. [Google Scholar] [CrossRef]
  37. Bruzzone, F.; Cavallaro, F.; Nocera, S. The integration of passenger and freight transport for first-last mile operations. Transp. Policy 2021, 100, 31–48. [Google Scholar] [CrossRef]
  38. Hirschhorn, F.; Paulsson, A.; Sørensen, C.H.; Veeneman, W. Public transport regimes and mobility as a service: Governance approaches in Amsterdam, Birmingham, and Helsinki. Transp. Res. Part A: Policy Pract. 2019, 130, 178–191. [Google Scholar] [CrossRef]
  39. Yao, Z.; Ye, K.; Xiao, L.; Wang, X. Radiation Effect of Urban Agglomeration’s Transport Network: Evidence from Chengdu–Chongqing Urban Agglomeration, China. Land 2021, 10, 520. [Google Scholar] [CrossRef]
  40. World-Bank, Sustainable Mobility for Odessa, A Road Map for Improving Accessibility and Energy Efficiency. 2018. Available online: http://documents1.worldbank.org/curated/en/498021530861926262/pdf/Sustainable-Mobility-for-Odessa.pdf (accessed on 17 May 2023).
  41. Borysova, T.; Monastyrskyi, G. Marketing innovation activity of urban public transport: Results of the empirical study. Mark. Manag. Innov. 2018, 229–240. [Google Scholar] [CrossRef]
  42. Bashynska, I. Improving the Tariff Policy of Urban Passenger Transport Based on International Experience. TEM J. 2020, 9, 1588–1596. [Google Scholar] [CrossRef]
  43. Gao, L.; Miao, L.; Xu, Z.; Chen, L.; Guan, Z.; Zhai, H.; Jia, L.; Chen, Y.; Zhuang, J. Research on Passenger Flow Distribution in Urban Rail Transit Hub Platform. In Proceedings of the 4th International Conference on Electrical and Information Technologies for Rail Transport (EITRT) 2019, Qingdao, China, 25–27 October 2019; Rail Transport Information Processing and Operational Management Technologies. Springer Nature: Singapore, 2020; p. 447. [Google Scholar]
  44. Jing, Y.; Weng, J.; Zhang, Z.; Wang, J.; Qian, H. Public Traffic Passenger Flow Prediction Model for Short-Term Large Scale Activities Based on Wavelet Analysis. In Green, Smart and Connected Transport Systems; Springer: Berlin/Heidelberg, Germany, 2020; pp. 1281–1294. [Google Scholar]
  45. Li, W.; Li, Y.; Deng, H.; Bao, L. Planning of electric public transport system under battery swap mode. Sustainability 2018, 10, 2528. [Google Scholar] [CrossRef]
  46. Pazoysky, Y.; Kalikina, T.; Saveliev, M.; Kurtikova, E. The Methodology of Calculating Route Network of Long-Distance Passenger Trains in the Conditions of Fluctuating Passenger Flows. In Proceedings of the International Scientific Siberian Transport Forum, Novosibirsk, Russia, 22–27 May 2019; Springer: Cham, Switzerland, 2019; pp. 1035–1042. [Google Scholar]
  47. Uimonen, S.; Tukia, T.; Siikonen, M.-L.; Lehtonen, M. Impact of daily passenger traffic on energy consumption of intermittent-operating escalators. Energy Build. 2017, 140, 348–358. [Google Scholar] [CrossRef]
  48. Enoch, M.P.; Cross, R.; Potter, N.; Davidson, C.; Taylor, S.; Brown, R.; Huang, H.; Parsons, J.; Tucker, S.; Wynne, E. Future local passenger transport system scenarios and implications for policy and practice. Transp. Policy 2020, 90, 52–67. [Google Scholar] [CrossRef]
  49. Brumercikova, E.; Bukova, B. The regression and correlation analysis of carried persons by means of public passenger transport of the Slovak Republic. Transp. Res. Procedia 2020, 44, 61–68. [Google Scholar] [CrossRef]
  50. Ulrich, C.; Friedrich, H.E.; Weimer, J.; Schmid, S.A. New Operating Strategies for an On-the-Road Modular, Electric and Autonomous Vehicle Concept in Urban Transport. World Electr. Veh. J. 2019, 10, 91. [Google Scholar] [CrossRef]
  51. Dreier, D.; Silveira, S.; Khatiwada, D.; Fonseca, K.V.; Nieweglowski, R.; Schepanski, R. The influence of passenger load, driving cycle, fuel price and different types of buses on the cost of transport service in the BRT system in Curitiba, Brazil. Transport 2019, 46, 2195–2242. [Google Scholar] [CrossRef]
  52. De Angelis, M.; Mantecchini, L.; Pietrantoni, L. A Cluster Analysis of University Commuters: Attitudes, Personal Norms and Constraints, and Travel Satisfaction. Int. J. Environ. Res. Public Health 2021, 18, 4592. [Google Scholar] [CrossRef]
  53. Prati, G.; Puchades, V.M.; De Angelis, M.; Pietrantoni, L.; Fraboni, F.; Decarli, N.; Guerra, A.; Dardari, D. Evaluation of user behavior and acceptance of an on-bike system. Transp. Res. Part F Traffic Psychol. Behav. 2018, 58, 145–155. [Google Scholar] [CrossRef]
  54. Eboli, L.; Mazzulla, G. Customer satisfaction as a measure of service quality in public transport planning. Int. Encycl. Transp. 2021, 6, 220–224. [Google Scholar]
  55. De Oña, J. The role of involvement with public transport in the relationship between service quality, satisfaction and behavioral intentions. Transp. Res. Part A Policy Pract. 2020, 142, 296–318. [Google Scholar] [CrossRef]
  56. De Oña, J. Understanding the mediator role of satisfaction in public transport: A cross-country analysis. Transp. Policy 2021, 100, 129–149. [Google Scholar] [CrossRef]
  57. Soza-Parra, J.; Raveau, S.; Muñoz, J.C.; Cats, O. The underlying effect of public transport reliability on users’ satisfaction. Transp. Res. Part A Policy Pract. 2019, 126, 83–93. [Google Scholar] [CrossRef]
  58. Cascetta, E. Transport Systems Engineering: Theory and Methods; Springer Science & Business Media: New York, NY, USA, 2013; Volume 49. [Google Scholar] [CrossRef]
  59. Behrooz, H.; Hayeri, Y.M. Machine Learning Applications in Surface Transportation Systems: A Literature Review. Appl. Sci. 2022, 12, 9156. [Google Scholar] [CrossRef]
  60. Gärling, T.; Friman, M. Unsustainable Travel Becoming (More) Sustainable. In Handbook of Research on Sustainable Consumption; Edward Elgar Publishing: London, UK, 2015. [Google Scholar] [CrossRef]
  61. Bartłomiejczyk, M.; Połom, M. Sustainable use of the catenary by trolleybuses with auxiliary power sources on the example of Gdynia. Infrastructures 2021, 6, 61. [Google Scholar] [CrossRef]
  62. Nelson, G.D.; Rae, A. An economic geography of the United States: From commutes to megaregions. PLoS ONE 2016, 11, e0166083. [Google Scholar] [CrossRef]
  63. Ettema, D.; Friman, M.; Gärling, T.; Olsson, L.E. Travel mode use, travel mode shift and subjective well-being: Overview of theories, empirical findings and policy implications. In Mobility, Sociability and Well-being of Urban Living; Springer: Berlin/Heidelberg, Germany, 2016; pp. 129–150. [Google Scholar] [CrossRef]
  64. Buehler, R.; Pucher, J. Demand for public transport in Germany and the USA: An analysis of rider characteristics. Transp. Rev. 2012, 32, 541–567. [Google Scholar] [CrossRef]
  65. Efthymiou, D.; Antoniou, C. Understanding the effects of economic crisis on public transport users’ satisfaction and demand. Transp. Policy 2017, 53, 89–97. [Google Scholar] [CrossRef]
  66. Friman, M.; Gärling, T.; Ettema, D.; Olsson, L.E. How does travel affect emotional well-being and life satisfaction? Transp. Res. Part A Policy Pract. 2017, 106, 170–180. [Google Scholar] [CrossRef]
  67. Ye, R.; Titheridge, H. Satisfaction with the commute: The role of travel mode choice, built environment and attitudes. Transp. Res. Part D Transp. Environ. 2017, 52, 535–547. [Google Scholar] [CrossRef]
  68. Friman, M.; Maier, R.; Olsson, L.E. Applying a motivational stage-based approach in order to study a temporary free public transport intervention. Transp. Policy 2019, 81, 173–183. [Google Scholar] [CrossRef]
  69. Ettema, D.; Gärling, T.; Olsson, L.E.; Friman, M. Out-of-home activities, daily travel, and subjective well-being. Transp. Res. Part A Policy Pract. 2010, 44, 723–732. [Google Scholar] [CrossRef]
  70. Zhu, J.; Fan, Y. Daily travel behavior and emotional well-being: Effects of trip mode, duration, purpose, and companionship. Transp. Res. Part A Policy Pract. 2018, 118, 360–373. [Google Scholar] [CrossRef]
  71. Chowdhury, S.; Ceder, A.A. Users’ willingness to ride an integrated public-transport service: A literature review. Transp. Policy 2016, 48, 183–195. [Google Scholar] [CrossRef]
  72. Dragomyretska, O.; Dragomyretskyy, O.; Skipa, M. Carbonate karst and its relationship with geodynamic conditions of the Odessa city (Ukraine). Environ. Earth Sci. 2016, 75, 569. [Google Scholar] [CrossRef]
  73. Marsden, M. Islamic cosmopolitanism out of Muslim Asia: Hindu–Muslim business co-operation between Odessa and Yiwu. Hist. Anthropol. 2018, 29, 121–139. [Google Scholar] [CrossRef]
  74. Myronenko, S.; Lauwers, D.; Witlox, F. Study of the capacity of the city road network of Odessa. In Proceedings of the BIVEC-GIBET Transport Research Days 2019: Moving towards More Sustainable Mobility and Transport through Smart Systzems, Ghent, Belgium, 23–24 May 2019; pp. 69–77. [Google Scholar]
  75. CoE-Expert-Team, City of Odessa Intercultural Profile. 2017. Available online: https://rm.coe.int/odessa-intercultural-profile/1680759d6c (accessed on 17 May 2023).
  76. Šepić, J.; Rabinovich, A.B.; Sytov, V.N. Odessa tsunami of 27 June 2014: Observations and numerical modelling. Pure Appl. Geophys. 2018, 175, 1545–1572. [Google Scholar] [CrossRef]
  77. Ugnenko, E.; Shevchenko, A.; Matviienko, O.; Maliavin, A.; Viselga, G.; Turla, V. Analysis of existing train lines and international railway transport corridors of Ukraine. In TRANSBALTICA XI: Transport Science and Technology, Proceedings of the International Conference TRANSBALTICA, Vilnius, Lithuania, 2–3 May 2019; Springer: Cham, Switzerland, 2020; pp. 622–632. [Google Scholar]
  78. Lapkin, A. Analysis of the Odessa City’s Transport Infrastructure and Prospective Ways of Main Problems Solving; Publishing House “Baltija Publishing”: Riga, Latvia, 2020. [Google Scholar] [CrossRef]
  79. SSSU, State Statistics Service of Ukraine. 2020. Available online: www.ukrstat.gov.ua (accessed on 17 May 2023).
  80. Grönroos, C. What Can a Aervice Logic Offer Marketing Theory? In The Service-Dominant Logic of Marketing; Routledge: New York, NY, USA, 2014; pp. 372–382. [Google Scholar]
  81. Gilani, A.; Qasim, S.R.; Malik, I.; Shafait, F. Table Detection Using Deep Learning. In Proceedings of the 2017 14th IAPR international conference on document analysis and recognition (ICDAR), Kyoto, Japan, 9–15 November 2017; pp. 771–776. [Google Scholar]
  82. Alcantara, E.C. On the derivation of some reduction formula through tabular integration by parts. Asia Pac. J. Multidiscip. Res. 2015, 3, 80–84. [Google Scholar]
  83. Teo, J.S.; Taniguchi, E.; Qureshi, A.G. Evaluation of load factor control and urban freight road pricing joint schemes with multi-agent systems learning models. Procedia-Soc. Behav. Sci. 2014, 125, 62–74. [Google Scholar] [CrossRef]
  84. Deng, Y.; Rosenberg, D.; Mann, G. Challenges in end-to-end neural scientific table recognition. In Proceedings of the 2019 International Conference on Document Analysis and Recognition (ICDAR), Sydney, Australia, 20–25 September 2019; pp. 894–901. [Google Scholar]
  85. Zhong, X.; ShafieiBavani, E.; Jimeno Yepes, A. Image-based table recognition: Data, model, and evaluation. In Computer Vision–ECCV 2020, 16th European Conference, Glasgow, UK, 23–28 August 2020, Proceedings, Part XXI 16; Springer: Cham, Switzerland, 2020; pp. 564–580. [Google Scholar]
  86. Pawlik, M.; Augsten, N. Tree edit distance: Robust and memory-efficient. Inf. Syst. 2016, 56, 157–173. [Google Scholar] [CrossRef]
  87. Arpteg, A.; Brinne, B.; Crnkovic-Friis, L.; Bosch, J. Software engineering challenges of deep learning. In Proceedings of the 2018 44th Euromicro Conference on Software Engineering and Advanced Applications (SEAA), Prague, Czech Republic, 29–31 August 2018; pp. 50–59. [Google Scholar]
  88. Campbell, E.A.; Hynynen, J.; Burger, B.; Vainionpää, A.; Ala-Ruona, E. Vibroacoustic treatment to improve functioning and ability to work: A multidisciplinary approach to chronic pain rehabilitation. Disabil. Rehabil. 2021, 43, 2055–2070. [Google Scholar] [CrossRef] [PubMed]
  89. Hashmi, K.A.; Liwicki, M.; Stricker, D.; Afzal, M.A.; Afzal, M.A.; Afzal, M.Z. Current status and performance analysis of table recognition in document images with deep neural networks. IEEE Access 2021, 9, 87663–87685. [Google Scholar] [CrossRef]
  90. Siddiqui, S.A.; Fateh, I.A.; Rizvi, S.T.R.; Dengel, A.; Ahmed, S. Deeptabstr: Deep learning based table structure recognition. In Proceedings of the 2019 International Conference on Document Analysis and Recognition (ICDAR), Sydney, Australia, 20–25 September 2019; pp. 1403–1409. [Google Scholar]
  91. Tensmeyer, C.; Morariu, V.I.; Price, B.; Cohen, S.; Martinez, T. Deep splitting and merging for table structure decomposition. In Proceedings of the 2019 International Conference on Document Analysis and Recognition (ICDAR), Sydney, Australia, 20–25 September 2019; pp. 114–121. [Google Scholar]
  92. Qasim, S.R.; Mahmood, H.; Shafait, F. Rethinking table recognition using graph neural networks. In Proceedings of the 2019 International Conference on Document Analysis and Recognition (ICDAR), Sydney, Australia, 20–25 September 2019; pp. 142–147. [Google Scholar]
  93. Xue, W.; Li, Q.; Zhang, Z.; Zhao, Y.; Wang, H. Table analysis and information extraction for medical laboratory reports. In Proceedings of the 2018 IEEE 16th Intl Conf on Dependable, Autonomic and Secure Computing, 16th Intl Conf on Pervasive Intelligence and Computing, 4th Intl Conf on Big Data Intelligence and Computing and Cyber Science and Technology Congress(DASC/PiCom/DataCom/CyberSciTech), Athens, Greece, 12–15 August 2018; pp. 193–199. [Google Scholar]
  94. Deb, S.; Ahmed, M.A. Determining the service quality of the city bus service based on users’ perceptions and expectations. Travel Behav. Soc. 2018, 12, 1–10. [Google Scholar] [CrossRef]
  95. Malandri, C.; Mantecchini, L.; Paganelli, F.; Postorino, M.N. Public transport network vulnerability and delay distribution among travelers. Sustainability 2021, 13, 8737. [Google Scholar] [CrossRef]
  96. Sanchez-Atondo, A.; Garcia, L.; Calderon-Ramirez, J.; Gutiérrez-Moreno, J.M.; Mungaray-Moctezuma, A. Understanding Public Transport Ridership in Developing Countries to Promote Sustainable Urban Mobility: A Case Study of Mexicali, Mexico. Sustainability 2020, 12, 3266. [Google Scholar] [CrossRef]
  97. Burian, J.; Zajíčková, L.; Ivan, I.; Macků, K. Attitudes and motivation to use public or individual transport: A case study of two middle-sized cities. Soc. Sci. 2018, 7, 83. [Google Scholar] [CrossRef]
  98. De Vos, J.; Schwanen, T.; Van Acker, V.; Witlox, F. Travel and subjective well-being: A focus on findings, methods and future research needs. Transp. Rev. 2013, 33, 421–442. [Google Scholar] [CrossRef]
  99. Currie, G.; Delbosc, A. Exploring the trip chaining behaviour of public transport users in Melbourne. Transp. Policy 2011, 18, 204–210. [Google Scholar] [CrossRef]
  100. Kos, G.; Brlek, P.; Franolić, I. Rationalization of Public Road Passenger Transport by Merging Bus Lines on the Example of Zadar County. Promet Traffic Transp 2012, 24, 323–334. [Google Scholar] [CrossRef]
  101. Shelat, S.; Huisman, R.; van Oort, N. Analysing the trip and user characteristics of the combined bicycle and transit mode. Res. Transp. Econ. 2018, 69, 68–76. [Google Scholar] [CrossRef]
  102. Anable, J. ‘Complacent car addicts’ or ‘aspiring environmentalists’? Identifying travel behaviour segments using attitude theory. Transp. Policy 2005, 12, 65–78. [Google Scholar] [CrossRef]
  103. Diana, M.; Mokhtarian, P.L. Grouping travelers on the basis of their different car and transit levels of use. Transport 2009, 36, 455–467. [Google Scholar] [CrossRef]
Figure 1. Regional and local setting of the study area. Source: Dragomyretska, Dragomyretskyy, and Skipa [72].
Smartcities 06 00067 g001
Figure 2. Demographics of Ukraine. Source: SSSU [79].
Smartcities 06 00067 g002
Figure 3. Scheme of surveyed routes. Source: Dragomyretska, Dragomyretskyy, and Skipa [72].
Smartcities 06 00067 g003
Figure 4. Characteristics of traveling by PT. Source: Study findings.
Smartcities 06 00067 g004
Figure 5. Schematic satisfaction based on tabular data. Source: Study findings.
Smartcities 06 00067 g005
Figure 6. Schematic satisfaction among various subgroups. Source: Study findings.
Smartcities 06 00067 g006
Table 1. Results of the survey of bus routes in Odesa city.
No.Route
Number
The Capacity of the PT Service LineMinimum Number of Passengers in One WayMaximum Number of Passengers in One WayAverage Number of Passengers in One WayLength of Route, km
111720052887020.43
2145198781399929.29
3137310761439818.89
4232a2109813311231.59
520328545705711.97
6185235741098621.86
717522474988221.64
81461989813910932.34
9145194761319729.29
101211929413310933.71
1123322740705313.74
1211716344645720.43
1320818047776621.78
1420122652776417.01
1512021049937019.48
1613022952826517.01
1716522861958020.81
1819022752987219.07
192322179415411631.59
2024022747987218.52
21242203771168825.79
2225022449947118.71
2321024050786416.23
2412724070998019.81
2515024040564811.88
2619825845645612.93
271973189914912223.19
28220a232661068922.78
2922122164757018.90
3019117151967425.95
3116821510614812234.27
3211718944846620.43
3311027253645912.61
Disclaimer/Publisher’s Note: The statements, opinions and data contained in all publications are solely those of the individual author(s) and contributor(s) and not of MDPI and/or the editor(s). MDPI and/or the editor(s) disclaim responsibility for any injury to people or property resulting from any ideas, methods, instructions or products referred to in the content.

