


Stormwater Sewerage Masterplan for Flood Control Applied to a University Campus
 , , ,
, , ,  ,
,
Abstract
:1. Introduction
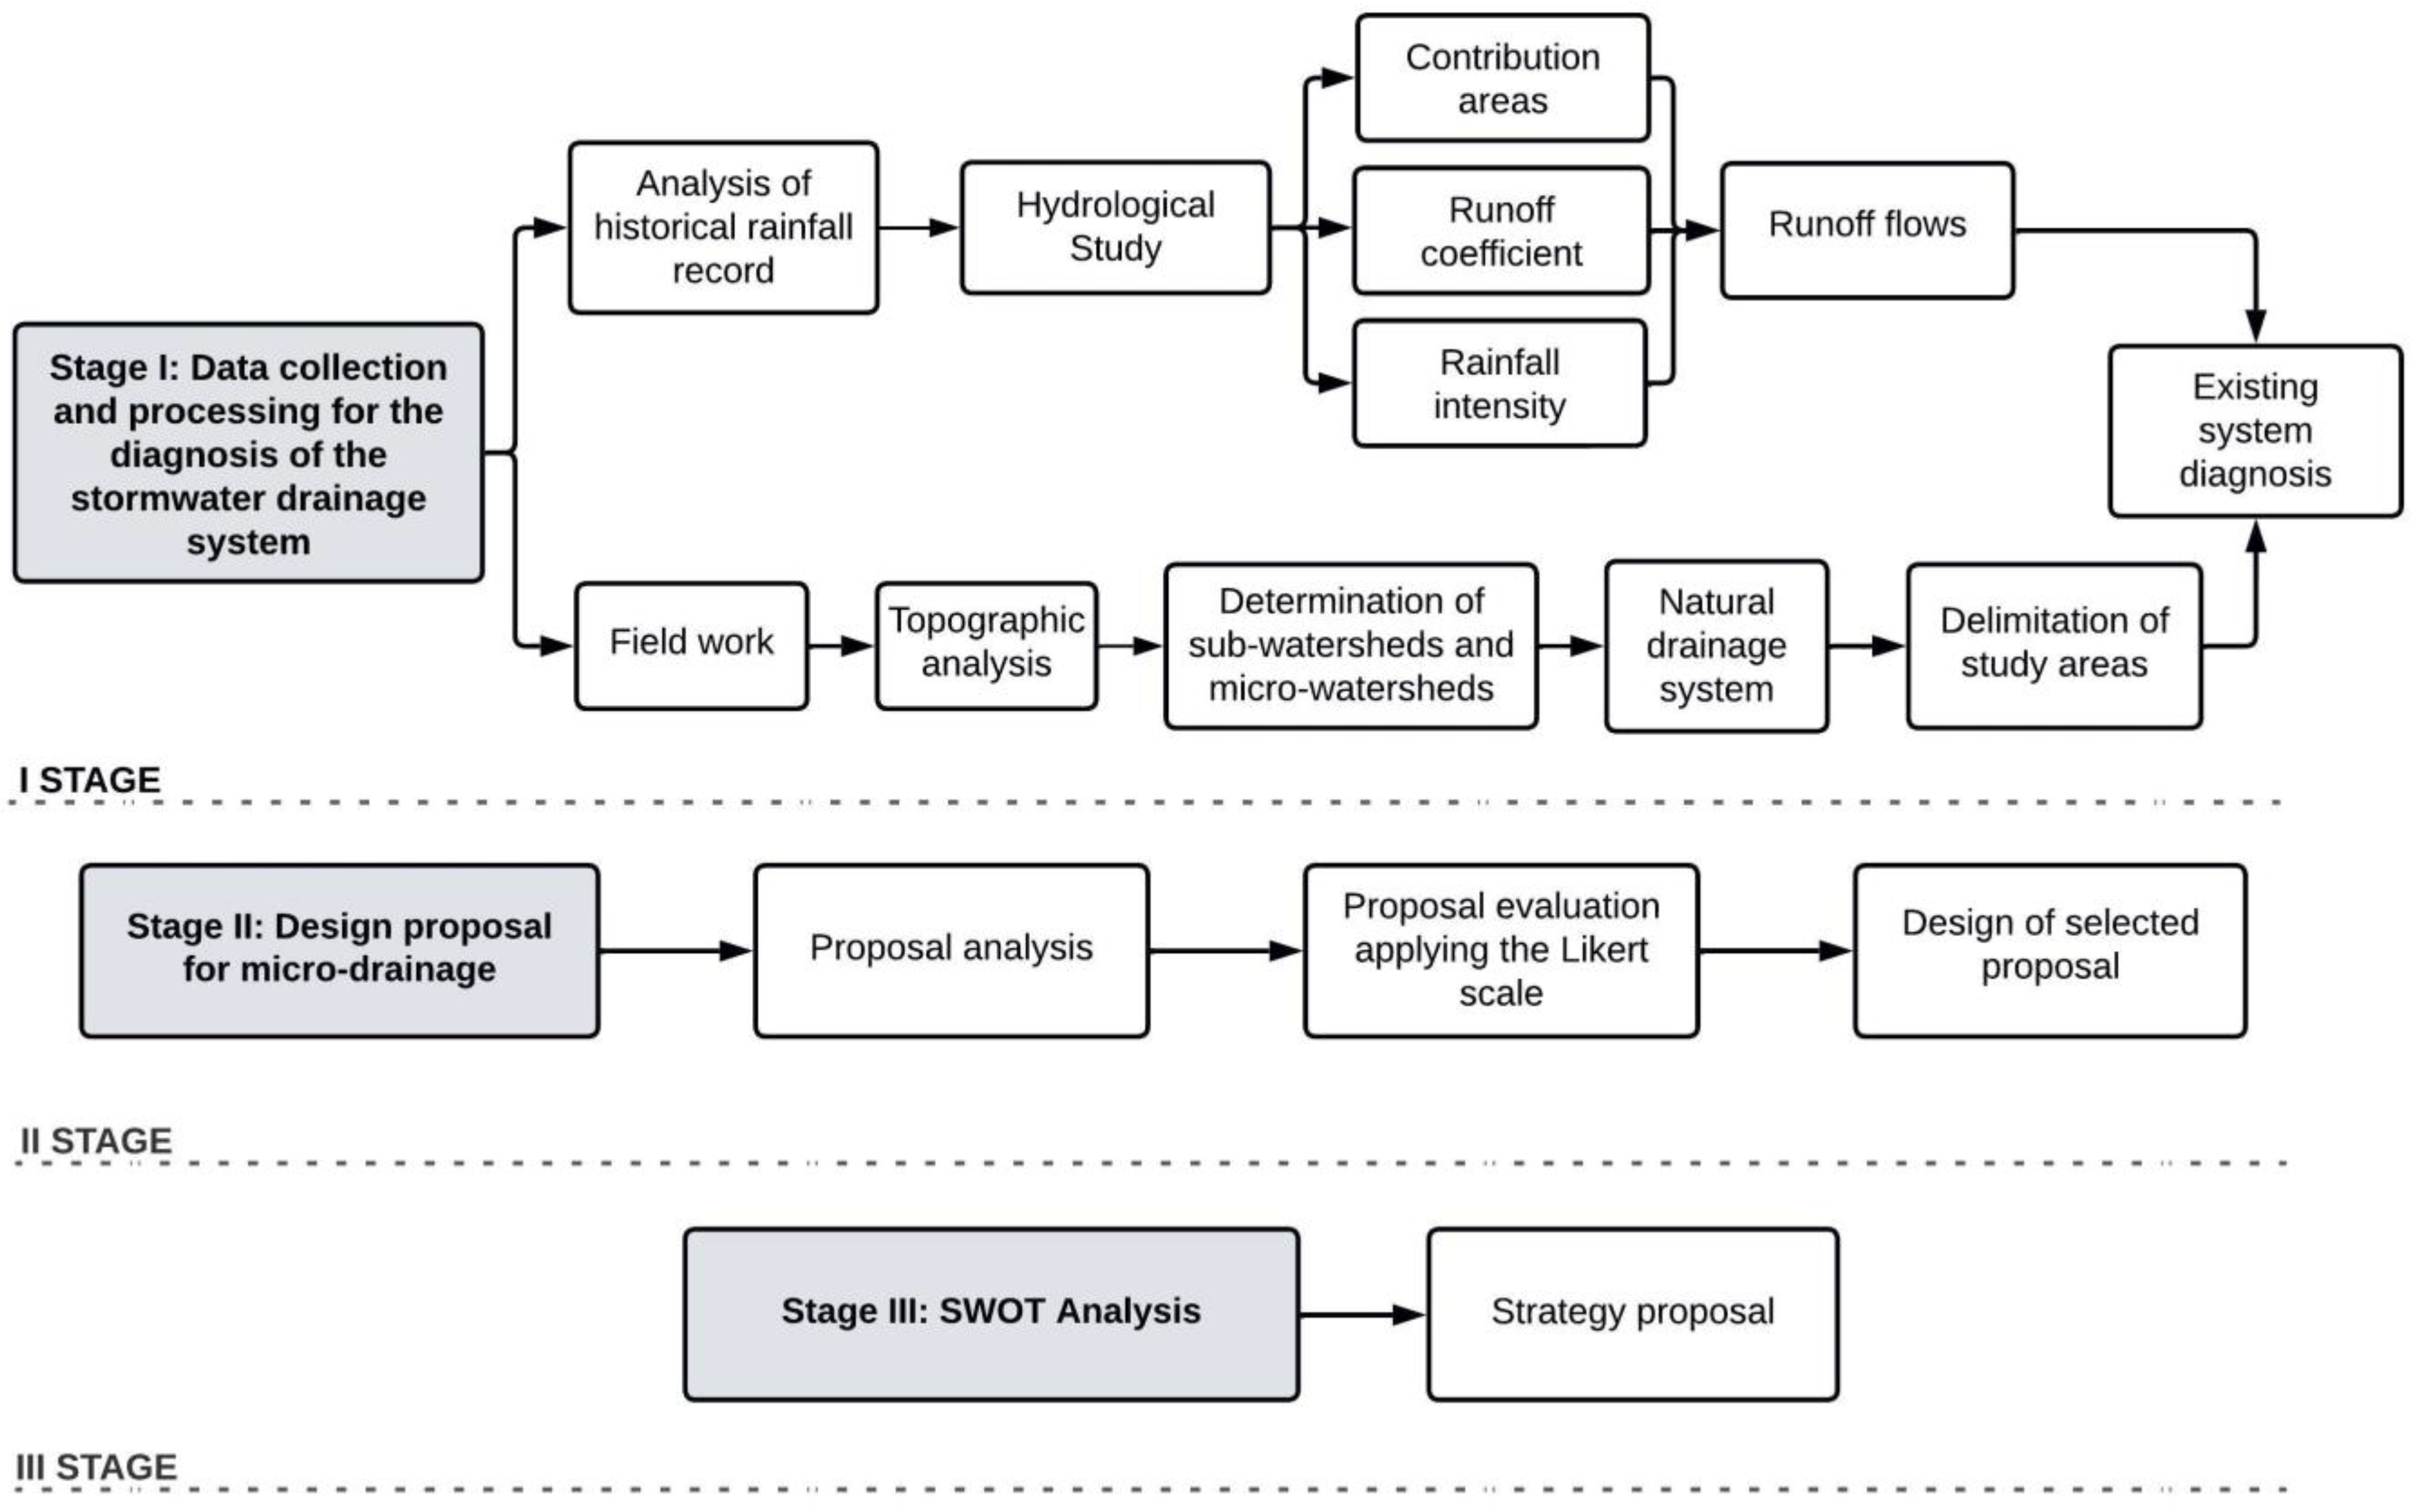
2. Materials and Methods
2.1. Stage I: Data Collection and Processing for the Stormwater Drainage System Diagnosis
2.2. Stage II: Design Proposal for Micro-Drainage
2.2.1. Analysis Zones
2.2.2. Constraint Analysis
2.3. Stage III: SWOT Analysis
3. Results and Discussion
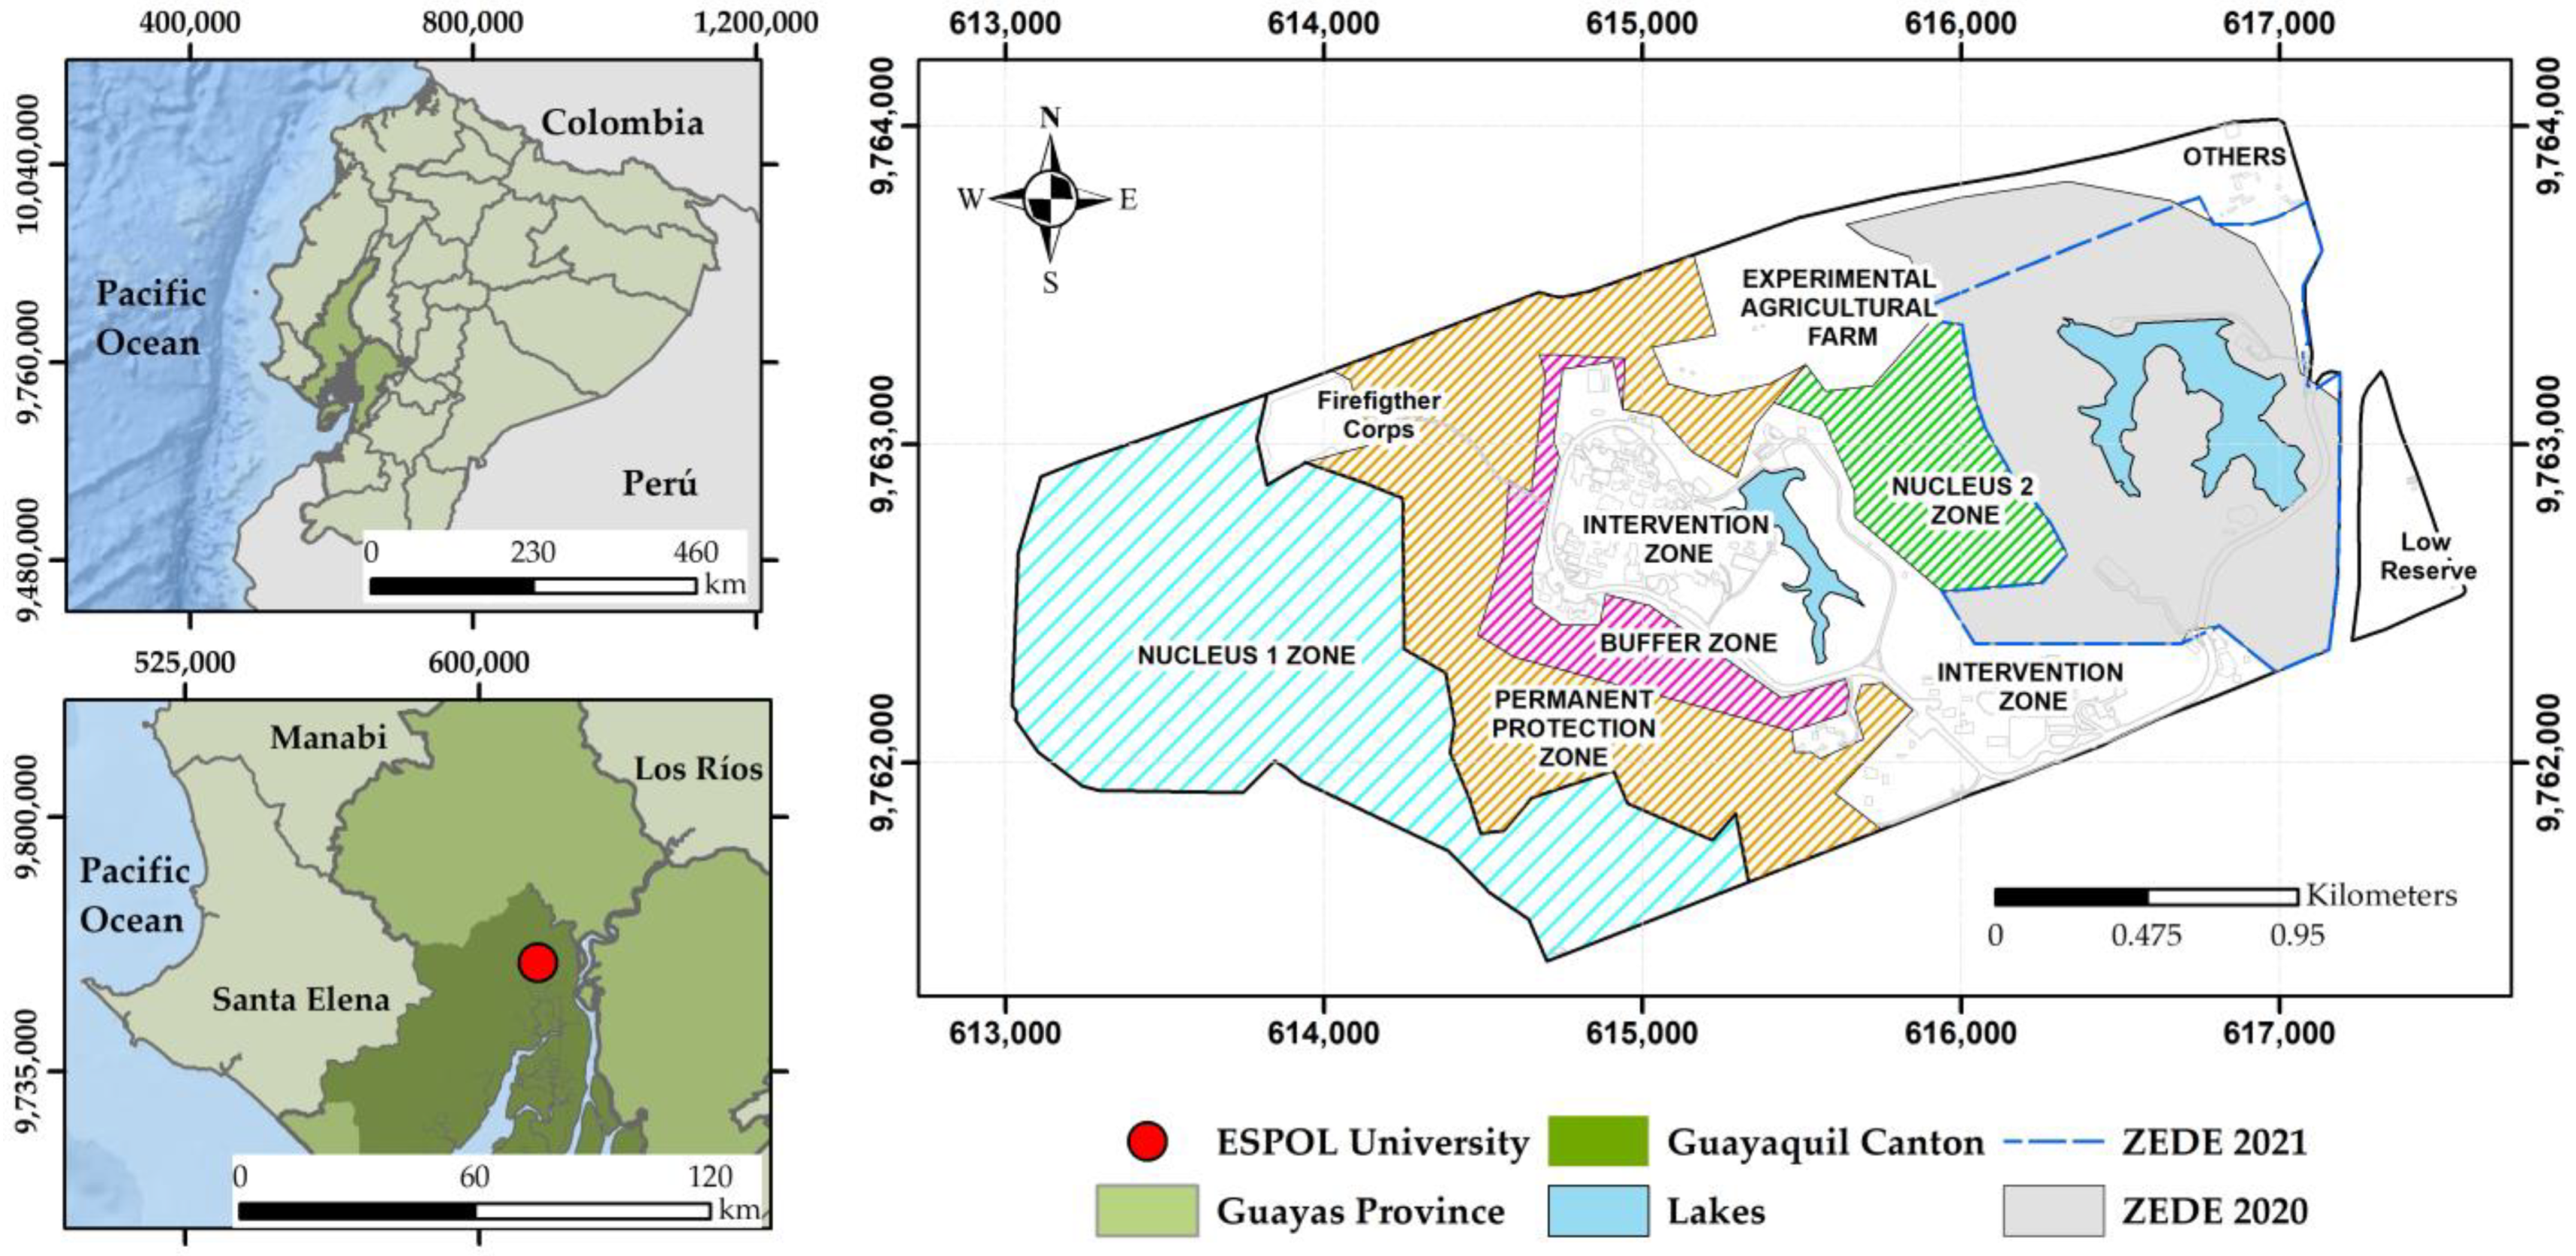
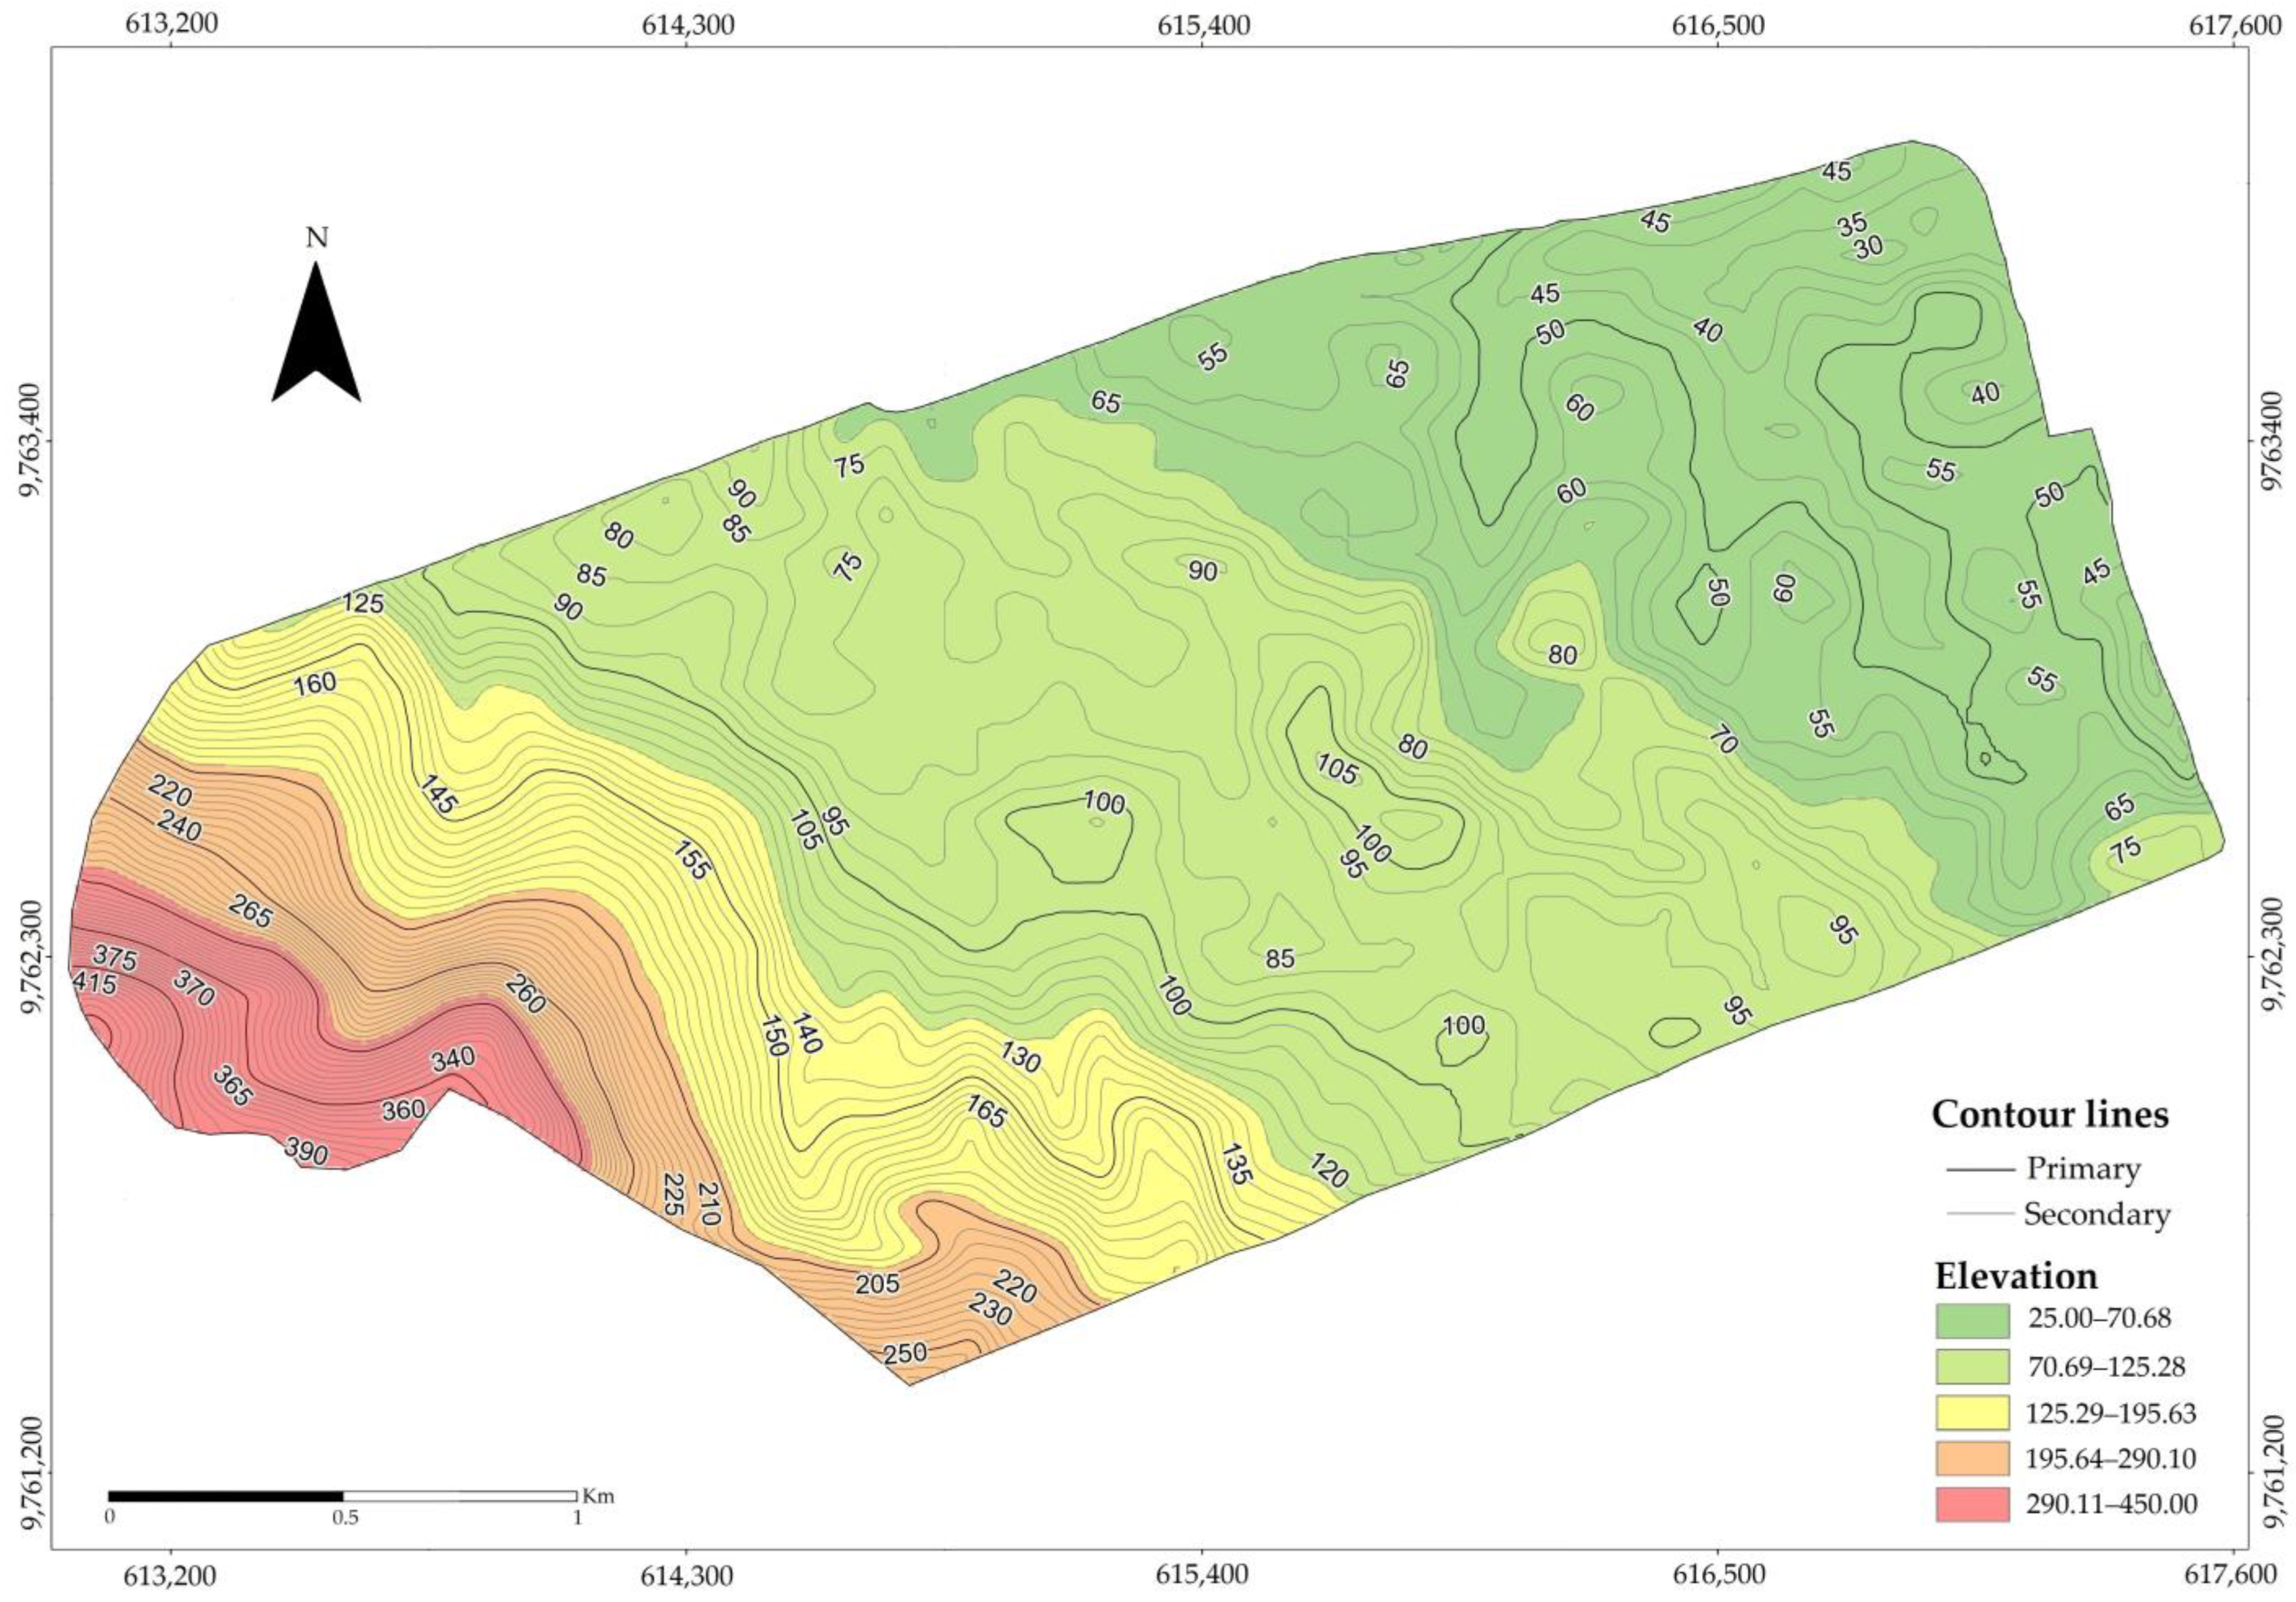
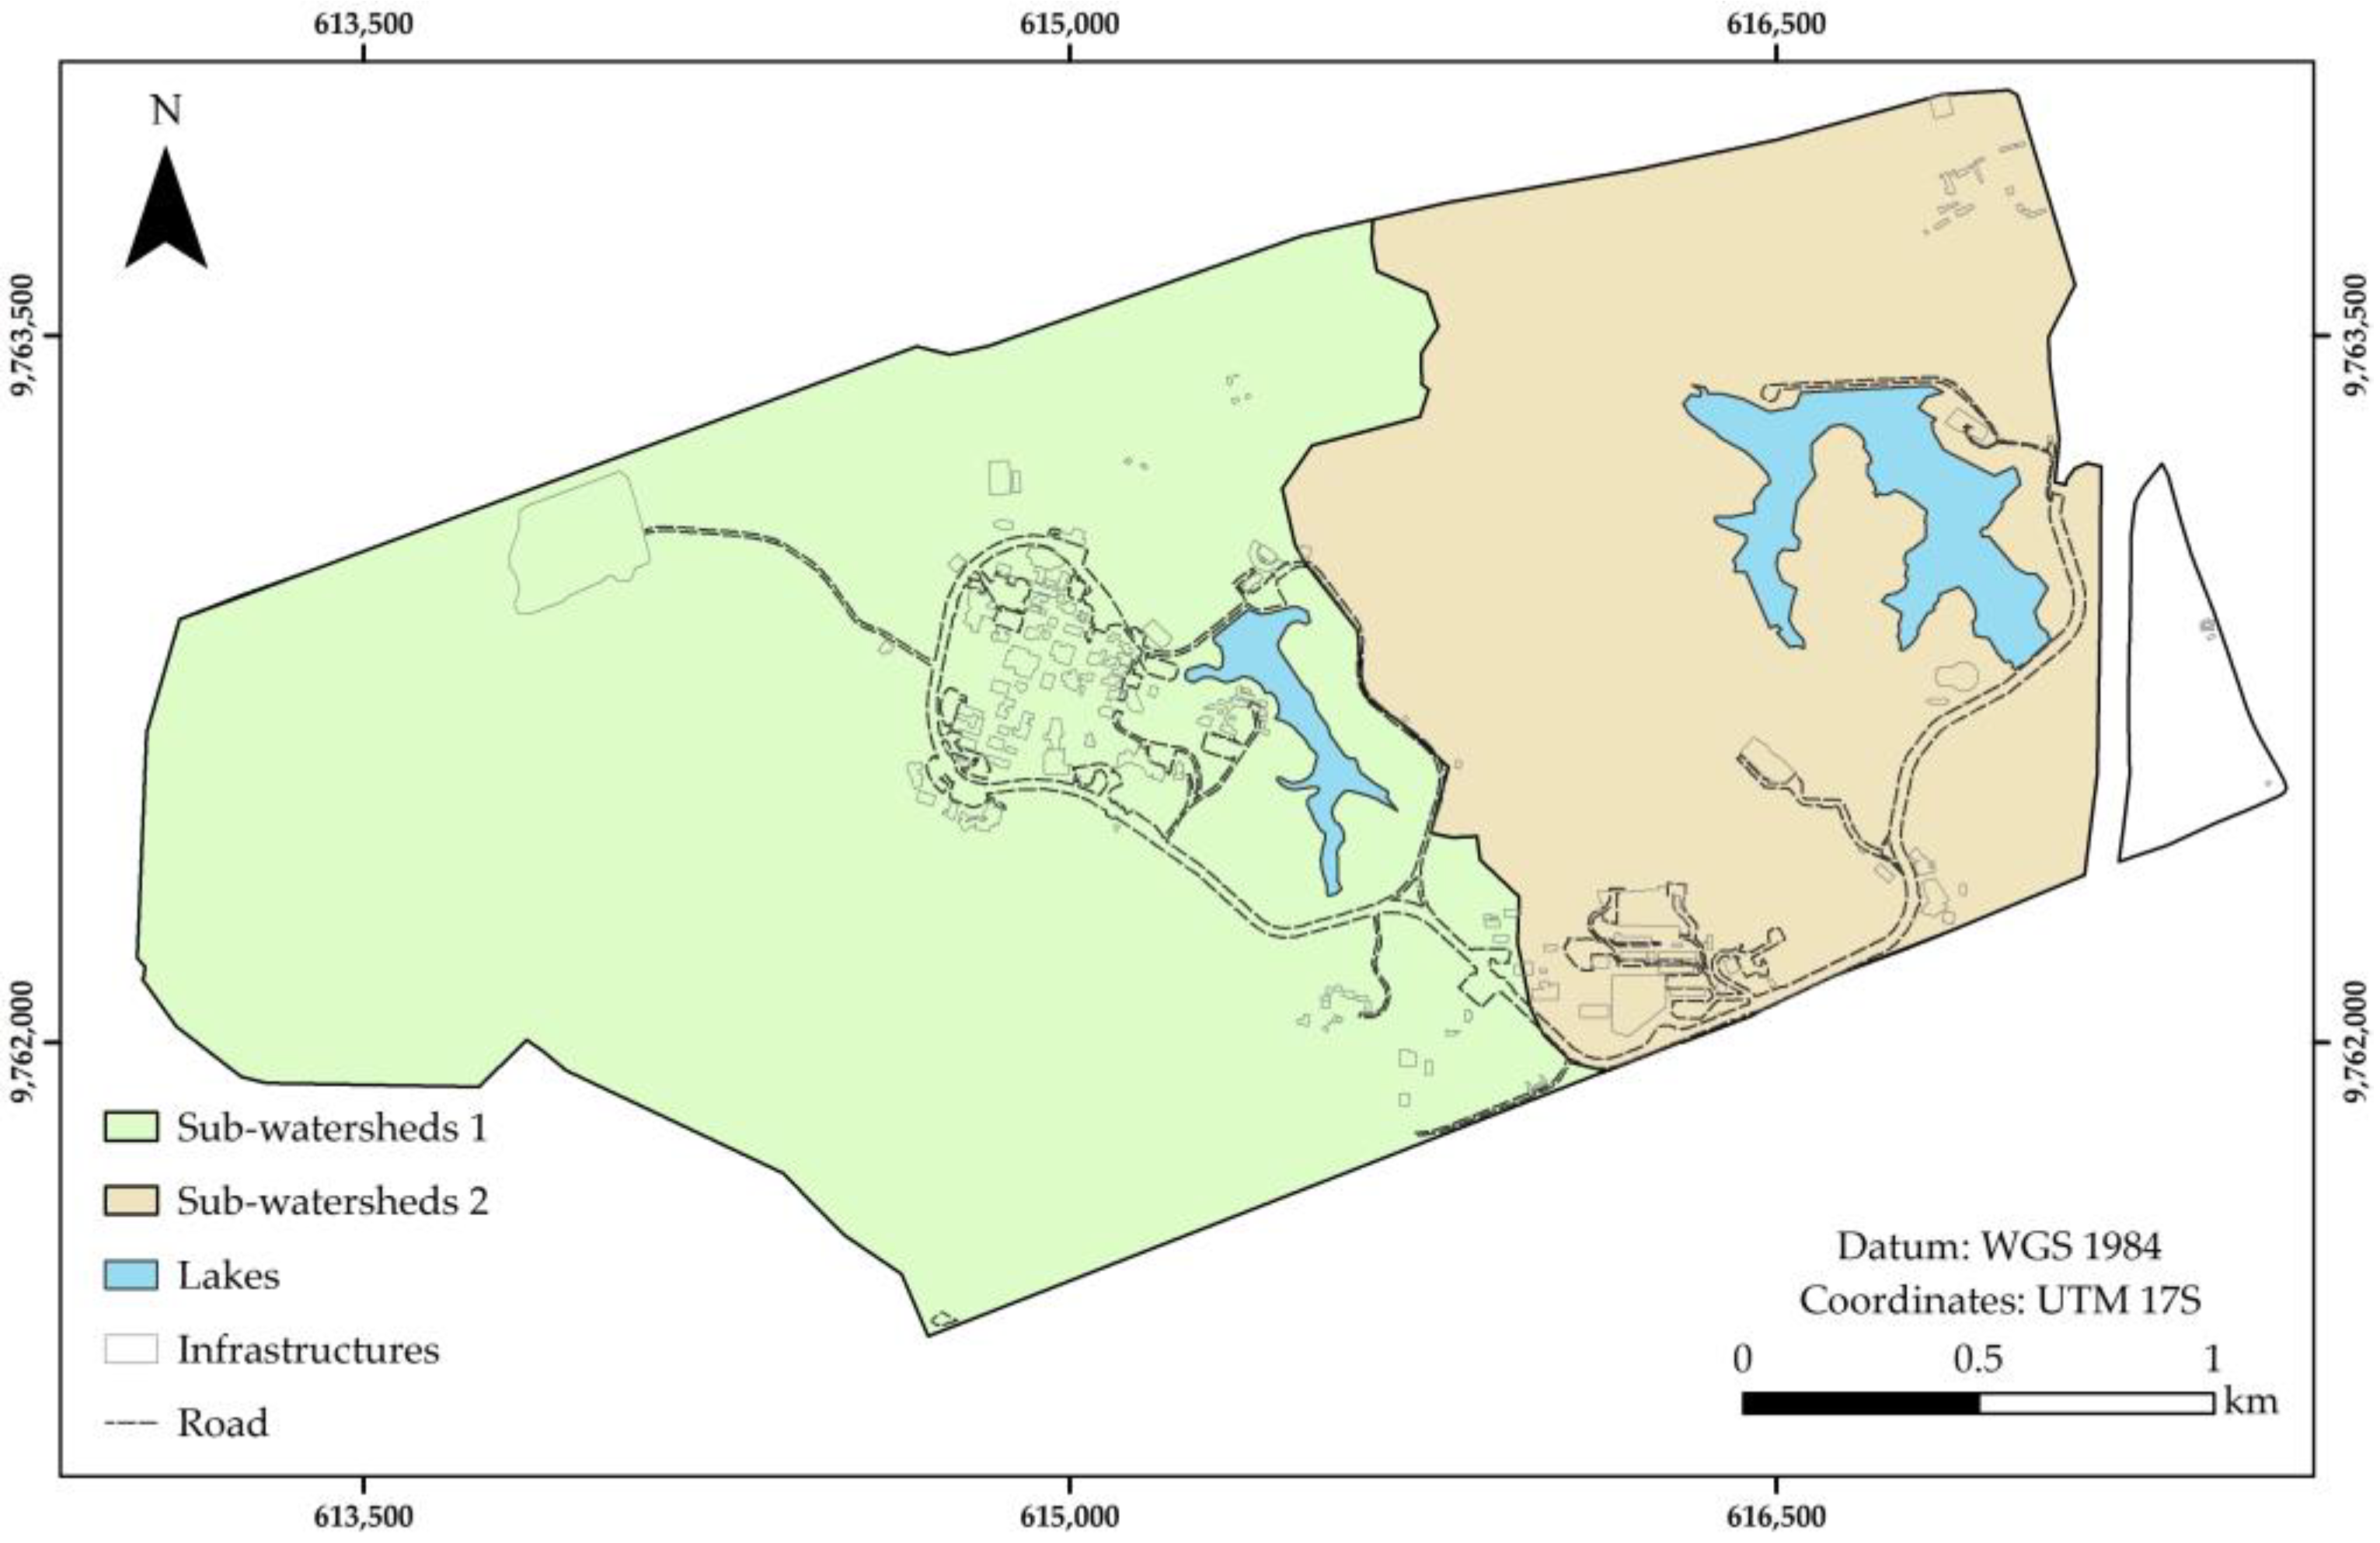
3.1. Study Area Diagnosis
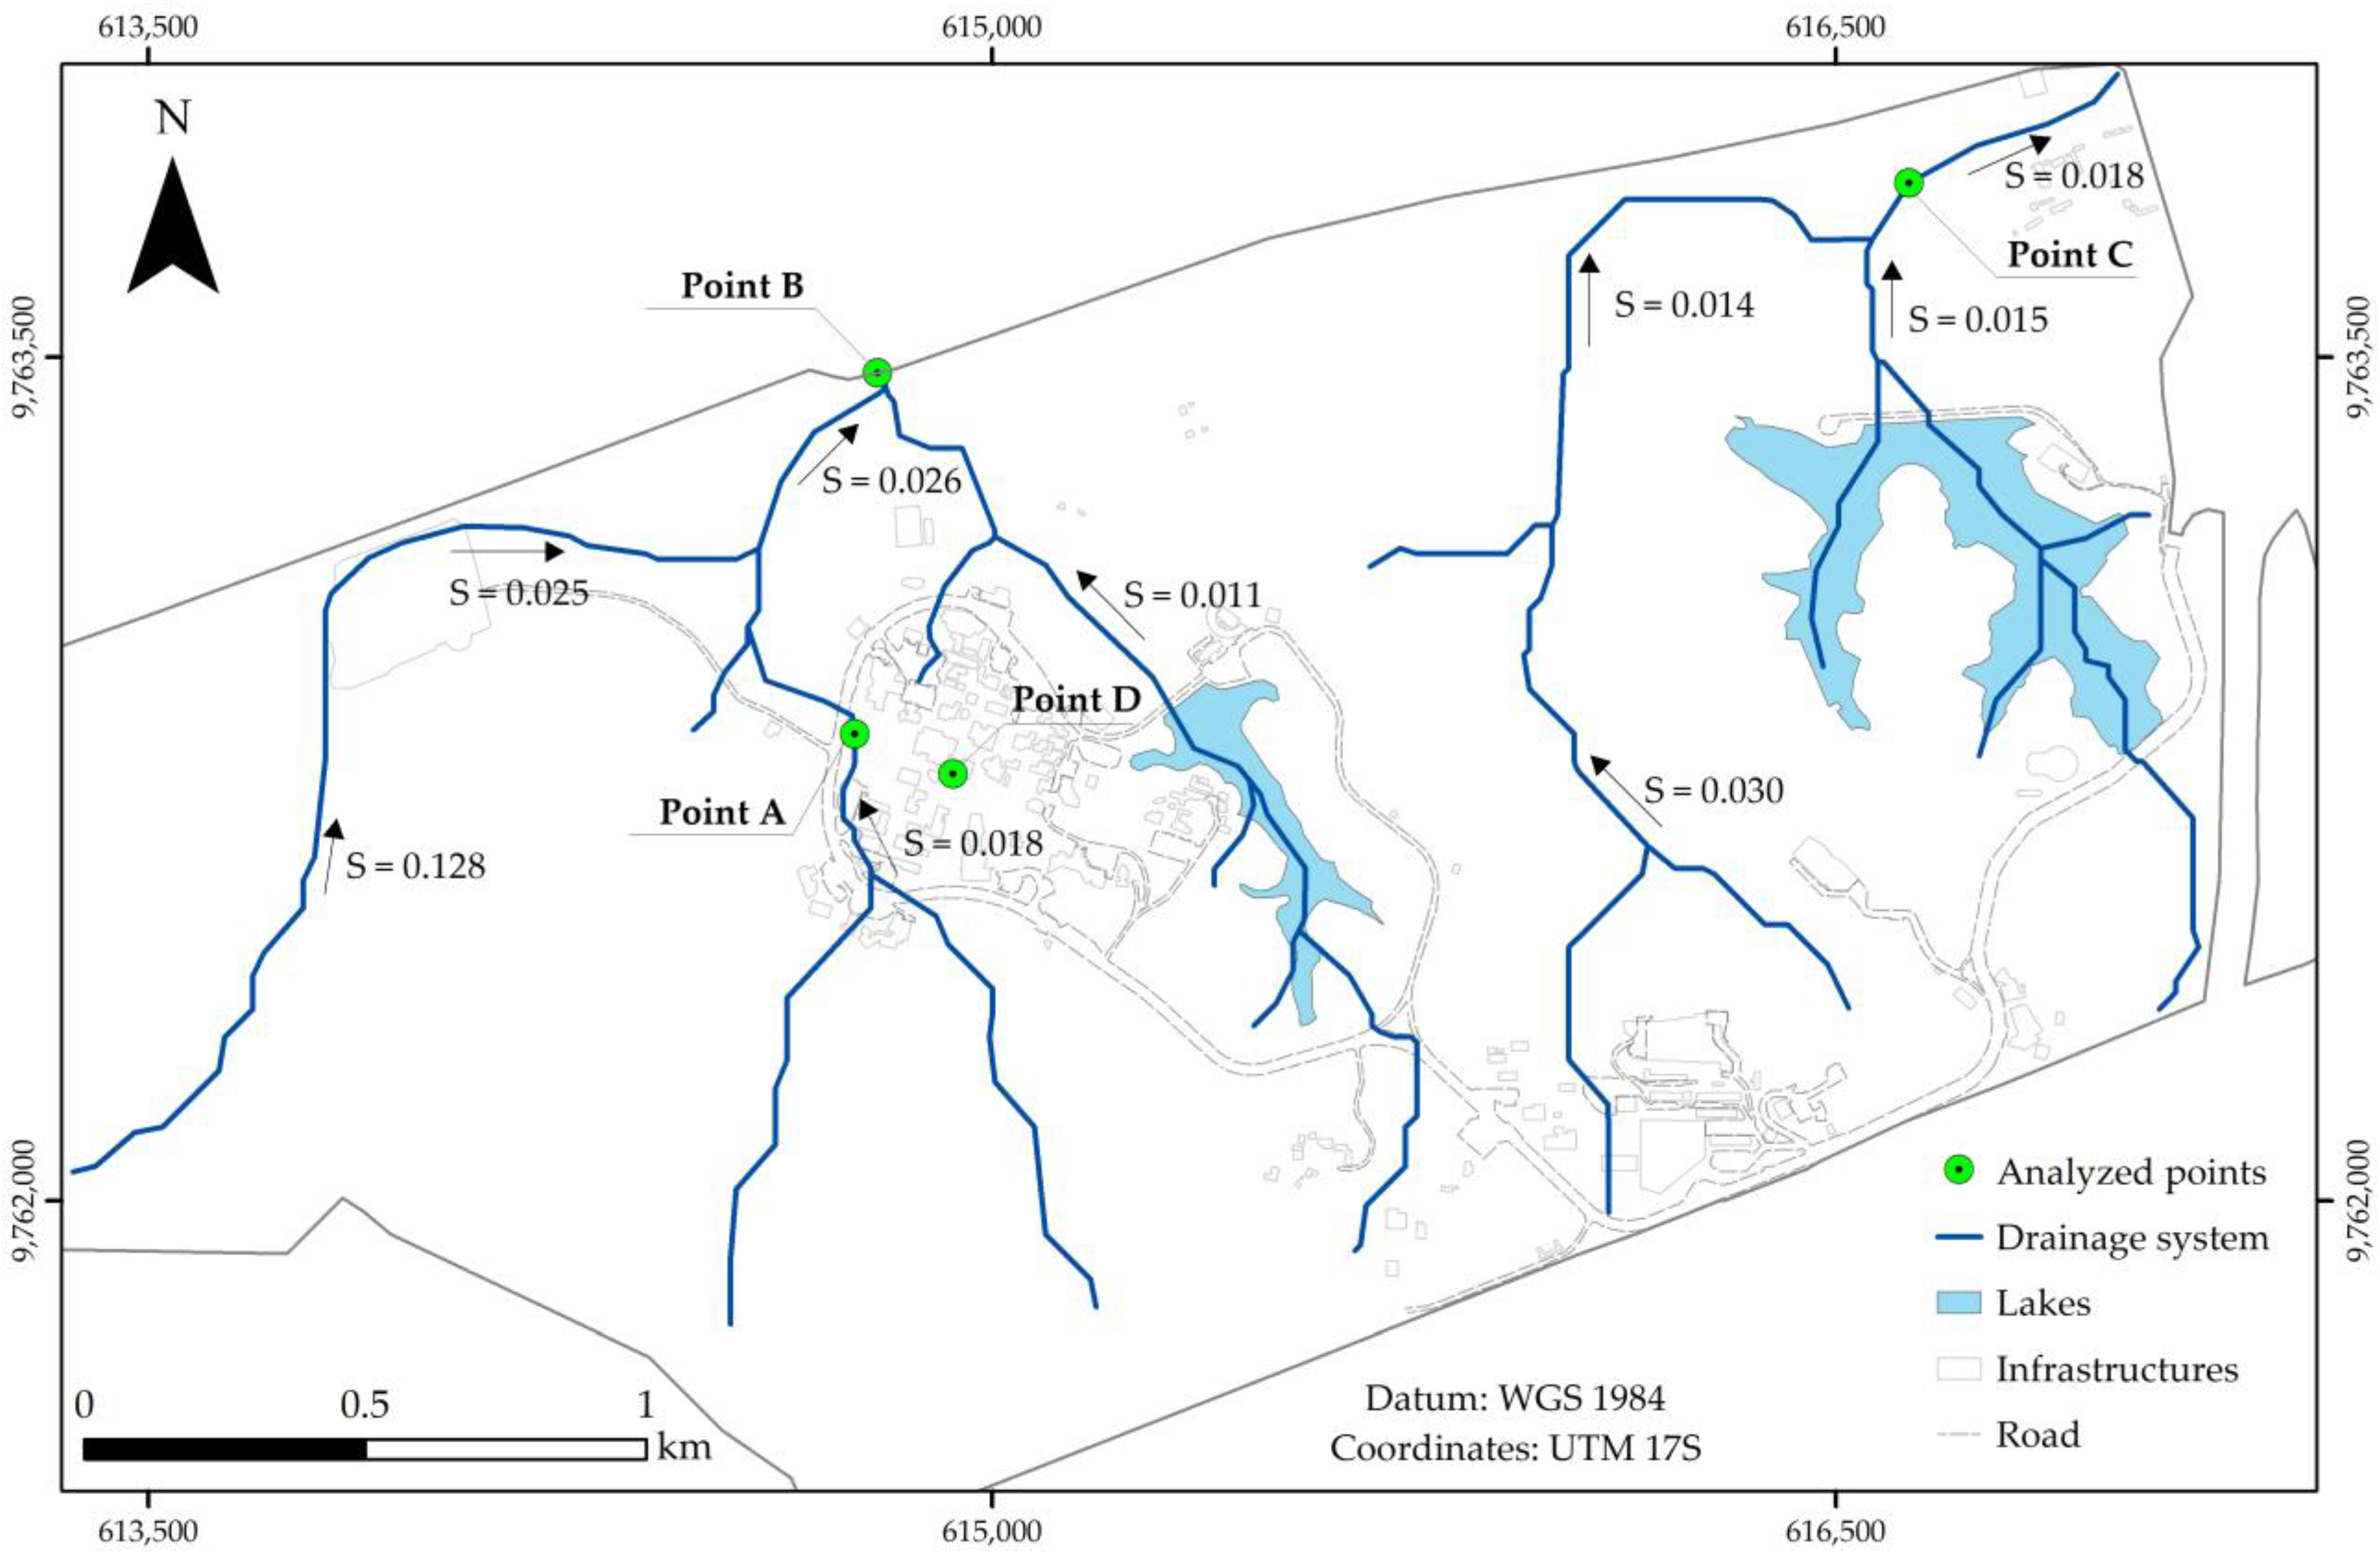
3.2. Hydrological Study
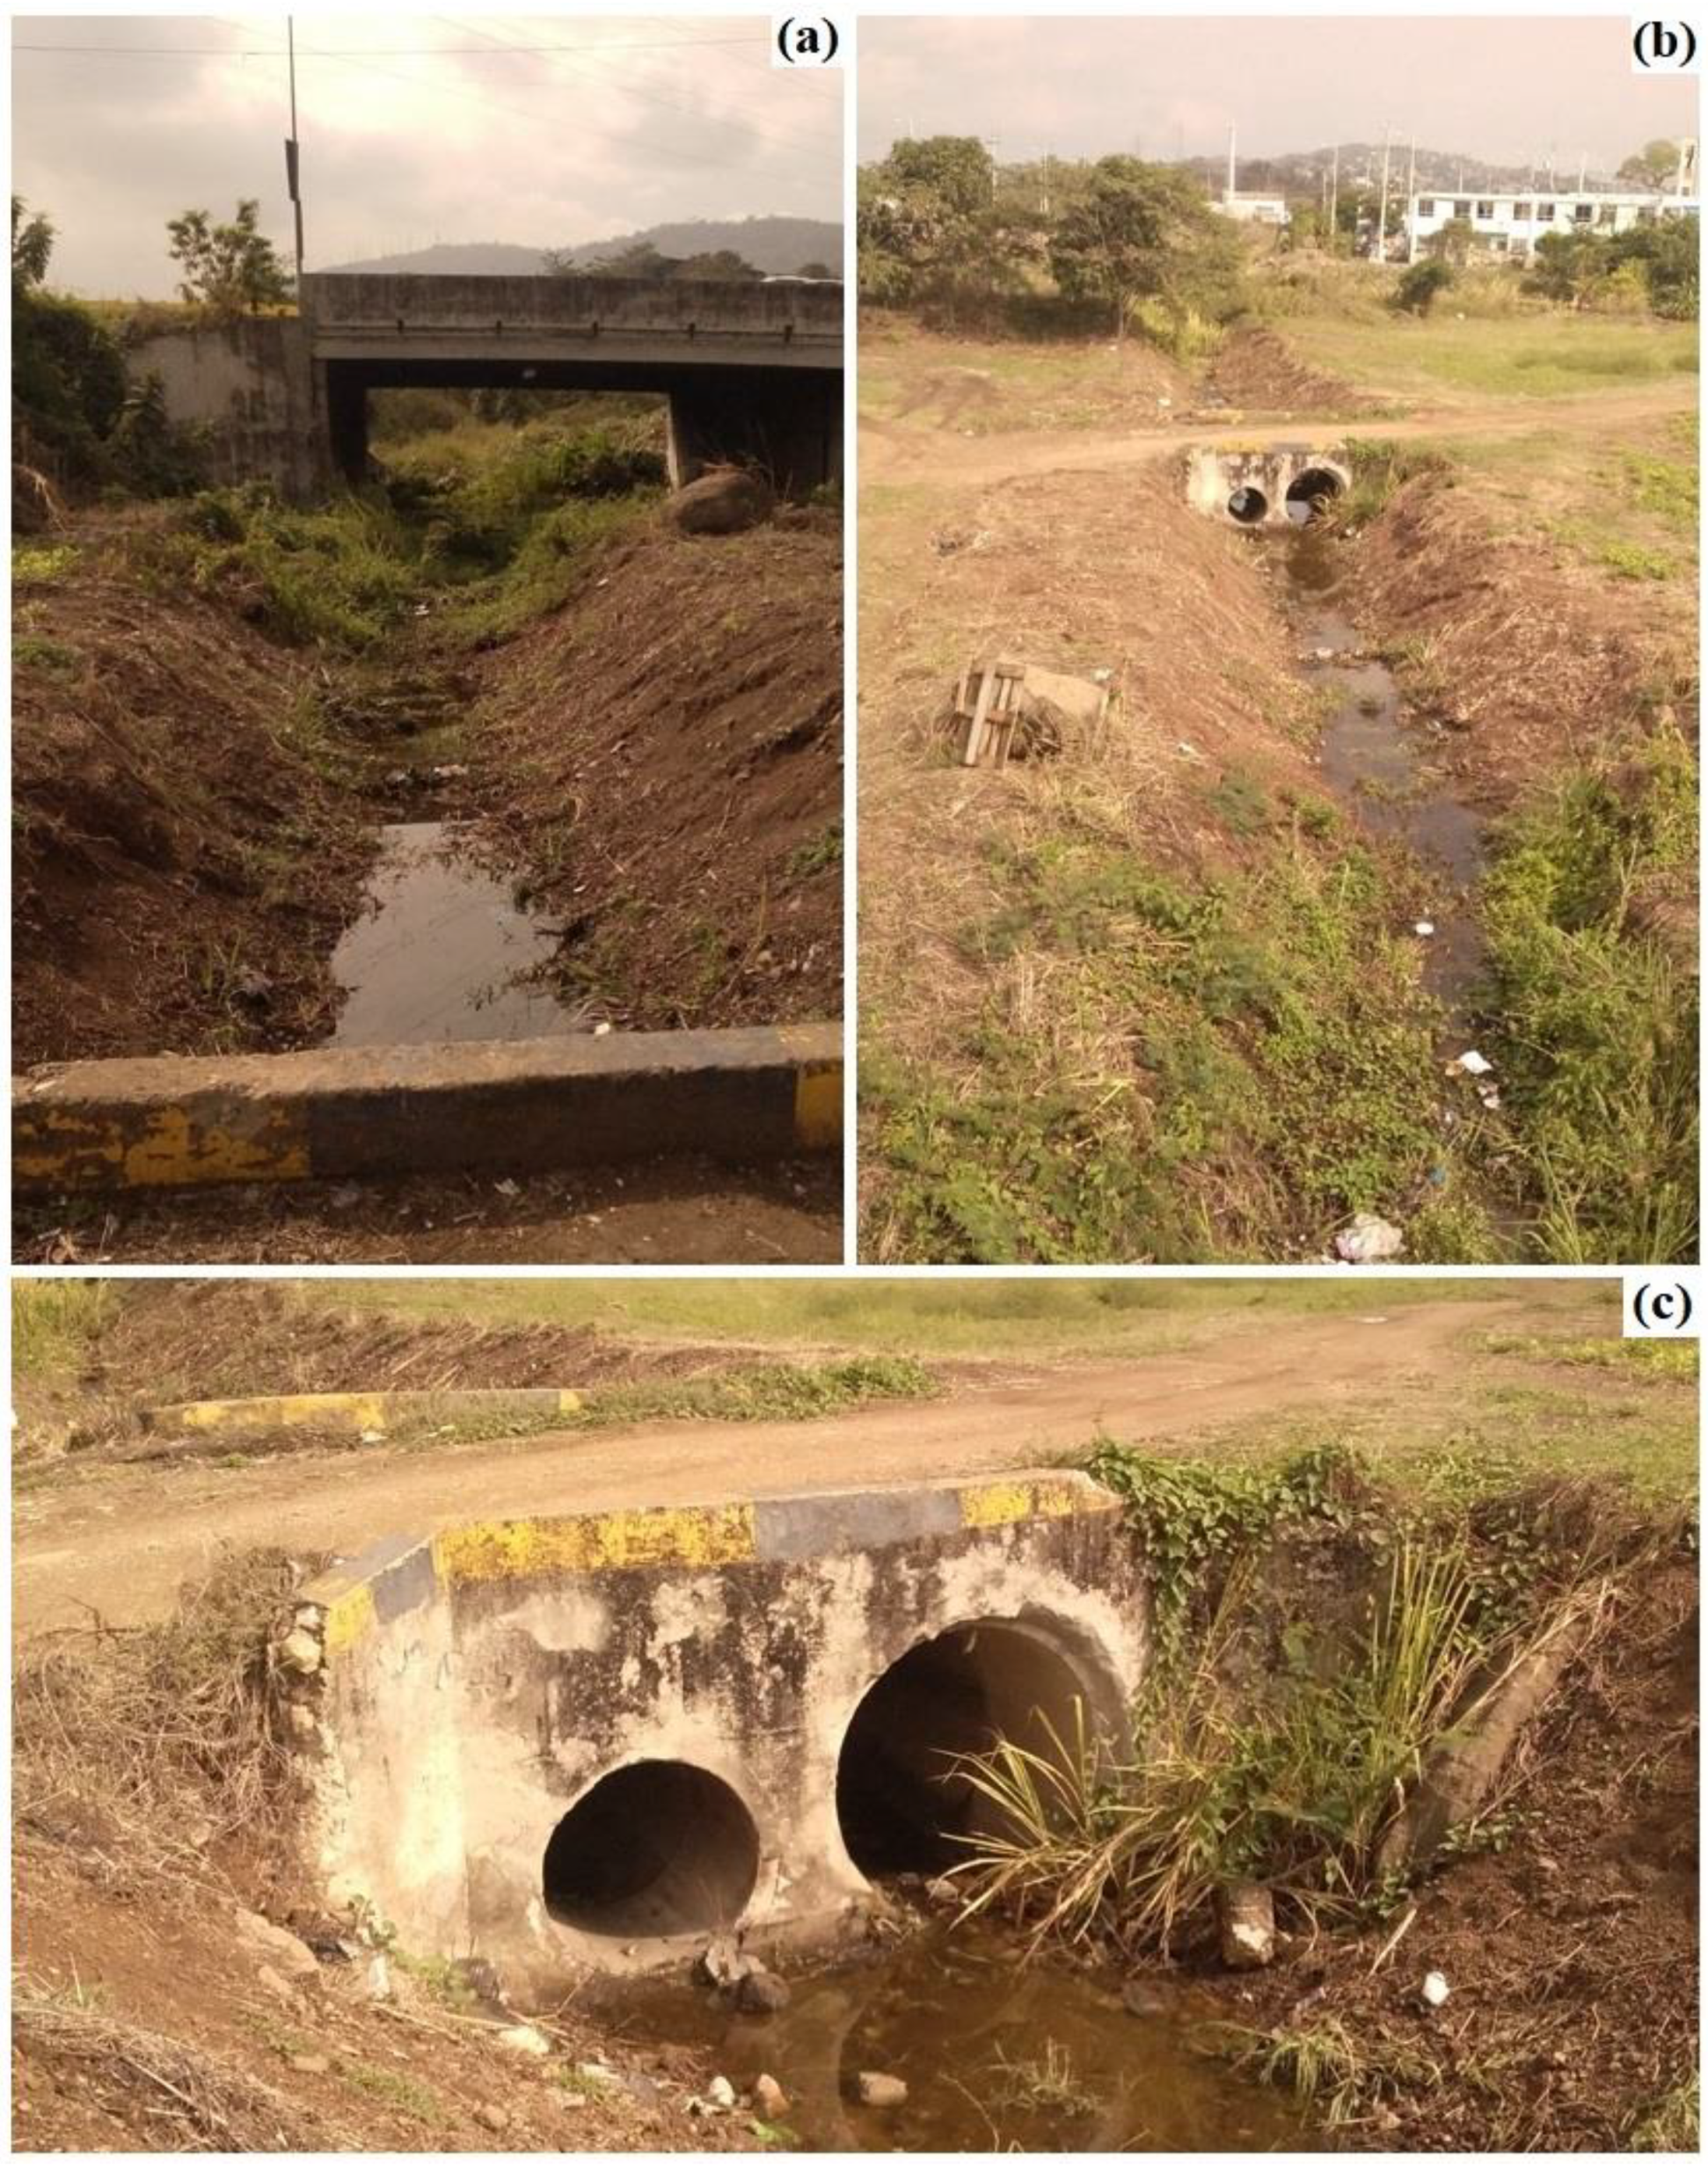
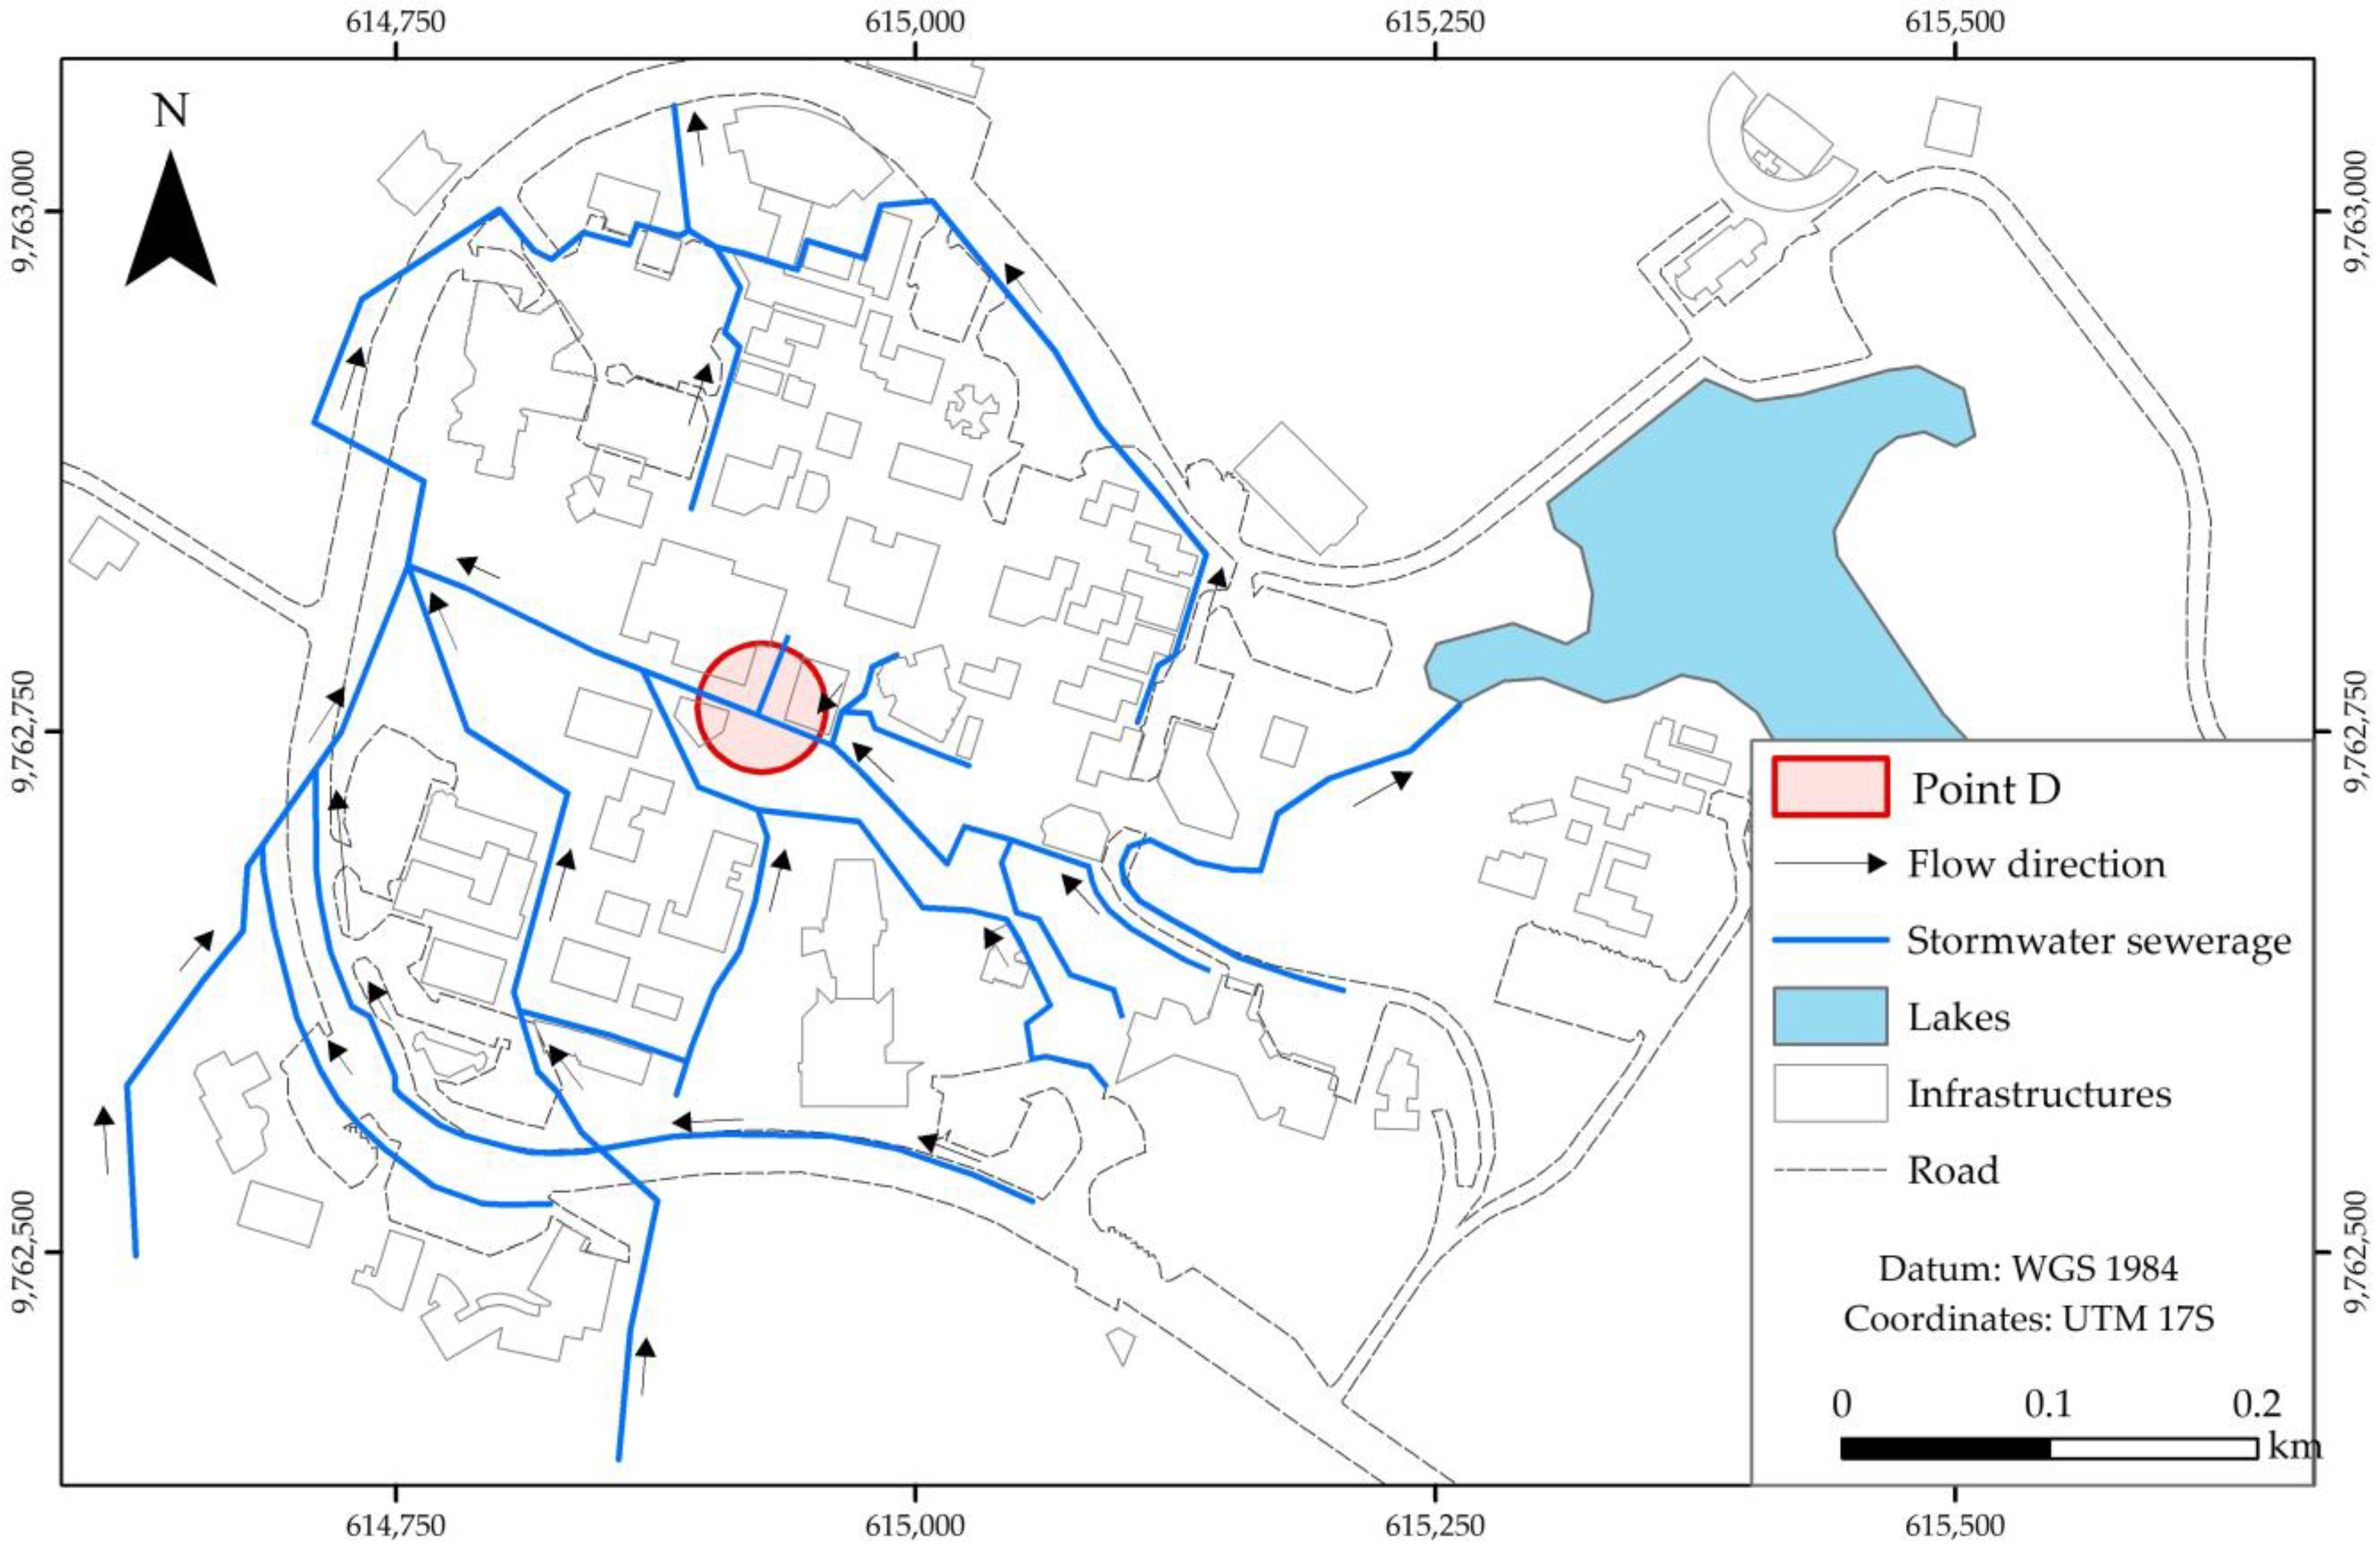
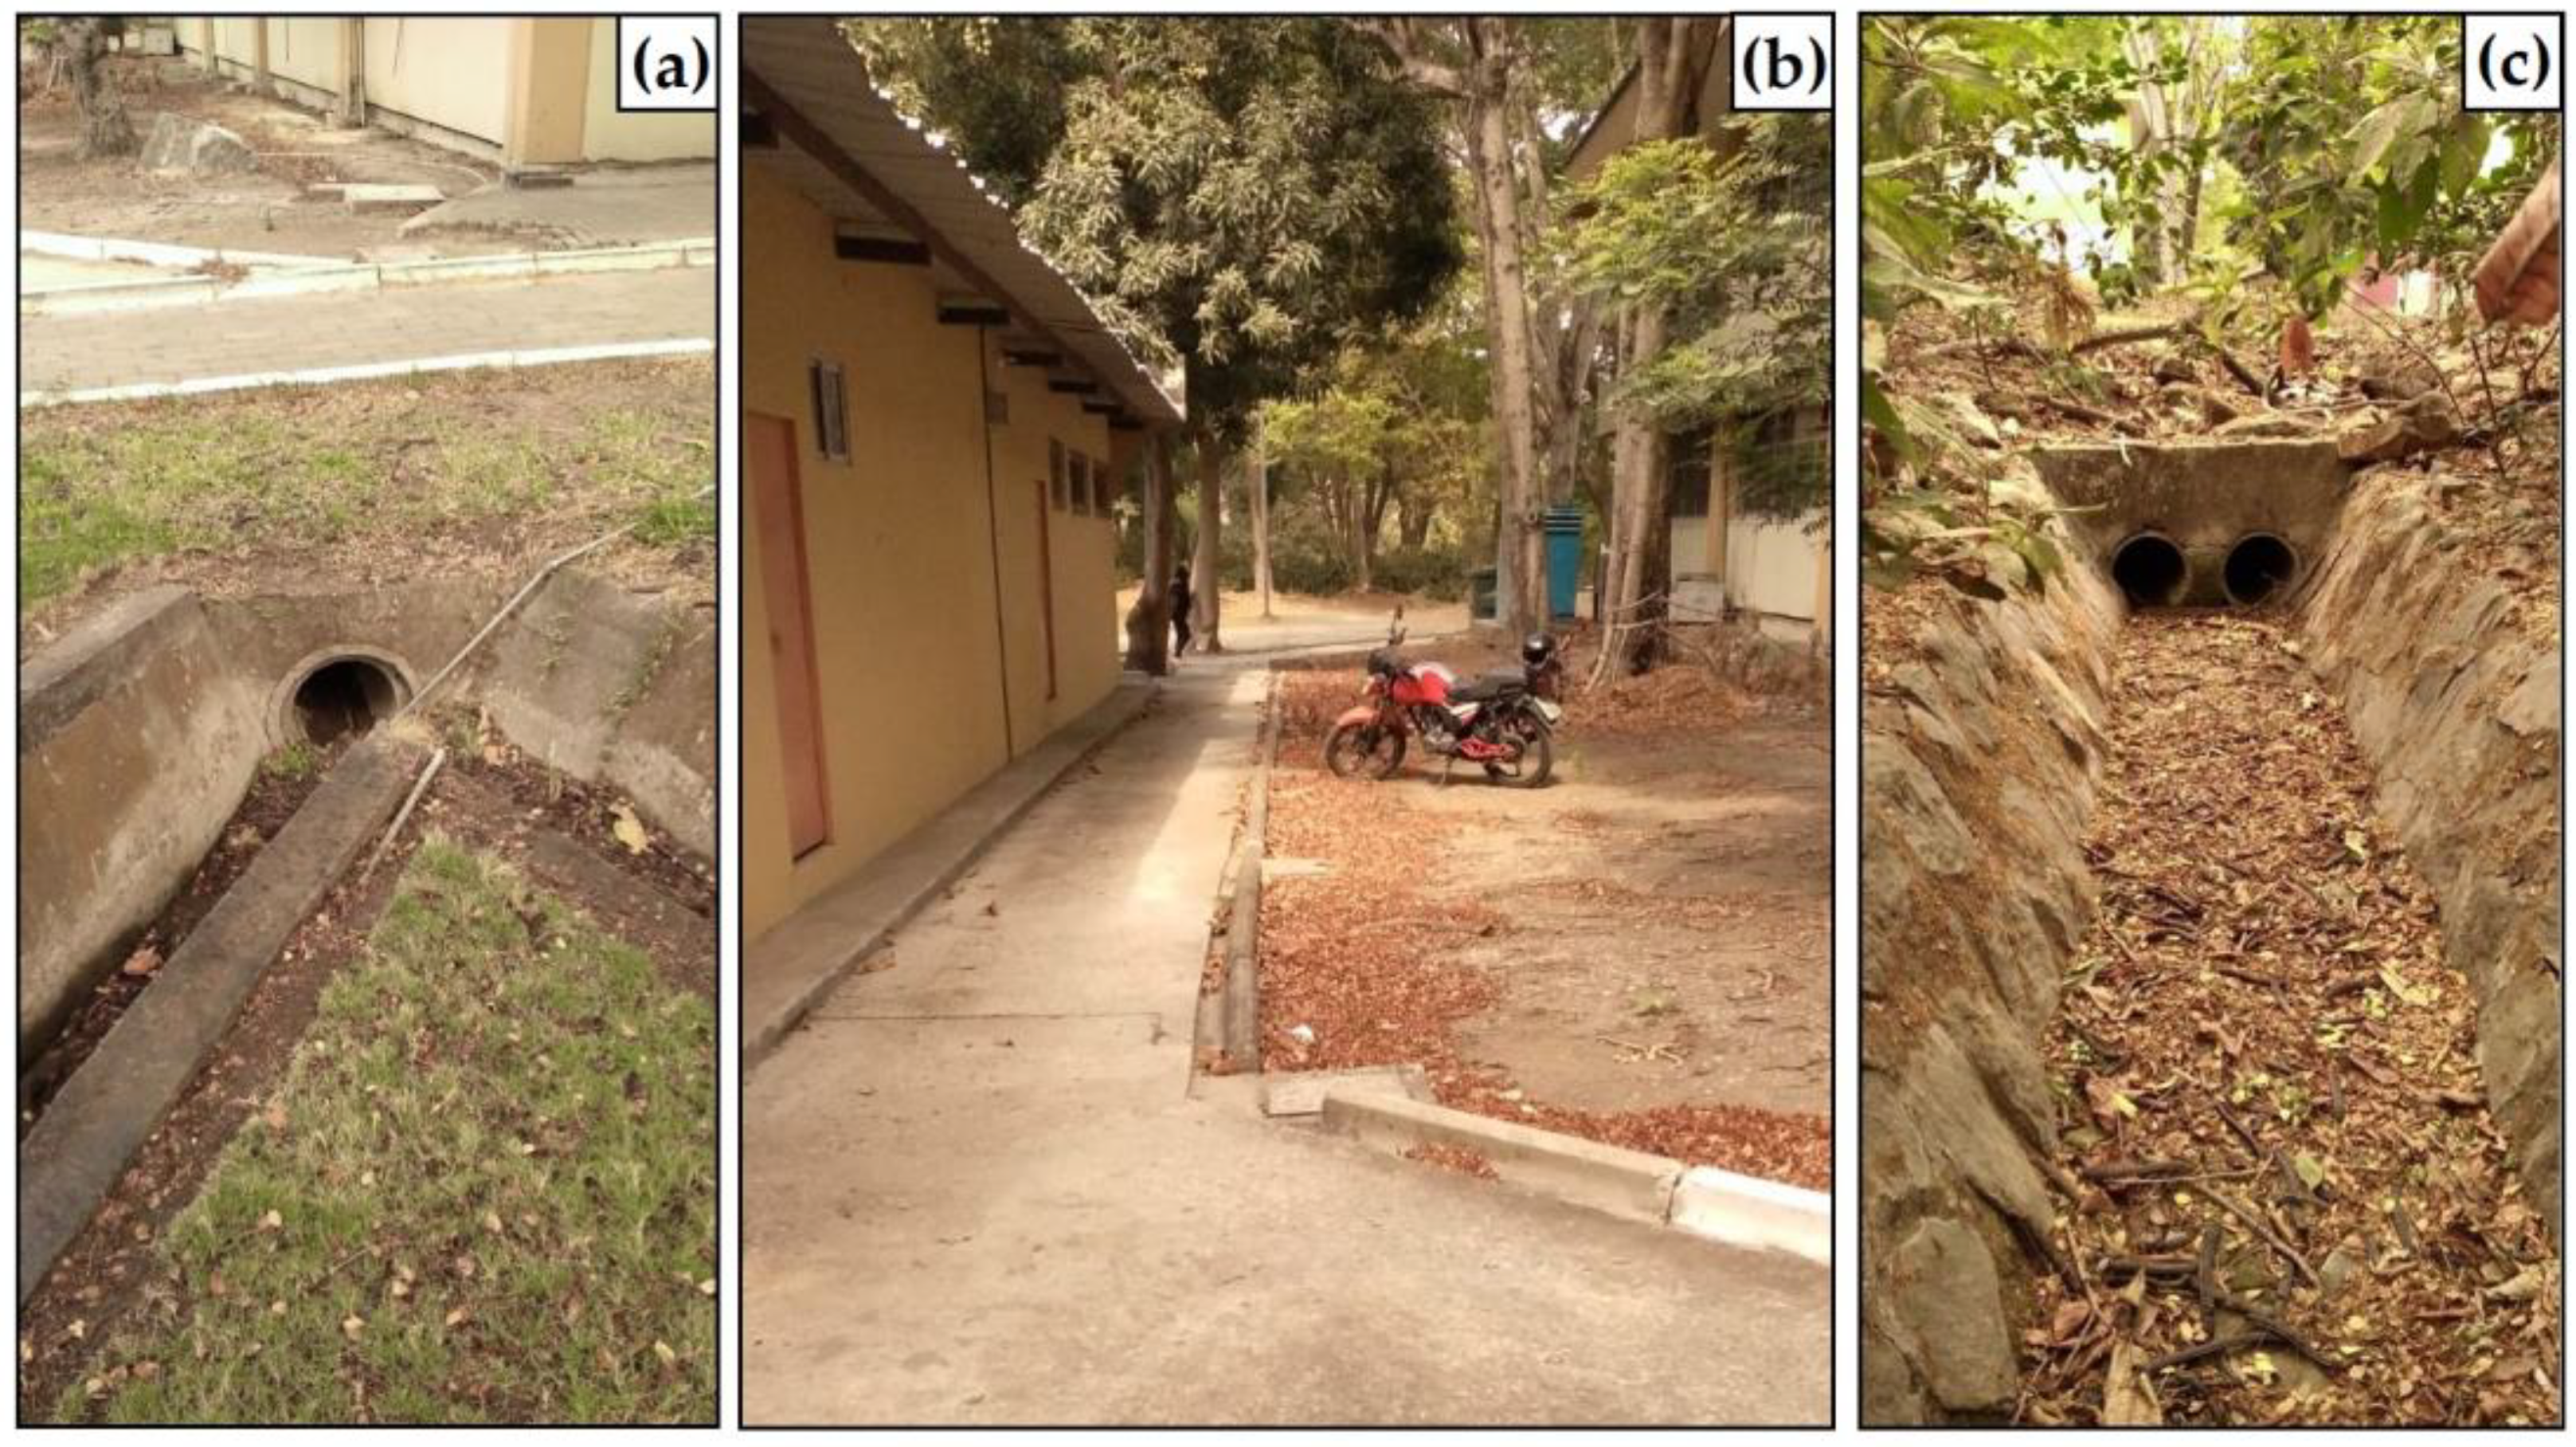
3.3. Existing System Evaluation
3.4. Evaluation of Alternatives Using a Likert Scale
- Alternative 1: Implementation of new channels and change of diameters in receiving pipes;
- Alternative 2: Implementation of green and blue solutions, creation of flood zones, green roofs, and use of permeable concrete.
3.5. Desing of Selected Proposal
3.6. SWOT Analysis
4. Conclusions
- The integration of technical-academic knowledge in the development of a stormwater masterplan for a university campus demonstrated the importance of water management in areas where, despite not being considered, poor planning generates damage to infrastructures and put the health of inhabitants at risk;
- The development of SWOT analysis in decision-making for managing water resources allows for the proposal of holistic strategies from the social, academic, and governmental points of view, which guarantee the functionality of sewerage systems and water reuse in the short, medium, and long term;
- Ancestral (traditional) knowledge is important through NBS for collecting and managing water, as 3E (Ecological, Economic, Effective) alternatives, and are replicable locally and regionally.
Author Contributions
Funding
Data Availability Statement
Acknowledgments
Conflicts of Interest
References
- Uereyen, S.; Kuenzer, C. A Review of Earth Observation-Based Analyses for Major River Basins. Remote Sens. 2019, 11, 2951. [Google Scholar] [CrossRef]
- Ramakrishna, B. Estrategias de Extensión Para El Manejo Integrado de Cuencas Hidrográficas; Instituto Interamericano de Cooperación para la Agricultura: San Jose, CA, USA, 1997. [Google Scholar]
- Gophen, M. Climate and Water Balance Changes in the Kinneret Watershed: A Review. Open J. Mod. Hydrol. 2020, 10, 21–29. [Google Scholar] [CrossRef]
- Peña-Guzmán, C.; Ulloa-Sánchez, S.; Mora, K.; Helena-Bustos, R.; Lopez-Barrera, E.; Alvarez, J.; Rodriguez-Pinzón, M. Emerging Pollutants in the Urban Water Cycle in Latin America: A Review of the Current Literature. J. Environ. Manag. 2019, 237, 408–423. [Google Scholar] [CrossRef]
- Naciones Unidas. Informe de Los Objetivos de Desarrollo Sostenible; Organización de las Naciones Unidas: New York, NY, USA, 2019. [Google Scholar]
- Miguez, M.G.; Bahiense, J.M.; Rezende, O.M.; Veról, A.P. Sustainable Urban Drainage Approach, Focusing on Lid Techniques, Applied to the Design of New Housing Subdivisions in the Context of a Growing City. Int. J. Sustain. Dev. Plan. 2014, 9, 538–552. [Google Scholar] [CrossRef]
- Teuling, A.J.; de Badts, E.A.G.; Jansen, F.A.; Fuchs, R.; Buitink, J.; Hoek van Dijke, A.J.; Sterling, S.M. Climate Change, Reforestation/Afforestation, and Urbanization Impacts on Evapotranspiration and Streamflow in Europe. Hydrol. Earth Syst. Sci. 2019, 23, 3631–3652. [Google Scholar] [CrossRef]
- Arnone, E.; Pumo, D.; Francipane, A.; La Loggia, G.; Noto, L.V. The Role of Urban Growth, Climate Change, and Their Interplay in Altering Runoff Extremes. Hydrol. Process. 2018, 32, 1755–1770. [Google Scholar] [CrossRef]
- Zhou, Q.; Leng, G.; Su, J.; Ren, Y. Comparison of Urbanization and Climate Change Impacts on Urban Flood Volumes: Importance of Urban Planning and Drainage Adaptation. Sci. Total Environ. 2019, 658, 24–33. [Google Scholar] [CrossRef]
- Fernandez, A.; Black, J.; Jones, M.; Wilson, L.; Salvador-Carulla, L.; Astell-Burt, T.; Black, D. Flooding and Mental Health: A Systematic Mapping Review. PLoS ONE 2015, 10, e0119929. [Google Scholar] [CrossRef]
- Winsemius, H.C.; Aerts, J.C.J.H.; van Beek, L.P.H.; Bierkens, M.F.P.; Bouwman, A.; Jongman, B.; Kwadijk, J.C.J.; Ligtvoet, W.; Lucas, P.L.; van Vuuren, D.P.; et al. Global Drivers of Future River Flood Risk. Nat. Clim. Chang. 2016, 6, 381–385. [Google Scholar] [CrossRef]
- Merchán-Sanmartín, B.; Aucapeña-Parrales, J.; Alcívar-Redrován, R.; Carrión-Mero, P.; Jaya-Montalvo, M.; Arias-Hidalgo, M. Earth Dam Design for Drinking Water Management and Flood Control: A Case Study. Water 2022, 14, 2029. [Google Scholar] [CrossRef]
- He, Y.; Pappenberger, F.; Manful, D.; Cloke, H.; Bates, P.; Wetterhall, F.; Parkes, B. Flood Inundation Dynamics and Socioeconomic Vulnerability under Environmental Change. In Climate Vulnerability; Elsevier: Amsterdam, The Netherlands, 2013; pp. 241–255. [Google Scholar]
- Caillouët, K.A.; Carlson, J.C.; Wesson, D.; Jordan, F. Colonization of Abandoned Swimming Pools by Larval Mosquitoes and Their Predators Following Hurricane Katrina. J. Vector Ecol. 2008, 33, 166–172. [Google Scholar] [CrossRef] [PubMed]
- Mullen, G.R.; Durden, L.; Mullen, G. (Eds.) Medical and Veterinary Entomology, 2nd ed.; Academic Press: Cambridge, MA, USA, 2009. [Google Scholar]
- Moise, I.K.; Riegel, C.; Muturi, E.J. Environmental and Social-Demographic Predictors of the Southern House Mosquito Culex Quinquefasciatus in New Orleans, Louisiana. Parasit. Vectors 2018, 11, 249. [Google Scholar] [CrossRef]
- Muis, S.; Güneralp, B.; Jongman, B.; Aerts, J.C.J.H.; Ward, P.J. Flood Risk and Adaptation Strategies under Climate Change and Urban Expansion: A Probabilistic Analysis Using Global Data. Sci. Total Environ. 2015, 538, 445–457. [Google Scholar] [CrossRef]
- Arnell, N.W.; Gosling, S.N. The Impacts of Climate Change on River Flood Risk at the Global Scale. Clim. Chang. 2016, 134, 387–401. [Google Scholar] [CrossRef]
- Shah, A.A.; Ye, J.; Abid, M.; Khan, J.; Amir, S.M. Flood Hazards: Household Vulnerability and Resilience in Disaster-Prone Districts of Khyber Pakhtunkhwa Province, Pakistan. Nat. Hazards 2018, 93, 147–165. [Google Scholar] [CrossRef]
- Di Baldassarre, G.; Viglione, A.; Carr, G.; Kuil, L.; Yan, K.; Brandimarte, L.; Blöschl, G. Debates-Perspectives on Socio-Hydrology: Capturing Feedbacks between Physical and Social Processes. Water Resour. Res. 2015, 51, 4770–4781. [Google Scholar] [CrossRef]
- Osberghaus, D. The Effect of Flood Experience on Household Mitigation—Evidence from Longitudinal and Insurance Data. Glob. Environ. Chang. 2017, 43, 126–136. [Google Scholar] [CrossRef]
- Park, K.; Lee, M.-H. The Development and Application of the Urban Flood Risk Assessment Model for Reflecting upon Urban Planning Elements. Water 2019, 11, 920. [Google Scholar] [CrossRef]
- Bertilsson, L.; Wiklund, K.; de Moura Tebaldi, I.; Rezende, O.M.; Veról, A.P.; Miguez, M.G. Urban Flood Resilience—A Multi-Criteria Index to Integrate Flood Resilience into Urban Planning. J. Hydrol. 2019, 573, 970–982. [Google Scholar] [CrossRef]
- Butler, D.; Davies, J. Urban Drainage, 2nd ed.; CRC Press, Ed.; Taylor & Francis e-Library: New York, NY, USA, 2004. [Google Scholar]
- Sörensen, J.; Mobini, S. Pluvial, Urban Flood Mechanisms and Characteristics—Assessment Based on Insurance Claims. J. Hydrol. 2017, 555, 51–67. [Google Scholar] [CrossRef]
- Trapote Jaume, A.; Fernández Rodríguez, H. Técnicas de Drenaje Urbano Sostenible; Instituto del Agua y de las Ciencias Ambientales, Ed.; Instituto del Agua y de las Ciencias Ambientales: Alicante, Spain, 2016. [Google Scholar]
- Victorian Stormwater Committee. Urban Stormwater: Best Practice Environmental Management Guidelines; Csiro Publishing, Ed.; CSIRO Publishing: Clayton, Australia, 1999. [Google Scholar]
- Showers, K.B. Water Scarcity and Urban Africa: An Overview of Urban–Rural Water Linkages. World Dev. 2002, 30, 621–648. [Google Scholar] [CrossRef]
- Wheeler, S.; Loch, A.; Zuo, A.; Bjornlund, H. Reviewing the Adoption and Impact of Water Markets in the Murray–Darling Basin, Australia. J. Hydrol. 2014, 518, 28–41. [Google Scholar] [CrossRef]
- Damonte, G.; Boelens, R. Hydrosocial Territories, Agro-Export and Water Scarcity: Capitalist Territorial Transformations and Water Governance in Peru’s Coastal Valleys. Water Int. 2019, 44, 206–223. [Google Scholar] [CrossRef]
- McNally, A.; Verdin, K.; Harrison, L.; Getirana, A.; Jacob, J.; Shukla, S.; Arsenault, K.; Peters-Lidard, C.; Verdin, J.P. Acute Water-Scarcity Monitoring for Africa. Water 2019, 11, 1968. [Google Scholar] [CrossRef]
- Fuentes, I.; Fuster, R.; Avilés, D.; Vervoort, W. Water Scarcity in Central Chile: The Effect of Climate and Land Cover Changes on Hydrologic Resources. Hydrol. Sci. J. 2021, 66, 1028–1044. [Google Scholar] [CrossRef]
- Gao, T.; Wang, X.; Wei, D.; Wang, T.; Liu, S.; Zhang, Y. Transboundary Water Scarcity under Climate Change. J. Hydrol. 2021, 598, 126453. [Google Scholar] [CrossRef]
- Sheikh, V. Perception of Domestic Rainwater Harvesting by Iranian Citizens. Sustain. Cities Soc. 2020, 60, 102278. [Google Scholar] [CrossRef]
- Ranaee, E.; Abbasi, A.A.; Tabatabaee Yazdi, J.; Ziyaee, M. Feasibility of Rainwater Harvesting and Consumption in a Middle Eastern Semiarid Urban Area. Water 2021, 13, 2130. [Google Scholar] [CrossRef]
- Herrera-Franco, G.; Alvarado, J.; Gordillo, P.; Veintimilla, L.; Merchan-Sanmartín, B.; Carrión-Mero, P.; Berrezueta, E. Communication Methods on Water Care during the COVID-19 Pandemic and Its Impact on the Resilience of the Rural Community of “Libertador Bolívar”, Ecuador; WIT Press: Southampton, UK, 2021; pp. 109–118. [Google Scholar]
- Angelakis, A.N.; Koutsoyiannis, D.; Tchobanoglous, G. Urban Wastewater and Stormwater Technologies in Ancient Greece. Water Res. 2005, 39, 210–220. [Google Scholar] [CrossRef]
- Shuster, W.D.; Dadio, S.; Drohan, P.; Losco, R.; Shaffer, J. Residential Demolition and Its Impact on Vacant Lot Hydrology: Implications for the Management of Stormwater and Sewer System Overflows. Landsc. Urban Plan. 2014, 125, 48–56. [Google Scholar] [CrossRef]
- Shishegar, S.; Duchesne, S.; Pelletier, G. Optimization Methods Applied to Stormwater Management Problems: A Review. Urban Water J. 2018, 15, 276–286. [Google Scholar] [CrossRef]
- Gaafar, M.; Mahmoud, S.H.; Gan, T.Y.; Davies, E.G.R. A Practical GIS-Based Hazard Assessment Framework for Water Quality in Stormwater Systems. J. Clean. Prod. 2020, 245, 118855. [Google Scholar] [CrossRef]
- Hossain Anni, A.; Cohen, S.; Praskievicz, S. Sensitivity of Urban Flood Simulations to Stormwater Infrastructure and Soil Infiltration. J. Hydrol. 2020, 588, 125028. [Google Scholar] [CrossRef]
- Pierce, G.; Gmoser-Daskalakis, K.; Jessup, K.; Grant, S.B.; Mehring, A.; Winfrey, B.; Rippy, M.A.; Feldman, D.; Holden, P.; Ambrose, R.; et al. University Stormwater Management within Urban Environmental Regulatory Regimes: Barriers to Progressivity or Opportunities to Innovate? Environ. Manag. 2021, 67, 12–25. [Google Scholar] [CrossRef]
- Quichimbo-Miguitama, F.; Matamoros, D.; Jiménez, L.; Quichimbo-Miguitama, P. Influence of Low-Impact Development in Flood Control: A Case Study of the Febres Cordero Stormwater System of Guayaquil (Ecuador). Sustainability 2022, 14, 7109. [Google Scholar] [CrossRef]
- Sobieraj, J.; Bryx, M.; Metelski, D. Stormwater Management in the City of Warsaw: A Review and Evaluation of Technical Solutions and Strategies to Improve the Capacity of the Combined Sewer System. Water 2022, 14, 2109. [Google Scholar] [CrossRef]
- Merchan-Sanmartín, B.; Ullauri, P.; Amaya, F.; Dender, L.; Carrión-Mero, P.; Berrezueta, E. Desing of a Sewage and Wastewater Treatment System for Pollution Mitigation in El Rosario, El Empalme, Ecuador. WIT Trans. Ecol. Environ 2021, 251, 77–85. [Google Scholar]
- Merchán-Sanmartín, B.; Aguilar-Aguilar, M.; Morante-Carballo, F.; Carrión-Mero, P.; Guambaña-Palma, J.; Mestanza-Solano, D.; Berrezueta, E. Design of Sewerage System and Wastewater Treatment in a Rural Sector: A Case Study. Int. J. Sustain. Dev. Plan. 2022, 17, 51–61. [Google Scholar] [CrossRef]
- Che, W.; Zhao, Y.; Yang, Z.; Li, J.; Shi, M. Integral Stormwater Management Master Plan and Design in an Ecological Community. J. Environ. Sci. 2014, 26, 1818–1823. [Google Scholar] [CrossRef] [PubMed]
- Huang, Z.; Yu, H.; Peng, Z.; Zhao, M. Methods and Tools for Community Energy Planning: A Review. Renew. Sustain. Energy Rev. 2015, 42, 1335–1348. [Google Scholar] [CrossRef]
- Nie, L. Enhancing Urban Flood Resilience—A Case Study for Policy Implementation. Proc. Inst. Civ. Eng.—Water Manag. 2016, 169, 85–93. [Google Scholar] [CrossRef]
- Marques Arsénio, A.; Câmara Salim, I.; Hu, M.; Pedro Matsinhe, N.; Scheidegger, R.; Rietveld, L. Mitigation Potential of Sanitation Infrastructure on Groundwater Contamination by Nitrate in Maputo. Sustainability 2018, 10, 858. [Google Scholar] [CrossRef]
- ESPOL. Bosque Protector “La Prosperina”. Available online: http://www.bosqueprotector.espol.edu.ec/biodiversidad/ (accessed on 15 December 2022).
- Morante-Carballo, F.; Merchán-Sanmartín, B.; Cárdenas-Cruz, A.; Jaya-Montalvo, M.; Mata-Perelló, J.; Herrera-Franco, G.; Carrión-Mero, P. Sites of Geological Interest Assessment for Geoeducation Strategies, ESPOL University Campus, Guayaquil, Ecuador. Land 2022, 11, 771. [Google Scholar] [CrossRef]
- Merchán-Sanmartín, B.; Carrión-Mero, P.; Suárez-Zamora, S.; Aguilar-Aguilar, M.; Cruz-Cabrera, O.; Hidalgo-Calva, K.; Morante-Carballo, F. Sanitary Sewerage Master Plan for the Sustainable Use of Wastewater on a University Campus. Water 2022, 14, 2425. [Google Scholar] [CrossRef]
- Merchán-Sanmartín, B.; Carrión-Mero, P.; Suárez-Zamora, S.; Morante-Carballo, F.; Aguilar-Aguilar, M.; Cruz-Cabrera, O.; Hidalgo Calva, K. Drinking Water Master Plan for the Management of Water Resources on a University Campus. Sustain. Dev. Plan. XII 2022, 258, 27–38. [Google Scholar]
- UI. Greenmetric UI Greenmetric World University Ranking. Available online: https://greenmetric.ui.ac.id/rankings/ranking-by-region-2021/latin_america (accessed on 3 July 2022).
- Kirpich, Z.P. No TitleTime of Concentration of Small Agricultural Watersheds. Civ. Eng. J. 1940, 10, 362. [Google Scholar]
- California Division of Highways. California Culvert Practice, 2nd ed.; Calif. State Print: Sacramento, CA, USA, 1944. [Google Scholar]
- Guachamín, W.; Fernando, G.; Arteaga, M.; Cadena, J. Determinación de Ecuaciones Para El Cálculo de Intensidades Máximas de Precipitación; Quito, Ecuador, 2019. Available online: https://www.inamhi.gob.ec/Publicaciones/Hidrologia/ESTUDIO_DE_INTENSIDADES_V_FINAL.pdf (accessed on 22 February 2023).
- Chow, V.T.; Maidment, D.R.; Mays, L.W. Hidrología Aplicada; McGraw-Hill: New York, NY, USA, 1993. [Google Scholar]
- Kuichling, E. The Relation Between the Rainfall and the Discharge of Sewers in Populous Districts. Trans. Am. Soc. Civ. Eng. 1889, 20, 1–56. [Google Scholar] [CrossRef]
- Sotelo Ávila, G. Hidráulica de Canales, 1st ed.; Universidad Nacional Autónoma de Mexico: Mexico City, Mexico, 2002. [Google Scholar]
- INTERAGUA. Manual de Diseño de Redes de Alcantarillado; INTERAGUA: Guayaquil, Ecuador, 2015. [Google Scholar]
- Chow, V. Te Hidráulica de Canales Abiertos; McGraw-Hill: New York, NY, USA, 1994. [Google Scholar]
- Likert, R.A. Technique for the Measurement of Attitudes. Arch. Psychol. 1932, 140, 1–22. [Google Scholar]
- Instituto Ecuatoriano de Normalizacion. Norma Para Estudio y Diseño de Agua Potable y Disposicion de Agua Residuales Para Poblaciones Mayores a 1000 Habitantes; Instituto Ecuatoriano de Normalizacion: Quito, Ecuador, 1992. [Google Scholar]
- Dyson, R.G. Strategic Development and SWOT Analysis at the University of Warwick. Eur. J. Oper. Res. 2004, 152, 631–640. [Google Scholar] [CrossRef]
- Tian, L.; Shen, T. Evaluation of Plan Implementation in the Transitional China: A Case of Guangzhou City Master Plan. Cities 2011, 28, 11–27. [Google Scholar] [CrossRef]
- Gwenzi, W.; Nyamadzawo, G. Hydrological Impacts of Urbanization and Urban Roof Water Harvesting in Water-Limited Catchments: A Review. Environ. Process. 2014, 1, 573–593. [Google Scholar] [CrossRef]
- Li, C.; Liu, M.; Hu, Y.; Shi, T.; Qu, X.; Walter, M.T. Effects of Urbanization on Direct Runoff Characteristics in Urban Functional Zones. Sci. Total Environ. 2018, 643, 301–311. [Google Scholar] [CrossRef]
- Rahman, A.; Haddad, K.; Zaman, M.; Kuczera, G.; Weinmann, P.E. Design Flood Estimation in Ungauged Catchments: A Comparison Between the Probabilistic Rational Method and Quantile Regression Technique for NSW. Australas. J. Water Resour. 2011, 14, 127–139. [Google Scholar] [CrossRef]
- Mahmoud, W.H.; Elagib, N.A.; Gaese, H.; Heinrich, J. Rainfall Conditions and Rainwater Harvesting Potential in the Urban Area of Khartoum. Resour. Conserv. Recycl. 2014, 91, 89–99. [Google Scholar] [CrossRef]
- Wang, S.; Wang, H. Extending the Rational Method for Assessing and Developing Sustainable Urban Drainage Systems. Water Res. 2018, 144, 112–125. [Google Scholar] [CrossRef]
- Sadeghi, S.; Samani, J.M.V.; Samani, H.M.V. Risk and Damage-Based Optimal Design of Storm Sewer Networks Using Rational and Fully Dynamic Methods, a Case Study (Tehran Region 2). Water Sci. Technol. 2022, 85, 3419–3435. [Google Scholar] [CrossRef] [PubMed]
- Liu, W.; Feng, Q.; Deo, R.C.; Yao, L.; Wei, W. Experimental Study on the Rainfall-Runoff Responses of Typical Urban Surfaces and Two Green Infrastructures Using Scale-Based Models. Environ. Manag. 2020, 66, 683–693. [Google Scholar] [CrossRef]
- Zaharia, L.; Costache, R.; Prăvălie, R.; Ioana-Toroimac, G. Mapping Flood and Flooding Potential Indices: A Methodological Approach to Identifying Areas Susceptible to Flood and Flooding Risk. Case Study: The Prahova Catchment (Romania). Front. Earth Sci. 2017, 11, 229–247. [Google Scholar] [CrossRef]
- Idowu, D.; Zhou, W. Land Use and Land Cover Change Assessment in the Context of Flood Hazard in Lagos State, Nigeria. Water 2021, 13, 1105. [Google Scholar] [CrossRef]
- Park, C.; Han, S.; Lee, K.-W.; Lee, Y. Analyzing Drivers of Conflict in Energy Infrastructure Projects: Empirical Case Study of Natural Gas Pipeline Sectors. Sustainability 2017, 9, 2031. [Google Scholar] [CrossRef]
- Jamali, A.A.; Ghorbani Kalkhajeh, R. Spatial Modeling Considering Valley’s Shape and Rural Satisfaction in Check Dams Site Selection and Water Harvesting in the Watershed. Water Resour. Manag. 2020, 34, 3331–3344. [Google Scholar] [CrossRef]
- Muñoz-Arteaga, K.V.; Moreno-Indio, K.J.; Moreira-Soledispa, K.L.; Valero-Cedeño, N.J. Environmental Control of Metaxenic Diseases in Ecuador. Dominio las Ciencias 2021, 7, 967–982. [Google Scholar]
- Paredes Gómez, M.F.; Molina Estrella, M.E.; Cerón Carrera, M.P. Aluvión de Quito: Una Mirada Comunicacional Del Desastre. Tsafiqui-Rev. Científica Ciencias Soc. 2022, 12, 89–102. [Google Scholar] [CrossRef]
- Velez, R.; Calderon, D.; Carey, L.; Aime, C.; Hultquist, C.; Yetman, G.; Kruczkiewicz, A.; Gorokhovich, Y.; Chen, R.S. Advancing Data for Street-Level Flood Vulnerability: Evaluation of Variables Extracted from Google Street View in Quito, Ecuador. IEEE Open J. Comput. Soc. 2022, 3, 51–61. [Google Scholar] [CrossRef]
- Servicio Nacional de Gestión de Riesgos y Emergencias. Informe Nro. 011—Aluvión Quito; Servicio Nacional de Gestión de Riesgos y Emergencias: Quito, Ecuador, 2022. [Google Scholar]
- Bermeo Álvarez, S.A.; Andrango, L.; Cruz, M. Catástrofes En Ecuador: ¿Desastre Natural o Secuelas Del Crecimiento Urbano? Quito, Ecuador, 2022. Available online: https://repositorio.uce.edu.ec/archivos/aralvear/OA-CITYS/Noticias/PDFs/10_CATASTROFES_ECUADOR.pdf (accessed on 22 February 2023).
- Vargas, G.; Ortlieb, L.; Rutllant, J. Aluviones Históricos En Antofagasta y Su Relación Con Eventos El Niño/Oscilación Del Sur. Rev. Geol. Chile 2000, 27, 157–176. [Google Scholar]
- Valderrama, P.; Vilca, O. Dinámica e Implicancia Del Aluvión de La Laguna 513, Cordillera Blanca, Ancash, Perú. Rev. Asoc. Geológica Argent. 2012, 69, 400–406. [Google Scholar]
- Páez, M.S.; Moreiras, S.M.; Brenning, A.; Giambiagi, L. Flujos de Detritos y Aluviones Históricos En La Cuenca Del Río Blanco (32°55′–33°10′ y 69°10′–69°25′), Mendoza. Rev. Asoc. Geol. Argent. 2013, 70, 488–498. [Google Scholar]
- Fletcher, T.D.; Shuster, W.; Hunt, W.F.; Ashley, R.; Butler, D.; Arthur, S.; Trowsdale, S.; Barraud, S.; Semadeni-Davies, A.; Bertrand-Krajewski, J.-L.; et al. SUDS, LID, BMPs, WSUD and More—The Evolution and Application of Terminology Surrounding Urban Drainage. Urban Water J. 2015, 12, 525–542. [Google Scholar] [CrossRef]
- Ghofrani, Z.; Sposito, V.; Faggian, R. A Comprehensive Review of Blue-Green Infrastructure Concepts. Int. J. Environ. Sustain. 2017, 6, 15–36. [Google Scholar] [CrossRef]
- Tan, P.Y.; Zhang, J.; Masoudi, M.; Alemu, J.B.; Edwards, P.J.; Grêt-Regamey, A.; Richards, D.R.; Saunders, J.; Song, X.P.; Wong, L.W. A Conceptual Framework to Untangle the Concept of Urban Ecosystem Services. Landsc. Urban Plan. 2020, 200, 103837. [Google Scholar] [CrossRef]
- Nile, B.K.; Hassan, W.H.; Esmaeel, B.A. An Evaluation of Flood Mitigation Using a Storm Water Management Model [SWMM] in a Residential Area in Kerbala, Iraq. IOP Conf. Ser. Mater. Sci. Eng. 2018, 433, 012001. [Google Scholar] [CrossRef]
- Farahmand, H.; Dong, S.; Mostafavi, A. Network Analysis and Characterization of Vulnerability in Flood Control Infrastructure for System-Level Risk Reduction. Comput. Environ. Urban Syst. 2021, 89, 101663. [Google Scholar] [CrossRef]
- Nesshöver, C.; Assmuth, T.; Irvine, K.N.; Rusch, G.M.; Waylen, K.A.; Delbaere, B.; Haase, D.; Jones-Walters, L.; Keune, H.; Kovacs, E.; et al. The Science, Policy and Practice of Nature-Based Solutions: An Interdisciplinary Perspective. Sci. Total Environ. 2017, 579, 1215–1227. [Google Scholar] [CrossRef]
- Lafortezza, R.; Chen, J.; van den Bosch, C.K.; Randrup, T.B. Nature-Based Solutions for Resilient Landscapes and Cities. Environ. Res. 2018, 165, 431–441. [Google Scholar] [CrossRef]
- Zevenbergen, C.; Fu, D.; Pathirana, A. Transitioning to Sponge Cities: Challenges and Opportunities to Address Urban Water Problems in China. Water 2018, 10, 1230. [Google Scholar] [CrossRef]
- Lõhmus, M.; Balbus, J. Making Green Infrastructure Healthier Infrastructure. Infect. Ecol. Epidemiol. 2015, 5, 30082. [Google Scholar] [CrossRef]
- van den Bosch, M.; Nieuwenhuijsen, M. No Time to Lose—Green the Cities Now. Environ. Int. 2017, 99, 343–350. [Google Scholar] [CrossRef]
- Serra-Llobet, A.; Hermida, M.A. Opportunities for Green Infrastructure under Ecuador’s New Legal Framework. Landsc. Urban Plan. 2017, 159, 1–4. [Google Scholar] [CrossRef]
- Guevara, J. Análisis y Diseño de Sistema de Alcantarillado de Aguas Lluvias Para El Área de Ingenierías Del Campus Gustavo Galindo; Escuela Superior Politecnica del Litoral: Guayaquil, Ecuador, 2021. [Google Scholar]
- Seddon, N.; Chausson, A.; Berry, P.; Girardin, C.A.J.; Smith, A.; Turner, B. Understanding the Value and Limits of Nature-Based Solutions to Climate Change and Other Global Challenges. Philos. Trans. R. Soc. B Biol. Sci. 2020, 375, 20190120. [Google Scholar] [CrossRef]
- Seddon, N.; Smith, A.; Smith, P.; Key, I.; Chausson, A.; Girardin, C.; House, J.; Srivastava, S.; Turner, B. Getting the Message Right on Nature-based Solutions to Climate Change. Glob. Chang. Biol. 2021, 27, 1518–1546. [Google Scholar] [CrossRef] [PubMed]
- Faivre, N.; Fritz, M.; Freitas, T.; de Boissezon, B.; Vandewoestijne, S. Nature-Based Solutions in the EU: Innovating with Nature to Address Social, Economic and Environmental Challenges. Environ. Res. 2017, 159, 509–518. [Google Scholar] [CrossRef] [PubMed]
- Gómez Martín, E.; Giordano, R.; Pagano, A.; van der Keur, P.; Máñez Costa, M. Using a System Thinking Approach to Assess the Contribution of Nature Based Solutions to Sustainable Development Goals. Sci. Total Environ. 2020, 738, 139693. [Google Scholar] [CrossRef] [PubMed]


| Station | Time Intervals (Minutes) | Equations | R | R2 | |
|---|---|---|---|---|---|
| Code | Name | ||||
| M0056 | Guayaquil Airport | 5 < 30 | 0.9840 | 0.9683 | |
| 30 < 120 | 0.9944 | 0.9889 | |||
| 120 < 1440 | 0.9992 | 0.9984 | |||
| Surface Characteristics | Return Period (Years) | ||||||
|---|---|---|---|---|---|---|---|
| 2 | 5 | 10 | 25 | 50 | 100 | 1000 | |
| Developed areas | |||||||
| Asphalt | 0.73 | 0.77 | 0.81 | 0.86 | 0.90 | 0.95 | 1.00 |
| Concrete/roof | 0.75 | 0.80 | 0.83 | 0.88 | 0.92 | 0.97 | 1.00 |
| Green zones (gardens, parks, etc.) | |||||||
| Poor condition (less than 50 % grass cover of the area) | |||||||
| Plain, 0–2% | 0.32 | 0.34 | 0.37 | 0.40 | 0.44 | 0.47 | 0.58 |
| Average slope, 2–7% | 0.37 | 0.40 | 0.43 | 0.46 | 0.49 | 0.53 | 0.61 |
| Slope over 7% | 0.40 | 0.43 | 0.45 | 0.49 | 0.52 | 0.55 | 0.62 |
| Average condition (50% to 75% grass cover of area) | |||||||
| Plain, 0–2% | 0.25 | 0.28 | 0.30 | 0.34 | 0.37 | 0.41 | 0.53 |
| Average slope, 2–7% | 0.33 | 0.36 | 0.38 | 0.42 | 0.45 | 0.49 | 0.58 |
| Slope over 7% | 0.37 | 0.40 | 0.42 | 0.46 | 0.49 | 0.53 | 0.60 |
| Good condition (greater than 75% of the area covered with grass) | |||||||
| Plain, 0–2% | 0.21 | 0.23 | 0.25 | 0.29 | 0.32 | 0.36 | 0.49 |
| Average slope, 2–7% | 0.29 | 0.32 | 0.35 | 0.39 | 0.42 | 0.46 | 0.56 |
| Slope over 7% | 0.34 | 0.37 | 0.40 | 0.44 | 0.47 | 0.51 | 0.58 |
| Andeveloped areas | |||||||
| Crop areas | |||||||
| Plain, 0–2% | 0.31 | 0.34 | 0.36 | 0.40 | 0.43 | 0.47 | 0.57 |
| Average slope, 2–7% | 0.35 | 0.38 | 0.41 | 0.44 | 0.48 | 0.511 | 0.60 |
| Slope over 7% | 0.39 | 0.42 | 0.44 | 0.48 | 0.51 | 0.54 | 0.61 |
| Grasslands | |||||||
| Plain, 0–2% | 0.25 | 0.38 | 0.30 | 0.34 | 0.37 | 0.41 | 0.53 |
| Average slope, 2–7% | 0.33 | 0.36 | 0.38 | 0.42 | 0.45 | 0.49 | 0.58 |
| Slope over 7% | 0.37 | 0.40 | 0.42 | 0.46 | 0.49 | 0.53 | 0.60 |
| Forests | |||||||
| Plain, 0–2% | 0.22 | 0.25 | 0.28 | 0.31 | 0.35 | 0.39 | 0.48 |
| Average slope, 2–7% | 0.31 | 0.34 | 0.36 | 0.40 | 0.43 | 0.47 | 0.56 |
| Slope over 7% | 0.35 | 0.39 | 0.41 | 0.45 | 0.48 | 0.52 | 0.58 |
| Criteria | Parameters | Score |
|---|---|---|
| Technical considerations | Natural slope Location and area Preliminary studies | 1–5 |
| Social considerations | Sanitary emergency Population growth | |
| Economic considerations | Building costs Machinery and equipment costs Maintenance costs | |
| Environmental considerations | Impact on flora and fauna Affectation of protection areas Changing the natural course of water |
| Micro-Watershed | Area (ha) | Length (km) | Max. Elevation (m) | Min. Elevation (m) | Slope (S) | Height (m) |
|---|---|---|---|---|---|---|
| 1 | 35.15 | 0.76 | 87 | 80 | 0.01 | 7 |
| 2 | 8.60 | 0.26 | 81 | 79 | 0.01 | 2 |
| 3 | 12.26 | 0.36 | 90 | 81 | 0.03 | 9 |
| 4 | 138.80 | 2.11 | 350 | 70 | 0.13 | 280 |
| 5 | 56.13 | 0.80 | 79 | 66 | 0.02 | 13 |
| 6 | 110.29 | 1.57 | 70 | 35 | 0.02 | 35 |
| 7 | 49.86 | 1.16 | 190 | 92.5 | 0.08 | 97.5 |
| 8 | 27.94 | 0.69 | 120 | 87 | 0.05 | 33 |
| 9 | 118.35 | 2.01 | 90 | 40 | 0.02 | 50 |
| 10 | 72.78 | 0.97 | 210 | 90 | 0.12 | 120 |
| Total Area | 630.16 | 0 | 0 | 0 | 0 | |
| Micro-Watershed | Kirpich (min) | California (min) | Average Kirpich/California (min) |
|---|---|---|---|
| 1 | 19.44 | 19.47 | 19.46 |
| 2 | 9.25 | 9.26 | 9.26 |
| 3 | 7.39 | 7.40 | 7.40 |
| 4 | 15.39 | 15.41 | 15.40 |
| 5 | 16.46 | 16.48 | 16.47 |
| 6 | 24.42 | 24.44 | 24.43 |
| 7 | 11.53 | 11.55 | 11.54 |
| 8 | 9.61 | 9.63 | 9.62 |
| 9 | 28.28 | 28.31 | 28.29 |
| 10 | 8.69 | 8.71 | 8.70 |
| Micro-Watershed | 5 Years | 10 Years | 15 Years | 20 Years | 25 Years | 30 Years | 50 Years |
|---|---|---|---|---|---|---|---|
| 1 | 77.55 | 90.13 | 98.42 | 104.75 | 109.95 | 114.38 | 127.79 |
| 2 | 97.36 | 113.16 | 123.56 | 131.52 | 138.04 | 143.61 | 160.43 |
| 3 | 104.28 | 121.20 | 132.34 | 140.87 | 147.85 | 153.81 | 171.84 |
| 4 | 83.31 | 96.83 | 105.73 | 112.54 | 118.12 | 122.88 | 137.28 |
| 5 | 81.61 | 94.85 | 103.57 | 110.24 | 115.71 | 120.37 | 134.48 |
| 6 | 72.33 | 84.06 | 91.79 | 97.70 | 102.54 | 106.68 | 119.18 |
| 7 | 91.00 | 105.77 | 115.49 | 122.92 | 129.02 | 134.22 | 149.95 |
| 8 | 96.23 | 111.84 | 122.12 | 129.98 | 136.43 | 141.93 | 158.56 |
| 9 | 69.15 | 80.37 | 87.75 | 93.40 | 98.04 | 101.99 | 113.94 |
| 10 | 99.23 | 115.33 | 125.93 | 134.04 | 140.69 | 146.36 | 163.51 |
| Micro-Watershed | 5 Years | 10 Years | 15 Years | 20 Years | 25 Years | 30 Years | 50 Years |
|---|---|---|---|---|---|---|---|
| 1 | 0.40 | 0.43 | 0.44 | 0.45 | 0.46 | 0.47 | 0.49 |
| 2 | 0.80 | 0.83 | 0.85 | 0.86 | 0.88 | 0.90 | 0.92 |
| 3 | 0.80 | 0.83 | 0.85 | 0.86 | 0.88 | 0.90 | 0.92 |
| 4 | 0.39 | 0.41 | 0.42 | 0.44 | 0.45 | 0.47 | 0.48 |
| 5 | 0.36 | 0.38 | 0.39 | 0.41 | 0.42 | 0.44 | 0.45 |
| 6 | 0.34 | 0.36 | 0.37 | 0.39 | 0.40 | 0.42 | 0.43 |
| 7 | 0.34 | 0.36 | 0.37 | 0.39 | 0.40 | 0.42 | 0.43 |
| 8 | 0.36 | 0.38 | 0.39 | 0.41 | 0.42 | 0.44 | 0.45 |
| 9 | 0.39 | 0.41 | 0.42 | 0.43 | 0.45 | 0.47 | 0.48 |
| 10 | 0.39 | 0.41 | 0.42 | 0.43 | 0.45 | 0.47 | 0.48 |
| WDP * | Micro-Watershed | 5 Years | 10 Years | 15 Years | 20 Years | 25 Years | 30 Years | 50 Years |
|---|---|---|---|---|---|---|---|---|
| WDP1 | 1 | 0.51 | 0.64 | 0.72 | 0.78 | 0.84 | 0.89 | 1.03 |
| 2 | 0.32 | 0.38 | 0.42 | 0.46 | 0.49 | 0.52 | 0.60 | |
| 3 | 0.48 | 0.58 | 0.65 | 0.70 | 0.75 | 0.80 | 0.91 | |
| 4 | 2.12 | 2.59 | 2.9 | 3.23 | 3.47 | 3.77 | 4.30 | |
| 5 | 0.78 | 0.95 | 1.07 | 1.19 | 1.28 | 1.40 | 1.60 | |
| 7 | 0.73 | 0.89 | 1.00 | 1.12 | 1.21 | 1.32 | 1.51 | |
| 8 | 0.46 | 0.56 | 0.63 | 0.70 | 0.75 | 0.82 | 0.94 | |
| 10 | 1.33 | 1.62 | 1.81 | 1.97 | 2.17 | 2.36 | 2.69 | |
| Subtotal 1 | 6.73 | 8.21 | 9.20 | 10.15 | 10.96 | 11.88 | 13.58 | |
| WDP2 | 6 | 1.46 | 1.80 | 2.02 | 2.26 | 2.44 | 2.66 | 3.04 |
| 9 | 1.5 | 1.83 | 2.05 | 2.24 | 2.46 | 2.67 | 3.04 | |
| Subtotal 2 | 2.96 | 3.63 | 4.07 | 4.5 | 4.9 | 5.33 | 6.08 | |
| Total | 9.69 | 11.84 | 13.27 | 14.65 | 15.86 | 17.21 | 19.66 | |
| Trapezoidal Channel Analysis Point A | |||
|---|---|---|---|
| Return Period (Years) | Runoff (m3/s) | Capacity Current Q (m3/s) | Capacity Ratio (%) |
| 5 | 2.69 | 55.25 | 5% |
| 10 | 3.28 | 55.25 | 6% |
| 15 | 3.67 | 55.25 | 7% |
| 20 | 4.03 | 55.25 | 7% |
| 25 | 4.37 | 55.25 | 8% |
| 50 | 5.41 | 55.25 | 10% |
| Rectangular Channel Analysis Point B | |||
|---|---|---|---|
| Return Period (Years) | Runoff (m3/s) | Capacity Current Q (m3/s) | Capacity Ratio (%) |
| 5 | 6.71 | 12.33 | 54% |
| 10 | 8.21 | 12.33 | 67% |
| 15 | 9.20 | 12.33 | 75% |
| 20 | 10.15 | 12.33 | 82% |
| 25 | 10.96 | 12.33 | 89% |
| 50 | 13.58 | 12.33 | 110% |
| Rectangular Channel Analysis Point C | |||
|---|---|---|---|
| Return Period (Years) | Runoff (m3/s) | Capacity Current Q (m3/s) | Capacity Ratio (%) |
| 5 | 2.96 | 17.44 | 17% |
| 10 | 3.63 | 17.44 | 21% |
| 15 | 4.07 | 17.44 | 23% |
| 20 | 4.50 | 17.44 | 26% |
| 25 | 4.90 | 17.44 | 28% |
| 50 | 6.08 | 17.44 | 35% |
| Pipeline Analysis Point D | |||
|---|---|---|---|
| Return Period (Years) | Runoff (m3/s) | Capacity Current Q (m3/s) | Capacity Ratio (%) |
| 5 | 0.64 | 0.17 | 376% |
| 10 | 0.77 | 0.17 | 453% |
| 15 | 0.86 | 0.17 | 506% |
| 20 | 0.93 | 0.17 | 547% |
| 25 | 1.00 | 0.17 | 588% |
| Pluvial System | Scores | |
|---|---|---|
| Alternative 1 | Alternative 2 | |
| Technical considerations | ||
| Natural Slope | 4 | 4 |
| Location and area | 4 | 3 |
| Preliminary studies | 4 | 3 |
| Social considerations | ||
| Health Emergency | 3 | 3 |
| Population Growth | 4 | 4 |
| Economic considerations | ||
| Construction costs | 4 | 3 |
| Equipment and machinery costs | 3 | 3 |
| Maintenance costs | 3 | 3 |
| Environmental considerations | ||
| Impact on flora and fauna | 4 | 4 |
| Impact on protected areas | 4 | 5 |
| Change of natural watercourse | 3 | 3 |
| Total | 36 | 35 |
| Proposal 1: Trapezoidal Channel Design | ||||||||
|---|---|---|---|---|---|---|---|---|
| Return Period (Years) | Flow Point D Q (m3/s) | Sill (m) | Estimated Flow Depth (m) | Hydraulic Area (m2) | Perimeter (m) | Water Surface (m) | Velocity (m/s) | Range of Permissible Velocities (m/s) |
| 5 | 0.64 | 0.50 | 0.62 | 0.43 | 1.80 | 0.87 | 1.50 | |
| 10 | 0.77 | 0.50 | 0.70 | 0.49 | 1.95 | 0.92 | 1.56 | |
| 15 | 0.86 | 0.50 | 0.74 | 0.54 | 2.05 | 0.95 | 1.60 | 0.60–4.00 |
| 20 | 0.93 | 0.50 | 0.78 | 0.57 | 2.13 | 0.97 | 1.63 | |
| 25 | 1.00 | 0.50 | 0.81 | 0.60 | 2.20 | 0.99 | 1.65 | |
| Proposal 2: Concrete Pipe Design | |||||
|---|---|---|---|---|---|
| Return Period (Years) | Runoff Flow (m3/s) | Diameter Required (m) | Velocity (m/s) | Minimum Diameter (m) | Range of Permissible Velocities (m/s) |
| 5 | 0.64 | 0.88 | 1.50 | ||
| 10 | 0.77 | 0.97 | 1.50 | ||
| 15 | 0.86 | 1.03 | 1.50 | 0.25 | 0.75–5.00 |
| 20 | 0.93 | 1.06 | 1.50 | ||
| 25 | 1.00 | 1.10 | 1.50 | ||
| Internal Environment | Strengths | Weaknesses | |
| External Environment | 1. Green areas for rainwater filtration. 2. Academic and logistical support for the improvement and implementation of solutions. 3. Independent pluvial and sanitary system. 4. Drainage plans and delimited basins with sufficient capacity. 5. As-built plans of the storm sewer system. | 1. Lack of maintenance of the campus drainage system. 2. Natural habitat for vector proliferation. 3. Limited budget. 4. Lack of sufficient and trained personnel | |
| Opportunities | Strategies: Strengths + Opportunities | Strategies: Weaknesses + Opportunities | |
| a. Reuse rainwater for cleaning work on campus. b. Student learning in the development of degree thesis. c. Water sowing and harvesting through detention ponds (albarradas in Spanish). d. Recharge and replacement of water in ESPOL lakes. | 2.3.b. Development of grade and postgrad studies for the evaluating the pluvial system considering climatic and infrastructure variations. 2.c. Permanent training for grade and postgrad students oriented to WS&H as NBS for the using rainwater. 3.4.d. Stormwater conduction system implementation that guarantees the water recharge from artificial lakes considering infiltration problems. 2.a.d. Conduct periodic studies of the quality and quantity of lake water for conservation and management. | 1.4.a. Train personnel to maintain the pluvial system that guarantees the cleanliness and reuse of water. 2.a.b. Stormwater sewerage masterplan execution that solves flooding problems in the study area. 3.c.d. Design and implement WS&H techniques for storing and reusing stormwater as an ecological and economic solution. 3.b.c. Circular economy water project development with public and private interinstitutional collaboration for fundraising and NBS execution. | |
| Threats | Strategies: Strengths–Threats | Strategies: Weaknesses–Threats | |
| a. Health effects. b. Affectations to tangible goods and services. c. Climate emergency. d. Blockage of the drainage system due to the solid waste content | 1.a. Stormwater distribution systems implementation to infiltrate green areas that prevent flooding and proliferation of vectors. 4.b. Strategic planning for the construction of future buildings considering drainage areas. 2.3.c. Research projects execution for effective water reuse in the conservation of endangered species located in the environmental protection zone of the campus. | 1.2.a.b.d. Execute periodic maintenance and cleaning labours that prevent blocking of the pluvial system. 2.3.a.c. Environmental impact studies develop for future expansion projects. 3.c. Manage funds related to the climate emergency to strengthen the budget for sustainable water management. | |
Disclaimer/Publisher’s Note: The statements, opinions and data contained in all publications are solely those of the individual author(s) and contributor(s) and not of MDPI and/or the editor(s). MDPI and/or the editor(s) disclaim responsibility for any injury to people or property resulting from any ideas, methods, instructions or products referred to in the content. |
© 2023 by the authors. Licensee MDPI, Basel, Switzerland. This article is an open access article distributed under the terms and conditions of the Creative Commons Attribution (CC BY) license (https://creativecommons.org/licenses/by/4.0/).
Share and Cite
Merchán-Sanmartín, B.; Carrión-Mero, P.; Suárez-Zamora, S.; Aguilar-Aguilar, M.; Cruz-Cabrera, O.; Hidalgo-Calva, K.; Morante-Carballo, F. Stormwater Sewerage Masterplan for Flood Control Applied to a University Campus. Smart Cities 2023, 6, 1279-1302. https://doi.org/10.3390/smartcities6030062
Merchán-Sanmartín B, Carrión-Mero P, Suárez-Zamora S, Aguilar-Aguilar M, Cruz-Cabrera O, Hidalgo-Calva K, Morante-Carballo F. Stormwater Sewerage Masterplan for Flood Control Applied to a University Campus. Smart Cities. 2023; 6(3):1279-1302. https://doi.org/10.3390/smartcities6030062
Chicago/Turabian StyleMerchán-Sanmartín, Bethy, Paúl Carrión-Mero, Sebastián Suárez-Zamora, Maribel Aguilar-Aguilar, Omar Cruz-Cabrera, Katherine Hidalgo-Calva, and Fernando Morante-Carballo. 2023. "Stormwater Sewerage Masterplan for Flood Control Applied to a University Campus" Smart Cities 6, no. 3: 1279-1302. https://doi.org/10.3390/smartcities6030062